Labrador Gold is a Canadian-based mineral exploration company focused on the acquisition and exploration of prospective gold projects in Eastern Canada. The Company is advancing the Kingsway Gold Project, located in the Gander Gold District of Newfoundland. The project is strategically located contiguous to New Found Gold’s Queensway Project and lies along strike to the northeast of their recent discovery of 92.86g/t Au over 19.0 meters.
Vancouver, British Columbia–(Newsfile Corp. – April 20, 2022) – EMX Royalty Corporation (NYSE American: EMX) (TSXV: EMX) (FSE: 6E9) (“EMX”) is pleased to announce a strategic investment in Premium Nickel Resources Corporation (“PNR“), a private Canadian company advancing nickel-copper-cobalt and platinum group element (“PGE“) projects in Botswana. EMX owns 5,412,702 shares or 6.3% of the issued and outstanding shares of PNR, having recently purchased an additional one million shares as part of a US$17.5 million financing completed by PNR at US$2.00 per share.
PNR recently acquired the Selebi and Selebi North nickel-copper-cobalt mines and signed an asset purchase agreement to acquire the Selkirk nickel-copper-cobalt-PGE mine, which are located in Botswana’s prolific Selebi-Phikwe and Tati nickel mining districts, respectively (see Figure 1). The combined Selebi-Phikwe and Tati districts were a leading producer of nickel and copper from initial production in 1972 through closure of the mines at a time of low nickel prices in 2016. PNR intends to modernize and revitalize the mines it recently acquired and further evaluate the exploration potential within the project areas.
In addition to the recent asset acquisitions, in February PNR signed a non-binding letter of intent with North American Nickel Inc. (“NAN“) providing for a business combination of PNR and NAN which would be effected as a reverse takeover (“RTO“) (see NAN News Release dated February 17, 2022). The RTO will provide a public listing and near-term liquidity for PNR shareholders. NAN currently owns 8.9% of PNR, with a warrant to acquire an additional 15% of the equity in PNR (the “Warrant“). As a result of the RTO transaction, PNR shareholders will hold approximately 75% of the outstanding common shares of the resulting issuer, with NAN’s shareholders holding the remaining 25% and NAN’s Warrant would be extinguished. The RTO transaction is subject to shareholder and regulatory approvals1.
Selebi Phikwe District. The metamorphosed magmatic sulfide nickel-copper-cobalt deposits of the Selebi Phikwe District are located in the Limpopo Mobile Belt of northeastern Botswana. The deposits were discovered in the early 1960’s, with mining operations commencing in 1972 and continuing through 2016. Together with its concentrator and smelting facilities, the Selebi-Phikwe District became one of world’s premier nickel mining complexes in the 1970’s and 1980’s. Operational inefficiencies, issues with the smelting complex, and low nickel prices led to closure of the mines in 2016. The mines and mining complex were operated by BCL Limited (“BCL“) and were subject to a recent liquidation process.
Two of the principal mines in the district, Selebi and Selebi North, have been acquired by PNR (See NAN News Release dated February 10, 2022), both of which include substantial underground infrastructure (shafts, rail, power and water) and unmined historical resources. PNR is currently conducting exploration and engineering programs as part of a redevelopment plan that has been approved by the liquidators of BCL and the Botswana government.
Tati Mining District. The Tati Mining District is located 75 kilometers north of Selebi-Phikwe, near Francistown. Several mines occur in the district, including the Phoenix open pit nickel-copper mine and the nearby underground Selkirk nickel-copper-PGE mine. High grade nickel-copper-PGE mineralization was mined at Selkirk between 1989 and 2002 and direct shipped to the BCL Smelter at Selebi-Phikwe. A former owner of the Selkirk Mine, Norilsk Nickel Ltd, advanced the project to the feasibility stage and was preparing Selkirk as an open pit mining operation when it sold the mine to BCL in 2014.
Similar to the BCL assets at Selebi-Phikwe, assets of the Tati Nickel Mining Company were included in the recent liquidation process, which included the Selkirk Mine. PNR recently signed an asset purchase agreement with the liquidator to acquire the Selkirk Mine (see NAN News Release dated February 14, 2022) and has been conducting metallurgical tests and resampling of historical drill core.
PNR Activities at Selebi and Selkirk. The acquisition of the Selebi, Selebi North and Selkirk Mines by PNR followed an extensive period of evaluation, due diligence and data compilation and negotiations for acquisition of the assets. Proposed work by PNR at Selebi and Selebi North includes exploration drilling of prioritized geophysical targets, metallurgical and engineering studies, and upgrading of underground infrastructure. Proposed work at Selkirk will include continued metallurgical studies, exploration programs to update historical resources, and environmental studies.
Importantly, PNR is planning to design its own processing plant infrastructure and tailings facilities at Selebi and Selkirk which will be spatially and operationally independent of the historical concentrator plants and smelting facilities at Phikwe. Upon commencement of production, PNR intends to produce both copper concentrate and nickel-cobalt concentrate products for sale.
As a strategic shareholder, EMX has maintained an active dialog with the management team at PNR and has made site visits to the project areas. EMX looks forward to continuing its active relationship with the resultant issuer following completion of the RTO.
In recent years, EMX began seeking strategic investment and royalty generation opportunities in nickel and associated battery metal elements such as cobalt and PGE’s. EMX’s investment into PNR is another example of this approach and provides EMX with additional commodity diversification and exposure to the battery metals market.
Comments on nearby mines and deposits. The nearby mines and deposits discussed in this news release provide context for PNR’s assets, which occur in a similar geologic setting, but this is not necessarily indicative that the PNR properties will host similar mineralization.
Dr. Eric P. Jensen, CPG, a Qualified Person as defined by National Instrument 43-101 and employee of the Company, has reviewed, verified and approved the disclosure of the technical information contained in this news release.
About EMX. EMX is a precious, base and battery metals royalty company. EMX’s investors are provided with discovery, development, and commodity price optionality, while limiting exposure to risks inherent to operating companies. The Company’s common shares are listed on the NYSE American Exchange and the TSX Venture Exchange under the symbol EMX, and also trade on the Frankfurt exchange under the symbol “6E9”. Please see www.EMXroyalty.com for more information.
For further information contact:
David M. Cole President and Chief Executive Officer Phone: (303) 973-8585 Dave@EMXroyalty.com
Scott Close Director of Investor Relations Phone: (303) 973-8585 SClose@EMXroyalty.com
Neither the TSX Venture Exchange nor its Regulation Services Provider (as that term is defined in policies of the TSX Venture Exchange) accepts responsibility for the adequacy or accuracy of this release.
Forward-Looking Statements
This news release may contain “forward-looking statements” that reflect the Company’s current expectations and projections about its future results. These forward-looking statements may include statements regarding perceived merit of properties, exploration results and budgets, mineral reserve and resource estimates, work programs, capital expenditures, timelines, strategic plans, market prices for precious and base metal, or other statements that are not statements of fact. When used in this news release, words such as “estimate,” “intend,” “expect,” “anticipate,” “will”, “believe”, “potential” and similar expressions are intended to identify forward-looking statements, which, by their very nature, are not guarantees of the Company’s future operational or financial performance, and are subject to risks and uncertainties and other factors that could cause the Company’s actual results, performance, prospects or opportunities to differ materially from those expressed in, or implied by, these forward-looking statements. These risks, uncertainties and factors may include, but are not limited to: unavailability of financing, failure to identify commercially viable mineral reserves, fluctuations in the market valuation for commodities, difficulties in obtaining required approvals for the development of a mineral project, increased regulatory compliance costs, expectations of project funding by joint venture partners and other factors.
Readers are cautioned not to place undue reliance on these forward-looking statements, which speak only as of the date of this news release or as of the date otherwise specifically indicated herein. Due to risks and uncertainties, including the risks and uncertainties identified in this news release, and other risk factors and forward-looking statements listed in the Company’s MD&A for the year ended December 31, 2021 (the “MD&A”), and the most recently filed Revised Annual Information Form (the “AIF”) for the year ended December 31, 2021, actual events may differ materially from current expectations. More information about the Company, including the MD&A, the AIF and financial statements of the Company, is available on SEDAR at www.sedar.com and on the SEC’s EDGAR website at www.sec.gov.
Figure 1. Location map for the Selebi-Phikwe and Tati Mining Districts in Botswana.
1 Investors are cautioned that there can be no definitive assurances that the RTO transaction will be approved and closed, or that the indicative terms specified by PNR and NAN will ultimately be adopted.
Vancouver, British Columbia–(Newsfile Corp. – April 19, 2022) – Goldshore Resources Inc. (TSXV: GSHR) (OTCQB: GSHRF) (FSE: 8X00) (“Goldshore” or the “Company“), is pleased to announce assay results from its ongoing 100,000-meter drill program at the Moss Lake Project in Northwest Ontario, Canada. Drilling is aiming to better define and expand high-grade structural zones within the Moss Lake deposit in an attempt to improve the overall grade and volume beyond that of the historic Mineral Resource.
Key Highlights
Drilling of the Main Zone has expanded the zone and provided better definition for high grade corridors: Drilling within the Main Zone has continuity to improve the continuity and volume of high grade zones within the Main Zone. Highlight intercepts include:
13.0m @ 1.25 g/t Au from 192.0m in MMD-22-011
29.75m @ 1.03 g/t Au from 33.0m in MMD-22-012A
13.0m @ 1.02 g/t Au from 238.0m in MMD-22-013
Parallel structures intersected on every section: Drilling continues to intersect new mineralized structures parallel to the main body of mineralization, within a 100 metre corridor along the northern hanging wall side of the Main Zone (see Plan View Figure 4).
Visible gold found in unsampled section of historic drillholes: Sampling of previously unsampled drill core has found visible gold confirming the Company’s belief that historic exploration missed parallel zones of mineralization. All assays from historic core remain pending.
West edge of the Main Zone defined: Drill holes MMD-21-010, MMD-22-011 and MMD-22-012A intersected a major post-mineralization structure that cuts the western edge of the Main Zone and most likely offsets mineralization to the south where it is reflected by the previously drilled Southwest Zone (See Figure 4).
Brett Richards, President and Chief Executive Officer of Goldshore commented: “Once again, we are pleased to illustrate recent drill results from the Moss Lake Gold Project Inc., highlighting continued mineralization on the periphery of the historic resource in the main zone. Referring back to the high grade feeder system identified from the March 2, 2022 press release News: Goldshore Drills 6.3 g/t Au over 58.85m at Moss Lake (goldshoreresources.com) as well as the release on the VTEM geophysical survey indicating 29 new targets Technical Analysis: Goldshore’s VTEM Results Greatly Expand the Prospectivity (goldshoreresources.com), the consistency of the mineralization continues to illustrate the size and scale of the Moss Lake Project. The ongoing drilling is increasing our confidence in the extent and size of the high grade corridors within the main zone deposit to be incorporated into future resource updates and possible benefits to future mining. Additionally, the limited outside of the main zone has identified several potential parallel zones that remain open along strike and down dip and remain one of the focuses for this campaign. Also, the visible gold we are seeing in the historic core is a great indication of higher grade areas that will guide us towards a greater understanding of the geological controls in this system”.
Results have been received for drill holes MMD-21-010, MMD-22-011 and –012A evaluating the western margin to the Main Zone and holes MMD-22-013 and -015 testing the southern margin of the Main Zone. Significant drill intercepts are summarized in Tables 1 and 2, respectively, shown in Figures 1-3 as drill sections. Table 3 and Figure 4 show the location of the drill holes.
Figure 1: Drill section through MMD-22-011 showing mineralized intercepts relative to the 2013 grade model
Table 1: Significant downhole gold intercepts along western margin of Main Zone
HOLE ID
FROM
TO
HOLE LENGTH (m)
TRUE WIDTH (m)
CUT GRADE (g/t Au)
UNCUT GRADE (g/t Au)
MMD-21-010
38.15
42.00
3.85
2
0.34
0.34
MMD-22-011
163.00
166.10
3.10
1
0.54
0.54
190.45
231.35
40.90
19
0.54
0.54
including
192.00
205.00
13.00
6
1.25
1.25
395.20
429.00
33.80
16
0.51
0.51
502.00
508.00
6.00
3
0.42
0.42
525.00
537.55
12.55
6
0.31
0.31
548.45
596.75
48.30
23
0.34
0.34
including
560.00
562.55
2.55
1
1.59
1.59
621.50
625.40
3.90
2
0.31
0.31
661.00
664.00
3.00
2
0.54
0.54
723.25
726.00
2.75
1
0.85
0.85
758.00
760.20
2.20
1
0.61
0.61
777.70
780.90
3.20
2
0.43
0.43
794.00
825.00
31.00
16
1.07
1.07
including
795.00
807.00
12.00
6
2.18
2.18
MMD-22-012A
150.00
152.00
2.00
2
0.65
0.65
296.00
298.00
2.00
2
0.39
0.39
329.65
336.00
6.35
5
0.49
0.49
352.00
358.95
6.95
6
1.98
1.98
including
358.55
358.95
0.40
0
28.8
28.8
377.85
382.00
4.15
3
0.73
0.73
410.00
412.00
2.00
2
0.54
0.54
474.00
484.50
10.50
9
0.41
0.41
including
479.00
481.00
2.00
2
1.11
1.11
Intersections calculated above a 0.3 g/t Au cut off with a top cut of 30 g/t Au and a maximum internal waste interval of 10 metres. Bordered intervals are intersections calculated above a 1.0 g/t Au cut off. Intervals in bold are those with a grade thickness factor exceeding 20 gram x metres / tonne gold. True widths are approximate and assume a subvertical body.
Table 2: Significant downhole gold intercepts along southern margin of Main Zone
HOLE ID
FROM
TO
HOLE LENGTH (m)
TRUE WIDTH (m)
CUT GRADE (g/t Au)
UNCUT GRADE (g/t Au)
MMD-22-013
33.00
62.75
29.75
21
1.03
1.03
including
48.00
62.75
14.75
11
1.71
1.71
75.00
88.00
13.00
9
0.35
0.35
92.00
116.00
24.00
17
0.76
0.76
including
98.00
98.40
0.40
9
29.6
29.6
126.65
198.80
72.15
53
0.37
0.37
216.00
259.00
43.00
32
0.54
0.54
including
225.80
227.80
2.00
1
1.50
1.50
and
238.00
251.00
13.00
10
1.02
1.02
333.00
337.00
4.00
3
0.42
0.42
421.40
454.65
33.25
26
0.32
0.32
463.00
481.65
18.65
15
0.32
0.32
including
470.00
473.00
3.00
2
1.22
1.22
509.00
511.00
2.00
2
0.37
0.37
MMD-22-015
31.00
36.00
5.00
4
0.40
0.40
59.00
84.00
25.00
19
0.67
0.67
including
61.00
63.00
2.00
2
1.94
1.94
and
78.00
80.50
2.50
2
1.29
1.29
99.20
149.00
49.80
38
0.35
0.35
including
105.40
108.50
3.10
2
1.46
1.46
160.00
179.90
19.90
15
0.81
0.81
including
160.00
167.00
7.00
5
1.47
1.47
223.00
225.00
2.00
2
0.45
0.45
340.70
344.80
4.10
3
0.77
0.77
446.50
458.00
11.50
9
0.40
0.40
482.00
484.00
2.00
2
0.55
0.55
491.95
494.00
2.05
2
0.45
0.45
530.65
534.90
4.25
4
1.11
1.11
Intersections calculated above a 0.3 g/t Au cut off with a top cut of 30 g/t Au and a maximum internal waste interval of 10 metres. Bordered intervals are intersections calculated above a 1.0 g/t Au cut off. Intervals in bold are those with a grade thickness factor exceeding 20 gram x metres / tonne gold. True widths are approximate and assume a subvertical body.
Table 3: Location of drillholes
HOLE
EAST
NORTH
RL
AZIMUTH
DIP
EOH
MMD-21-010
668357
5378845
437
135
-45
501,0m
MMD-22-011
668659
5379089
428
155
-65
840.0m
MMD-22-012A
668453
5378938
429
135
-45
497.0m
MMD-22-013
669013
5379180
427
155
-45
513.0m
MMD-22-015
669128
5379246
427
155
-45
551.95m
Approximate collar coordinates in NAD 83, Zone 15N
MMD-21-010 and MMD-22-012A drilled the western extension of the Main Zone. MMD-22-012A is a redrill of MMD-22-012 that was lost in overburden. MMD-22-011 drilled at -65° beneath MMD-21-006 (reported on January 28, 2022) and skirted the northwestern margin of the mineralization model estimated by InnovExplor in 2013.
All three holes intersected zones of altered and mineralized diorite with local zones of higher grade (e.g., 0.4m @ 28.8 g/t Au from 358.55m in MMD-22-012A), showing that the mineralized system continues. MMD-22-011 intersected mineralized diorite to a greater depth than the InnovExplor 2013 model, as well as the now familiar parallel high grade structure to the south of the Main Zone (31.0m @ 1.07 g/t Au from 794m depth). While this intersection is deep, the structure almost certainly extends to surface as is indicated by drilling on parallel sections.
The drillholes are notable for intersecting a major post-mineralization fault zone that shaves the western edge of the Main Zone and most likely offsets mineralization to the south where it is reflected by the previously drilled Southwest Zone.
MMD-22-013 and MMD-22-015 were drilled at -45° along the southern margin of the Main Zone. MMD-22-013 was drilled above MMD-21-008 (reported on March 2, 2022), which returned several high grade intercepts.
Both holes intersected strongly altered diorite with low grade gold mineralization sandwiched between the variably altered volcaniclastic wallrock sequence. They also intersected the parallel structural zone to the south of the Main Zone. Local high grades were also intersected (e.g., 0.4m @ 29.6 g/t Au from 98.0m in MMD-22-013).
Goldshore has been logging historic core throughout this campaign to maximise the value of the historic drill core. As part of this program, the team has commenced resampling sections of historic core that were not sampled in the past. This has been driven by the recognition of additional zones of mineralization that were previously ignored.
Recently, the team discovered visible gold in quartz-pyrite veinlets in drillhole NS-92-247 at 546.9 meters depth (Figure 5). This highlights the potential for high grades in previously unrecognized zones parallel to the main targets. In this case, it is a parallel structure along the northern edge of the QES Zone.
Figure 5: Visible gold in quartz-pyrite veinlet in NS-92-247
Peter Flindell, VP Exploration commented: “These assay results come from our pre-winter drilling programme, which largely tested the margins of the main zone. Drilling continues to show the continuity of mineralization within the main zone and the existence of mineralization in a southern parallel zone, which we hope points to a larger mineralized volume and potentially a much bigger project.”
Analytical and QA/QC Procedures
All samples were sent to ALS Geochemistry in Thunder Bay for preparation and analysis was performed in the ALS Vancouver analytical facility. ALS is accredited by the Standards Council of Canada (SCC) for the Accreditation of Mineral Analysis Testing Laboratories and CAN-P-4E ISO/IEC 17025. Samples were analyzed for gold via fire assay with an AA finish (“Au-AA23”) and 48 pathfinder elements via ICP-MS after four-acid digestion (“ME-MS61”). Samples that assayed over 10 ppm Au were re-run via fire assay with a gravimetric finish (“Au-GRA21”).
In addition to ALS quality assurance / quality control (“QA/QC”) protocols, Goldshore has implemented a quality control program for all samples collected through the drilling program. The quality control program was designed by a qualified and independent third party, with a focus on the quality of analytical results for gold. Analytical results are received, imported to our secure on-line database and evaluated to meet our established guidelines to ensure that all sample batches pass industry best practice for analytical quality control. Certified reference materials are considered acceptable if values returned are within three standard deviations of the certified value reported by the manufacture of the material. In addition to the certified reference material, certified blank material is included in the sample stream to monitor contamination during sample preparation. Blank material results are assessed based on the returned gold result being less than ten times the quoted lower detection limit of the analytical method. The results of the on-going analytical quality control program are evaluated and reported to Goldshore by Orix Geoscience Inc.
About Goldshore
Goldshore is an emerging junior gold development company, and owns the Moss Lake Gold Project located in Ontario. Wesdome Gold Mines Ltd. is currently a strategic shareholder of Goldshore with an approximate 22% equity position in the Company. Well-financed and supported by an industry-leading management group, board of directors and advisory board, Goldshore is positioned to advance the Moss Lake Gold Project through the next stages of exploration and development.
About the Moss Lake Gold Project
The Moss Lake Gold Project is located approximately 100 km west of the city of Thunder Bay, Ontario. It is accessed via Highway 11 which passes within 1 km of the property boundary to the north. The Moss Lake Gold Project covers 14,292 hectares and consists of 282 unpatented and patented mining claims.
Moss Lake hosts a number of gold and base metal rich deposits including the Moss Lake Deposit, the East Coldstream Deposit (Table 4), the historically producing North Coldstream Mine (Table 5), and the Hamlin Zone, all of which occur over a mineralized trend exceeding 20 km in length. A historical preliminary economic assessment was completed on Moss Lake in 2013 and published by Moss Lake Gold1. A historical mineral resource estimate was completed on the East Coldstream Deposit in 2011 by Foundation Resources Inc2,3. In addition to these zones, the Moss Lake Gold Project also hosts a number of under-explored mineral occurrences which are reported to exist both at surface and in historically drilled holes. The Moss Lake Deposit is a shear-hosted disseminated-style gold deposit which outcrops at surface. It has been drilled over a 2.5 km length and to depths of 300 m with 376 holes completed between 1983 and 2017. The last drilling program conducted in 2016 and 2017 by Wesdome Gold Mines Ltd. (“Wesdome“), which consisted of widely spaced holes along the strike extension of the deposit was successful in expanding the mineralized footprint and hydrothermal system 1.6 km to the northeast. Additionally, the deposit remains largely open to depth. In 2017, Wesdome completed an induced polarization survey which traced the potential extensions of pyrite mineralization associated with the Moss Lake Deposit over a total strike length of 8 km and spanning the entire extent of the survey grids.
The East Coldstream Deposit is a shear-hosted disseminated-style gold deposit which locally outcrops at surface. It has been drilled over a 1.3 km length and to depths of 200 m with 138 holes completed between 1988 and 2017. The deposit remains largely open at depth and may have the potential for expansion along strike. Historic drill hole highlights from the East Coldstream Deposit include 4.86 g/t Au over 27.3 m in C-10-15.
The historically producing North Coldstream Mine is reported to have produced significant amounts of copper, gold and silver4 from mineralization with potential iron-oxide-copper-gold deposit style affinity. The exploration potential immediately surrounding the historic mining area is not currently well understood and historic data compilation is required.
The Hamlin Zone is a significant occurrence of copper and gold mineralization, and also of potential iron-oxide-copper-gold deposit style affinity. Between 2008 and 2011, Glencore tested Hamlin with 24 drill holes which successfully outlined a broad and intermittently mineralized zone over a strike length of 900 m. Historic drill hole highlights from the Hamlin Zone include 0.9 g/t Au and 0.35% Cu over 150.7 m in HAM-11-75.
The Moss Lake, East Coldstream and North Coldstream deposits sit on a mineral trend marked by a regionally significant deformation zone locally referred to as the Wawiag Fault Zone in the area of the Moss Lake Deposit. This deformation zone occurs over a length of approximately 20 km on the Moss Lake Gold Project and there is an area spanning approximately 7 km between the Moss Lake and East Coldstream deposits that is significantly underexplored.
Table 4: Historical Mineral Resources1,2,3
INDICATED
INFERRED
Deposit
Tonnes
Au g/t
Au oz
Tonnes
Au g/t
Au oz
Moss Lake Deposit1 (2013 resource estimate)
Open Pit Potential
39,795,000
1.1
1,377,300
48,904,000
1.0
1,616,300
Underground Potential
–
–
–
1,461,100
2.9
135,400
Moss Lake Total
39,795,000
1.1
1,377,300
50,364,000
1.1
1,751,600
East Coldstream Deposit2 (2011 resource estimate)
East Coldstream Total
3,516,700
0.85
96,400
30,533,000
0.78
763,276
Combined Total
43,311,700
1.08
1,473,700
80,897,000
0.98
2,514,876
Notes: (1) Source: Poirier, S., Patrick, G.A., Richard, P.L., and Palich, J., 2013. Technical Report and Preliminary Economic Assessment for the Moss Lake Project, 43-101 technical report prepared for Moss Lake Gold Mines Ltd. Moss Lake Deposit resource estimate is based on 0.5 g/t Au cut-off grade for open pit and 2.0 g/t Au cut-off grade for underground resources.
(2) Source: McCracken, T., 2011. Technical Report and Resource Estimate on the Osmani Gold Deposit, Coldstream Property, Northwestern Ontario, 43-101 technical report prepared for Foundation Resources Inc. and Alto Ventures Ltd. East Coldstream Deposit resource estimate is based on a 0.4 g/t Au cut-off grade.
(3) The reader is cautioned that the above referenced “historical mineral resource” estimates are considered historical in nature and as such is based on prior data and reports prepared by previous property owners. A qualified person has not done sufficient work to classify the historical estimates as current resources and Goldshore is not treating the historical estimates as current resources. Significant data compilation, re-drilling, re-sampling and data verification may be required by a qualified person before the historical estimate on the Moss Lake Gold Project can be classified as a current resource. There can be no assurance that any of the historical mineral resources, in whole or in part, will ever become economically viable. In addition, mineral resources are not mineral reserves and do not have demonstrated economic viability. Even if classified as a current resource, there is no certainty as to whether further exploration will result in any inferred mineral resources being upgraded to an indicated or measured mineral resource category.
Table 5: Reported Historical Production from the North Coldstream Deposit4
Deposit
Tonnes
Cu %
Au g/t
Ag
Cu lbs
Au oz
Ag oz
Historical Production
2,700,0000
1.89
0.56
5.59
102,000,000
44,000
440,000
Note:: (4) Source: Schlanka, R., 1969. Copper, Nickel, Lead and Zinc Deposits of Ontario, Mineral Resources Circular No. 12, Ontario Geological Survey, pp. 314-316.
Peter Flindell, MAusIMM, MAIG, Vice President – Exploration of the Company, a qualified person under NI 43-101 has approved the scientific and technical information contained in this news release.
Neither the TSXV nor its Regulation Services Provider (as that term is defined in the policies of the TSXV) accepts responsibility for the adequacy or accuracy of this release.
For More Information – Please Contact:
Brett A. Richards President, Chief Executive Officer and Director Goldshore Resources Inc.
This news release contains statements that constitute “forward-looking statements.” Such forward looking statements involve known and unknown risks, uncertainties and other factors that may cause the Company’s actual results, performance or achievements, or developments to differ materially from the anticipated results, performance or achievements expressed or implied by such forward-looking statements. Forward looking statements are statements that are not historical facts and are generally, but not always, identified by the words “expects,” “plans,” “anticipates,” “believes,” “intends,” “estimates,” “projects,” “potential” and similar expressions, or that events or conditions “will,” “would,” “may,” “could” or “should” occur.
Forward-looking statements in this news release include, among others, statements relating to expectations regarding the exploration and development of the Moss Lake Gold Project, including planned drilling activities, an update to the historical preliminary economic assessment, and other statements that are not historical facts. By their nature, forward-looking statements involve known and unknown risks, uncertainties and other factors which may cause our actual results, performance or achievements, or other future events, to be materially different from any future results, performance or achievements expressed or implied by such forward-looking statements. Such factors and risks include, among others: the Company may require additional financing from time to time in order to continue its operations which may not be available when needed or on acceptable terms and conditions acceptable; compliance with extensive government regulation; domestic and foreign laws and regulations could adversely affect the Company’s business and results of operations; the stock markets have experienced volatility that often has been unrelated to the performance of companies and these fluctuations may adversely affect the price of the Company’s securities, regardless of its operating performance; and the impact of COVID-19.
The forward-looking information contained in this news release represents the expectations of the Company as of the date of this news release and, accordingly, is subject to change after such date. Readers should not place undue importance on forward-looking information and should not rely upon this information as of any other date. The Company undertakes no obligation to update these forward-looking statements in the event that management’s beliefs, estimates or opinions, or other factors, should change.
This news release does not constitute an offer to sell, or a solicitation of an offer to buy, any securities in the United States. The securities have not been and will not be registered under the United States Securities Act of 1933, as amended (the “U.S. Securities Act”) or any state securities laws and may not be offered or sold within the United States or to U.S. Persons unless registered under the U.S. Securities Act and applicable state securities laws or an exemption from such registration is available.
Hole K-22-157 intersected 3.53 g/t Au over 6 metres from 37 metres including 5.71 g/t Au over 3 metres in altered and sulphidised gabbro.
The mineralization was intersected in just the third diamond drill hole at the Midway target.
Midway lies between the Appleton Fault Zone and the Dog Bay Line, approximately 2.7km North of Big Vein and 1.4km southwest of the Cracker gold occurrence.
The new discovery at Midway, along strike from the Cracker gold occurrence, opens up a potential second gold mineralized system subparallel to the Appleton Fault Zone.
TORONTO, April 19, 2022 (GLOBE NEWSWIRE) — Labrador Gold Corp. (TSX.V:LAB | OTCQX:NKOSF | FNR: 2N6) (“LabGold” or the “Company”) is pleased to announce a new discovery of near surface gold mineralization from diamond drilling at the Midway target at its 100% controlled Kingsway project near Gander, Newfoundland. This hole was drilled as part of the Company’s ongoing 100,000 metre drill program and represents a new target for gold at Kingsway.
Hole K-22-157 was drilled to test anomalous gold values at the Midway target and intersected 3.53 g/t Au over 6 metres from 37 metres including 5.71 g/t Au over 3 metres. Midway lies between the Appleton Fault Zone and the Dog Bay Line, two major structures in the region, approximately 2.7km north of Big Vein and represents a different mineralized system. The gold mineralization was intersected in just the third diamond drill hole at Midway. The mineralization is hosted by a strongly altered and sulphidised gabbro that intruded the siltstone and sandstone. Higher gold grades are associated with increased pyrite and arsenopyrite abundance and strong potassic feldspar, carbonate and silica alteration.
“The gold mineralization intersected at Midway represents a different style of mineralization than what we see at Big Vein. It is similar to that found at the Cracker gold occurrence approximately 1.4 kilometres northeast of Midway,“ said Roger Moss, President and CEO of the Company. “This new discovery at Midway, in addition to the gold mineralization at Cracker, opens up a potential second mineralized system at Kingsway. We know that gabbroic intrusions occur intermittently along strike to the northeast and southwest of Cracker and Midway and believe that these intrusions have come up along a structure subparallel to the Dog Bay Line and the Appleton Fault Zone. While our main focus remains generating and drilling targets along the Appleton Fault Zone, we will continue to investigate the potential of the gabbro hosted gold mineralization on the property.”
Hole ID
From (m)
To (m)
Interval (m)
Au (g/t)
K-22-157
37
43
6
3.53
including
40
43
3
5.71
Table 1. Summary of Assay Results All intersections are downhole length as there is insufficient Information to calculate true width.
Gold mineralization at both Midway and Cracker is hosted by altered gabbro. Quartz-carbonate alteration is present in both cases, with K-feldspar alteration also prominent at Midway. Disseminated pyrite and arsenopyrite are also associated with the gold mineralization. Historical grab samples from the Cracker occurrence include assays of 61.73 g/t, 33.87 g/t and 16.4 g/t Au. It is believed that these gold occurrences represent the presence of a fertile structure developed by the rheological contrast between the gabbro and the sediments forming the country rock. (Note that grab samples are select samples and are not necessarily representative of gold mineralization found on the property).
Gabbroic intrusions are known to occur along strike to the northeast and southwest of the Cracker and Midway occurrences and extend intermittently across the entire property, a distance of approximately 21 kilometres. Samples from some of these gabbros have returned anomalous gold mineralization suggesting the potential for an extensive mineralized system subparallel to the Appleton Fault Zone and the Dog Bay Line.
QA/QC
True widths of the reported intersections have yet to be calculated. Assays are uncut. Samples of HQ split core are securely stored prior to shipping to Eastern Analytical Laboratory in Springdale, Newfoundland for assay. Eastern Analytical is an ISO/IEC17025 accredited laboratory. Samples are routinely analyzed for gold by standard 30g fire assay with atomic absorption finish as well as by ICP-OES for an additional 34 elements. Samples containing visible gold are assayed by metallic screen/fire assay, as are any samples with fire assay results greater than 1g/t Au. The company submits blanks and certified reference standards at a rate of approximately 5% of the total samples in each batch.
Qualified Person
Roger Moss, PhD., P.Geo., President and CEO of LabGold, a Qualified Person in accordance with Canadian regulatory requirements as set out in NI 43-101, has read and approved the scientific and technical information that forms the basis for the disclosure contained in this release.
The Company gratefully acknowledges the Newfoundland and Labrador Ministry of Natural Resources’ Junior Exploration Assistance (JEA) Program for its financial support for exploration of the Kingsway property.
About Labrador Gold Labrador Gold is a Canadian based mineral exploration company focused on the acquisition and exploration of prospective gold projects in Eastern Canada.
In early 2020, Labrador Gold acquired the option to earn a 100% interest in the Kingsway project in the Gander area of Newfoundland. The three licenses comprising the Kingsway project cover approximately 12km of the Appleton Fault Zone which is associated with gold occurrences in the region, including those of New Found Gold immediately to the south of Kingsway. Infrastructure in the area is excellent located just 18km from the town of Gander with road access to the project, nearby electricity and abundant local water. LabGold is drilling a projected 50,000 metres targeting high-grade epizonal gold mineralization along the Appleton Fault Zone following encouraging early results. The Company has approximately $28 million in working capital and is well funded to carry out the planned program.
The Hopedale property covers much of the Florence Lake greenstone belts that stretches over 60 km. The belt is typical of greenstone belts around the world but has been underexplored by comparison. Work to date by Labrador Gold show gold anomalies in rocks, soils and lake sediments over a 3 kilometre section of the northern portion of the Florence Lake greenstone belt in the vicinity of the known Thurber Dog gold showing where grab samples assayed up to 7.8g/t gold. In addition, anomalous gold in soil and lake sediment samples occur over approximately 40 km along the southern section of the greenstone belt (see news release dated January 25th 2018 for more details). Labrador Gold now controls approximately 40km strike length of the Florence Lake Greenstone Belt.
The Company has 155,589,526 common shares issued and outstanding and trades on the TSX Venture Exchange under the symbol LAB.
For more information please contact:
Roger Moss, President and CEO Tel: 416-704-8291
Or visit our website at: www.labradorgold.com
Twitter: @LabGoldCorp
Neither TSX Venture Exchange nor its Regulation Services Provider (as that term is defined in policies of the TSX Venture Exchange) accepts responsibility for the adequacy or accuracy of this release.
Forward-Looking Statements: This news release contains forward-looking statements that involve risks and uncertainties, which may cause actual results to differ materially from the statements made. When used in this document, the words “may”, “would”, “could”, “will”, “intend”, “plan”, “anticipate”, “believe”, “estimate”, “expect” and similar expressions are intended to identify forward-looking statements. Such statements reflect our current views with respect to future events and are subject to risks and uncertainties. Many factors could cause our actual results to differ materially from the statements made, including those factors discussed in filings made by us with the Canadian securities regulatory authorities. Should one or more of these risks and uncertainties, such as actual results of current exploration programs, the general risks associated with the mining industry, the price of gold and other metals, currency and interest rate fluctuations, increased competition and general economic and market factors, occur or should assumptions underlying the forward looking statements prove incorrect, actual results may vary materially from those described herein as intended, planned, anticipated, or expected. We do not intend and do not assume any obligation to update these forward-looking statements, except as required by law. Shareholders are cautioned not to put undue reliance on such forward-looking statements.
Vancouver, British Columbia–(Newsfile Corp. – April 14, 2022) – EMX Royalty Corporation (NYSE American: EMX) (TSXV: EMX) (FSE: 6E9) (“EMX” or the “Company”) is pleased to announce that it has acquired an additional (effective) 0.3155% Net Smelter Return (“NSR“) royalty on the Caserones Copper-Molybdenum Mine located in northern Chile for US$25.74 million. When combined with EMX’s 0.418% NSR interest acquired in August 2021 (see EMX news release dated August 17, 2021), EMX now holds an effective 0.7335% NSR royalty. Franco-Nevada Corporation (“Franco-Nevada”) has concurrently acquired a 0.4582% (effective) NSR royalty on similar terms.
Since acquisition, Caserones has generated pre-tax cash flow to EMX in Q2, Q3 and Q4 of fiscal 2021 totalling $3.6 million from EMX’s effective 0.418% interest. As part of the royalty purchase, EMX will receive royalty distributions covering Q1 of fiscal 2022 for the additional interest acquired.
To finance its purchase of the additional NSR royalty, EMX has agreed to complete a private placement with Franco-Nevada for C$12.58 million (US$10 million). On completion, Franco-Nevada will own approximately 3.5% of the issued and outstanding shares of EMX on an undiluted basis. EMX is delighted to have Franco-Nevada as a shareholder.
Caserones Overview. The Caserones open pit mine is developed upon a significant porphyry copper-molybdenum deposit in the Atacama Region of the northern Chilean Andean Cordillera, 162 kilometres southeast of the city of Copiapó. The mine is operated by SCM Minera Lumina Copper Chile SpA (“Minera Lumina”), which is owned by JX Nippon Mining & Metals Corporation.
Caserones produces copper and molybdenum concentrates from a conventional crusher, mill and flotation plant, as well as copper cathodes from a dump leach, solvent extraction and electrowinning plant. In 2020, the mine produced 104,917 tonnes of fine copper in concentrate, 2,453 tonnes of fine molybdenum in concentrate, and 22,056 tonnes of fine copper in cathodes (results for 2021 have not yet been released by Minera Lumina). The Caserones open pit has operated with an average waste to ore strip ratio of 0.47, has an estimated 17 years remaining in its current mine plan (as at year-end 2020), along with excellent exploration potential.https://embed.fireplace.yahoo.com/embed?ctrl=Monalixa&m_id=monalixa&m_mode=document&site=sports&os=android&pageContext=%257B%2522ctopid%2522%253A%25221542500%253B1577000%2522%252C%2522hashtag%2522%253A%25221542500%253B1577000%2522%252C%2522wiki_topics%2522%253A%2522Franco-Nevada%253BRoyalty_payment%253BShares_outstanding%253BCalifornia%253BCompany%253BPrivate_placement%2522%252C%2522lmsid%2522%253A%2522a0V0W00000HOPDcUAP%2522%252C%2522revsp%2522%253A%2522newsfile_64%2522%252C%2522lpstaid%2522%253A%2522238b4c30-4b4b-3615-902e-17d479fd2222%2522%252C%2522pageContentType%2522%253A%2522story%2522%257D
Acquisition Details. The Caserones mine is subject to a 2.88% NSR royalty created in a 2009 agreement between SCM Minera Lumina Copper Chile S.A., as purchaser, and Compañía Minera Caserones (“CMC“) and Sociedad Legal Minera California Una de la Sierra Peña Negra (“SLM California“), as vendors. CMC and SLM California originally acquired the mineral concessions that overlie the Caserones deposit. Ownership of the 2.88% NSR royalty is currently divided between CMC (32.5%) and SLM California (67.5%). SLM California’s sole purpose is to distribute its royalty income to its shareholders as dividends and pay Chilean taxes on its income.
EMX has purchased today a further 16.23% of the shares of SLM California for US$25.74 million pursuant to share purchase agreements with existing shareholders of SLM California.
Private Placement. Franco-Nevada will purchase 3,812,121 units at C$3.30 per unit for total proceeds of C$12,580,000. Each unit will consist of one common share of the Company and one warrant to purchase one common share of the Company for five years at an exercise price of C$4.45. The shares issued upon closing and issuable upon the exercise of the warrants are and will be subject to a four-month restricted resale (hold) period. Proceeds from the placement totalling C$12,580,000 will be used towards the acquisition of the additional Caserones (effective) royalty interest.
Qualified Person. Eric P. Jensen, CPG, a Qualified Person as defined by National Instrument 43-101 Standards of Disclosure for Mineral Projects of the Canadian Securities Administrators and an employee of the Company, has reviewed, verified, and approved the disclosure of the technical information contained in this news release.
About EMX. EMX is a precious, base and battery metals royalty company. EMX’s investors are provided with discovery, development, and commodity price optionality, while limiting exposure to risks inherent to operating companies. The Company’s common shares are listed on the NYSE American Exchange and TSX Venture Exchange under the symbol EMX, and also trade on the Frankfurt exchange under the symbol “6E9”. Please see www.EMXroyalty.com for more information.
For further information contact:
David M. Cole President and Chief Executive Officer Phone: (303) 973-8585 Dave@EMXroyalty.com
Scott Close Director of Investor Relations Phone: (303) 973-8585 SClose@EMXroyalty.com
Neither the TSX-V nor its Regulation Services Provider (as that term is defined in policies of the TSX-V) accepts responsibility for the adequacy or accuracy of this release.
Forward-Looking Statements
This news release may contain “forward looking statements” that reflect the Company’s current expectations and projections about its future results. These forward-looking statements may include statements regarding completion of the transactions, perceived merits of properties, exploration results, budgets and potential, estimated mine life, mineral reserves and resource estimates, timelines, strategic plans, or other statements that are not statements of fact. When used in this news release, words such as “estimate,” “intend,” “expect,” “anticipate,” “will”, “believe”, “potential”, “upside” and similar expressions are intended to identify forward-looking statements, which, by their very nature, are not guarantees of the Company’s future operational or financial performance, and are subject to risks and uncertainties and other factors that could cause the Company’s actual results, performance, prospects or opportunities to differ materially from those expressed in, or implied by, these forward-looking statements. These risks, uncertainties and factors may include, but are not limited to: unavailability of financing, failure to identify commercially viable mineral reserves, fluctuations in the market valuation for commodities, difficulties in obtaining required approvals for the development of a mineral project, increased regulatory compliance costs, expectations of project funding by joint venture partners and other factors. It is possible EMX may not complete the transaction, as a result of failure to fulfill conditions of closing, unavailability of financing or for other reasons EMX cannot anticipate at this time.
Readers are cautioned not to place undue reliance on these forward-looking statements, which speak only as of the date of this news release or as of the date otherwise specifically indicated herein. Due to risks and uncertainties, including the risks and uncertainties identified in this news release, and other risk factors and forward-looking statements listed in the Company’s MD&A for the year ended December 31, 2021 (the “MD&A”), and the most recently filed Annual Information Form (the “AIF”) for the year ended December 31, 2021, actual events may differ materially from current expectations. More information about the Company, including the MD&A, the AIF and financial statements of the Company, is available on SEDAR at www.sedar.com and on the SEC’s EDGAR website at www.sec.gov.
KELOWNA, BC / ACCESSWIRE / April 12, 2022 / Diamcor Mining Inc. (TSX.V:DMI), (OTCQB:DMIFF), (FRA:DC3A), (“Diamcor” or, the “Company”) announced today that the Company’s gross revenues from tenders and sales held in its fourth quarter, ending March 31, 2022, increased to (USD) $1,301,978, a 21% increase over the previous quarter. Total carats sold during the fourth quarter decreased by 12% to 4,787.89 when compared to the 5,441.88 sold in the previous quarter. This, however, was largely due to the timing of tenders during the fourth quarter, and the decision by the Company in March 2022 to retain and instead offer approximately 2,000 additional carats at upcoming tenders during the current quarter. Despite the lower volume sold during the fourth quarter ended March 31, 2022, the average dollar per carat of (USD) $271.93 achieved during the period increased by 38% over the previous quarter. The increase in the average price per carat achieved during the period was primarily due to significant price increases experienced early in the quarter which appear to be due to rough diamond shortages in various categories.
Progress of Accelerated Upgrades
The Company also announces that its efforts to increase current processing volumes and efficiencies during the last quarter continued, and further results of these efforts are expected to be realised during the current quarter. The reconfiguration and installation of the Project’s X-Ray diamond sorting units and final recovery systems remained a priority during the quarter, and these efforts, along with the installation of additional screening systems now nearing completion, remain on schedule to advance the Company’s continued increases in processing volumes. These accelerated upgrades position the Company to take advantage of any potential rough diamond shortages associated with on-going international sanctions, which may impact a significant portion of the world’s rough diamonds supply originating in Russia.
Acceleration Highlights
Processing Volume Increases – The installation of additional screening equipment to compliment the previously completed phase one upgrades and specifically increase efficiencies in the removal of soil and clay fines at the Project’s Main Treatment Plant are now nearing completion. These refinements are expected to be operational prior to the end of April 2022 and to increase current hourly feed-rates and processing volumes by approximately 60%.
Water Recovery Improvements – Initial revisions to the Project’s water recovery systems aimed at supporting additional tonnages have also been completed. The construction and delivery of a larger purpose-built water recovery system continues to progress on schedule, with delivery targeted prior to the end of the current quarter. All water recovery system additions are designed to ultimately lower water consumption on a per ton basis through improvements in the recovery of wastewater, and provide the potential for further increases to processing volumes moving forward.
Reductions in Operating Costs on a Per Ton Basis – In addition to providing the potential to increase processing volumes, the screening upgrades are expected to provide the added benefit of lowering the Project’s operating costs on a per-ton basis by reducing consumables due to added screening efficiencies. Material handling and equipment cycle times are also expected to improve.
Continued Support of Further Growth – The collective upgrades completed to date have retained much of their original design and scope to ensure they continue to support the Company’s ongoing larger growth plans.
No Disruptions to Current Operations – The installation of the upgrades to date have been completed in conjunction with ongoing processing as envisioned, and have not caused any material disruptions to operations.
“The progress made during the quarter has strategically positioned our Company with the potential to supply quality buyers with increased volumes of rough diamonds at a time when potential shortages are anticipated moving forward,” stated Mr. Dean Taylor, Diamcor CEO.https://embed.fireplace.yahoo.com/embed?ctrl=Monalixa&m_id=monalixa&m_mode=document&site=sports&os=android&pageContext=%257B%2522ctopid%2522%253A%25221542500%253B1577000%253B1480989%2522%252C%2522hashtag%2522%253A%25221542500%253B1577000%253B1480989%2522%252C%2522wiki_topics%2522%253A%2522Company%253BTSX_Venture_Exchange%253BTiffany_%2526_Co.%253BProject%253BStargate_SG-1_(season_4)%253BDiamond%2522%252C%2522lmsid%2522%253A%2522a077000000LnOyOAAV%2522%252C%2522revsp%2522%253A%2522accesswire.ca%2522%252C%2522lpstaid%2522%253A%252202b7c941-b464-37df-ad39-2fbcb91eeeb9%2522%252C%2522pageContentType%2522%253A%2522story%2522%257D
About Diamcor Mining Inc.
Diamcor Mining Inc. is a fully reporting publicly traded junior diamond mining company which is listed on the TSX Venture Exchange under the symbol V.DMI, and on the OTC QB International under the symbol DMIFF. The Company has a well-established operational and production history in South Africa and extensive prior experience supplying rough diamonds to the world market.
About the Tiffany & Co. Alliance
The Company has established a long-term strategic alliance and first right of refusal with Tiffany & Co. Canada, a subsidiary of world famous New York based Tiffany & Co., to purchase up to 100% of the future production of rough diamonds from the Krone-Endora at Venetia Project at then current prices to be determined by the parties on an ongoing basis. In conjunction with this first right of refusal, Tiffany & Co. Canada also provided the Company with financing to advance the Project. Tiffany & Co. is owned by Moet Hennessy Louis Vuitton SE (LVMH), a publicly traded company which is listed on the Paris Stock Exchange (Euronext) under the symbol LVMH and on the OTC under the symbol LVMHF. For additional information on Tiffany & Co., please visit their website at www.tiffany.com.
About Krone-Endora at Venetia
In February 2011, Diamcor acquired the Krone-Endora at Venetia Project from De Beers Consolidated Mines Limited, consisting of the prospecting rights over the farms Krone 104 and Endora 66, which represent a combined surface area of approximately 5,888 hectares directly adjacent to De Beers’ flagship Venetia Diamond Mine in South Africa. On September 11, 2014, the Company announced that the South African Department of Mineral Resources had granted a Mining Right for the Krone-Endora at Venetia Project encompassing 657.71 hectares of the Project’s total area of 5,888 hectares. The Company has also submitted an application for a mining right over the remaining areas of the Project. The deposits which occur on the properties of Krone and Endora have been identified as a higher-grade “Alluvial” basal deposit which is covered by a lower-grade upper “Eluvial” deposit. The deposits are proposed to be the result of the direct-shift (in respect to the “Eluvial” deposit) and erosion (in respect to the “Alluvial” deposit) of material from the higher grounds of the adjacent Venetia Kimberlite areas. The deposits on Krone-Endora occur in two layers with a maximum total depth of approximately 15.0 metres from surface to bedrock, allowing for a very low-cost mining operation to be employed with the potential for near-term diamond production from a known high-quality source. Krone-Endora also benefits from the significant development of infrastructure and services already in place due to its location directly adjacent to the Venetia Mine.
Qualified Person Statement:
Mr. James P. Hawkins (B.Sc., P.Geo.), is Manager of Exploration & Special Projects for Diamcor Mining Inc., and the Qualified Person in accordance with National Instrument 43-101 responsible for overseeing the execution of Diamcor’s exploration programmes and a Member of the Association of Professional Engineers and Geoscientists of Alberta (“APEGA”). Mr. Hawkins has reviewed this press release and approved of its contents.
This press release contains certain forward-looking statements. While these forward-looking statements represent our best current judgement, they are subject to a variety of risks and uncertainties that are beyond the Company’s ability to control or predict and which could cause actual events or results to differ materially from those anticipated in such forward-looking statements. Further, the Company expressly disclaims any obligation to update any forward looking statements. Accordingly, readers should not place undue reliance on forward-looking statements.
WE SEEK SAFE HARBOUR
Neither TSX Venture Exchange nor its Regulation Services Provider (as that term is defined in policies of the TSX Venture Exchange) accepts responsibility for the adequacy or accuracy of this release.
Vancouver, British Columbia–(Newsfile Corp. – April 12, 2022) – StrikePoint Gold Inc. (TSXV: SKP) (OTCQB: STKXF) (“StrikePoint” or the “Company”) is pleased to announce results from surface channel sampling as well as reconnaissance grab samples collected during the 2021 exploration program at the 100%-owned Willoughby gold-silver property, located east of the community of Stewart in British Columbia’s prolific Golden Triangle. The purpose of the channel sampling is to provide quality surface assay data over the surface expression of mineralized zones that could potentially be used for a NI43-101 Mineral Resource Estimate for the property and to refine diamond drill targeting for 2022 field season.
Highlights of the remainder of 2021 surface sampling at Willoughby Include:
4.74 g/t AuEq over 7.0 metres, including 8.60 g/t AuEq over 3.0 metres in channel at Edge Zone
11 grabs from NN Zone average 4.28 g/t Au, 159.1 g/t Ag including 17.45 g/t Au, 576 g/t Ag
6 grabs from Willow Zone average 9.91 g/t Au, 151.4 g/t Ag including 49.00 g/t Au and 777 g/t Ag
StrikePoint’s CEO, Shawn Khunkhun, states, “In addition to providing increased definition at the known gold-silver Zones at Willoughby, surface sampling during 2021 at the NN area along strike from the North Zone underground workings has extended total strike of the series of mineralized Zones an additional 113 metres to the north on the Willoughby nunataq. As well, the high-grade gold and silver values and multiple high-grade structures 100 meters south of our Willow Zone drilling are priority drilling targets for our 2022 drilling season. Of particular interest are the high silver assays from these areas.”
2021 Willoughby Channel Sampling
These results include seven continuous series of channel samples from steep terrain at the Edge Zone, collected by experienced climbing geologists and technicians using a hydraulic chisel, from well-exposed bedrock hosting disseminated to massive mineralization. The samples cover approximately 40 metres of strike and 20 metres of vertical relief on steep exposure. This sampling suggests that the Edge Zone true thickness ranges from 3 to 8 metres. Coupled with drilling, this sampling suggests dimension of 16 by 48 metres starting at surface.
The Edge Zone samples, along with channel sampling results from the Icefall zones on the property (News release December 15, 2021, 3.38 g/t AuEq over 15.0 metres including 12.53 g/t AuEq over 2.0 metres in channel W21-CH-004), provide representative assay data from surface expressions projected up-dip and along strike to the north of previous and 2021 drilling (News Release March 2, 2022, 2.76 g/t AuEq over 6.50 metres and 10.16 g/t AuEq over 1.5 metres in hole W21-117).
The Edge zone is one of the least tested of the seven significant mineralized areas on the Willoughby nunataq. The channel sampling at the Edge Zones confirmed continuous gold and silver mineralization along all seven channel lines in 74 samples with values of up to 18.50 g/t gold and 31.1 g/t silver. Five channel sampling lines intersected the mineralized horizon perpendicular to the strike of the Edge Zone (W21-CH-008, W21-CH-009, W21-CH-011 to W21-CH-013), and two are along strike (W21-CH-010, W21-CH-014).
Figure 1. Edge zone 2021 Channel Sampling Line location in relation with the 2021 drilling on the Willoughby nunataq.
The gold-silver mineralization consists of replacement-style sulphides within permeable lapilli tuff strata of the Early Jurassic lower Hazelton group. Mineralization is concordant with bedding and ranges from semi-massive to massive pyrite with accessory sphalerite-chalcopyrite. Both W21-CH-008 and W21-CH-013 intersected the mineralized horizon perpendicularly. W21-CH-008 returned 4.74 g/t AuEq over 7.0 metres, including 8.60 g/t AuEq over 3.0 metres. W21-CH-013 is the northernmost channel sampling line, stepped out 48 metres from the previously released 2021 drilling at the Edge zone and returned 3.26 g/t AuEq over 9.0 metres. Both W21-CH-010 and W21-CH-014 are parallel to the mineralization testing continuity along strike. W21-CH-010 returned 3.01 g/t AuEq over 11.0 metres, and W21-CH-014 returned 3.48 g/t AuEq over 18.0 metres, extending the outlined Edge zone mineralization in the 2021 drilling twenty-seven metres further to the north.
Hole-ID
Zone
From (metres)
To (metres)
Length (metres)
Gold (g/t)
Silver (g/t)
AuEq (g/t)
W21-CH-008
Edge
1.00
8.00
7.00
4.65
6.13
4.74
incl.
1.00
4.00
3.00
8.45
10.37
8.60
W21-CH-009
Edge
0.00
1.00
1.00
1.83
3.40
1.88
W21-CH-010
Edge
0.00
11.00
11.00
2.94
4.55
3.01
W21-CH-011
Edge
1.00
3.00
2.00
1.90
3.55
1.95
W21-CH-012
Edge
0.00
13.00
13.00
1.41
2.22
1.44
incl.
0.00
4.00
4.00
2.88
2.80
2.92
W21-CH-013
Edge
1.00
10.00
9.00
3.21
3.17
3.26
W21-CH-014
Edge
0.00
18.00
18.00
3.38
7.48
3.48
Table 1: Highlight channel sampling intercepts at the Edge zone – Willoughby project. Gold equivalent grade calculated using a 70:1 Ag: Au ratio. **True widths are estimated to be 70% at this time. All widths reported are channel widths.
Channel-ID
Easting
Northing
Azimuth
Length (metres)
W21-CH-008
463488.0
6203177.0
75
9.00
W21-CH-009
463502.0
6203170.0
78
5.00
W21-CH-010
463488.4
6203168.2
129
11.00
W21-CH-011
463476.0
6203162.0
68
6.00
W21-CH-012
463490.0
6203157.0
98
13.00
W21-CH-013
463485.0
6203196.0
90
12.00
W21-CH-014
463487.0
6203172.0
160
18.00
Table 2: Willoughby property – Edge Zone Channel Sampling locations and orientations (NAD83 Zone 9).
2021 Willoughby Grab Samples
The remainder of the 2021 select grab samples results were also received from the North-North and Willow zones. The Willow zone is the northern most zone on the property located 800 metres due northeast of the Willoughby nunataq. Surface sampling returned high grade values ranging from 0.07 to 49.0 g/t Au, averaging 9.91 g/t Au and 3.3 to 777 g/t Ag, averaging 151.4 g/t Ag in a quartz-carbonate veins with massive pyrite-sphalerite within a Jurassic tuff breccia. This mineralization is analogue to that intersected in the 2021 drilling and is located 100 metres south of any drilling completed in the area.
Figure 2. Willow zone surface grab sample location with the gold values displayed in g/t. Annotated texts highlight select anomalous gold assays.
The NN Zone is located at the northernmost end of the Willoughby nunataq, 150 metres north of the North zone. Surface reconnaissance outlined an extension of a wide mineralized north-northwest striking structure comparable to the North fault. These steeply dipping structures are linked to bonanza grade mineralization at the North zone to the south. A total of 11 grab samples were collected, ranging from 0.38 to 17.45 g/t Au, averaging 4.28 g/t Au, and 2.1 to 598.0 g/t Ag, averaging 159.1 g/t Ag. Highlights include 17.45 g/t Au and 576 g/t Ag in sample B0016021 and 13.60 g/t Au and 598 g/t Ag in sample B0016022.
Figure 3. Massive pyrite mineralization within north northwest fault at the NN zone.
These encouraging results strengthen the mineralization continuity along the outlined 1,300 metres Willoughby mineralized trend and provide a cost-effective way to test and extend exploration targets on the property. Future work in 2022 is planned to follow up on the mineralization extension at both the Willow, Edge and the North-North zones.
Willoughby Project
The project occurs along the eastern margin of the Cambria Icefield, approximately seven kilometres east of the advanced-stage Red Mountain Deposit owned by Ascot Resources. Upper Triassic Stuhini rocks and Lower Jurassic Hazelton volcano-sedimentary rocks underlay the property, subsequently intruded by an early Jurassic-aged hornblende-feldspar porphyry, potentially comagmatic with the Goldslide Intrusive suite at the nearby Red Mountain deposit. Intrusive-related mineralized zones consist of primary pyrite with lesser pyrrhotite, sphalerite, galena, chalcopyrite and native gold. Eight gold and silver mineralized zones have been identified to date over a one-kilometre strike-length mineralized trend.
QA/QC
Using a hydraulic chisel, an approximate 2 by 2-centimetre channel was sampled continuously along 1 metre sample stations. If the hydraulic chisel was incapable of retrieving a chip from a specific location, a hand chisel was used to assist with the chipping within the limits of the 1 metre station. Chip data observation data were recorded and digitized in the field using MX Deposit, directly sampled into a polyurethane bag, and transported from the field to secure storage in Stewart.
Surface samples for the 2021 exploration program were labelled and shipped to the laboratory using industry standard chain of custody controls. In addition, the company implements a rigorous Quality Control/Quality Assurance program, including the insertion of Standards, Blanks, and Duplicates at regular intervals in the sample stream to monitor laboratory performance.
Samples were submitted to the ALS Laboratory facility located in North Vancouver, British Columbia, for preparation and analysis. The ALS facility is accredited to the ISO/IEC 17025 standard for gold assays, and all analytical methods include quality control materials at set frequencies with established data acceptance criteria. The entire sample is crushed, split into representative sub-samples using a riffle splitter, and subsequently, 250g is pulverized. Analysis for gold is by 30g fire assay fusion with atomic absorption (AAS) finish with a lower limit of 0.005 ppm and an upper limit of 10 ppm. Samples with gold assays greater than 10ppm are re-analyzed using a 30g fire assay fusion with a gravimetric finish. Analysis for silver is by 30g fire assay fusion with gravimetric finish with a lower limit of 2ppm and upper limit of 100ppm. Samples with silver assays higher than 100ppm are re-analyzed using a gravimetric silver concentrate method. All samples are also analyzed using a 33 multi-elemental geochemical package by 4-acid digestion (ICP-AES).
Qualified Person
The Qualified Person for this news release for National Instrument 43-101 is Andrew Hamilton, P. Geo, technical advisor to StrikePoint. He has read and approved the scientific and technical information that forms the basis for the disclosure contained in this news release.
About StrikePoint
StrikePoint Gold is a gold exploration company focused on building high-grade precious metals resources in Canada. The company controls two advanced-stage exploration assets in BC’s Golden Triangle. The past-producing high-grade silver Porter Project and the high-grade gold property Willoughby, adjacent to Red Mountain. The company also owns a portfolio of gold properties in the Yukon.
ON BEHALF OF THE BOARD OF DIRECTORS OF STRIKEPOINT GOLD INC.
“Shawn Khunkhun”
Shawn Khunkhun Chief Executive Officer and Director
Statements in this release that are forward-looking statements are subject to various risks and uncertainties concerning the specific factors disclosed under the heading “Risk Factors” and elsewhere in the company’s filings with Canadian securities regulators. Such information contained herein represents management’s best judgment as of the date hereof based on information currently available. The company does not assume any obligation to update any forward-looking statements, save and except as may be required by applicable securities laws.
Neither the TSX Venture Exchange nor its Regulation Services Provider (as that term is defined in the policies of the TSX Venture Exchange) accepts responsibility for the adequacy or accuracy of this release.
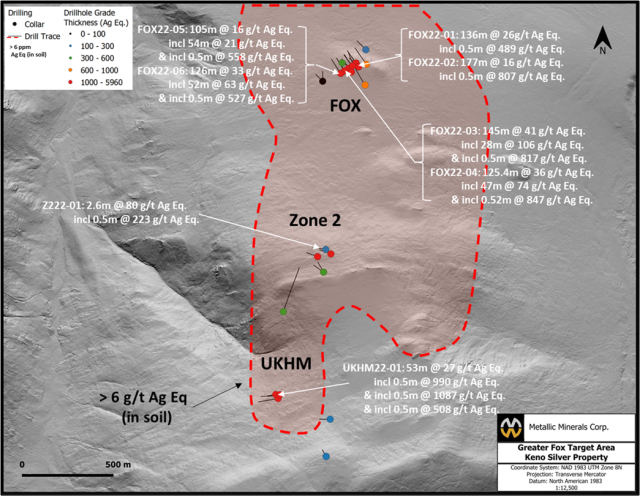
Metallic Minerals Corp. (TSX-V: MMG / US OTC: MMNGF) is a growth stage exploration company focused on the acquisition and development of high-grade silver and gold projects within underexplored districts proven to produce top-tier assets. Our objective is to create value through a disciplined, systematic approach to exploration, reducing investment risk and maximizing probability of long-term success. Our core Keno Silver Project is located in the historic Keno Hill Silver District of Canada’s Yukon Territory, a region which has produced over 200 million ounces of silver and currently hosts one of the world’s highest-grade silver resources. The Company’s La Plata silver-gold-copper project is located in the high-grade La Plata district of the prolific Colorado Mineral Belt and our McKay Hill project northeast of Keno Hill is a high-grade historic silver-gold producer. Metallic Minerals is also building a portfolio of gold royalties in the historic Klondike Gold District. Metallic Minerals is led by a team with a track record of discovery and exploration success, including large scale development, permitting and project financing.
Russia causes a dramatic change in the global diamond market
Mountain Province Diamonds- a top-tier company with significant scale
Diamcor Mining- A junior diamond miner with potential
A potential bottom in DMI/DMIFF shares
A diamond is a pure solid form of the element carbon with its atoms arranged in a crystal structure, a diamond cubic. At room temperature and pressure, another solid form of carbon is graphite, a chemically stable form of the element. Diamonds form under high temperatures and pressure that cause the carbon atoms to bond and form crystals.
It takes carbon up to 650 million years to become fossil fuels. Transforming carbon into a diamond takes one to 3.3 billion years, approximately 25% to 75% of the earth’s age.
Diamonds occur in greater number and quality in the ocean, but the extraction process is expensive and challenging. Ocean miners dredge the ocean floor, bring the material onto mining ships, and sift it for diamonds. Mining diamonds from the earth’s crust involves releasing igneous emplace rocks with explosives as the encased diamonds are carried up with intrusive rocks from the earth’s mantle. Most diamond mines are around one hundred miles below the earth’s surface.
Rough diamonds look like shiny pebbles. Experts cut and polish the rocks that become the centerpiece of jewelry cherished worldwide. Only 20-30% of mined diamonds have a suitable quality for jewelry; the remainder goes to industrial applications. The industrial diamonds are too badly flawed, irregularly shaped, poorly colored, or too small for gems. However, they are critical for cutting, grinding, drilling, and polishing procedures because of a diamond’s hardness and heat conductivity.
The first Soviet leader, Vladimir Lenin, once said, “There are decades where nothing happens, and there are weeks where decades happen.”
The international diamond business is experiencing that phenomenon in early 2022, courtesy of his successor.
Russia is the leading producer- Canada is third Like many commodities, diamond production occurs in regions where the earth contains minable reserves.
The chart highlights that Russia has the largest diamond reserves with approximately 650 million carats, over double the country with the second-most reserves, Botswana. While diamonds are synonymous with South Africa, the nation is home to the fourth leading reserves behind Russia, Botswana, and the Democratic Republic of Congo. While the DR Congo has the third most reserves, Canada is the third-leading diamond-producing country.
As the chart illustrates, in 2020, Canada produced 17.2% of the worlds’ diamonds.
Russia causes a dramatic change in the global diamond market
On February 24, 2022, the world changed as the Russian military invaded Ukraine. President Vladimir Putin does not consider Ukraine a country but a part of Western Europe. Meanwhile, the watershed event occurred on February 4, 2022, when President Putin and Chinese President Xi signed a $117 billion trade agreement and shook hands on “no-limits” support. The Chinese-Russian alliance paved the way for Russia’s invasion of the country that the US, Europe, Canada, Australia, Japan, and allies worldwide consider a sovereign country in Eastern Europe. Russian success in Ukraine could pave the way for China’s reunification with Taiwan.
Sanctions on Russia leading to retaliatory measures are likely to choke off commodity supplies to the west. Russia is a leading producer and exporter of diamonds, oil, nickel, wheat, fertilizer, and a host of other raw materials.
The geopolitical landscape has deteriorated to the most dangerous level since World War II. War, sanctions, and trade embargos distort market prices, impacting the global supply chain and creating fundamental supply and demand imbalances. The dark cloud of war and tensions between Russia-China and the West may have a diamond lining for companies producing commodities to fill the gaps created by supply shortages and rising prices.
On February 24, the diamond market underwent a substantial change.
Mountain Province Diamonds- a top-tier company with significant scale
The DeBeers Group controls companies in the diamond mining, diamond processing, and diamond trading sectors. Still, it is the second-leading diamond company behind Alrosa, the Russian mining giant that distributed 38.5 million carats in 2021. De Beers distributed 30.78 million carats.
When most people think of diamonds, De Beers is the brand name that glistens like the stones. De Beers has been around since 1888 with South African roots. Today, the company calls London home, with the mining giant Anglo American (NGLOY)owning 85%. While price transparency in the diamond market can be opaque, prices have appreciated.
The price index rose from 204.20 in July 2020 to 230.30 in March 2022, a 12.8% increase.
Mountain Province Diamonds is a Canadian diamond producer that operates a joint venture with De Beers, owning the world’s fifth-largest diamond mine, Gahcho Kue, in Canada’s Northwest Territories. Mountain Province Diamonds also owns 100% of the Kennady North Project and explores for diamonds in the Northwest Territories through targeted drill programs with 13.6 million carat reserves and inferred resources of 7.35 million carats ten kilometers from the Gahcho Kue mine. A summary of some of the company’s other highlights includes:
The highest-grade diamonds in the De Beers portfolio at 1.55 carats per ton of reserves.
The second most favorable mining jurisdiction in Canada.
A commitment to sustainability through environmental stewardship.
Exploration territory of 107,000 hectares of 100% owned claims/leases surrounding Gahcho Kue.
Mountain Province Diamonds traded on the TSX in Canadian dollars under MPVD.TO. The company trades in the over-the-counter market in the US under the symbol MPVDF.
As the chart highlights, MPVDF shares fell to a low of 17.41 cents in March 2020 as the global pandemic gripped markets across all asset classes. The stock has moved higher with diamond prices and production success, making higher lows and higher highs with the price at 62.83 cents on March 16, over 3.6 times higher than the March 2020 low.
Diamcor Mining- A junior diamond miner with potential
Diamcor Mining Inc. is a junior diamond mining company that identifies, acquires, and operates unique projects with “near-term production potential.”
While many people think of De Beers synonymously with diamonds, the other name that comes to mind is Tiffany & Company. Diamcor established a long-term strategic alliance and the first right of refusal with Tiffany & Co, Canada, a subsidiary of Tiffany & Co in the US, for the purchase of up to 100% of the future production of rough diamonds from the Krone-Endora at Venetia Project at current market prices. Tiffany & Co. provides financing for the project. Diamcor acquired the Krone-Endora at Venetia project from DeBeers. The mine is co-located directly adjacent to the De Beers Venetia Diamond Mine in the Limpopo province of the Republic of South Africa. The project is a rare eluvial deposit, a direct shift of material from the higher grounds of the Venetia Kimberlite clusters onto the lower surrounding areas of Krone-Endora. The property is approximately 500 kilometers north-northeast of Johannesburg. The Venetia mine is the world’s third-largest diamond mine and South Africa’s leading mining, accounting for over 50% of annual production.
Some of Diamcor’s highlights include:
Accelerated phase two of a three-phase processing upgrade to increase volumes as the demand for rough diamonds has continued to be robust.
Diamcor’s most recent rough diamond sale yielded an average price of over $300 per carat, a 60% increase from the December 2021 price.
The project has revenue flows with demonstrated profitability.
The project has $70 million in development to date with significant infrastructure in place and a 30-year mining right.
A high percentage of the project’s diamonds are gem quality and can be found just 50 feet below surface.
Diamond reserves are likely on 95% of the project area that has not been defined, leading to significant growth potential.
US and European sanctions will limit the number of industrial and gem-quality diamond flows from Russia, pushing prices higher and availability lower. The world will be looking for new sources, and Diamcor’s project is far enough along and positioned to meet the increasing demand.
A potential bottom in DMI/DMIFF shares Diamcor Mining Inc trades on the TSX under the symbol DMI.VN. On the Us over-the-counter market, the symbol is DMIFF. The shares have moved appreciably higher since the late 2020 low.
As the chart highlights, DMIFF shares rose from a low of $0.046 in late December 2020 to $0.2425 on March 16, over five times higher. In October 2021, the shares peaked at 43.0 cents, over nine times higher than the late 2020 low. DMIFF returned a higher percentage gain than Mountain Province Diamonds (MPVDF) since its 2020 low.
It takes over a billion years for a diamond to form, making the stones a forever asset. Meanwhile, sanctions on Russia will limit the precious stones supplies, which could create an exciting opportunity for Diamcor, a mining company with lots of upside potential.
Written By: Andrew Hecht, on behalf of Maurice Jackson of Proven and Probable.
Any investment involves substantial risks, including, but not limited to, pricing volatility, inadequate liquidity, and the potential complete loss of principal. This document does not in any way constitute an offer or solicitation of an offer to buy or sell any investment, security, or commodity discussed herein, or any security in any jurisdiction in which such an offer would be unlawful under the securities laws of such jurisdiction.
Vancouver, British Columbia–(Newsfile Corp. – April 5, 2022) – Riverside Resources Inc. (TSXV: RRI) (OTCQB: RVSDF) (FSE: 5YY)(“Riverside” or the “Company”) is pleased to announce that the Company has expanded its drilling program at the Oakes Project in Ontario, Canada. The Company initiated the program in March with a planned 1500 metres (“m”) of drilling and has now completed 1705 m across 12 drill holes. The drill program was designed to test IP geophysical anomalies that were defined through Riverside’s 2021 program and coincided with anomalous surface geochemical sampling completed by Riverside.
Drilling is now complete with logging, core cutting and sampling now underway. The Company has shipped the first three holes to ACT Labs in Thunder Bay for analysis and is expecting to have all core samples delivered to ACT Labs during April. Assay results are expected later in Q2, 2022 and will be released once reviewed and interpreted.
Observations from the core to this point is consistent with surface findings showing similar patterns of mineralization and lithologies from hole to hole along the HG Target, where the initial seven drill holes were focused (see Press Release March 3, 2022). The mineralized zone is described as a quartz-carbonate veining system characterized by disseminated to semi massive pyrite, pyrrhotite, chalcopyrite mineral assemblage (see Photo 1 below). These observations are similar to the mineralization noted in the previously completed sampling which returned anomalous values for gold.
Photo 1: Close-up pictures of drill core from hole 5 and semi-massive sulfides from hole 7.
Figure 2: Initial cross-section schematic sketch interpreted block diagram of the logged intercept in hole Oakes-22-05 from the 2022 RRI drilling campaign. Red lines correspond to the veining crosscut in the drilling.
To view an enhanced version of this graphic, please visit: https://orders.newsfilecorp.com/files/6101/119254_167e054bf4f2c83d_003full.jpghttps://embed.fireplace.yahoo.com/embed?ctrl=Monalixa&m_id=monalixa&m_mode=document&site=sports&os=android&pageContext=%257B%2522ctopid%2522%253A%25221542500%253B1577000%2522%252C%2522hashtag%2522%253A%25221542500%253B1577000%2522%252C%2522wiki_topics%2522%253A%2522Ontario%253BTom%25C3%25A1%25C5%25A1_Hole%25C5%25A1%2522%252C%2522lmsid%2522%253A%2522a0V0W00000HOPDcUAP%2522%252C%2522revsp%2522%253A%2522newsfile_64%2522%252C%2522lpstaid%2522%253A%2522dc569072-7f8d-39c0-8f3b-476c41d2d19f%2522%252C%2522pageContentType%2522%253A%2522story%2522%257D
Note: The above sketch is not to scale and does not include data from holes that have not been logged, final interpretations are subject to change.
Riverside’s President and CEO, John-Mark Staude: “We are delighted with the excellent contractors and team working with Riverside on our Oakes exploration campaign, completing the program safely and finding encouraging geology and sulfide zones. These first insights from our drilling program suggest we have intersected the likely source of the geophysics and are seeing shears and stringers that look similar to mineralized areas 20 km west at the Greenstone Mine and Geraldton Mining district. Samples are being processed and will be sent to the lab. Riverside’s team will be working on detailed logging of the split core and preparing the next stages for our exploration campaign.”
The simplified geological interpretation from the drilling to date suggests that sulfide mineralization (and possibly gold) is associated with shearing near or at the geological boundary between gabbroic sills and Archean-aged mafic volcanics comprising flows, tuffs and pillow basalts. Intercalated sediments and volcanics are also often mineralized and will be assayed to determine if gold is present. The expanded drill program has primarily tested only one target area (HG) plus two orientation drill holes into two other targets as is shown on the Company website: Click here.
The scientific and technical data contained in this news release was reviewed and approved by Freeman Smith, P.Geo, a non-independent qualified person to Riverside Resources, who is responsible for ensuring that the geologic information provided within this news release is accurate and who acts as a “qualified person” under National Instrument 43-101 Standards of Disclosure for Mineral Projects.
About Riverside Resources Inc.:
Riverside is a well-funded exploration company driven by value generation and discovery. The Company has over $4.5M in cash, no debt and less than 75M shares outstanding with a strong portfolio of gold-silver and copper assets and royalties in North America. Riverside has extensive experience and knowledge operating in Mexico and Canada and leverages its large database to generate a portfolio of prospective mineral properties. In addition to Riverside’s own exploration spending, the Company also strives to diversify risk by securing joint-venture and spin-out partnerships to advance multiple assets simultaneously and create more chances for discovery. Riverside has properties available for option, with information available on the Company’s website at www.rivres.com.
ON BEHALF OF RIVERSIDE RESOURCES INC.
“John-Mark Staude”
Dr. John-Mark Staude, President & CEO
For additional information contact:
John-Mark Staude President, CEO Riverside Resources Inc. info@rivres.com Phone: (778) 327-6671 Fax: (778) 327-6675 Web: www.rivres.com
Certain statements in this press release may be considered forward-looking information. These statements can be identified by the use of forward-looking terminology (e.g., “expect”,” estimates”, “intends”, “anticipates”, “believes”, “plans”). Such information involves known and unknown risks — including the availability of funds, the results of financing and exploration activities, the interpretation of exploration results and other geological data, or unanticipated costs and expenses and other risks identified by Riverside in its public securities filings that may cause actual events to differ materially from current expectations. Readers are cautioned not to place undue reliance on these forward-looking statements, which speak only as of the date of this press release.
Neither the TSX Venture Exchange nor its Regulation Services Provider (as that term is defined in the policies of the TSX Venture Exchange) accepts responsibility for the adequacy or accuracy of this release.