Categories
Energy Gold Shore Resources Junior Mining Precious Metals

Goldshore Intersects 5.64 g/t Au over 15.65m at East Coldstream

Significant Mineralization Outlined 13km Northeast of the Moss Lake Deposit

Vancouver, British Columbia–(Newsfile Corp. – February 27, 2023) – Goldshore Resources Inc. (TSXV: GSHR) (OTCQB: GSHRF) (FSE: 8X00) (“Goldshore” or the “Company“), is pleased to announce assay results from its ongoing 100,000-meter drill program at the Moss Lake Project in Northwest Ontario, Canada (the “Moss Lake Gold Project“).

Highlights:

  • Results from the second half of the East Coldstream Phase One drill program have confirmed the potential for significant high-grade shears within East Coldstream, approximately 13 kilometers northeast of the Moss Lake Deposit. Best intercepts include:
    • 3.49 g/t Au over 26.35m from 76.85m depth in CED-22-010, including
      • 5.64 g/t over 15.65m from 87.55m
    • 1.12 g/t Au over 21.9m from 206.5m
    • 1.07 g/t Au over 31.0m from 288.0m depth in CED-22-011 and
    • 1.48 g/t Au over 18.45m from 357.0m, including
      • 4.68 g/t Au over 4.85m from 370.6m
    • 0.94 g/t Au over 25.05m from 218.95m depth in CED-22-014, including
      • 1.10 g/t Au over 16.0m from 226.0m
    • 1.23 g/t Au over 35.15m from 338.45m depth in CED-22-017, including
      • 2.19 g/t Au over 11.55m from 338.45m
  • In addition to the Moss Lake Depositthe upcoming mineral resource estimate update will include the East Coldstream deposit. In support of this, a 3D wireframe of the mineralization constraining alteration domain has been developed utilizing both current and historical drilling data.

President and CEO Brett Richards stated: “These results at East Coldstream continue to support our thesis that the size and scale of the entire Moss Lake Gold Project will be large enough to support a material and meaningful update to the mineral resource estimate in April 2023, with East Coldstream sequencing into the mine plan in a preliminary economic assessment as a satellite pit. We look forward to the continuing catalysts to the Moss Lake Gold Project in an effort to demonstrate the true value of the assets.”

Technical Overview

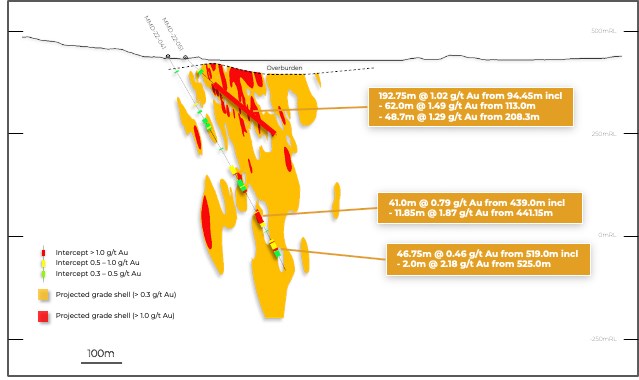
Figure 1 shows the location of East Coldstream relative to Moss Lake in addition to the now formally identified gold and copper prospects controlled by Goldshore Resources. Figure 2 shows the better intercepts in plan view, and Figure 3 is a typical section through holes CED-22-013 to -015 and -017. Table 1 shows the significant intercepts. Table 2 shows the drill hole locations.

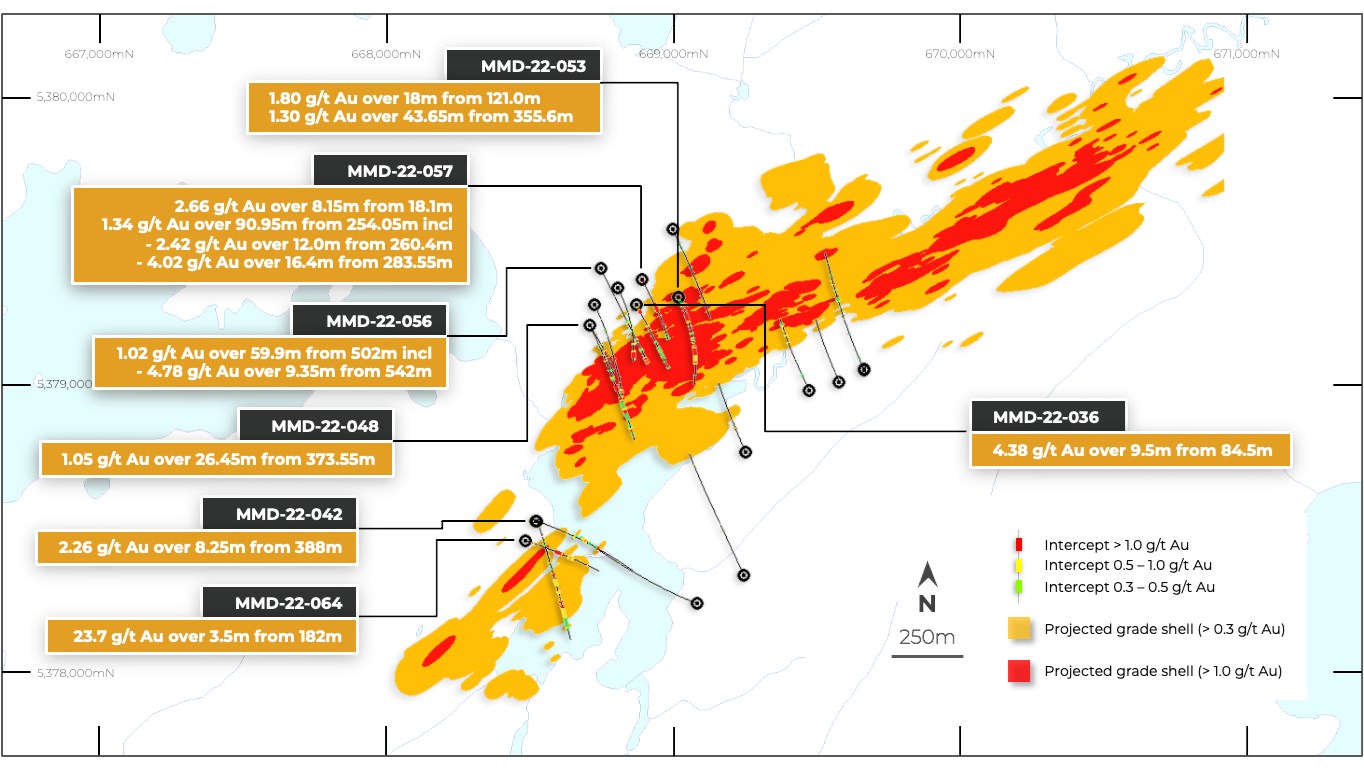
Figure 1: Plan showing location of Moss Lake and East Coldstream deposits relative to the prospective Central Domain (from geophysics survey) and field-developed prospects.

To view an enhanced version of this graphic, please visit:
https://images.newsfilecorp.com/files/8051/156214_410adcab747ffab5_002full.jpg

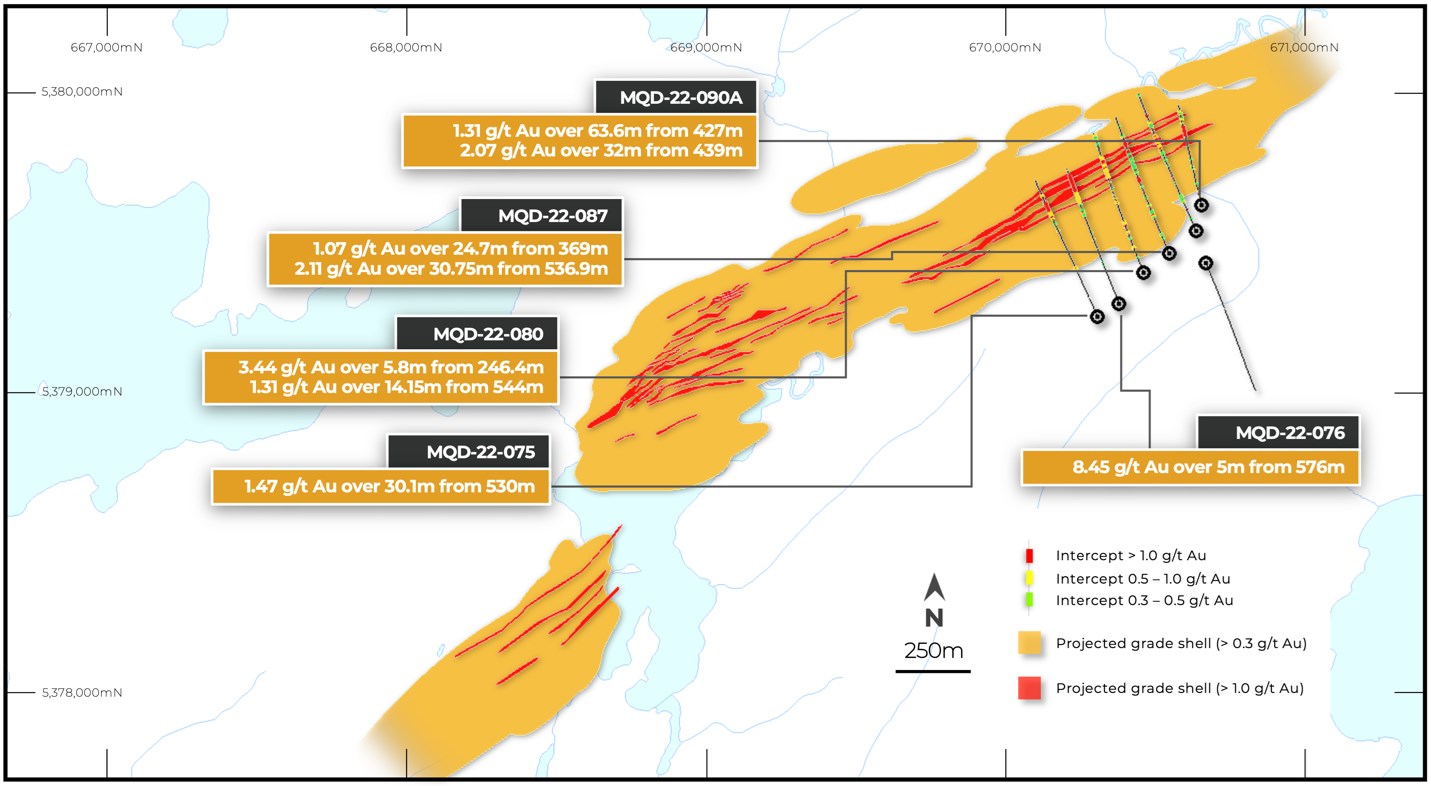
Figure 2: Drill plan showing best of several +1 g/t Au intercepts relative to the altered shears.

To view an enhanced version of this graphic, please visit:
https://images.newsfilecorp.com/files/8051/156214_410adcab747ffab5_003full.jpg

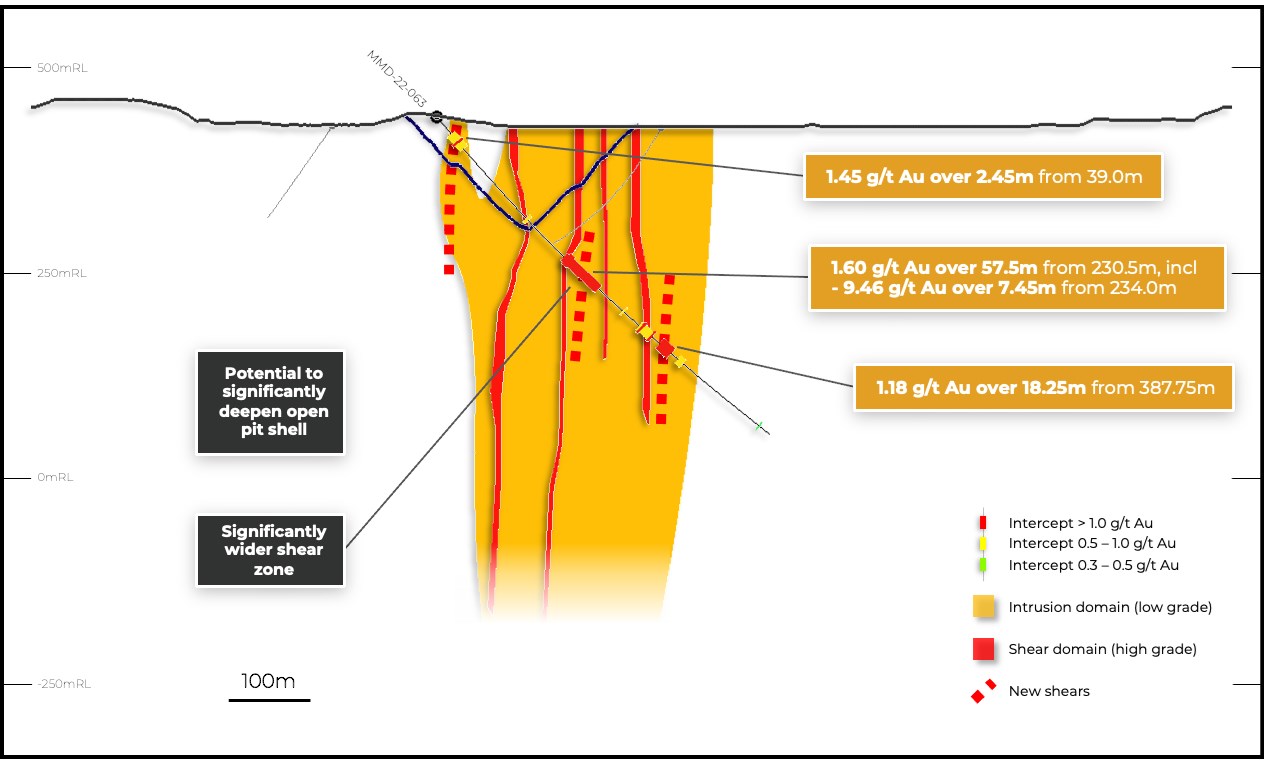
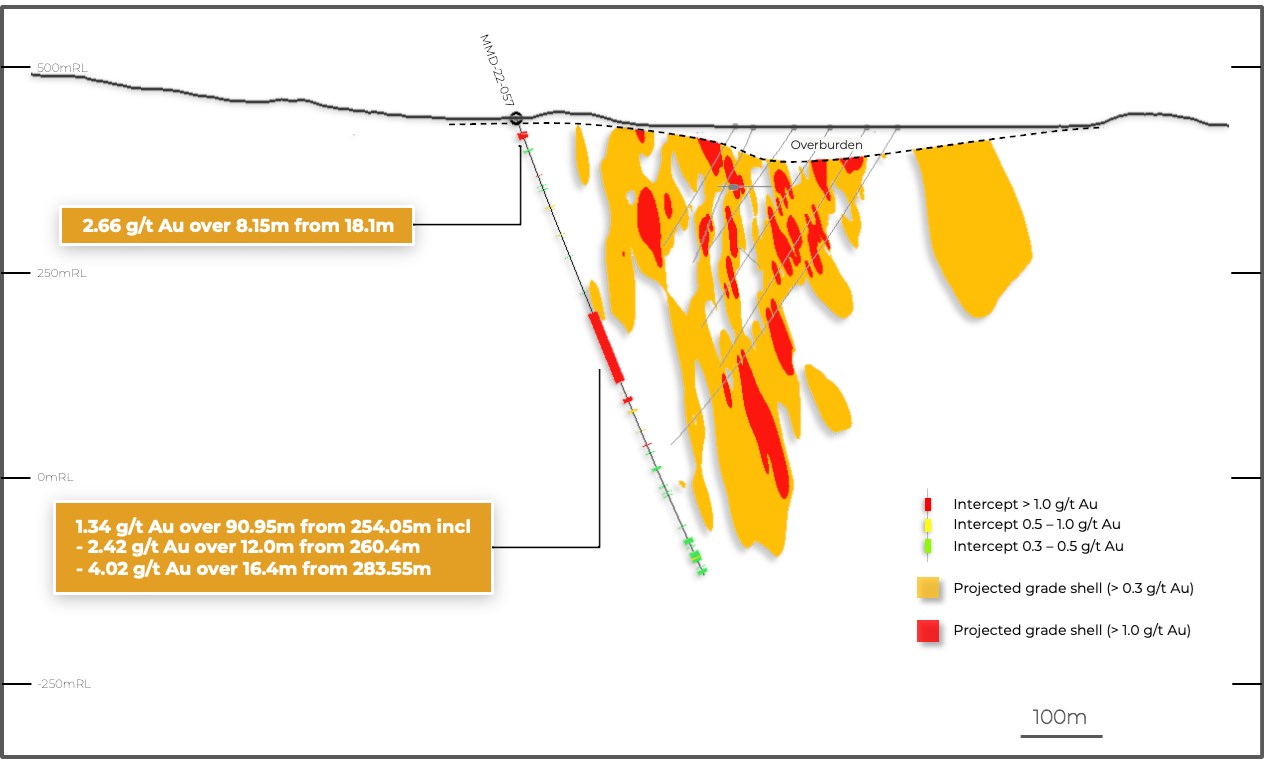
Figure 3: Drill section through MCD-22-013 to -015 and -017 relative to the altered shears.

To view an enhanced version of this graphic, please visit:
https://images.newsfilecorp.com/files/8051/156214_410adcab747ffab5_004full.jpg

Results have been received for the eight remaining holes from the Phase One East Coldstream drill program completed in the Summer of 2022.

All holes intersected visually distinct silica, carbonate, and hematite alteration zones hosted in basalt flows – historically been referred to as the “Coldstream Basalt” – that host much of the gold mineralization (Figure 4). This alteration also overprints and locally mineralizes quartz feldspar porphyry sills and gabbro intrusions where they are intersected by shear zones. The altered intrusions are significantly less “visual” than the Coldstream Basalt, which resulted in inconsistent sampling of historical drill core. Infill sampling of intervals within the modelled alteration domain represents an opportunity to expand mineralization. This is planned for the summer.

Goldshore has wireframed shear zone-hosted alteration domains (Figure 5) ahead of a mineral resource update planned for the second quarter. This consists of two major altered shear zones – Main Lens and North Lens – and four minor altered shear zone splays. The Main Lens has been historically split into the Main Lens and Sanders Lens however these two lenses are now understood to be the same zone split by a late Proterozoic diabase dyke.

To evaluate the historical drilling, hole CED-22-010 was drilled as a twin of hole C-10-23 in the core of the East Coldstream deposit where both holes intersected two shear-controlled Lenses. In the North Lens, CED-22-010 and C-10-23 intersected 1.81 g/t Au over 54.6m from 76.85m versus 1.35 g/t Au over 54.2m from 80.4m, respectively. In the South Lens, CED-22-010 intersected 0.56 g/t Au over 51.5m from 206.5m versus 0.55 g/t Au over 34.7m from 196.6m, respectively. This represents a 34% higher grade over similar widths in the North Lens and a 48% increase in width with similar grades in the South Lens in the current drill hole.

The East Coldstream deposit also contains a broad, low-grade mineralized envelope within the alteration domain. Examples include 0.54 g/t Au over 27.5.0m from 562.5m in CED-22-009; 0.56 g/t Au over 51.5m from 206.5m depth in CED-22-010; 0.33 g/t Au over 32.0m from 315m in CED-22-012; 0.72 g/t Au over 18.1m from 182.05m in CED-22-013; 0.69 g/t Au over 25.05m from 254.95m in CED-22-014; and 0.85 g/t Au over 17.4m from 190.6m in CED-22-015.

Figure 4: Core box photos of CED-22-010 intercept in the North Lens – 3.49 g/t Au over 26.35m from 76.85m depth (yellow box) including 5.64 g/t over 15.65m from 87.55m.

Note that these photos are not intended to be representative of broader mineralization on the Moss Lake Gold Project.

To view an enhanced version of this graphic, please visit:
https://images.newsfilecorp.com/files/8051/156214_410adcab747ffab5_005full.jpg

Figure 5: 3D wireframe of the East Coldstream mineralization constraining alteration domain.

To view an enhanced version of this graphic, please visit:
https://images.newsfilecorp.com/files/8051/156214_410adcab747ffab5_006full.jpg

Pete Flindell, VP Exploration for Goldshore, said “These drill results show that East Coldstream, which is well constrained by altered and mineralized shears, may be significantly larger than previously understood. Our focus will now be on developing a mineral resource based around the high-grade shears and their low-grade envelopes, which will form an important satellite to the Moss Lake Gold Project approximately 13 kilometers to the southwest.”

Table 1: Significant downhole gold intercepts

HOLE IDFROMTOLENGTH
(m)
TRUE WIDTH
(m)
CUT GRADE
(g/t Au)
UNCUT GRADE
(g/t Au)
CED-22-009497.00511.6514.6511.50.580.58
including497.00501.004.003.11.201.20
562.50590.0027.5022.50.540.54
including572.50581.008.507.01.441.44
CED-22-01076.85103.2026.3516.63.493.49
including87.55103.2015.659.95.645.64
123.30131.458.155.20.810.81
including123.30125.452.151.41.581.58
166.00176.5010.506.80.590.59
187.00191.004.002.60.560.56
206.50258.0051.5034.50.560.56
including206.50228.4021.9014.51.121.12
CED-22-011248.40251.753.352.01.491.49
including248.40251.002.601.61.731.73
284.50324.6040.1024.80.910.91
including288.00319.0031.0019.11.071.07
339.00344.505.503.50.700.70
357.00375.4518.4511.81.481.48
including370.60375.454.853.14.684.68
400.40413.9013.508.80.540.54
including400.40404.454.052.61.251.25
CED-22-012315.00347.0032.0020.70.330.33
362.80367.004.202.80.570.57
376.80381.054.252.80.520.52
CED-22-013119.00121.002.001.51.141.14
137.65149.8512.209.10.410.41
182.05200.1018.0513.90.720.72
including182.05194.4012.359.51.021.02
CED-22-01431.0033.002.000.90.960.96
119.00133.0014.006.50.390.39
218.95244.0025.0512.50.940.94
including226.00242.0016.008.01.101.10
254.95259.004.052.00.360.36
264.00280.0016.008.10.950.95
including271.00277.006.003.11.681.68
CED-22-0159.0011.002.001.30.700.70
21.0023.002.001.30.420.42
31.0033.002.001.30.330.33
118.00120.002.001.40.310.31
190.60208.0017.4012.60.850.85
including190.60195.805.203.71.201.20
and206.00208.002.001.41.951.95
CED-22-017212.80221.008.206.30.530.53
284.00286.002.001.60.680.68
298.00305.007.005.70.690.69
338.45373.6035.1529.61.231.23
including338.45350.0011.559.72.192.19
and362.90373.6010.709.11.281.28
Intersections calculated above a 0.3 g/t Au cut off with a top cut of 30 g/t Au and a maximum internal waste interval of 10 metres. Bordered intervals are intersections calculated above a 1.0 g/t Au cut off. Intervals in bold are those with a grade thickness factor exceeding 20 gram x metres / tonne gold. True widths are approximate and assume a subvertical body.

Table 2: Location of drill holes in this press release

HOLEEASTNORTHRLAZIMUTHDIPEOH
CED-22-009680,7675,386,281484341°-50°599.95
CED-22-010679,8985,386,424475161°-53°315.00
CED-22-011679,9455,386,526480155°-57°642.00
CED-22-012679,9455,386,526480180°-54°600.00
CED-22-013680,5605,386,569485340°-50°300.00
CED-22-014680,5615,386,569485341°-65°450.00
CED-22-015680,5985,386,576486340°-50°300.00
CED-22-017680,6415,386,434478341°-49°456.00
Approximate collar coordinates in NAD 83, Zone 15N

Analytical and QA/QC Procedures

All samples were sent to ALS Geochemistry in Thunder Bay for preparation and analysis was performed in the ALS Vancouver analytical facility. ALS is accredited by the Standards Council of Canada (SCC) for the Accreditation of Mineral Analysis Testing Laboratories and CAN-P-4E ISO/IEC 17025. Samples were analyzed for gold via fire assay with an AA finish (“Au-AA23”) and 48 pathfinder elements via ICP-MS after four-acid digestion (“ME-MS61”). Samples that assayed over 10 ppm Au were re-run via fire assay with a gravimetric finish (“Au-GRA21”).

In addition to ALS quality assurance / quality control (“QA/QC”) protocols, Goldshore has implemented a quality control program for all samples collected through the drilling program. The quality control program was designed by a qualified and independent third party, with a focus on the quality of analytical results for gold. Analytical results are received, imported to our secure on-line database and evaluated to meet our established guidelines to ensure that all sample batches pass industry best practice for analytical quality control. Certified reference materials are considered acceptable if values returned are within three standard deviations of the certified value reported by the manufacture of the material. In addition to the certified reference material, certified blank material is included in the sample stream to monitor contamination during sample preparation. Blank material results are assessed based on the returned gold result being less than ten times the quoted lower detection limit of the analytical method. The results of the on-going analytical quality control program are evaluated and reported to Goldshore by Orix Geoscience Inc.

Director Resignation

Doug Ramshaw has announced he will step down from the Board of Directors of the Company at the end of February 2023. Doug was instrumental in the formation of Goldshore and the preliminary launch of the initial public offering in June 2021, and is stepping down to dedicate greater time to Minera Alamos and other ventures he is involved in.

President and CEO Brett Richards stated: “Doug’s exceptional contribution to the Goldshore Board has been a testament to the broad investor awareness created around the Company’s launch and on-going development. I personally have thoroughly enjoyed working with Doug over the last two years, as he has been sound counsel to myself and the Board, and on behalf of all of us on the Board, we wish Doug the very best in his future endeavors.”

About Goldshore

Goldshore is an emerging junior gold development company, and owns 100% of the Moss Lake Gold Project located in Ontario. Wesdome is currently a large shareholder of Goldshore with an approximate 22% equity position in the Company. Well-financed and supported by an industry-leading management group, board of directors and advisory board, Goldshore is positioned to advance the Moss Lake Gold Project through the next stages of exploration and development.

Peter Flindell, P.Geo., MAusIMM, MAIG, Vice President – Exploration of the Company, a qualified person under NI 43-101 has approved the scientific and technical information contained in this news release.

Neither the TSXV nor its Regulation Services Provider (as that term is defined in the policies of the TSXV) accepts responsibility for the adequacy or accuracy of this release.

For More Information – Please Contact:

Brett A. Richards
President, Chief Executive Officer and Director
Goldshore Resources Inc.

P. +1 604 288 4416 M. +1 905 449 1500
E. brichards@goldshoreresources.com
W. www.goldshoreresources.com

Facebook: GoldShoreRes | Twitter: GoldShoreRes | LinkedIn: goldshoreres

Cautionary Note Regarding Forward-Looking Statements

This news release contains statements that constitute “forward-looking statements.” Such forward looking statements involve known and unknown risks, uncertainties and other factors that may cause the Company’s actual results, performance or achievements, or developments to differ materially from the anticipated results, performance or achievements expressed or implied by such forward-looking statements. Forward looking statements are statements that are not historical facts and are generally, but not always, identified by the words “expects,” “plans,” “anticipates,” “believes,” “intends,” “estimates,” “projects,” “potential” and similar expressions, or that events or conditions “will,” “would,” “may,” “could” or “should” occur.

Forward-looking statements in this news release include, among others, statements relating to expectations regarding the exploration and development of the Moss Lake Gold Project, the release and timing of an updated mineral resource estimate, the release of a preliminary economic assessment and other statements that are not historical facts. By their nature, forward-looking statements involve known and unknown risks, uncertainties and other factors which may cause our actual results, performance or achievements, or other future events, to be materially different from any future results, performance or achievements expressed or implied by such forward-looking statements. Such factors and risks include, among others: the Company may require additional financing from time to time in order to continue its operations which may not be available when needed or on acceptable terms and conditions acceptable; compliance with extensive government regulation; domestic and foreign laws and regulations could adversely affect the Company’s business and results of operations; the stock markets have experienced volatility that often has been unrelated to the performance of companies and these fluctuations may adversely affect the price of the Company’s securities, regardless of its operating performance; and the impact of COVID-19.

The forward-looking information contained in this news release represents the expectations of the Company as of the date of this news release and, accordingly, is subject to change after such date. Readers should not place undue importance on forward-looking information and should not rely upon this information as of any other date. The Company undertakes no obligation to update these forward-looking statements in the event that management’s beliefs, estimates or opinions, or other factors, should change.

This news release does not constitute an offer to sell, or a solicitation of an offer to buy, any securities in the United States. The securities have not been and will not be registered under the United States Securities Act of 1933, as amended (the “U.S. Securities Act”) or any state securities laws and may not be offered or sold within the United States or to U.S. Persons unless registered under the U.S. Securities Act and applicable state securities laws or an exemption from such registration is available.

To view the source version of this press release, please visit https://www.newsfilecorp.com/release/156214

Categories
Base Metals Energy Gold Shore Resources Junior Mining Precious Metals

Goldshore Intersects 9.46 g/t Au over 7.45m in the Southwest Zone

Widths of Mineralized System Expanded Significantly

Vancouver, British Columbia–(Newsfile Corp. – February 2, 2023) – Goldshore Resources Inc. (TSXV: GSHR) (OTCQB: GSHRF) (FSE: 8X00) (“Goldshore” or the “Company“), is pleased to announce assay results from its ongoing 100,000-meter drill program at the Moss Lake Project in Northwest Ontario, Canada (the “Moss Lake Gold Project“).

Highlights:

  • Hole MMD-22-063 has confirmed the presence of high-grade mineralization within the previously perceived low grade and low tonnage Southwest Zone and shown the zone to be almost 300 meters wide. Best intercepts include:
    • 1.60 g/t Au over 57.5m from 230.5m depth in MMD-22-063 including:
      • 9.46 g/t Au over 7.45m from 234.0m
    • 1.18 g/t Au over 18.25m from 387.75m
  • Results for thirteen holes drilled to explore the northern and southern flanks of the mineralized shear zone system in the Main Zone have expanded the cumulative width of multiple, close-spaced, high-grade gold shears by 150-200 meters to over 550 meters at the Main Zone with best intercepts of:
    • 0.93 g/t Au over 126.0m from 467.0m depth in MMD-22-059 including:
      • 1.64 g/t over 48.0m from 513.0m
    • 3.67 g/t Au over 13.65m from 612.35m
    • 1.05 g/t Au over 34.0m from 257.0m depth in MMD-22-088 including:
      • 1.51 g/t Au over 15.0m from 276.0m
    • 1.84 g/t Au over 14.95m from 483.05m

President and CEO, Brett Richards, stated: “These results once again support our thesis that the size and scale of the Moss Lake Gold Project will be large enough to support a material and meaningful update to the mineral resource estimate (“MRE”) in April 2023, followed by a preliminary economic assessment (“PEA”) on the updated resource. We continue to find additions to the resource on step out holes laterally and along strike from the historic resource profile, and we look to continue to explore the impact of these additions to the resource model, as well as guiding us in future drill targets.”

Technical Overview

Figure 1 shows the better intercepts in plain view and Figure 2 is a typical section through hole MMD-22-063. Table 1 shows the significant intercepts. Table 2 shows the drill hole locations.

Figure 1: Drill plan showing best of several +1 g/t Au intercepts relative to the current Mineral Resource and highlighting the additional shears.

To view an enhanced version of this graphic, please visit:
https://images.newsfilecorp.com/files/8051/153300_2909b97504e5db83_002full.jpg

Figure 2: Drill section through MMD-22-063 relative to the current Mineral Resource and highlighting the additional shears and potential to significantly deepen the open pit shell.

To view an enhanced version of this graphic, please visit:
https://images.newsfilecorp.com/files/8051/153300_2909b97504e5db83_003full.jpg

Results have been received for MMD-22-063, which was the final hole from the first pass drill pattern at the Southwest Zone. The hole infills two previous holes and has shown that there is continuity to the high-grade core of the zone. In addition to the high-grade lenses highlighted above, the hole also intersected multiple lenses of lower grade mineralization throughout the hole including 0.58 g/t Au over 23.2m from 27.9m, 0.81 g/t Au over 20.6m from 355m, and 0.55 g/t Au over 7.95m from 417.05m. These confirm the increased tonnage potential in the Southwest Zone with mineralization above the low-grade cutoff of 0.40 g/t Au used for the current mineral resource estimate over a zone that is almost 300 meters wide.

A second pass drill pattern over the Southwest zone was completed in January, infilling the newly discovered high-grade shears and exploring for additional shears.

Results have also been received for thirteen holes that have explored the edges of the Main Zone on its northern and southern flanks. Six holes targeted the northern side of the shear system, and seven holes targeted the southern side. These holes intersected high-grade shears over a zone that is 200 meters wider than previously understood, making the main zone over 550 meters wide at its widest point.

As with the center of the Main Zone, these shears lie within broad zones of low-grade mineralization within the altered diorite intrusion host. Examples include 0.84 g/t Au over 37m from 608m in MQD-22-058; 0.33 g/t Au over 35.65m from 231.35m, 0.42 g/t Au over 34m from 273m and 0.86 g/t Au over 126m from 467m in MMD-22-059; 0.58 g/t Au over 75m from 543.5m in MMD-22-060; 0.91 g/t Au over 33m from 257m in MMD-22-088; 0.58 g/t Au over 75m from 422m in MMD-22-089; 0.39 g/t Au over 40.5m from 453.8m in MQD-22-091; and 0.72 g/t Au over 15m from 207 in MMD-22-095.

The shears in the north and south were sparsely drilled by historical drill holes and represent opportunity to potentially expand the mineral resource and to properly understand the mineralizing system.

A detailed review of current and previous high-grade intercepts has identified various gold, silver, and bismuth bearing tellurides across all three zones of the Moss Lake Gold Project deposit. The tellurides have been located within pyrite±-chalcopyrite bearing quartz-chlorite-carbonate veins and sulphide-rich hydrothermal breccias previously identified in the vein paragenesis to be emplaced near the end of deformational history. Identifying and outlining the late structural events will allow for enhanced targeting of the high-grade portions of Moss Lake Gold Project and will assist in refining generative targets by focusing on preferred horizons for these structures to occur.

Figure 3: Tellurides identified at 234.1m of MQD-21-009 within a py+cpy bearing undulating qt+ch±cb shear vein. The sample yielded 39.7g/t Au, 73.7g/t Ag, 63.5g/t Te over 0.9m.

To view an enhanced version of this graphic, please visit:
https://images.newsfilecorp.com/files/8051/153300_2909b97504e5db83_004full.jpg

Pete Flindell, VP Exploration for Goldshore, said, “The high-grade drill results in the Southwest Zone provide confidence that this area has significant resource potential. The results along the northern and southern flanks of the Main Zone also represent a significant expansion to the width of the mineralized zone, which should assist our goal of potentially expanding the mineral resource and improving its quality in early Q2.”

Table 1: Significant downhole gold intercepts

HOLE IDFROMTOLENGTH
(m)
TRUE
WIDTH
(m)
CUT
GRADE

(g/t Au)
UNCUT
GRADE

(g/t Au)
MMD-22-058314.00321.007.004.10.410.41
374.90392.3017.4010.30.360.36
466.00468.302.301.40.380.38
491.70505.0013.308.10.390.39
517.00519.002.001.20.350.35
553.45574.4521.0013.30.370.37
593.00595.002.001.30.370.37
608.00645.0037.0023.90.870.87
including614.00621.007.004.51.401.40
and628.00636.008.005.21.041.04
and641.00645.004.002.61.541.54
MMD-22-059231.35307.0075.6551.80.360.36
including236.00239.203.202.21.011.01
and280.00284.004.002.71.451.45
342.00348.006.004.20.360.36
361.00392.0031.0022.00.360.36
467.00593.00126.0092.30.930.93
including475.60484.709.106.61.501.50
and504.65509.304.653.41.081.08
and513.00561.0048.0035.31.641.64
612.35626.0013.6510.22.563.67
MMD-22-06095.20102.006.803.50.400.40
336.95346.009.055.10.310.31
361.10379.0017.9010.20.700.70
including364.00368.104.102.32.142.14
475.80481.105.303.10.390.39
543.50569.0025.5016.10.790.79
584.00592.158.155.20.460.46
MMD-22-061113.55121.007.453.90.300.30
125.25130.004.752.50.310.31
213.00216.403.401.90.380.38
234.95237.002.051.10.460.46
331.65343.3011.656.70.580.58
449.00455.106.103.60.390.39
460.00462.002.001.20.640.64
570.00593.0023.0014.50.310.31
MMD-22-06327.9051.1023.2015.00.580.58
including39.0041.952.951.91.451.45
165.00169.004.002.70.530.53
230.50288.0057.5042.01.601.60
including234.00241.457.455.49.469.46
328.00330.002.001.50.890.89
355.00375.6020.6015.50.810.81
including357.00360.003.002.23.573.57
and373.00375.602.602.01.281.28
387.75406.0018.2513.81.181.18
417.05425.007.956.00.550.55
544.00546.002.001.60.310.31
MMD-22-06817.1523.005.852.90.340.34
307.00327.0020.0011.80.420.42
337.10341.404.302.50.450.45
347.95350.552.601.50.440.44
361.00376.0015.009.00.610.61
including370.00373.003.001.81.781.78
570.40581.3010.907.10.320.32
625.55672.0046.4531.30.350.35
MMD-22-06957.0063.006.003.30.770.77
266.50276.009.506.50.520.52
525.00530.005.003.50.350.35
540.15545.004.853.40.450.45
567.00569.952.952.10.610.61
581.90588.206.304.50.320.32
MMD-22-071629.85633.803.953.00.450.45
MMD-22-084194.00213.1519.1514.90.530.53
including198.00203.005.003.91.321.32
229.00231.002.001.60.470.47
255.00258.503.502.81.741.74
292.55294.552.001.60.430.43
399.00403.654.653.80.960.96
MMD-22-08855.2558.052.802.00.310.31
111.00115.554.553.30.310.31
149.00166.0017.0012.80.450.45
179.00186.007.005.30.410.41
209.70222.0012.309.40.460.46
257.00291.0034.0026.31.051.05
including276.00291.0015.0011.61.511.51
432.00434.002.001.60.460.46
444.95468.1023.1518.50.320.32
483.05498.0014.9512.01.841.84
including483.05496.0012.9510.42.042.04
MMD-22-089302.10309.006.905.10.630.63
including307.00309.002.001.51.301.30
321.00334.8013.8010.30.340.34
390.00392.002.001.50.410.41
422.00497.0075.0058.40.590.59
including431.00433.002.001.53.663.66
and444.00456.0012.009.31.051.05
and478.00488.0010.007.81.191.19
MMD-22-091153.70162.558.856.10.530.53
201.00206.955.954.20.420.42
363.55378.0014.4510.70.320.32
397.00401.554.553.40.450.45
453.80494.3040.5030.80.410.41
MMD-22-093473.25481.007.756.00.610.61
496.00512.8016.8013.20.440.44
including509.25512.803.552.81.051.05
523.00525.252.251.83.043.04
551.00555.204.203.30.320.32
587.20606.2019.0015.10.330.33
617.40620.553.152.50.330.33
628.00630.802.802.20.560.56
MMD-22-095161.20167.456.254.41.101.10
including163.00165.002.001.42.412.41
186.30190.003.702.60.330.33
207.00222.0015.0010.70.720.72
including211.65215.053.402.41.561.56
267.00276.009.006.50.460.46
including274.00276.002.001.41.611.61
373.60376.152.551.90.440.44
412.50418.005.504.10.710.71
Intersections calculated above at 0.3 g/t Au cut off with a top cut of 30 g/t Au and a maximum internal waste interval of 10 metres. Bordered intervals are intersections calculated above a 1.0 g/t Au cut off. Intervals in bold are those with a grade thickness factor exceeding 20 gram x metres / tonne gold. True widths are approximate and assume a subvertical body.

Table 2: Location of drill holes in this press release

HOLEEASTNORTHRLAZIMUTHDIPEOH
MMD-22-058668,7435,379,407454153°-60°645.00
MMD-22-059668,8195,379,436439154°-50°648.00
MMD-22-060668,9095,379,474436155°-60°600.05
MMD-22-061669,0915,379,558448155°-60°600.00
MMD-22-063668,4815,378,460439148°-50°563.00
MMD-22-068669,1775,379,614455154°-60°699.10
MMD-22-069669,2545,379,629445151°-59°600.00
MMD-22-071669,0775,378,242432335°-51°648.00
MMD-22-084668,9735,378,574428337°-45°414.15
MMD-22-088669,0315,378,642431336°45°498.00
MMD-22-089668,9725,378,560428314°-51°497.90
MMD-22-091669,1725,378,762431332°-49°494.30
MMD-22-093669,0185,378,463430289°-50°651.00
MMD-22-095669,0905,378,690428345°-45°420.00
Approximate collar coordinates in NAD 83, Zone 15N

Analytical and QA/QC Procedures

All samples were sent to ALS Geochemistry in Thunder Bay for preparation and analysis was performed in the ALS Vancouver analytical facility. ALS is accredited by the Standards Council of Canada (SCC) for the Accreditation of Mineral Analysis Testing Laboratories and CAN-P-4E ISO/IEC 17025. Samples were analyzed for gold via fire assay with an AA finish (“Au-AA23”) and 48 pathfinder elements via ICP-MS after four-acid digestion (“ME-MS61”). Samples that assayed over 10 ppm Au were re-run via fire assay with a gravimetric finish (“Au-GRA21”).

In addition to ALS quality assurance / quality control (“QA/QC”) protocols, Goldshore has implemented a quality control program for all samples collected through the drilling program. The quality control program was designed by a qualified and independent third party, with a focus on the quality of analytical results for gold. Analytical results are received, imported to our secure on-line database and evaluated to meet our established guidelines to ensure that all sample batches pass industry best practice for analytical quality control. Certified reference materials are considered acceptable if values returned are within three standard deviations of the certified value reported by the manufacture of the material. In addition to the certified reference material, certified blank material is included in the sample stream to monitor contamination during sample preparation. Blank material results are assessed based on the returned gold result being less than ten times the quoted lower detection limit of the analytical method. The results of the on-going analytical quality control program are evaluated and reported to Goldshore by Orix Geoscience Inc.

About Goldshore

Goldshore is an emerging junior gold development company, and owns 100% of the Moss Lake Gold Project located in Ontario. Wesdome is currently a large shareholder of Goldshore with an approximate 22% equity position in the Company. Well-financed and supported by an industry-leading management group, board of directors and advisory board, Goldshore is positioned to advance the Moss Lake Gold Project through the next stages of exploration and development.

Peter Flindell, P.Geo., MAusIMM, MAIG, Vice President – Exploration of the Company, a qualified person under NI 43-101 has approved the scientific and technical information contained in this news release.

Neither the TSXV nor its Regulation Services Provider (as that term is defined in the policies of the TSXV) accepts responsibility for the adequacy or accuracy of this release.

For More Information – Please Contact:

Brett A. Richards
President, Chief Executive Officer and Director
Goldshore Resources Inc.

P. +1 604 288 4416 M. +1 905 449 1500
E. brichards@goldshoreresources.com
W. www.goldshoreresources.com

Facebook: GoldShoreRes | Twitter: GoldShoreRes | LinkedIn: goldshoreres

Cautionary Note Regarding Forward-Looking Statements

This news release contains statements that constitute “forward-looking statements.” Such forward looking statements involve known and unknown risks, uncertainties and other factors that may cause the Company’s actual results, performance or achievements, or developments to differ materially from the anticipated results, performance or achievements expressed or implied by such forward-looking statements. Forward looking statements are statements that are not historical facts and are generally, but not always, identified by the words “expects,” “plans,” “anticipates,” “believes,” “intends,” “estimates,” “projects,” “potential” and similar expressions, or that events or conditions “will,” “would,” “may,” “could” or “should” occur. Forward-looking statements in this news release include, among others, statements relating to: expectations regarding the exploration and development of the Moss Lake Gold Project; an updated mineral resource estimate and the timing thereof; completion of a PEA and the timing thereof, and other statements that are not historical facts.

By their nature, forward-looking statements involve known and unknown risks, uncertainties and other factors which may cause our actual results, performance or achievements, or other future events, to be materially different from any future results, performance or achievements expressed or implied by such forward-looking statements. Such factors and risks include, among others: the Company may require additional financing from time to time in order to continue its operations which may not be available when needed or on acceptable terms and conditions acceptable; compliance with extensive government regulation; domestic and foreign laws and regulations could adversely affect the Company’s business and results of operations; the stock markets have experienced volatility that often has been unrelated to the performance of companies and these fluctuations may adversely affect the price of the Company’s securities, regardless of its operating performance; and the impact of COVID-19.

The forward-looking information contained in this news release represents the expectations of the Company as of the date of this news release and, accordingly, is subject to change after such date. Readers should not place undue importance on forward-looking information and should not rely upon this information as of any other date. The Company undertakes no obligation to update these forward-looking statements in the event that management’s beliefs, estimates or opinions, or other factors, should change.

This news release does not constitute an offer to sell, or a solicitation of an offer to buy, any securities in the United States. The securities have not been and will not be registered under the United States Securities Act of 1933, as amended (the “U.S. Securities Act”) or any state securities laws and may not be offered or sold within the United States or to U.S. Persons unless registered under the U.S. Securities Act and applicable state securities laws or an exemption from such registration is available.

To view the source version of this press release, please visit https://www.newsfilecorp.com/release/153300

Categories
Base Metals Exclusive Interviews Gold Shore Resources Junior Mining Precious Metals

Goldshore Resources – Potential Tier 1 Gold Deposit + Battery Metals

Flagship Project: The Moss Lake Property located in Ontario, Canada has 1.47 M oz of Indicated and 2.51 M oz of Inferred historical gold resources, along with a robust Preliminary Economic Assessment conducted in 2020.

Goldshore Resources – (TSX.V: GSHR | OTCQB: GSHRF)
CEO: Brett Richards
Website: https://goldshoreresources.com/
3D Deck: https://goldshoreresources.com/investors/#corporate-presentation
Company Filings: https://www.sedar.com/DisplayCompanyDocuments.do?lang=EN&issuerNo=00030293

The Best Video on Why and When to Buy and Sell Physical Precious Metals:

This image has an empty alt attribute; its file name is BitcoinSidebar.png.pagespeed.ce.6z1FEqVkO4.png

I’m a licensed broker for Miles Franklin Precious Metals InvestmentsThe Only Online Dealer that is Licensed and Bonded Period! Where we provide unlimited options to expand your precious metals portfolio, from:

Websitewww.provenandprobable.com
Call Me |855.505.1900 or email: Maurice@MilesFranklin.com
Precious Metals FAQ – https://www.milesfranklin.com/faq-maurice/

Categories
Gold Shore Resources Junior Mining Precious Metals

Goldshore Announces Filing of Technical Report for the Moss Lake Project

Vancouver, British Columbia–(Newsfile Corp. – December 12, 2022) – Goldshore Resources Inc. (TSXV: GSHR) (OTCQB: GSHRF) (FSE: 8X00) (“Goldshore” or the “Company“), further to its press release of November 15, 2022, confirms that it has filed pursuant to National Instrument 43-101 Standards of Disclosure for Mineral Projects a technical report titled “NI 43-101 Technical Report – Mineral Resource Estimate for the Moss Lake Project, Ontario, Canada” (the “Technical Report“) in connection with the 100%-owned Moss Lake Gold Project in Northwest Ontario, Canada. The Technical Report was prepared by Neal Reynolds, FAusIMM, MAIG and Matthew Field, Pr.Sci. Nat of CSA Global Consultants Canada Ltd. The independent Technical Report has an effective date of December 9, 2022. The Technical Report is available on SEDAR at www.SEDAR.com and is posted on the Company’s website at www.goldshoreresources.com.

About Goldshore

Goldshore is an emerging junior gold development company, and owns the Moss Lake Gold Project located in Ontario. Wesdome Gold Mines Ltd. is currently a large shareholder of Goldshore with an approximate 27% equity position in the Company. Well-financed and supported by an industry-leading management group, board of directors and advisory board, Goldshore is positioned to advance the Moss Lake Gold Project through the next stages of exploration and development.

Neither the TSXV nor its Regulation Services Provider (as that term is defined in the policies of the TSXV) accepts responsibility for the adequacy or accuracy of this release.

For More Information – Please Contact:

Brett A. Richards
President, Chief Executive Officer and Director
Goldshore Resources Inc.

P.  +1 604 288 4416     M. +1 905 449 1500
E.  brichards@goldshoreresources.com
W. www.goldshoreresources.com

Facebook: GoldShoreRes | Twitter: GoldShoreRes | LinkedIn: goldshoreres

Cautionary Note Regarding Forward-Looking Statements

This news release contains statements that constitute “forward-looking statements.” Such forward-looking statements involve known and unknown risks, uncertainties and other factors that may cause the Company’s actual results, performance or achievements, or developments to differ materially from the anticipated results, performance or achievements expressed or implied by such forward-looking statements. Forward-looking statements are statements that are not historical facts and are generally, but not always, identified by the words “expects,” “plans,” “anticipates,” “believes,” “intends,” “estimates,” “projects,” “potential” and similar expressions, or that events or conditions “will,” “would,” “may,” “could” or “should” occur.

Forward-looking statements in this news release include, among others, statements relating to expectations regarding the exploration and development of the Moss Lake Gold Project and other statements that are not historical facts. By their nature, forward-looking statements involve known and unknown risks, uncertainties and other factors which may cause our actual results, performance or achievements, or other future events, to be materially different from any future results, performance or achievements expressed or implied by such forward-looking statements. Such factors and risks include, among others: the Company may require additional financing from time to time in order to continue its operations which may not be available when needed or on acceptable terms and conditions acceptable; compliance with extensive government regulation; domestic and foreign laws and regulations could adversely affect the Company’s business and results of operations; the stock markets have experienced volatility that often has been unrelated to the performance of companies and these fluctuations may adversely affect the price of the Company’s securities, regardless of its operating performance; the impact of COVID-19; the ongoing military conflict in Ukraine; and other risk factors outlined in the Company’s public disclosure documents.

The forward-looking information contained in this news release represents the expectations of the Company as of the date of this news release and, accordingly, is subject to change after such date. Readers should not place undue importance on forward-looking information and should not rely upon this information as of any other date. The Company undertakes no obligation to update these forward-looking statements in the event that management’s beliefs, estimates or opinions, or other factors, should change.

To view the source version of this press release, please visit https://www.newsfilecorp.com/release/147712

Categories
Gold Shore Resources Junior Mining Precious Metals

Goldshore Intersects Additional High-Grade Shears in the QES Zone at the Moss Lake Gold Project

Vancouver, British Columbia–(Newsfile Corp. – November 28, 2022) – Goldshore Resources Inc. (TSXV: GSHR) (OTCQB: GSHRF) (FSE: 8X00) (“Goldshore” or the “Company“), is pleased to announce assay results from its ongoing 100,000-meter drill program at the Moss Lake Project in Northwest Ontario, Canada (the “Moss Lake Gold Project“).

Highlights:

  • Results for seven holes, drilled to expand the coverage of the high-grade shears in the QES Zone, have confirmed higher-grade shear-hosted gold mineralization within a large volume of well mineralized diorites. These results are all within the $1500 Whittle pit that constrains the current resource and identifies new high-grade shears. Best intercepts include:
    • 1.51 g/t Au over 6.0m from 502.0m depth in MQD-22-075 and
    • 1.47 g/t Au over 30.1m from 530.0m
    • 8.45 g/t Au over 5.0m from 576m depth in MQD-22-076 including
      • 36.9 g/t Au over 1.0m from 577m
    • 1.87 g/t Au over 6.75m from 602.25m
    • 1.31 g/t Au over 14.15m from 544.0m depth in MQD-22-080
    • 2.07 g/t Au over 6.0m from 422.0m depth in MQD-22-085 and
    • 1.07 g/t Au over 15.0m from 457.0m
    • 1.26 g/t Au over 7.15m from 573.85m
    • 1.07 g/t Au over 24.7m from 369.0m depth in MQD-22-087 and
    • 2.15 g/t Au over 5.0m from 489.0m
    • 1.75 g/t Au over 8.05m from 513.95m
    • 2.11 g/t Au over 30.75m from 536.9m including
      • 11.5 g/t Au over 3.1m from 555.2m
    • 1.31 g/t Au over 63.6m from 427.0m depth in MQD-22-090A
      • 2.07 g/t Au over 32.0m from 439.0m
  • new parallel mineralized shear structure has been discovered 150m south of the main QES system containing high grade mineralization within a sheared intermediate volcanic package with best intercepts of:
    • 3.44 g/t Au over 5.8m from 246.4m depth in MQD-22-080
    • 1.22 g/t Au over 4.0m from 206.0m depth in MQD-22-087
    • 1.15 g/t Au over 7.3m from 75.0m depth in MQD-22-090A

President and CEO Brett Richards stated: “The results from these drill holes in the QES Zone are part of a 52-hole data set that was not included in the recent mineral resource estimate. They confirm our belief that there are additional high-grade shear zones within the deposit that will potentially add to the shear domain component of the mineral resource that we anticipate will be prioritized in the mining schedule when we move towards conducting a preliminary economic analysis next year.”

Technical Overview

Figure 1 shows the better intercepts in plain view and Figure 2 is a typical section through hole MQD-22-087. Table 1 shows the significant intercepts. Table 2 shows the drill hole locations.


Figure 1: Drill plan showing best of several +1 g/t Au intercepts relative to shear and intrusion domains

To view an enhanced version of Figure 1, please visit:
https://images.newsfilecorp.com/files/8051/145867_cbaba705c4a3bbcb_002full.jpg


Figure 2: Drill section through MQD-22-0087 relative to shear and intrusion domains

To view an enhanced version of Figure 2, please visit:
https://images.newsfilecorp.com/files/8051/145867_cbaba705c4a3bbcb_003full.jpg

Results have been received for six holes that have infilled areas of the QES Zone that are between sections drilled by historic holes with collar survey problems. As a result, they will replace the low-confidence historic holes in the upcoming resource model update.

A seventh hole was drilled to the southeast of the QES Zone to investigate two historical showing along a parallel structure of the QES Zone but did not intersect significant mineralization.

As with the historic holes, these holes intersected several broad zones of low-grade mineralization within the altered diorite intrusion host. Examples include 0.77 g/t Au over 83m from 493m depth in MQD-22-075; 0.41 g/t Au over 32.45m from 437.55m and 0.71 g/t Au over 131.1m from 493m in MQD-22-076; 0.54 g/t Au over 102m from 476m and 0.39 g/t Au over 27.95m from 643m in MQD-22-080; 0.78 g/t Au over 70m from 419m and 0.50 g/t Au over 28.75m from 521.25m in MQD-22-085; 0.50 g/t Au over 115.9m from 408.1m in MQD-22-087; and 0.48 g/t Au over 27.45m from 552.05m in MQD-22-090A.

All these low-grade zones occur as envelopes to higher-grade structures that form a three-dimensional, anastomosing shear network that has developed in response to strain on the altered diorite intrusion. Results include the broad zones of +1 g/t Au mineralization shown in the highlights (e.g., 1.31 g/t Au over 63.6m from 427m depth in MQD-22-090A) and several narrow high-grade intervals, including 10.1 g/t Au over 0.7m from 545.8m and 36.9 g/t Au over 1m from 577m in MQD-22-076; 10.0 g/t Au over 1m from 427m in MQD-22-085; 20.6 g/t Au over 0.9m from 370.65m, 28.3 g/t Au over 0.3m from 540.3m and 11.5 g/t Au over 3.1m from 555.2m in MQD-22-087; and 19.4 g/t Au over 1.15m from 455.85m in MQD-22-090A.

An additional parallel shear was discovered within the intermediate volcanic package approximately 150m south of the main QES system which contains broad intercepts of low-grade mineralization including 0.91 g/t over 24.8m from 246.4m in MQD-22-080; 0.33 g/t over 45.7m from 150.0m in MQD-22-085; 0.42 g/t over 39.0m from 189.0m in MQD-22-087 containing internal higher grade intercepts including 3.44 g/t Au over 5.8m from 246.4m depth in MQD-22-080; 1.22 g/t Au over 4.0m from 206.0m depth in MQD-22-087; 1.15 g/t Au over 7.3m from 75.0m depth in MQD-22-090A.

Importantly, these intercepts have identified additional high-grade shears not modelled in the recent Mineral Resource.

Pete Flindell, VP Exploration for Goldshore, said, “These drill results confirm high-grade shears that we have modelled at the QES Zone and confirmed additional shears that we expect to include in the next mineral resource update early next year.”

Table 1: Significant downhole gold intercepts

HOLE IDFROMTOLENGTH
(m)
TRUE WIDTH
(m)
CUT GRADE
(g/t Au)
UNCUT GRADE
(g/t Au)
MQD-22-075243.00264.0021.0015.40.470.47
including254.00256.402.401.81.541.54
468.00476.908.906.80.450.45
493.00576.0083.0064.60.770.77
including502.00508.006.004.61.511.51
and530.00560.1030.1023.51.471.47
595.25610.0014.7511.70.540.54
including596.00599.003.002.41.131.13
MQD-22-076192.00196.004.002.80.460.46
214.00216.002.001.40.390.39
355.00358.153.152.40.380.38
437.55470.0032.4525.00.410.41
including453.00456.703.702.91.521.52
483.50489.405.904.60.350.35
493.00624.10131.10103.80.710.77
including545.80546.500.700.610.110.1
and576.00581.005.004.07.078.45
including577.00578.001.000.830.036.9
and602.25609.006.755.41.871.87
641.00644.003.002.40.460.46
MQD-22-08082.7586.603.852.60.350.35
131.40143.7512.358.50.630.63
181.30187.806.504.60.400.40
209.90220.8510.957.70.570.57
246.40271.2024.8017.70.910.91
including246.40252.205.804.13.443.44
355.00369.0014.0010.20.570.57
including361.70363.702.001.51.671.67
382.00385.453.452.50.630.63
398.50401.302.802.10.580.58
418.00421.003.002.20.540.54
429.20434.004.803.60.350.35
458.00460.702.702.00.590.59
476.00578.00102.0079.70.540.54
including524.00528.004.003.11.321.32
and544.00558.1514.1511.21.311.31
613.00616.003.002.40.370.37
624.10633.008.907.30.300.30
643.00670.9527.9523.10.390.39
MQD-22-08563.6074.1010.507.10.380.38
116.15118.352.201.51.571.57
150.00195.7045.7032.20.330.33
248.00250.002.001.40.390.39
256.00258.002.001.40.410.41
284.80288.053.252.40.910.91
including286.00288.052.051.51.301.30
337.00342.005.003.70.300.30
362.00371.659.657.20.310.31
382.45388.005.554.10.300.30
390.80410.9020.1015.00.310.31
419.00489.0070.0053.10.780.78
including422.00428.006.004.52.072.07
including427.00428.001.000.810.010.0
and443.00446.003.002.31.091.09
and457.00472.0015.0011.41.071.07
and481.00485.004.003.12.102.10
506.00508.002.001.50.670.67
521.25550.0028.7522.40.500.50
573.85581.007.155.71.261.26
665.20671.556.355.10.350.35
MQD-22-08778.0081.553.552.40.430.43
92.00109.0017.0011.60.330.33
189.00228.0039.0027.30.420.42
including206.00210.004.002.81.221.22
249.75261.0011.258.00.490.49
289.50298.709.206.60.420.42
including294.50296.652.151.61.071.07
342.00349.657.655.60.400.40
369.00393.7024.7018.21.071.09
including370.65371.550.900.720.620.6
408.10524.00115.9087.30.500.50
including425.30429.504.203.11.281.28
and489.00494.005.003.82.152.15
and513.95522.008.056.11.751.75
536.90567.6530.7523.62.112.11
including539.55567.6528.1021.62.232.23
including540.30540.600.300.228.328.3
and555.20558.303.102.411.511.5
579.00592.0013.0010.10.370.37
628.65634.005.354.20.480.48
MQD-22-090A75.0082.307.303.81.151.15
including78.0081.553.551.82.052.05
94.0098.004.002.10.540.54
133.00146.0013.007.00.350.35
193.00196.003.001.60.390.39
227.70230.602.901.60.530.53
238.55240.852.301.30.420.42
245.00252.257.254.00.350.35
287.35292.755.403.00.440.44
427.00490.6063.6037.71.311.31
including427.00429.002.001.21.101.10
and439.00471.0032.0019.02.072.07
including455.85457.001.150.719.419.4
503.85508.004.152.50.730.73
519.00541.0022.0013.30.350.35
including525.00527.002.001.21.471.47
552.05579.5027.4516.80.480.48
including574.00576.002.001.21.141.14
Intersections calculated above at 0.3 g/t Au cut off with a top cut of 30 g/t Au and a maximum internal waste interval of 10 metres. Bordered intervals are intersections calculated above a 1.0 g/t Au cut off. Intervals in bold are those with a grade thickness factor exceeding 20 gram x metres / tonne gold. True widths are approximate and assume a subvertical body.

Table 2: Location of drill holes in this press release

HOLEEASTNORTHRLAZIMUTHDIPEOH
MQD-22-075670,3085,379,250443336°-47°675.1
MQD-22-076670,3795,379,296442338°-47°651.0
MQD-22-080670,4625,379,398450335°-50°675.05
MQD-22-083670,6675,379,431433156°-50°630.1
MQD-22-085670,6365,379,537441336°-49°675.0
MQD-22-087670,5465,379,463449336°-49°675.0
MQD-22-090A670,6545,379,625429346°-60°606.0
Approximate collar coordinates in NAD 83, Zone 15N

Analytical and QA/QC Procedures

All samples were sent to ALS Geochemistry in Thunder Bay for preparation and analysis was performed in the ALS Vancouver analytical facility. ALS is accredited by the Standards Council of Canada (SCC) for the Accreditation of Mineral Analysis Testing Laboratories and CAN-P-4E ISO/IEC 17025. Samples were analyzed for gold via fire assay with an AA finish (“Au-AA23”) and 48 pathfinder elements via ICP-MS after four-acid digestion (“ME-MS61”). Samples that assayed over 10 ppm Au were re-run via fire assay with a gravimetric finish (“Au-GRA21”).

In addition to ALS quality assurance / quality control (“QA/QC”) protocols, Goldshore has implemented a quality control program for all samples collected through the drilling program. The quality control program was designed by a qualified and independent third party, with a focus on the quality of analytical results for gold. Analytical results are received, imported to our secure on-line database and evaluated to meet our established guidelines to ensure that all sample batches pass industry best practice for analytical quality control. Certified reference materials are considered acceptable if values returned are within three standard deviations of the certified value reported by the manufacture of the material. In addition to the certified reference material, certified blank material is included in the sample stream to monitor contamination during sample preparation. Blank material results are assessed based on the returned gold result being less than ten times the quoted lower detection limit of the analytical method. The results of the on-going analytical quality control program are evaluated and reported to Goldshore by Orix Geoscience Inc.

About Goldshore

Goldshore is an emerging junior gold development company, and owns the Moss Lake Gold Project located in Ontario. Wesdome Gold Mines Ltd. is currently a large shareholder of Goldshore with an approximate 27% equity position in the Company. Well-financed and supported by an industry-leading management group, board of directors and advisory board, Goldshore is positioned to advance the Moss Lake Gold Project through the next stages of exploration and development.

About the Moss Lake Gold Project

The Moss Lake Gold Project is located approximately 100 km west of the city of Thunder Bay, Ontario. It is accessed via Highway 11 which passes within 1 km of the property boundary to the north. The Moss Lake Gold Project covers 14,292 hectares and consists of 282 unpatented and patented mining claims.

The Moss Lake Gold Project hosts a number of gold and base metal rich deposits including the Moss Lake Deposit (Table 3), the East Coldstream Deposit (Table 4), the historically producing North Coldstream Mine (Table 5), and the Hamlin Zone, all of which occur over a mineralized trend exceeding 20 km in length.

The Moss Lake Deposit hosts an estimated inferred mineral resource of 4.17 Moz Au (see Goldshore’s news release dated November 15, 2022). A technical report is being prepared in accordance with National Instrument 43-101 (“NI 43-101“) and will be available on the Company’s website and SEDAR within 45 days of November 15, 2022.

A historical mineral resource estimate (the “East Coldstream Historical Estimate“) was completed on the East Coldstream Deposit in 2011 by Foundation Resources Inc.2,3 The East Coldstream Deposit is a shear-hosted disseminated-style gold deposit which locally outcrops at surface. It has been drilled over a 1.3 km length and to depths of 200 m with 138 holes completed between 1988 and 2017. The deposit remains largely open at depth and may have the potential for expansion along strike. Historic drill hole highlights from the East Coldstream Deposit include 4.86 g/t Au over 27.3 m in C-10-15.

The historically producing North Coldstream Mine is reported to have produced significant amounts of copper, gold and silver4 from mineralization with potential iron-oxide-copper-gold deposit style affinity. The exploration potential immediately surrounding the historic mining area is not currently well understood and historic data compilation is required.

The Hamlin Zone is a significant occurrence of copper and gold mineralization, and also of potential iron-oxide-copper-gold deposit style affinity. Between 2008 and 2011, Glencore tested Hamlin with 24 drill holes which successfully outlined a broad and intermittently mineralized zone over a strike length of 900 m. Historic drill hole highlights from the Hamlin Zone include 0.9 g/t Au and 0.35% Cu over 150.7 m in HAM-11-75.

The Moss Lake, East Coldstream and North Coldstream deposits sit on a mineral trend marked by a regionally significant deformation zone locally referred to as the Wawiag Fault Zone in the area of the Moss Lake Deposit. This deformation zone occurs over a length of approximately 20 km on the Moss Lake Gold Project and there is an area spanning approximately 7 km between the Moss Lake and East Coldstream deposits that is significantly underexplored.

Table 3: Mineral Resource Estimate (Moss Lake Deposit) 1

Inferred Resources (Domains)Tonnes
(Mt)
Grade
(g/t Au)
Contained Metal
(Moz AU)
Shear34.72.02.20
Intrusion870.71.97
TOTAL121.71.14.17

Notes:

(1) The Moss Lake Deposit hosts an estimated inferred mineral resource of 4.17 Moz Au (see Goldshore’s news release dated November 15, 2022). A technical report is being prepared in accordance with NI 43-101 and will be available on the Company’s website and SEDAR within 45 days of November 15, 2022.

Table 4: Historical Mineral Resources (East Coldstream Deposit) 2,3

INDICATEDINFERRED
TonnesGrade (g/t Au)Oz AuTonnesGrade (g/t Au)Oz Au
East Coldstream Total3,516,7000.8596,40030,533,0000.78763,276

Notes:
(2) Source: McCracken, T. “Technical Report and Resource Estimate on the Osmani Gold Deposit, Coldstream Property, Northwestern Ontario”, prepared for Foundation Resources Inc. and Alto Ventures Ltd. The East Coldstream Historical Estimate is based on a 0.4 g/t Au cut-off grade. The qualified persons for the East Coldstream Historical Estimate are Todd McCracken, P.Geo. (Tetratech Wardrop), and Jeff Wilson, Ph.D., P.Geo. (Tetratech Wardrop), and the effective date of the East Coldstream Historical Estimate is December 12, 2011. Resources are presented unconstrained, undiluted and in situ. The East Coldstream Historical Estimate includes 2 gold-bearing zones. A cut-off grade of 0.4 g/t Au was selected as the official resource cut-off grade. The East Coldstream Historical Estimate is based on 116 diamond drill holes drilled from 1986 to 2011. A fixed density of 2.78 g/cm3 was used. Capping was established at 5.89 g/t Au and 5.70 g/t Au for domains EC-1 and EC-2, respectively. This is supported by statistical analysis and the high grade distribution within the deposit. Compositing was done on drill hole sections falling within the mineralized zone solids (composite = 1 m). Resources were evaluated from drill hole samples using the ID2 interpolation method in a multi-folder percent block model using Datamine Studio 3 version 3.20.5321.0. Resource categorization is based on spatial continuity based from the variography of the assays within the drillholes. Ounce (troy) = metric tons x grade / 31.10348. Calculations used metric units (metres, tonnes and g/t). The number of metric tonnes was rounded to the nearest thousand. Any discrepancies in the totals are due to rounding effects; rounding followed the recommendations in NI 43-101.

(3) The reader is cautioned that the East Coldstream Historical Estimate is considered historical in nature and as such is based on prior data and reports prepared by previous property owners. The reader is cautioned not to treat it, or any part of it, as current mineral resources or reserves. The Company has determined this historical resource is reliable, and relevant to be included here in that it demonstrates simply the mineral potential of the Moss Lake Gold Project. A qualified person has not done sufficient work to classify the East Coldstream Historical Estimate as a current resource and Goldshore is not treating the East Coldstream Historical Estimate as a current resource. Significant data compilation, re-drilling, re-sampling and data verification may be required by a qualified person before the East Coldstream Historical Estimate can be classified as a current resource. There can be no assurance that any of the historical mineral resources, in whole or in part, will ever become economically viable. In addition, mineral resources are not mineral reserves and do not have demonstrated economic viability. Even if classified as a current resource, there is no certainty as to whether further exploration will result in any inferred mineral resources being upgraded to an indicated or measured mineral resource category. The East Coldstream Historical Estimate relating to inferred mineral resources was calculated using prior mining industry standard definitions and practices for estimating mineral resource and mineral reserves. Such prior definitions and practices were utilized prior to the implementation of the current standards of the Canadian Institute of Mining for mineral resource estimation, and have a lower level of confidence.

Table 5: Reported Historical Production (North Coldstream Deposit) 4

DepositTonnesCu %Au g/tAgCu lbsAu ozAg oz
Historical Production2,700,00001.890.565.59102,000,00044,000440,000

Note:

(4) Source: Schlanka, R., 1969. Copper, Nickel, Lead and Zinc Deposits of Ontario, Mineral Resources Circular No. 12, Ontario Geological Survey, pp. 314-316.

Peter Flindell, P.Geo., MAusIMM, MAIG, Vice President – Exploration of the Company, a qualified person under NI 43-101 has approved the scientific and technical information contained in this news release.

Neither the TSXV nor its Regulation Services Provider (as that term is defined in the policies of the TSXV) accepts responsibility for the adequacy or accuracy of this release.

For More Information – Please Contact:

Brett A. Richards
President, Chief Executive Officer and Director
Goldshore Resources Inc.

P. +1 604 288 4416 M. +1 905 449 1500
E. brichards@goldshoreresources.com
W. www.goldshoreresources.com

Facebook: GoldShoreRes | Twitter: GoldShoreRes | LinkedIn: goldshoreres

Cautionary Note Regarding Forward-Looking Statements

This news release contains statements that constitute “forward-looking statements.” Such forward looking statements involve known and unknown risks, uncertainties and other factors that may cause the Company’s actual results, performance or achievements, or developments to differ materially from the anticipated results, performance or achievements expressed or implied by such forward-looking statements. Forward looking statements are statements that are not historical facts and are generally, but not always, identified by the words “expects,” “plans,” “anticipates,” “believes,” “intends,” “estimates,” “projects,” “potential” and similar expressions, or that events or conditions “will,” “would,” “may,” “could” or “should” occur.

Forward-looking statements in this news release include, among others, statements relating to expectations regarding the exploration and development of the Moss Lake Gold Project, plans to conduct a preliminary economic assessment and timing thereof, updating the mineral resource estimates, the filing of a technical report to support the mineral resource estimate at the Moss Lake Deposit, and other statements that are not historical facts. By their nature, forward-looking statements involve known and unknown risks, uncertainties and other factors which may cause our actual results, performance or achievements, or other future events, to be materially different from any future results, performance or achievements expressed or implied by such forward-looking statements. Such factors and risks include, among others: the Company may require additional financing from time to time in order to continue its operations which may not be available when needed or on acceptable terms and conditions acceptable; compliance with extensive government regulation; domestic and foreign laws and regulations could adversely affect the Company’s business and results of operations; the stock markets have experienced volatility that often has been unrelated to the performance of companies and these fluctuations may adversely affect the price of the Company’s securities, regardless of its operating performance; the ongoing military conflict in Ukraine; and other risk factors outlined in the Company’s public disclosure documents.

The forward-looking information contained in this news release represents the expectations of the Company as of the date of this news release and, accordingly, is subject to change after such date. Readers should not place undue importance on forward-looking information and should not rely upon this information as of any other date. The Company undertakes no obligation to update these forward-looking statements in the event that management’s beliefs, estimates or opinions, or other factors, should change.

To view the source version of this press release, please visit https://www.newsfilecorp.com/release/145867

Categories
Breaking Gold Shore Resources Junior Mining Precious Metals

Goldshore Announces Open-Pit Constrained Inferred Mineral Resource Estimate of 121.7 Mt at 1.1 g/t Au and 4.17 Moz Contained Gold at Moss Lake Deposit

Vancouver, British Columbia–(Newsfile Corp. – November 15, 2022) – Goldshore Resources Inc. (TSXV: GSHR) (OTCQB: GSHRF) (FSE: 8X00) (“Goldshore” or the “Company“) is pleased to announce a mineral resource estimate (the “MRE“) for the Moss Lake deposit (the “Moss Lake Deposit“) located at its 100%-owned Moss Lake Gold Project in Northwest Ontario, Canada (the “Project” or the “Moss Lake Gold Project“).

Open-Pit Constrained Inferred Mineral Resource Estimate with an Effective Date of November 14, 2022:

Inferred Resources
(Domains)
Tonnes
(Mt)
Grade
(g/t Au)
Contained Metal
(Moz Au)
Shear34.72.02.20
Intrusion87.00.71.97
Total121.71.14.17


Note: Based on a US$1,500 per ounce gold price and economic cut-off grade of 0.40 g/t Au. Refer to complete notes on Mineral Resource Assumptions below.

  • This is a major milestone for the Company as the shear domain represents an opportunity for a high-grade open-pit gold resource.
  • There is significant and clear expansion potential through strike and dip extensions to known shears, as well as parallel shears. The Company has included 48 holes from its 2021 and 2022 drilling campaign in the new MRE and has drilled an additional 52 holes that are not included in the MRE because assays have not been received to date.
  • The current MRE represents a significant expansion over the 2013 historical estimate for the Project with 35% more tonnes and 33% more contained gold ounces.
  • The Moss Lake Gold Project is host to 29 additional targets over a 35 km trend, which the Company continues to evaluate.

President and CEO, Brett Richards, stated: “This mineral resource estimate confirms our belief that the Moss Lake Deposit is larger than previously thought. More importantly, there is a mass of higher-grade mineralization that can be prioritized in a potential phase one operation that Goldshore can build with a smaller capital requirement. Our findings on this MRE are exciting for the future of the Moss Lake Gold Project, as we now have short- and medium-term options to continue to deliver value to the Goldshore shareholders, as we explore expansions and quality increases (infill drilling to Indicated resource category) to the higher-grade resource; but also while testing other areas of known strong mineralization like East Coldstream, North Coldstream, Iris and Vanguard, across a trend of 35 km on the project.”


Figure 1: Shear domain (red) and intrusion domain (yellow) within optimized pit constraints

To view an enhanced version of Figure 1, please visit:
https://images.newsfilecorp.com/files/8051/144351_b836ade6a4de9af8_002full.jpg


Figure 2: Cross section showing extension of shear domain beneath the constraining pit shell

To view an enhanced version of Figure 2, please visit:
https://images.newsfilecorp.com/files/8051/144351_b836ade6a4de9af8_003full.jpg

Notes on MRE Assumptions (refer to table above)

  1. Numbers have been rounded to reflect the precision of an Inferred mineral resource estimate. Totals may vary due to rounding.
  2. Estimation has been completed within the two separate reported geological domains: a higher-grade shear domain which occurs within a larger lower-grade intrusive domain; modelling of domain boundaries has considered both geology and grade.
  3. Gold cut-off has been calculated based on a gold price of US$1,500/oz, mining costs of US$2.50 per tonne, processing costs of US$12.50 per tonne, and mine-site administration costs of US$2.50 per tonne processed. Metallurgical recoveries of 85% are based on prior metallurgical test work.
  4. An economic cut-off grade of 0.40 g/t Au was applied to mineralized rock in the optimized open pit for processing determination.
  5. Mineral Resources conform to NI 43-101, and the 2019 CIM Estimation of Mineral Resources & Mineral Reserves Best Practice Guidelines and 2014 CIM Definition Standards for Mineral Resources & Mineral Reserves.
  6. The Qualified Person and Company are not aware of any environmental, permitting, legal, title, taxation, socio-economic, marketing, or political factors that might materially affect the Mineral Resource estimate.
  7. Mineral resources are not mineral reserves as they do not have demonstrated economic viability. The quantity and grade of reported Inferred Resources in the MRE are uncertain in nature and there has been insufficient exploration to define these Inferred Resources as Indicated and/or Measured Resources. The Company will continue exploration intended to upgrade the Inferred Mineral Resources to Indicated Mineral Resources.

Technical Overview

Details of the MRE will be provided in a technical report with an effective date of November 14, 2022 prepared in accordance with National Instrument 43-101 (“NI 43-101“), which will be filed under the Company’s SEDAR profile within 45 days of this news release. The MRE was prepared by independent mining consulting firm CSA Global Canada (“CSA Global“), a division of ERM Consultants Canada Ltd., in accordance with the Canadian Institute of Mining, Metallurgy and Petroleum (“CIM“) Definition Standards on Mineral Resources and Reserves (2014).

Moss Lake Geology and Model

The Moss Lake Gold Deposit is a structurally controlled gold deposit within the greenstone terrain of the Archean Superior Province. Mineralization is localized where the major NE-trending Wawiag Fault Zone cuts a dioritic to granodioritic intrusive complex. The deposit is defined by a series of anastomosing centimeter- to meter-scale NE-trending shear zones carrying higher-grade gold mineralization, and lower-grade gold mineralization associated with more brittle-style deformation and veining in the intrusive rock mass between the shear zones. Mineralization is associated with pyritic sericitic and chloritic alteration and millimeter- to centimeter-scale irregular quartz-carbonate veinlets.

Detailed geological logging and multi-element geochemical analysis of drill core from the 2021-22 drilling has supported modelling of discrete shear domains within the larger altered and variably mineralized intrusive domain. The shear domains have a different higher-grade gold population to the low-grade intrusive domain and these domains have been estimated separately using different search parameters. Importantly, this allows a more accurate representation of the true variability within the deposit than has been achieved in previous estimates.

Drill Hole Data and QAQC Procedures

The Moss Lake Deposit has been evaluated by several diamond drill programs since the 1970s and earlier. The greatest number of drill holes were completed between 1986 and early 1992 by Tandem/Storimin and Noranda Inc. (311 drill holes for 86,196 meters). A smaller drilling program in 2008 served to validate the older data and lead to the completion of the historical resource estimate (“historical estimate“) by Moss Lake Gold Mines Ltd. in 2013. Following acquisition of the Moss Lake Gold Project, Goldshore commenced a drill program in 2021 that is still ongoing. The program aims to systematically redrill the deposit defined by previous campaigns and, in the process, to validate as much of the historical data as possible.

Prior to the 2008 program, there are no documented QAQC procedures or data available. Additionally, down-hole surveys were not undertaken or used an acid-bottle technique that measured dip and not azimuth. This is the case for most of the historical drilling which was completed in the late 1980s to early 1990s. The ongoing Goldshore drilling program utilizes full industry-standard survey control and QAQC programs and is designed to systematically redrill the Moss Lake Deposit and validate as much of the historical drilling as possible through collar surveys, re-logging, and re-sampling.

Mineral Resource Estimation Methodology

The current MRE is based on an improved understanding of the geological controls on gold mineralization that follows the detailed logging of 48 new drill holes (27,851.75 metres) drilled since August 2021 and with a drill hole database cut-off date of October 14, 2022. The MRE does not include the high-grade intercepts around the margins of the deposit reported on November 1, 2022.

CSA Global was provided with the wireframes for resource estimation by Goldshore. Goldshore modelled the shear zones domain using a combination of geological features and raw assay values above 1 g/t Au using explicit digitizing methods in Seequent Leapfrog 3D geological modelling software (“Leapfrog”). Goldshore modelled the intrusive domain using implicit modelling techniques in Leapfrog using a cut-off grade of 0.25 g/t Au.

CSA Global reviewed the provided wireframes to confirm validity for resource estimation. Statistical and geostatistical assessment of 1 m composites confirmed that the shear domains should be estimated within hard boundaries separating them from the intrusive domain. Statistical analysis was used to determine high-grade capping for each shear zone wireframe and ranged from 20 g/t Au to 60 g/t Au.

The MRE was estimated with a block size of 15 m x 15 m x 5 m utilizing subblocks and constrained within wireframes with a minimum width of 1.50 m. Gold content was estimated using ordinary kriging methods using dynamic anisotropy variogram models. The maximum range of the variogram models generally are between 60 m x 30 m x 10 m in the shear domain and 60 m x 60 m x 40 m in the intrusive domain. The search ellipse was constrained to selecting composites flagged within each domain and varied from half (1st), the full (2nd) and double the variogram ranges (3rd). Additional check estimates were completed using inverse distance squared (ID2) and nearest neighbour methods, the latter on bench scale composites.

Density values for 1,737 samples collected from all Goldshore drill holes were used to determine an average bulk density for each wireframed zone. Values range between 2.70 and 2.72 t/mfor the mineralized domains, 2.7 t/mfor waste rock, and 2.0 t/mfor glacial overburden.

Mineral resources are presented as undiluted and in situ. The historical underground voids from Noranda’s 1980’s exploration program have been removed from the geological model.

Mineral Resource Classification

The MRE has been classified as an Inferred Mineral Resource. This resource classification reflects the fact that the majority of the drill hole data used for the resource estimate is historical, and no QAQC data or reports exist for the majority of these drill holes. Statistical assessment of historical data and recent data provided some support for the historical data, but also included some inconsistencies. The majority of the historical drill holes did not have acceptable downhole surveys meaning that spatial location of the core samples remains uncertain especially beneath 200 m.

While the downhole surveys and QAQC methods utilized for the modern drill holes is of industry standard, these holes remain too sparsely distributed to permit confident mineral resource estimation on their own. Goldshore is now embarking on an extensive program of relogging and resampling of historical drill core, together with downhole surveying where possible. Goldshore’s program of infill and confirmatory drilling is also ongoing. It is expected that this work will support classification of Indicated mineral resource in any subsequent mineral resource updates by Goldshore.

Reasonable Prospects for Eventual Economic Extraction

To support reasonable prospects for eventual economic extraction for the MRE, CSA Global used the estimated block model to generate an optimized open pit using Datamine NPV Scheduler software and the following assumptions: a gold price of US$1,500/oz, plant recovery of 85%, processing costs of US$12.50/tonne, mine-site general and administration costs of US$2.50/tonne processed, mining costs of US$2.50/tonne moved and an overall pit slope angle of 50 degrees. NPV Scheduler Software is widely used by mining engineers to apply the Lerchs-Grossman algorithm to block models in order to generate optimized pit shells upon which economic open pit mine designs may be based.

The MRE is constrained within the selected optimized pit shell which reaches a maximum depth of approximately 580 m.

Figures 1 and 2 above show the relationship of the shear and intrusion domains within the optimized pit shell.

Additional Exploration Potential

The modelled shear-hosted domains extend at depth below the optimized open-pit constraining the reported MRE, but the drill hole data are too sparsely distributed to support underground mining optimization studies and reporting of an underground-constrained MRE at this time.

The shears are also open along strike, beyond the modelled strike length of 3.5 km. Historical drilling intercepted gold mineralization over a total strike length of 8 km, which has been a focus of Goldshore’s summer soil geochemistry and structural mapping programs. Furthermore, there remains potential for additional parallel shears with gold mineralization in historical drill holes 500 m to the southeast of the Moss Lake Deposit.

Figure 3 shows the location of mineralized drill holes along and parallel to the strike of the MRE.


Figure 3: Mineralized zones showing the exploration upside along strike and in parallel structures

To view an enhanced version of Figure 3, please visit:
https://images.newsfilecorp.com/files/8051/144351_b836ade6a4de9af8_004full.jpg

Next Steps

Goldshore has commenced an extensive program of relogging and resampling of all historical drill holes whose collars have been located and accurately surveyed. Where possible, these drill holes will also be surveyed using modern downhole surveying equipment.

Notwithstanding the above, a large proportion of the historical drill collars have not been located. The mineralized volumes defined by these historical drill holes will be redrilled in an optimized pattern to accurately define the shear-hosted and intrusive domain mineralization. This will include a full suite of oriented core measurements and multi-element geochemistry analyses.

Work has also commenced on a comprehensive metallurgical testing program led by Ausenco. This work will include a mineral deportment study, grinding tests, gravity separation, flotation, heap leach, and cyanide leach optimization studies. Once complete, Goldshore expects to commence a preliminary economic assessment to evaluate several mining and processing strategies with a view to selecting the most economic and achievable development option. This study is expected to be completed in 2023.

Infill drilling, re-sampling of historical drill holes, and geological modelling will continue throughout the coming months to support a mineral resource estimate update to attempt to upgrade the resource classification from Inferred Resources to Indicated Resources. This work is targeted for completion by the end of 2023 when the Company expects to commence a prefeasibility mining study.

Pete Flindell, VP Exploration for Goldshore, said, “This mineral resource estimate confirms our understanding that high grade shears form the core of the Moss Lake Deposit and will drive the development of the Moss Lake Gold Project. The Inferred Mineral Resource reflects uncertainty in the collar and downhole surveys of the historical drill holes, as well as the selective sampling technique and lack of oriented core measurements that are critical in directing the high-grade structures that drive the overall estimate. While additional drilling is required to replace many of the historical drill holes and infill gaps in the model, we will be aiming to recover as many of these historical holes as possible by relogging and resampling core and conducting downhole surveys using more accurate survey equipment.

Qualified Person Statements

Dr. Matthew Field (Pr. Sci. Nat), Manager – Resources at CSA Global is an independent Qualified Person under NI 43-101 and responsible for the MRE. Dr. Field has prepared and approved the scientific and technical information related to the MRE contained in this news release.

Peter Flindell, P.Geo., MAusIMM, MAIG, Vice President – Exploration of the Company, and a Qualified Person under NI 43-101 has also reviewed and approved the scientific and technical information contained in this news release.

About Goldshore

Goldshore is an emerging junior gold development company, and owns the Moss Lake Gold Project located in Ontario. Wesdome Gold Mines Ltd. is currently a large shareholder of Goldshore with an approximate 27% equity position in the Company. Well-financed and supported by an industry-leading management group, board of directors and advisory board, Goldshore is positioned to advance the Moss Lake Gold Project through the next stages of exploration and development.

Neither the TSXV nor its Regulation Services Provider (as that term is defined in the policies of the TSXV) accepts responsibility for the adequacy or accuracy of this release.

For More Information – Please Contact:

Brett A. Richards
President, Chief Executive Officer and Director
Goldshore Resources Inc.
P. +1 604 288 4416         M. +1 905 449 1500
E. brichards@goldshoreresources.com
W. www.goldshoreresources.com

Facebook: GoldShoreRes | Twitter: GoldShoreRes | LinkedIn: goldshoreres

Cautionary Note Regarding Forward-Looking Statements

This news release contains statements that constitute “forward-looking statements.” Such forward-looking statements involve known and unknown risks, uncertainties and other factors that may cause the Company’s actual results, performance or achievements, or developments to differ materially from the anticipated results, performance or achievements expressed or implied by such forward-looking statements. Forward-looking statements are statements that are not historical facts and are generally, but not always, identified by the words “expects,” “plans,” “anticipates,” “believes,” “intends,” “estimates,” “projects,” “potential” and similar expressions, or that events or conditions “will,” “would,” “may,” “could” or “should” occur.

Forward-looking statements in this news release include, among others, statements relating to expectations regarding the exploration and development of the Project, the filing of a technical report supporting the MRE, commencement of a preliminary economic assessment and prefeasibility study, and other statements that are not historical facts. By their nature, forward-looking statements involve known and unknown risks, uncertainties and other factors which may cause our actual results, performance or achievements, or other future events, to be materially different from any future results, performance or achievements expressed or implied by such forward-looking statements. Such factors and risks include, among others: the Company may require additional financing from time to time in order to continue its operations which may not be available when needed or on acceptable terms and conditions acceptable; compliance with extensive government regulation; domestic and foreign laws and regulations could adversely affect the Company’s business and results of operations; the stock markets have experienced volatility that often has been unrelated to the performance of companies and these fluctuations may adversely affect the price of the Company’s securities, regardless of its operating performance; the impact of COVID-19; the ongoing military conflict in Ukraine; and other risk factors outlined in the Company’s public disclosure documents.

The forward-looking information contained in this news release represents the expectations of the Company as of the date of this news release and, accordingly, is subject to change after such date. Readers should not place undue importance on forward-looking information and should not rely upon this information as of any other date. The Company undertakes no obligation to update these forward-looking statements in the event that management’s beliefs, estimates or opinions, or other factors, should change.

To view the source version of this press release, please visit https://www.newsfilecorp.com/release/144351

Categories
Gold Shore Resources Junior Mining Precious Metals

IIROC Trading Halt – GSHR

VANCOUVER, BC, Nov. 15, 2022 /CNW/ – The following issues have been halted by IIROC:

Company: Goldshore Resources Inc.

TSX-Venture Symbol: GSHR

All Issues: Yes

Reason: Pending News

Halt Time (ET): 10:08 AM

IIROC can make a decision to impose a temporary suspension (halt) of trading in a security of a publicly-listed company. Trading halts are implemented to ensure a fair and orderly market. IIROC is the national self-regulatory organization which oversees all investment dealers and trading activity on debt and equity marketplaces in Canada.

SOURCE Investment Industry Regulatory Organization of Canada (IIROC) – Halts/Resumptions

Cision
Cision

View original content: http://www.newswire.ca/en/releases/archive/November2022/15/c5573.html

Categories
Gold Shore Resources Junior Mining

Goldshore Resources Inc. Invitation to Deutsch Goldmesse

Vancouver, British Columbia–(Newsfile Corp. – November 7, 2022) – Goldshore Resources Inc (TSXV: GSHR) will be participating in the Deutsche Goldmesse, which will take place on November 18th and 19th at The Westin Grand Frankfurt.

Members of the Goldshore Resources Inc management will be taking meetings throughout the day, and also present at 01:45pm CET on November 19th to an audience of European investors.

An online registration form is available, and investors can register to attend at: https://deutschegoldmesse.online/investor-registration/.

Kai Hoffmann, Managing Director of Soar Financial Partners, remarked, “We are excited to host our 3rd in-person premier mining investment event, bringing together carefully selected mining and exploration companies with the European investment community over the course of two days. We anticipate this to be our largest conference yet, and we are pleased to welcome again an astute line-up of keynote speakers.”

The Deutsche Goldmesse website is continuously being updated concerning attending companies, keynote speakers, agenda, etc.: www.deutschegoldmesse.com

About Goldshore Resources Inc

Goldshore Resources Inc. (TSXV: GSHR) (OTCQB: GSHRF) (FSE: 8X00F)Goldshore is an emerging well-financed junior gold developer, who acquired the Moss Lake Gold Project (Ontario, Canada) from Wesdome Gold Mines Ltd. In January 2021. The Moss Lake Project has a historical resource of c.1.5M oz Indicated and c.2.5M oz. Inferred and is conducting an extensive exploration strategy, including a 100,000m drilling program. As well, The Moss Lake Project has a historical copper mine (North Coldstream Mine) on its land package (operated by Noranda/Xstrata – 1954-1992), and significant other copper/gold targets to be tested going forward. Goldshore’s Moss Lake Project holds a large land package in North-western Ontario. The project displays significant resource potential, as Goldshore takes the project through its next stages of exploration and development, towards an updated mineral resource estimation (MRE) in Q4 2022; followed by updated preliminary economic assessment (PEA) in Q1 2023 and visibility towards feasibility study (FS) thereafter.

About Deutsche Goldmesse

Deutsche Goldmesse is Germany’s premier mining investment conference, based out of Frankfurt – one of Europe’s most important financial capitals. We bring together leading minds in the industry to foster new business opportunities and facilitate valuable relationships. The exclusive two-day event showcases industry-leading keynote speakers and up to 35 carefully considered companies in a range of commodities and stages from explorers to producers.

Hosted by Soar Financial Partners, we provide a platform where top company management can connect with a vast network of European institutional and HNW investors, retail investors, analysts, influencers, newsletter writers, media, and other local partners.

For further information:
Goldshore Resources Inc
Brett A Richards
Chief Executive Officer
19054491500
brett@brettrichards.org
www.goldshoreresources.com

Categories
Gold Shore Resources Junior Mining Precious Metals

Goldshore Intersects 1.34 g/t Au over 90.95m in 100 Meter Step-Out to the North

Vancouver, British Columbia–(Newsfile Corp. – November 2, 2022) – Goldshore Resources Inc. (TSXV: GSHR) (OTCQB: GSHRF) (FSE: 8X00) (“Goldshore” or the “Company“), is pleased to announce assay results from its ongoing 100,000-meter drill program at the Moss Lake Project in Northwest Ontario, Canada (the “Moss Lake Gold Project“).

Highlights:

  • Results for eight holes, drilled to both expand and infill historic but poorly surveyed drill sections in the Main Zone, have confirmed higher-grade gold mineralization within a large volume of well mineralized diorite with best intercepts of:
  • Results for four holes, drilled to evaluate the under-drilled Southwest Zone, have confirmed narrow higher-grade gold mineralized structures with best intercepts of:

President and CEO Brett Richards stated: “Throughout our entire drilling campaign from 2021 to now, we have consistently and repeatedly delivered promising drill results, indicating not only the size and scale potential of the Moss Lake Project, but also the quality of the higher-grade areas of the deposit. As we illustrated at the end of H1 2022, our focus turned from identifying and drilling the size of the global resource; to identifying the high(er) grade sections contained within the historical resource (and stepped out from the historical resource), and focusing on building a much smaller open pit project PEA around this. The results from this change in focus are evident in press releases in H1 2022 and Q3 2022, and continue with the results highlighted today. To that end, we are expediting our independent mineral resource estimate (“MRE“) on the high(er) grade sections within the historical resource, and look to have the results of this MRE presented to the market by the end of 2022, versus the end of Q1 2023, as previously guided. This will also lead to the Company accelerating a preliminary economic assessment (“PEA“) on a smaller, high(er) grade resource, but much more manageable project in terms of CapEx and project timeline, versus a large-scale project PEA on an updated larger resource similar to the historic resource. The target delivery to the market of the economic results of the PEA is slated for the end of Q1 2023, under current market conditions and circumstances, versus the end of Q2 2023, as previously guided.”

Technical Overview

Figure 1 shows the better intercepts in plain view and Figure 2 is a typical section through hole MMD-22-057.

Figure 1: Drill plan showing best of several +1 g/t Au intercepts relative to implicit modelled grade shells

To view an enhanced version of Figure 1, please visit:
https://images.newsfilecorp.com/files/8051/142661_77d166be4416c9d5_002full.jpg

Figure 2: Drill section through MMD-22-057 relative to implicit modelled grade shells showing 100-meter step out to the north

To view an enhanced version of Figure 2, please visit:
https://images.newsfilecorp.com/files/8051/142661_77d166be4416c9d5_003full.jpg

Over the last month, results have been received for eighteen holes, including:

  • Eight holes that have infilled areas of the Main Zone that are between sections drilled by historic holes with collar survey problems. They will replace the low-confidence historic holes in the upcoming resource model update.
  • Four holes drilled to evaluate the under-drilled Southwest Zone.
  • Five holes testing the margins of the main +1 g/t Au zones that provide valuable geological information in these marginal areas.

As with the historic holes, the Main and Southwest Zone holes intersected several broad zones of low-grade mineralization within the altered diorite intrusion host. Examples include 0.98 g/t Au over 50.9m from 51m and 0.32 g/t Au over 122m from 473m depth in MMD-22-036; 0.48 g/t Au over 88m from 388m and 0.53 g/t Au over 33m from 279m depth in MMD-22-042; 0.46 g/t Au over 133m from 443m depth and 0.35 g/t Au over 29.25m from 316.85m depth in MMD-22-048; 0.70 g/t Au over 126m from 335m depth and 0.89 g/t Au over 60.6m from 120.4m depth in MMD-22-053; 0.80 g/t Au over 25.35m from 563.65m depth in MMD-22-055; 0.64 g/t Au over 44m from 168m depth and 0.63 g/t Au over 33.65m from 237.35m depth in MMD-22-064; 0.47 g/t Au over 38.1m from 615.45m depth in MMD-22-066; and 0.46 g/t Au over 27.65m from 366.25m depth in MMD-22-078.

All these low-grade zones occur as envelopes to higher-grade structures that form a three-dimensional, anastomosing shear network that has developed in response to strain on the altered diorite intrusion. Results include the broad zones of +1 g/t Au mineralization shown in the highlights (e.g., 1.34 g/t Au over 90.95m from 254.05m depth in MMD-22-057) and several narrow high-grade intervals, including better intercepts of 39.3 g/t Au over 0.7m from 90.45m depth in MMD-22-036; 47.4 g/t Au over 0.5m from 420.25m depth in MMD-22-052; 11.4 g/t Au over 2.35m from 549m depth in MMD-22-056; 26.7 g/t Au over 1m from 287m depth in MMD-22-057; and 231 g/t Au over 0.35m from 182.75m depth in MMD-22-064.

Four holes were drilled into the Link zone and potential overlap between the QES zone and Moss Main zone to properly define the boundaries of each zone and to better understand the behavior of the southern edge of the altered diorite package. These dominantly drilled through the lesser altered and deformed porphyritic diorite phase containing several narrow lenses of low-grade mineralization as indicated by the historic drill results.

Geological modelling of the altered diorite host rock and anastomosing shear network at Moss Lake has progressed faster than anticipated and is now complete. As a result, the Company has embarked on an independent resource modelling exercise and has engaged international consulting group, CSA Global (an ERM group company) to complete this work. This will lead to a new Mineral Resource estimate that will be reported following National Instrument 43-101 standards for disclosure. This new estimate will be published before the end of 2022.

Pete Flindell, VP Exploration for Goldshore, said, “These drill results continue the vein of local high grade gold mineralization that bulks out to produce 50- to 200-meter-wide zones of +1 g/t Au gold mineralization within a “sea” of low-grade mineralization. This style of mineralization is capable of producing large, low-grade gold resources with a significant volume of higher-grade mineralization. We anticipate that this should, with the selection of the appropriate gold price for the constraining Whittle shell, allow the reporting of a smaller, higher-grade resource at the Moss Lake Project.”

Table 1 shows the significant intercepts and Table 2 shows the drill hole locations.

Table 1: Significant downhole gold intercepts

ZONEHOLE IDFROMTOLENGTH (m)TRUE WIDTH (m)CUT GRADE
(g/t Au)
UNCUT GRADE
(g/t Au)
MAINMMD-22-03622.0035.8013.804.40.620.62
51.00101.9050.9016.60.981.11
including62.5067.354.851.61.391.39
and84.5094.009.503.13.704.38
238.50256.3017.806.10.470.47
276.40286.209.803.40.460.46
including279.00281.852.851.01.011.01
419.10446.5027.4010.00.360.36
including420.00422.002.000.71.841.84
473.00595.00122.0047.40.320.32
613.45619.956.502.60.360.36
631.00634.753.751.50.470.47
671.45686.0014.555.80.350.35
MAINMMD-22-048190.00192.402.401.50.780.78
220.00227.007.004.30.540.54
277.60285.007.404.50.340.34
316.85346.1029.2518.00.350.35
373.55400.0026.4516.31.051.05
including388.00399.1511.156.91.601.60
443.00576.00133.0084.20.460.46
including446.00458.2012.207.61.081.08
and467.90472.004.102.61.371.37
and521.00538.3517.3511.11.031.03
602.00614.0012.007.80.310.31
620.00635.4015.4010.00.560.56
MAINMMD-22-052104.35111.006.653.40.460.46
138.00140.002.001.10.310.31
274.25277.303.051.70.440.44
311.15313.352.201.30.350.35
MAINMMD-22-05318.0027.009.004.90.390.39
33.0038.005.002.70.420.42
49.3566.3016.959.10.370.37
77.0081.454.452.41.581.58
including77.7581.453.702.01.811.81
92.20100.208.004.21.631.63
including92.2098.005.803.12.102.10
120.40181.0060.6032.10.890.89
including121.00139.0018.009.51.801.80
and158.00167.009.004.81.721.72
201.00205.004.002.10.530.53
222.00225.003.001.65.245.24
248.00263.0015.007.80.380.38
285.00304.0019.009.90.350.35
310.60313.002.401.30.350.35
335.00461.00126.0065.60.700.70
including341.00344.003.001.61.141.14
and355.60399.2543.6522.71.301.30
and444.00450.006.003.11.631.63
487.75490.002.251.20.570.57
MAINMMD-22-054383.00389.606.602.10.420.42
429.40434.304.901.60.510.51
531.05539.007.952.60.310.31
MAINMMD-22-055168.00182.8514.858.40.300.30
212.00215.003.001.70.730.73
360.60374.9014.307.81.071.07
including364.00374.9010.905.91.281.28
525.40528.252.851.61.551.55
563.65589.0025.3514.20.800.80
including581.05583.802.751.63.083.08
600.00612.1012.106.90.360.36
MAINMMD-22-056181.00185.604.602.10.520.52
221.00225.004.001.80.380.38
267.00270.353.351.50.340.34
287.85296.008.153.70.630.63
336.35342.255.902.60.620.62
353.70358.454.752.10.350.35
379.40387.658.253.61.201.20
441.00461.5020.508.90.490.49
502.00561.9059.9025.51.021.02
including509.00511.002.000.93.163.16
and542.00551.359.354.04.784.78
593.30598.004.702.00.380.38
MAINMMD-22-05718.1026.258.152.82.662.66
40.9043.102.200.80.460.46
254.05345.0090.9534.21.341.34
including260.40272.4012.004.52.422.42
and283.55299.9516.406.24.024.02
and312.00328.7516.756.31.041.04
366.00371.255.252.01.111.11
382.00385.003.001.20.700.70
457.50461.003.501.40.360.36
552.40559.006.602.70.360.36
570.00583.0013.005.50.340.34
594.00599.005.002.10.340.34
SWMMD-22-04236.9541.004.052.70.870.87
106.65110.754.103.00.490.49
209.00212.053.052.50.500.50
239.00241.002.001.70.430.43
256.55266.009.458.10.970.97
including261.95266.004.053.51.771.77
279.00312.0033.0029.00.530.53
330.00341.0011.0010.00.940.94
366.00377.0011.0010.20.740.74
including370.00377.007.006.51.081.08
388.00476.0088.0084.10.480.48
including388.00396.258.257.72.262.26
SWMMD-22-050162.00168.356.355.00.680.68
194.40207.1012.7010.40.480.48
300.15312.9012.7511.40.820.82
including303.00311.008.007.11.101.10
SWMMD-22-06428.0031.853.852.51.421.42
42.4555.1012.658.20.920.92
168.00212.0044.0029.90.642.24
including182.00185.503.502.43.6423.70
237.35271.0033.6523.20.630.63
including250.25252.402.151.51.591.59
SWMMD-22-066451.00453.252.251.70.580.58
559.35572.0012.659.70.310.31
586.00589.003.002.30.390.39
599.00609.5510.558.20.360.36
615.45653.5538.1030.10.470.47
including625.00627.002.001.61.081.08
LINKMMD-22-074603.85607.904.053.10.660.66
LINKMMD-22-07862.5567.905.353.60.400.40
366.25393.9027.6520.10.460.46
422.55425.502.952.20.310.31
447.80455.407.605.70.640.64
including452.20455.403.202.41.081.08
492.25498.406.154.60.310.31
LINKMMD-22-08183.0091.008.005.60.450.45
253.20257.654.453.30.640.64
286.55295.008.456.30.510.51
335.00353.9518.9514.40.300.30
LINKMMD-22-082122.00131.009.006.50.740.74
including122.00124.002.001.51.221.22
147.00149.002.001.50.510.51
167.00178.0011.008.20.900.90
including172.00175.003.002.21.341.34
Intersections calculated above a 0.3 g/t Au cut off with a top cut of 30 g/t Au and a maximum internal waste interval of 10 metres. Bordered intervals are intersections calculated above a 1.0 g/t Au cut off. Intervals in bold are those with a grade thickness factor exceeding 20 gram x metres / tonne gold. True widths are approximate and assume a subvertical body.

Table 2: Location of drill holes in this press release

ZONEHOLEEASTNORTHRLAZIMUTHDIPEOH
MAINMMD-22-036668,8685,379,279441154°-71°690.00
SWMMD-22-042668,5205,378,529436158°-50°516.00
MAINMMD-22-048668,7055,379,209435155°-52°690.00
SWMMD-22-050668,5175,378,529437110°-50°464.00
MAINMMD-22-052668,9945,379,542438155°-60°597.30
MAINMMD-22-053669,0145,379,307427154°-61°605.85
MAINMMD-22-054668,7055,379,209435150°-70°576.00
MAINMMD-22-055668,7215,379,279443154°-59°618.00
MAINMMD-22-056668,8015,379,340438151°-61°600.00
MAINMMD-22-057668,8875,379,368437154°-70°603.00
SWMMD-22-064668,4815,378,460439109°-51°407.15
SWMMD-22-066669,0775,378,242432290°-50°654.30
LINKMMD-22-074669,2415,378,339430335°-51°660.85
LINKMMD-22-077669,6595,379,054432335°-60°12.00
LINKMMD-22-078669,6595,379,055432337°-50°603.00
LINKMMD-22-079669,5735,379,011437336°-50°333.00
LINKMMD-22-081669,4695,378,982428334°-48°375.00
LINKMMD-22-082669,2485,378,768437335°-46°347.85

Analytical and QA/QC Procedures

All samples were sent to ALS Geochemistry in Thunder Bay for preparation and analysis was performed in the ALS Vancouver analytical facility. ALS is accredited by the Standards Council of Canada (SCC) for the Accreditation of Mineral Analysis Testing Laboratories and CAN-P-4E ISO/IEC 17025. Samples were analyzed for gold via fire assay with an AA finish (“Au-AA23”) and 48 pathfinder elements via ICP-MS after four-acid digestion (“ME-MS61”). Samples that assayed over 10 ppm Au were re-run via fire assay with a gravimetric finish (“Au-GRA21”).

In addition to ALS quality assurance / quality control (“QA/QC”) protocols, Goldshore has implemented a quality control program for all samples collected through the drilling program. The quality control program was designed by a qualified and independent third party, with a focus on the quality of analytical results for gold. Analytical results are received, imported to our secure on-line database and evaluated to meet our established guidelines to ensure that all sample batches pass industry best practice for analytical quality control. Certified reference materials are considered acceptable if values returned are within three standard deviations of the certified value reported by the manufacture of the material. In addition to the certified reference material, certified blank material is included in the sample stream to monitor contamination during sample preparation. Blank material results are assessed based on the returned gold result being less than ten times the quoted lower detection limit of the analytical method. The results of the on-going analytical quality control program are evaluated and reported to Goldshore by Orix Geoscience Inc.

About Goldshore

Goldshore is an emerging junior gold development company, and owns the Moss Lake Gold Project located in Ontario. Wesdome is currently a large shareholder of Goldshore with an approximate 27% equity position in the Company. Well-financed and supported by an industry-leading management group, board of directors and advisory board, Goldshore is positioned to advance the Moss Lake Gold Project through the next stages of exploration and development.

About the Moss Lake Gold Project

The Moss Lake Gold Project is located approximately 100 km west of the city of Thunder Bay, Ontario. It is accessed via Highway 11 which passes within 1 km of the property boundary to the north. The Moss Lake Gold Project covers 14,292 hectares and consists of 282 unpatented and patented mining claims.

The Moss Lake Gold Project hosts a number of gold and base metal rich deposits including the Moss Lake Deposit, the East Coldstream Deposit (Table 3), the historically producing North Coldstream Mine (Table 4), and the Hamlin Zone, all of which occur over a mineralized trend exceeding 20 km in length. A historical preliminary economic assessment (the “Moss Lake Historical Estimate“) was completed on the Moss Lake Gold Project in 2013 and published by Moss Lake Gold Mines Ltd. (“Moss Lake Gold Mines“)1,3. A historical mineral resource estimate (the “East Coldstream Historical Estimate“) was completed on the East Coldstream Deposit in 2011 by Foundation Resources Inc.2,3 In addition to these zones, the Moss Lake Gold Project also hosts a number of under-explored mineral occurrences which are reported to exist both at surface and in historically drilled holes. The Moss Lake Deposit is a shear-hosted disseminated-style gold deposit which outcrops at surface. It has been drilled over a 2.5 km length and to depths of 300 m with 376 holes completed between 1983 and 2017. The last drilling program conducted in 2016 and 2017 by Wesdome Gold Mines Ltd. (“Wesdome“), which consisted of widely spaced holes along the strike extension of the deposit was successful in expanding the mineralized footprint and hydrothermal system 1.6 km to the northeast. Additionally, the deposit remains largely open to depth. In 2017, Wesdome completed an induced polarization survey which traced the potential extensions of pyrite mineralization associated with the Moss Lake Deposit over a total strike length of 8 km and spanning the entire extent of the survey grids.

The East Coldstream Deposit is a shear-hosted disseminated-style gold deposit which locally outcrops at surface. It has been drilled over a 1.3 km length and to depths of 200 m with 138 holes completed between 1988 and 2017. The deposit remains largely open at depth and may have the potential for expansion along strike. Historic drill hole highlights from the East Coldstream Deposit include 4.86 g/t Au over 27.3 m in C-10-15.

The historically producing North Coldstream Mine is reported to have produced significant amounts of copper, gold and silver4 from mineralization with potential iron-oxide-copper-gold deposit style affinity. The exploration potential immediately surrounding the historic mining area is not currently well understood and historic data compilation is required.

The Hamlin Zone is a significant occurrence of copper and gold mineralization, and also of potential iron-oxide-copper-gold deposit style affinity. Between 2008 and 2011, Glencore tested Hamlin with 24 drill holes which successfully outlined a broad and intermittently mineralized zone over a strike length of 900 m. Historic drill hole highlights from the Hamlin Zone include 0.9 g/t Au and 0.35% Cu over 150.7 m in HAM-11-75.

The Moss Lake, East Coldstream and North Coldstream deposits sit on a mineral trend marked by a regionally significant deformation zone locally referred to as the Wawiag Fault Zone in the area of the Moss Lake Deposit. This deformation zone occurs over a length of approximately 20 km on the Moss Lake Gold Project and there is an area spanning approximately 7 km between the Moss Lake and East Coldstream deposits that is significantly underexplored.

Table 3: Historical Mineral Resources1,2,3

INDICATEDINFERRED
DepositTonnesAu g/tAu ozTonnesAu g/tAu oz
Moss Lake Historical Estimate
Open Pit Potential39,795,0001.11,377,30048,904,0001.01,616,300
Underground Potential1,461,1002.9135,400
Moss Lake Total39,795,0001.11,377,30050,364,0001.11,751,600
East Coldstream Historical Estimate
East Coldstream Total3,516,7000.8596,40030,533,0000.78763,276
Combined Total43,311,7001.081,473,70080,897,0000.982,514,876

Notes:

(1) Source: Poirier, S., Patrick, G.A., Richard, P.L., and Palich, J. “Technical Report and Preliminary Economic Assessment for the Moss Lake Project”, prepared for Moss Lake Gold Mines Ltd. The qualified persons for the Moss Lake Historical Estimate are Pierre-Luc Richard, MSc, PGeo (InnovExplo Inc), and Carl Pelletier, BSc, PGeo (InnovExplo Inc), and the effective date of the Moss Lake Historical Estimate is February 8, 2013. In-Pit results are presented undiluted and in situ, within Whittle-optimized pit shells. Underground results are presented undiluted and in situ, outside Whittle-optimized pit shells. The Moss Lake Historical Estimate includes 18 gold-bearing zones and 1 envelope containing isolated gold intercepts. Whittle parameters: mining cost = C$2.28; pit slope angle = 50.0 degrees; production cost = C$9.55; mining Dilution = 5%; mining recovery = 95%; processing recovery = 80% to 85%; gold price = C$1,500. In-Pit and Underground resources were compiled at cut-off grades from 0.3 to 5.0 g/t Au (for sensitivity characterization). A cut-off grade of 0.5 g/t Au was selected as the official in-pit cut-off grade and a cut-off grade of 2.0 g/t Au was selected as the official underground cut-off grade. The Moss Lake Historical Estimate is based on 352 diamond drill holes (90,978 m) drilled from 1983 and 2008. A fixed density of 2.78 g/cm3 was used. A minimum true thickness of 5.0 m was applied, using the grade of the adjacent material when assayed or a value of zero when not assayed. Capping was established at 35 g/t Au, supported by statistical analysis and the high grade distribution within the deposit. Compositing was done on drill hole sections falling within the mineralized zone solids (composite = 1 m). Resources were evaluated from drill hole samples using the ID2 interpolation method in a multi-folder percent block model using Gems version 6.4. Based on geostatistics, the ellipse range for interpolation was 75m x 67.5m x 40m. The Indicated category is defined by combining the blocks within the two main zones and various statistical criteria, such as average distance to composites, distance to closest composite, quantity of drill holes within the search area. Ounce (troy) = metric tons x grade / 31.10348. Calculations used metric units (metres, tonnes and g/t). The number of metric tonnes was rounded to the nearest thousand. Any discrepancies in the totals are due to rounding effects; rounding followed the recommendations in NI 43-101.

(2) Source: McCracken, T. “Technical Report and Resource Estimate on the Osmani Gold Deposit, Coldstream Property, Northwestern Ontario”, prepared for Foundation Resources Inc. and Alto Ventures Ltd. The East Coldstream Historical Estimate is based on a 0.4 g/t Au cut-off grade. The qualified persons for the East Coldstream Historical Estimate are Todd McCracken, P.Geo. (Tetratech Wardrop), and Jeff Wilson, Ph.D., P.Geo. (Tetratech Wardrop), and the effective date of the East Coldstream Historical Estimate is December 12, 2011. Resources are presented unconstrained, undiluted and in situ. The East Coldstream Historical Estimate includes 2 gold-bearing zones. A cut-off grade of 0.4 g/t Au was selected as the official resource cut-off grade. The East Coldstream Historical Estimate is based on 116 diamond drill holes drilled from 1986 to 2011. A fixed density of 2.78 g/cm3 was used. Capping was established at 5.89 g/t Au and 5.70 g/t Au for domains EC-1 and EC-2, respectively. This is supported by statistical analysis and the high grade distribution within the deposit. Compositing was done on drill hole sections falling within the mineralized zone solids (composite = 1 m). Resources were evaluated from drill hole samples using the ID2 interpolation method in a multi-folder percent block model using Datamine Studio 3 version 3.20.5321.0. Resource categorization is based on spatial continuity based from the variography of the assays within the drillholes. Ounce (troy) = metric tons x grade / 31.10348. Calculations used metric units (metres, tonnes and g/t). The number of metric tonnes was rounded to the nearest thousand. Any discrepancies in the totals are due to rounding effects; rounding followed the recommendations in NI 43-101.

(3) The reader is cautioned that the Moss Lake Historical Estimate East and the East Coldstream Historical Estimate (the “Historical Estimates“) are considered historical in nature and as such is based on prior data and reports prepared by previous property owners. The reader is cautioned not to treat them, or any part of them, as current mineral resources or reserves. The Company has determined these historical resources are reliable, and relevant to be included here in that they demonstrate simply the mineral potential of the Moss Lake Gold Project. A qualified person has not done sufficient work to classify the Historical Estimates as current resources and Goldshore is not treating the Historical Estimates as current resources. Significant data compilation, re-drilling, re-sampling and data verification may be required by a qualified person before the Historical Estimates can be classified as a current resource. There can be no assurance that any of the historical mineral resources, in whole or in part, will ever become economically viable. In addition, mineral resources are not mineral reserves and do not have demonstrated economic viability. Even if classified as a current resource, there is no certainty as to whether further exploration will result in any inferred mineral resources being upgraded to an indicated or measured mineral resource category. The Historical Estimates relating to inferred mineral resources were calculated using prior mining industry standard definitions and practices for estimating mineral resource and mineral reserves. Such prior definitions and practices were utilized prior to the implementation of the current standards of the Canadian Institute of Mining for mineral resource estimation, and have a lower level of confidence.

Table 4: Reported Historical Production from the North Coldstream Deposit4

DepositTonnesCu %Au g/tAgCu lbsAu ozAg oz
Historical Production2,700,00001.890.565.59102,000,00044,000440,000

Note:

(4) Source: Schlanka, R., 1969. Copper, Nickel, Lead and Zinc Deposits of Ontario, Mineral Resources Circular No. 12, Ontario Geological Survey, pp. 314-316.

Peter Flindell, P.Geo., MAusIMM, MAIG, Vice President – Exploration of the Company, a qualified person under NI 43-101 has approved the scientific and technical information contained in this news release.

Neither the TSXV nor its Regulation Services Provider (as that term is defined in the policies of the TSXV) accepts responsibility for the adequacy or accuracy of this release.

For More Information – Please Contact:

Brett A. Richards
President, Chief Executive Officer and Director
Goldshore Resources Inc.

P. +1 604 288 4416  M. +1 905 449 1500
E. brichards@goldshoreresources.com
W. www.goldshoreresources.com

Facebook: GoldShoreRes | Twitter: GoldShoreRes | LinkedIn: goldshoreres

Cautionary Note Regarding Forward-Looking Statements

This news release contains statements that constitute “forward-looking statements.” Such forward looking statements involve known and unknown risks, uncertainties and other factors that may cause the Company’s actual results, performance or achievements, or developments to differ materially from the anticipated results, performance or achievements expressed or implied by such forward-looking statements. Forward looking statements are statements that are not historical facts and are generally, but not always, identified by the words “expects,” “plans,” “anticipates,” “believes,” “intends,” “estimates,” “projects,” “potential” and similar expressions, or that events or conditions “will,” “would,” “may,” “could” or “should” occur.

Forward-looking statements in this news release include, among others, statements relating to expectations regarding the exploration and development of the Moss Lake Gold Project, release of the MRE, release of a PEA, and other statements that are not historical facts. By their nature, forward-looking statements involve known and unknown risks, uncertainties and other factors which may cause our actual results, performance or achievements, or other future events, to be materially different from any future results, performance or achievements expressed or implied by such forward-looking statements. Such factors and risks include, among others: the Company may require additional financing from time to time in order to continue its operations which may not be available when needed or on acceptable terms and conditions acceptable; compliance with extensive government regulation; domestic and foreign laws and regulations could adversely affect the Company’s business and results of operations; the stock markets have experienced volatility that often has been unrelated to the performance of companies and these fluctuations may adversely affect the price of the Company’s securities, regardless of its operating performance; and the impact of COVID-19.

The forward-looking information contained in this news release represents the expectations of the Company as of the date of this news release and, accordingly, is subject to change after such date. Readers should not place undue importance on forward-looking information and should not rely upon this information as of any other date. The Company undertakes no obligation to update these forward-looking statements in the event that management’s beliefs, estimates or opinions, or other factors, should change.

This news release does not constitute an offer to sell, or a solicitation of an offer to buy, any securities in the United States. The securities have not been and will not be registered under the United States Securities Act of 1933, as amended (the “U.S. Securities Act”) or any state securities laws and may not be offered or sold within the United States or to U.S. Persons unless registered under the U.S. Securities Act and applicable state securities laws or an exemption from such registration is available.

To view the source version of this press release, please visit https://www.newsfilecorp.com/release/142661

Categories
Gold Shore Resources Junior Mining Precious Metals

Goldshore Intersects 192.75m @ 1.02 g/t Au from 94.45m depth in MMD-22-051

Vancouver, British Columbia–(Newsfile Corp. – September 29, 2022) – Goldshore Resources Inc. (TSXV: GSHR) (OTCQB: GSHRF) (FSE: 8X00) (“Goldshore” or the “Company“), is pleased to announce assay results from its ongoing 100,000-meter drill program at the Moss Lake Project in Northwest Ontario, Canada (the “Moss Lake Gold Project“).

Highlights:

  • Results for five holes, drilled to infill historic but poorly surveyed drill sections in the Main Zone, have confirmed higher-grade gold mineralization within a large volume of well mineralized diorite with best intercepts of:
  • 192.75m @ 1.02 g/t Au from 94.45m depth in MMD-22-051, including
    • 62m @ 1.49 g/t Au from 113m and
    • 48.7m @ 1.29 g/t Au from 208.3m
  • 11.85m @ 1.87 g/t Au from 441.15m depth in MMD-22-041
https://embed.fireplace.yahoo.com/embed?ctrl=Monalixa&m_id=monalixa&m_mode=document&site=sports&os=android&pageContext=%257B%2522ctopid%2522%253A%25221542500%253B1480989%253B1481489%2522%252C%2522hashtag%2522%253A%25221542500%253B1480989%253B1481489%2522%252C%2522lmsid%2522%253A%2522a0V0W00000HOPDcUAP%2522%252C%2522revsp%2522%253A%2522newsfile_64%2522%252C%2522lpstaid%2522%253A%2522edcf3955-29bf-3281-9413-5d4a859f4f68%2522%252C%2522pageContentType%2522%253A%2522story%2522%257D
  • 28.0m @ 1.51 g/t Au from 580.0m depth in MMD-22-046, including
    • 11.0m @ 3.45 g/t Au from 587.0m
  • 9.75m @ 1.78 g/t Au from 282.55m depth in MMD-22-047
  • 34.25m @ 1.03 g/t Au from 209.0m depth in MMD-22-049, including
    • 3.8m @ 6.98 g/t Au from 239.45m

President and CEO Brett Richards stated: “As we have been discussing for some time, the continued results of intersecting wide zones of +1 g/t Au mineralization underpin our belief that the Moss Lake Deposit has potential to develop an initial high-grade phase 1 open pit within the larger low-grade open pit operation. It can be seen that the projected grade shell of +1.0 g/t Au is significant at this early stage, and we will look to further explore these high grade areas, as we continue with our program.”

Technical Overview

Figure 1 shows the better intercepts in plain view and Figure 2 is a typical section through hole MMD-22-041 and MMD-22-051.


Figure 1: Drill plan showing best of several +1 g/t Au intercepts relative to implicit modelled grade shells

To view an enhanced version of this graphic, please visit:
https://images.newsfilecorp.com/files/8051/138713_5b416c09a4a41877_002full.jpg


Figure 2: Drill section through MMD-22-041 and MMD-22-051 relative to implicit modelled grade shells

To view an enhanced version of this graphic, please visit:
https://images.newsfilecorp.com/files/8051/138713_5b416c09a4a41877_003full.jpg

Table 1 shows the significant intercepts. Table 2 shows the drill hole locations.

Table 1: Significant downhole gold intercepts

HOLE IDFROMTOLENGTH (m)TRUE WIDTH (m)CUT GRADE
(g/t Au)
UNCUT GRADE
(g/t Au)
MMD-22-04141.0045.004.002.00.380.38
 132.80137.004.202.10.750.75
 152.75158.605.853.00.390.39
 175.35187.0011.655.90.300.30
 189.90205.2515.357.80.360.36
 258.75262.153.401.70.480.48
 308.10332.0523.9512.30.670.67
including330.00332.052.051.11.891.89
 348.45383.0034.5518.00.430.43
including380.00382.002.001.02.502.50
 439.00480.0041.0021.30.790.79
including441.15453.0011.856.11.871.87
 493.00495.352.351.20.320.32
 519.00565.7546.7524.30.460.46
including525.00527.002.001.02.182.18
and543.50549.005.502.91.021.02
       
MMD-22-0468.0037.5029.5014.30.500.50
including29.4031.402.001.01.161.16
 65.00111.0046.0021.90.820.82
including66.0077.0011.005.31.411.41
and100.00111.0011.005.21.301.29
 144.00148.004.001.90.310.31
 154.00157.003.001.40.550.55
 172.00182.0010.004.61.291.29
including176.00182.006.002.81.961.96
 220.00239.0019.008.50.480.48
 253.00268.0015.006.70.350.35
 306.45346.0039.5517.30.710.71
including307.00312.255.252.32.482.48
and334.00336.102.100.92.932.93
and342.00344.202.201.01.271.27
 370.00386.9016.907.40.370.37
 411.00416.905.902.50.310.31
 421.90496.5574.6532.10.660.66
including424.00426.002.000.92.512.51
and468.10472.003.901.73.373.37
 512.45520.007.553.20.460.46
 575.00577.002.000.80.450.45
 580.00608.0028.0011.81.511.51
including587.00598.0011.004.63.453.45
       
MMD-22-04726.5059.7033.2022.60.360.36
including40.5043.903.402.31.081.08
 94.90107.0012.108.40.350.35
 136.40138.902.501.70.300.30
 141.90204.9063.0043.80.370.37
including172.20175.052.852.01.121.12
 239.90242.752.852.01.091.09
including240.65242.752.101.51.291.29
 282.55333.9051.3536.90.730.73
including282.55292.309.757.01.781.78
 363.90366.202.301.70.520.52
 371.80375.603.802.80.360.36
 398.90407.708.806.40.540.54
 580.00582.702.702.10.340.34
       
MMD-22-04920.0047.0027.0013.80.590.59
 68.2591.0022.7511.60.480.48
 140.00142.002.001.00.350.35
 166.00193.0027.0013.70.440.44
 209.00243.2534.2517.71.031.03
including217.95220.002.051.12.092.09
and239.45243.253.802.06.986.98
 254.35279.7025.3513.20.660.66
including254.80260.655.853.12.072.07
 290.75318.0027.2514.10.500.50
 353.00410.0057.0029.40.510.51
 434.00436.002.001.10.540.54
 468.50471.402.901.60.310.31
 518.00523.005.002.80.380.38
 572.00575.303.301.90.530.53
 640.70642.902.201.30.590.59
       
MMD-22-05144.8555.6010.757.90.350.35
 94.45287.20192.75149.11.021.02
including94.4597.002.551.91.081.08
and113.00175.0062.0048.01.491.49
and188.00191.803.802.91.591.59
and208.30257.0048.7037.71.291.29
Intersections calculated above at 0.3 g/t Au cut off with a top cut of 30 g/t Au and a maximum internal waste interval of 10 metres. Bordered intervals are intersections calculated above a 1.0 g/t Au cut off. Intervals in bold are those with a grade thickness factor exceeding 20 gram x metres / tonne gold. True widths are approximate and assume a subvertical body.


Table 2: Location of drill holes in this press release

HOLEEASTNORTHRLAZIMUTHDIPEOH
MMD-22-041668,7845,379,185436154°-61°606.0
MMD-22-046668,8655,379,218435156°-61°609.1
MMD-22-047669,1555,379,424429153°-47°602.05
MMD-22-049668,9535,379,245428155°-60°666.05
MMD-22-051668,7045,379,104434154°-45°293.0
Approximate collar coordinates in NAD 83, Zone 15N

Results have been received for five holes that have infilled areas of the Main Zone that are between sections drilled by historic holes with collar survey problems. As a result, they will replace the low-confidence historic holes in the upcoming resource model update.

As with the historic holes, these holes intersected several broad zones of low-grade mineralization within the altered diorite intrusion host. Examples include 41.0m @ 0.79 g/t Au from 439.0m depth and 46.75m @ 0.46 g/t Au from 519.0m in MMD-22-041; 88.0m @ 0.48 g/t Au from 388.0m in MMD-22-042; 46.0m @ 0.82 g/t Au from 65.0m39.55m @ 0.71 g/t Au from 306.45m and 74.65m @ 0.66 g/t Au from 421.9m in MMD-22-046; 63.0m @ 0.37 g/t Au from 141.9m and 51.35m @ 0.73 g/t Au from 282.55m in MMD-22-047; and 57.0m @ 0.51 g/t Au from 353.0m in MMD-22-049. The long intercept in MMD-22-051 of 192.75m @ 1.02 g/t Au from 94.45m is similar but higher grade.

All these low-grade zones occur as envelopes to higher-grade structures that form a three-dimensional, anastomosing shear network that has developed in response to strain on the altered diorite intrusion. Results include the broad zones of +1 g/t Au mineralization shown in the highlights (e.g., 192.75m @ 1.02 g/t Au from 94.45m depth in MMD-22-051) and several narrow high-grade intervals, including 1.0m @ 9.14 g/t Au from 449.0m depth in MMD-22-041; 1.0m @ 12.7 g/t Au from 441.0m, 0.9m @ 9.99 g/t Au from 468.1m and 1.0m @ 16.6 g/t Au from 587.0m in MMD-22-046; 0.85m @ 5.93 g/t Au from 290.7m in MMD-22-047; 0.45m @ 8.22 g/t Au from 30.55m, 0.75m @ 12.0 g/t Au from 421.25m, 0.55m @ 9.93 g/t Au from 306.95m and 0.65m @ 15.1 g/t Au from 365.35m in MMD-22-049; and 1.0m @ 14.0 g/t Au from 159.0m and 1.0m @ 10.6 g/t Au from 256.0m in MMD-22-051.

Geological modelling of the altered diorite host rock and anastomosing shear network has progressed faster than anticipated and is nearly complete. The new model will enable the interpolation of low and high-grade gold populations within constraining wireframes, which we expect will provide a more accurate estimation of the gold distribution and, therefore, the contained gold resource.

Pete Flindell, VP Exploration for Goldshore, said, “These drill results confirm our contention that there are coherent zones of +1 g/t Au gold mineralization with a “sea” of low grade mineralization that should allow for the generation of a smaller, higher-grade resource at the Moss Lake Project. Drilling around these higher grade zones continues.”

Analytical and QA/QC Procedures

All samples were sent to ALS Geochemistry in Thunder Bay for preparation and analysis was performed in the ALS Vancouver analytical facility. ALS is accredited by the Standards Council of Canada (SCC) for the Accreditation of Mineral Analysis Testing Laboratories and CAN-P-4E ISO/IEC 17025. Samples were analyzed for gold via fire assay with an AA finish (“Au-AA23”) and 48 pathfinder elements via ICP-MS after four-acid digestion (“ME-MS61”). Samples that assayed over 10 ppm Au were re-run via fire assay with a gravimetric finish (“Au-GRA21”).

In addition to ALS quality assurance / quality control (“QA/QC”) protocols, Goldshore has implemented a quality control program for all samples collected through the drilling program. The quality control program was designed by a qualified and independent third party, with a focus on the quality of analytical results for gold. Analytical results are received, imported to our secure on-line database and evaluated to meet our established guidelines to ensure that all sample batches pass industry best practice for analytical quality control. Certified reference materials are considered acceptable if values returned are within three standard deviations of the certified value reported by the manufacture of the material. In addition to the certified reference material, certified blank material is included in the sample stream to monitor contamination during sample preparation. Blank material results are assessed based on the returned gold result being less than ten times the quoted lower detection limit of the analytical method. The results of the on-going analytical quality control program are evaluated and reported to Goldshore by Orix Geoscience Inc.

About Goldshore

Goldshore is an emerging junior gold development company, and owns the Moss Lake Gold Project located in Ontario. Wesdome is currently a large shareholder of Goldshore with an approximate 27% equity position in the Company. Well-financed and supported by an industry-leading management group, board of directors and advisory board, Goldshore is positioned to advance the Moss Lake Gold Project through the next stages of exploration and development.

About the Moss Lake Gold Project

The Moss Lake Gold Project is located approximately 100 km west of the city of Thunder Bay, Ontario. It is accessed via Highway 11 which passes within 1 km of the property boundary to the north. The Moss Lake Gold Project covers 14,292 hectares and consists of 282 unpatented and patented mining claims.

The Moss Lake Gold Project hosts a number of gold and base metal rich deposits including the Moss Lake Deposit, the East Coldstream Deposit (Table 3), the historically producing North Coldstream Mine (Table 4), and the Hamlin Zone, all of which occur over a mineralized trend exceeding 20 km in length. A historical preliminary economic assessment (the “Moss Lake Historical Estimate“) was completed on the Moss Lake Gold Project in 2013 and published by Moss Lake Gold Mines Ltd. (“Moss Lake Gold Mines“)1,3. A historical mineral resource estimate (the “East Coldstream Historical Estimate“) was completed on the East Coldstream Deposit in 2011 by Foundation Resources Inc.2,3 In addition to these zones, the Moss Lake Gold Project also hosts a number of under-explored mineral occurrences which are reported to exist both at surface and in historically drilled holes. The Moss Lake Deposit is a shear-hosted disseminated-style gold deposit which outcrops at surface. It has been drilled over a 2.5 km length and to depths of 300 m with 376 holes completed between 1983 and 2017. The last drilling program conducted in 2016 and 2017 by Wesdome Gold Mines Ltd. (“Wesdome“), which consisted of widely spaced holes along the strike extension of the deposit was successful in expanding the mineralized footprint and hydrothermal system 1.6 km to the northeast. Additionally, the deposit remains largely open to depth. In 2017, Wesdome completed an induced polarization survey which traced the potential extensions of pyrite mineralization associated with the Moss Lake Deposit over a total strike length of 8 km and spanning the entire extent of the survey grids.

The East Coldstream Deposit is a shear-hosted disseminated-style gold deposit which locally outcrops at surface. It has been drilled over a 1.3 km length and to depths of 200 m with 138 holes completed between 1988 and 2017. The deposit remains largely open at depth and may have the potential for expansion along strike. Historic drill hole highlights from the East Coldstream Deposit include 4.86 g/t Au over 27.3 m in C-10-15.

The historically producing North Coldstream Mine is reported to have produced significant amounts of copper, gold and silver4 from mineralization with potential iron-oxide-copper-gold deposit style affinity. The exploration potential immediately surrounding the historic mining area is not currently well understood and historic data compilation is required.

The Hamlin Zone is a significant occurrence of copper and gold mineralization, and also of potential iron-oxide-copper-gold deposit style affinity. Between 2008 and 2011, Glencore tested Hamlin with 24 drill holes which successfully outlined a broad and intermittently mineralized zone over a strike length of 900 m. Historic drill hole highlights from the Hamlin Zone include 0.9 g/t Au and 0.35% Cu over 150.7 m in HAM-11-75.

The Moss Lake, East Coldstream and North Coldstream deposits sit on a mineral trend marked by a regionally significant deformation zone locally referred to as the Wawiag Fault Zone in the area of the Moss Lake Deposit. This deformation zone occurs over a length of approximately 20 km on the Moss Lake Gold Project and there is an area spanning approximately 7 km between the Moss Lake and East Coldstream deposits that is significantly underexplored.

Table 3: Historical Mineral Resources1,2,3

INDICATEDINFERRED
DepositTonnesAu g/tAu ozTonnesAu g/tAu oz
Moss Lake Historical Estimate
Open Pit Potential39,795,0001.11,377,30048,904,0001.01,616,300
Underground Potential1,461,1002.9135,400
Moss Lake Total39,795,0001.11,377,30050,364,0001.11,751,600
East Coldstream Historical Estimate
East Coldstream Total3,516,7000.8596,40030,533,0000.78763,276
Combined Total43,311,7001.081,473,70080,897,0000.982,514,876

Notes:

(1) Source: Poirier, S., Patrick, G.A., Richard, P.L., and Palich, J. “Technical Report and Preliminary Economic Assessment for the Moss Lake Project”, prepared for Moss Lake Gold Mines Ltd. The qualified persons for the Moss Lake Historical Estimate are Pierre-Luc Richard, MSc, PGeo (InnovExplo Inc), and Carl Pelletier, BSc, PGeo (InnovExplo Inc), and the effective date of the Moss Lake Historical Estimate is February 8, 2013. In-Pit results are presented undiluted and in situ, within Whittle-optimized pit shells. Underground results are presented undiluted and in situ, outside Whittle-optimized pit shells. The Moss Lake Historical Estimate includes 18 gold-bearing zones and 1 envelope containing isolated gold intercepts. Whittle parameters: mining cost = C$2.28; pit slope angle = 50.0 degrees; production cost = C$9.55; mining Dilution = 5%; mining recovery = 95%; processing recovery = 80% to 85%; gold price = C$1,500. In-Pit and Underground resources were compiled at cut-off grades from 0.3 to 5.0 g/t Au (for sensitivity characterization). A cut-off grade of 0.5 g/t Au was selected as the official in-pit cut-off grade and a cut-off grade of 2.0 g/t Au was selected as the official underground cut-off grade. The Moss Lake Historical Estimate is based on 352 diamond drill holes (90,978 m) drilled from 1983 and 2008. A fixed density of 2.78 g/cm3 was used. A minimum true thickness of 5.0 m was applied, using the grade of the adjacent material when assayed or a value of zero when not assayed. Capping was established at 35 g/t Au, supported by statistical analysis and the high grade distribution within the deposit. Compositing was done on drill hole sections falling within the mineralized zone solids (composite = 1 m). Resources were evaluated from drill hole samples using the ID2 interpolation method in a multi-folder percent block model using Gems version 6.4. Based on geostatistics, the ellipse range for interpolation was 75m x 67.5m x 40m. The Indicated category is defined by combining the blocks within the two main zones and various statistical criteria, such as average distance to composites, distance to closest composite, quantity of drill holes within the search area. Ounce (troy) = metric tons x grade / 31.10348. Calculations used metric units (metres, tonnes and g/t). The number of metric tonnes was rounded to the nearest thousand. Any discrepancies in the totals are due to rounding effects; rounding followed the recommendations in NI 43-101.

(2) Source: McCracken, T. “Technical Report and Resource Estimate on the Osmani Gold Deposit, Coldstream Property, Northwestern Ontario”, prepared for Foundation Resources Inc. and Alto Ventures Ltd. The East Coldstream Historical Estimate is based on a 0.4 g/t Au cut-off grade. The qualified persons for the East Coldstream Historical Estimate are Todd McCracken, P.Geo. (Tetratech Wardrop), and Jeff Wilson, Ph.D., P.Geo. (Tetratech Wardrop), and the effective date of the East Coldstream Historical Estimate is December 12, 2011. Resources are presented unconstrained, undiluted and in situ. The East Coldstream Historical Estimate includes 2 gold-bearing zones. A cut-off grade of 0.4 g/t Au was selected as the official resource cut-off grade. The East Coldstream Historical Estimate is based on 116 diamond drill holes drilled from 1986 to 2011. A fixed density of 2.78 g/cm3 was used. Capping was established at 5.89 g/t Au and 5.70 g/t Au for domains EC-1 and EC-2, respectively. This is supported by statistical analysis and the high grade distribution within the deposit. Compositing was done on drill hole sections falling within the mineralized zone solids (composite = 1 m). Resources were evaluated from drill hole samples using the ID2 interpolation method in a multi-folder percent block model using Datamine Studio 3 version 3.20.5321.0. Resource categorization is based on spatial continuity based from the variography of the assays within the drillholes. Ounce (troy) = metric tons x grade / 31.10348. Calculations used metric units (metres, tonnes and g/t). The number of metric tonnes was rounded to the nearest thousand. Any discrepancies in the totals are due to rounding effects; rounding followed the recommendations in NI 43-101.

(3) The reader is cautioned that the Moss Lake Historical Estimate East and the East Coldstream Historical Estimate (the “Historical Estimates“) are considered historical in nature and as such is based on prior data and reports prepared by previous property owners. The reader is cautioned not to treat them, or any part of them, as current mineral resources or reserves. The Company has determined these historical resources are reliable, and relevant to be included here in that they demonstrate simply the mineral potential of the Moss Lake Gold Project. A qualified person has not done sufficient work to classify the Historical Estimates as current resources and Goldshore is not treating the Historical Estimates as current resources. Significant data compilation, re-drilling, re-sampling and data verification may be required by a qualified person before the Historical Estimates can be classified as a current resource. There can be no assurance that any of the historical mineral resources, in whole or in part, will ever become economically viable. In addition, mineral resources are not mineral reserves and do not have demonstrated economic viability. Even if classified as a current resource, there is no certainty as to whether further exploration will result in any inferred mineral resources being upgraded to an indicated or measured mineral resource category. The Historical Estimates relating to inferred mineral resources were calculated using prior mining industry standard definitions and practices for estimating mineral resource and mineral reserves. Such prior definitions and practices were utilized prior to the implementation of the current standards of the Canadian Institute of Mining for mineral resource estimation, and have a lower level of confidence.

Table 4: Reported Historical Production from the North Coldstream Deposit4

DepositTonnesCu %Au g/tAgCu lbsAu ozAg oz
Historical Production2,700,00001.890.565.59102,000,00044,000440,000


Note:

(4) Source: Schlanka, R., 1969. Copper, Nickel, Lead and Zinc Deposits of Ontario, Mineral Resources Circular No. 12, Ontario Geological Survey, pp. 314-316.

Peter Flindell, P.Geo., MAusIMM, MAIG, Vice President – Exploration of the Company, a qualified person under NI 43-101 has approved the scientific and technical information contained in this news release.

Neither the TSXV nor its Regulation Services Provider (as that term is defined in the policies of the TSXV) accepts responsibility for the adequacy or accuracy of this release.

For More Information – Please Contact:

Brett A. Richards
President, Chief Executive Officer and Director
Goldshore Resources Inc.

P. +1 604 288 4416 M. +1 905 449 1500
E. brichards@goldshoreresources.com
W. www.goldshoreresources.com

Facebook: GoldShoreRes | Twitter: GoldShoreRes | LinkedIn: goldshoreres

Cautionary Note Regarding Forward-Looking Statements

This news release contains statements that constitute “forward-looking statements.” Such forward looking statements involve known and unknown risks, uncertainties and other factors that may cause the Company’s actual results, performance or achievements, or developments to differ materially from the anticipated results, performance or achievements expressed or implied by such forward-looking statements. Forward looking statements are statements that are not historical facts and are generally, but not always, identified by the words “expects,” “plans,” “anticipates,” “believes,” “intends,” “estimates,” “projects,” “potential” and similar expressions, or that events or conditions “will,” “would,” “may,” “could” or “should” occur.

Forward-looking statements in this news release include, among others, statements relating to expectations regarding the exploration and development of the Moss Lake Gold Project, and other statements that are not historical facts. By their nature, forward-looking statements involve known and unknown risks, uncertainties and other factors which may cause our actual results, performance or achievements, or other future events, to be materially different from any future results, performance or achievements expressed or implied by such forward-looking statements. Such factors and risks include, among others: the Company may require additional financing from time to time in order to continue its operations which may not be available when needed or on acceptable terms and conditions acceptable; compliance with extensive government regulation; domestic and foreign laws and regulations could adversely affect the Company’s business and results of operations; the stock markets have experienced volatility that often has been unrelated to the performance of companies and these fluctuations may adversely affect the price of the Company’s securities, regardless of its operating performance; and the impact of COVID-19.

The forward-looking information contained in this news release represents the expectations of the Company as of the date of this news release and, accordingly, is subject to change after such date. Readers should not place undue importance on forward-looking information and should not rely upon this information as of any other date. The Company undertakes no obligation to update these forward-looking statements in the event that management’s beliefs, estimates or opinions, or other factors, should change.

This news release does not constitute an offer to sell, or a solicitation of an offer to buy, any securities in the United States. The securities have not been and will not be registered under the United States Securities Act of 1933, as amended (the “U.S. Securities Act”) or any state securities laws and may not be offered or sold within the United States or to U.S. Persons unless registered under the U.S. Securities Act and applicable state securities laws or an exemption from such registration is available.

To view the source version of this press release, please visit https://www.newsfilecorp.com/release/138713