Categories
Base Metals Collective Mining Energy Junior Mining Precious Metals Uncategorized

Collective Mining Discovers a High-Grade Copper and Molybdenum Porphyry Related Soil Anomaly 150 metres South of the Main Breccia Discovery at Apollo 

  • New assay results from detailed soil geochemistry sampling have outlined a high-grade porphyry anomaly averaging greater than 500 parts per million (“ppm”) copper and 30 ppm molybdenum with highest values up to 1,125 ppm copper and 163 ppm molybdenum.  
  • Located only approximately 150 metres south of the southernmost modelled boundary of the Main Breccia discovery at Apollo, this new high-grade anomaly covers an area measuring 250 metres by 150 metres and remains completely open for expansion to the west, east and south. 
  • Follow-up reconnaissance geological work at surface has identified a potassic altered porphyry diorite hosting quartz, molybdenum, and chalcopyrite veins. Surface rock chip sampling from limited weathered (leached) outcrop has returned grades of up to 0.28% copper and 0.13% molybdenum. 
  • The soil anomaly compares favorably in grade and is slightly larger than the soil anomaly covering the southern portion of the Main Breccia discovery at Apollo where recent assay results from drilling have intercepted the highest copper grades to date including drill hole APC-18 which averaged 168.6 metres at 0.98 g/t gold, 69 g/t silver and 0.5% copper. 
  • Immediate plans are underway to test the porphyry target with the first drill hole expected to begin in early Q1, 2023. 
  • Three rigs continue to drill the Main Breccia at Apollo with holes APC-22 through APC-27 awaiting assay results and holes APC-28 through APC-30 nearing completion ahead of a short break for the seasonal holiday.  

Toronto, Ontario, December 14, 2022 – Collective Mining Ltd. (TSXV: CNL) (OTCQX: CNLMF) (“Collective” or the “Company”) is pleased to announce assay results from soil and rock chip sampling undertaken south of the Main Breccia discovery at the Apollo target (“Apollo”) within the Company’s Guayabales project located in Caldas, Colombia. As part of its fully funded 23,000 metre drill program for 2022, there are currently three diamond drill rigs operating at the Apollo target.  The Main Breccia discovery at Apollo is a high-grade, bulk tonnage copper-gold-silver porphyry-related breccia system with previously announced assay results including:  

Hole  Intercept (m)  Au (g/t)  Ag (g/t)  Cu %  Zn %  Pb %  Mo %  AuEq (g/t) *  
APC-2  207.15  1.46  45  0.31  0.08  0.05  0.002  2.68  
APC-8  265.75  1.26  55  0.22  0.07  0.05  0.045  2.44  
APC-12  237.70  1.15  72  0.38  0.08  0.07  0.001  2.88  

* See press releases dated August 10th, September 13th and October 6th respectively.   

Executive Chairman, Ari Sussman stated: “The discovery of a high-grade copper and molybdenum soil anomaly associated with a mineralized porphyry body just south of our Main Breccia discovery at Apollo is exciting. As drilling continues to expand the Main Breccia discovery at Apollo, our early-stage exploration team has been focused on prospecting the rest of the Apollo target area to determine if a possible source exists for the copper mineralization found within the breccia discovery. Given the proximity to our Main Breccia discovery, this new high-grade porphyry target suggests we may have found the source. We are eager to test the new target and plan to initiate drilling in January as part of our upcoming 2023 drilling program. We are looking forward to an exciting 2023 as we continue to drive shareholder value through aggressive expansion drilling of the Main Breccia discovery while testing new targets.” 

Details (See Figures 1–3) 

The Company’s exploration teams have recently undertaken outcrop mapping and soil sampling within the Apollo area with the objective of outlining new targets for drilling. This work has outlined a coherent and well-defined soil anomaly for copper and molybdenum covering dimensions of 250 metres east-west by 150 metres north-south. The anomaly is defined by over 70 soil samples with copper values ranging from 310-1,125pmm and Molybdenum values up to 163ppm. Gold in soil within the anomaly has also returned numerous samples (n=12) ranging from 0.1 to 0.4 g/t. The soil anomaly locates only 150 metres south of the southernmost outcropping portion of the northerly dipping Main Breccia discovery at Apollo as defined by drilling and surface outcrop sampling. The southern copper and molybdenum anomaly is still open at surface to the west, east and to the south. 

Reconnaissance geological mapping and rock chip sampling within the anomalous soil area has identified porphyry diorites with secondary biotite alteration hosting porphyry “B” veins with center and border lines of chalcopyrite and molybdenum. Disseminated chalcopyrite was also observed within the limited outcrop exposures with rock chip sampling reporting grades up to 0.28% of copper, 0.13% of molybdenum and 0.8 g/t gold. 

The Company is currently organizing and constructing a new drill pad to test the target with diamond drilling in January 2023. 

The larger Apollo target area, which includes the Main Breccia discovery and other breccia and porphyry targets, is defined to date by surface mapping, rock sampling and copper and molybdenum soil geochemistry and covers a 1,000 metres X 1,200 metres area. The Apollo target area hosts the Company’s new Main Breccia discovery plus multiple CBM vein systems located within and above and below the mineralized angular breccia. Additional untested breccia discoveries locate to the NE and SE of the main breccia discovery. The newly defined porphyry target, as outlined in this press release, is located 150 metres due south of the southernmost end the Main Breccia discovery and is flanked to the southeast by outcrops hosting a high density of porphyry quartz veins associated with early biotite veins in diorite porphyry.  The larger Apollo target area also remains open for further expansion. 

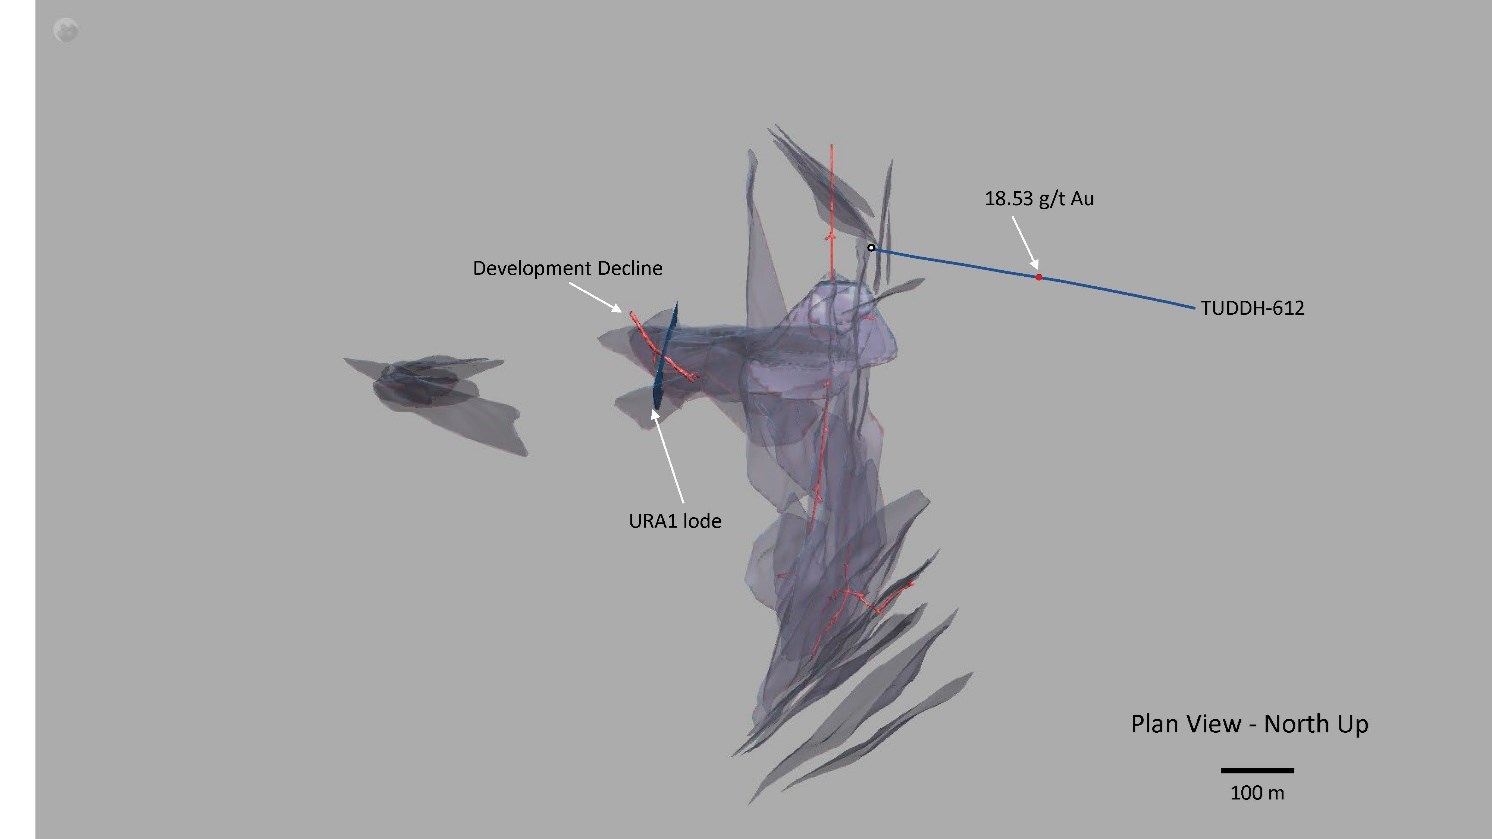
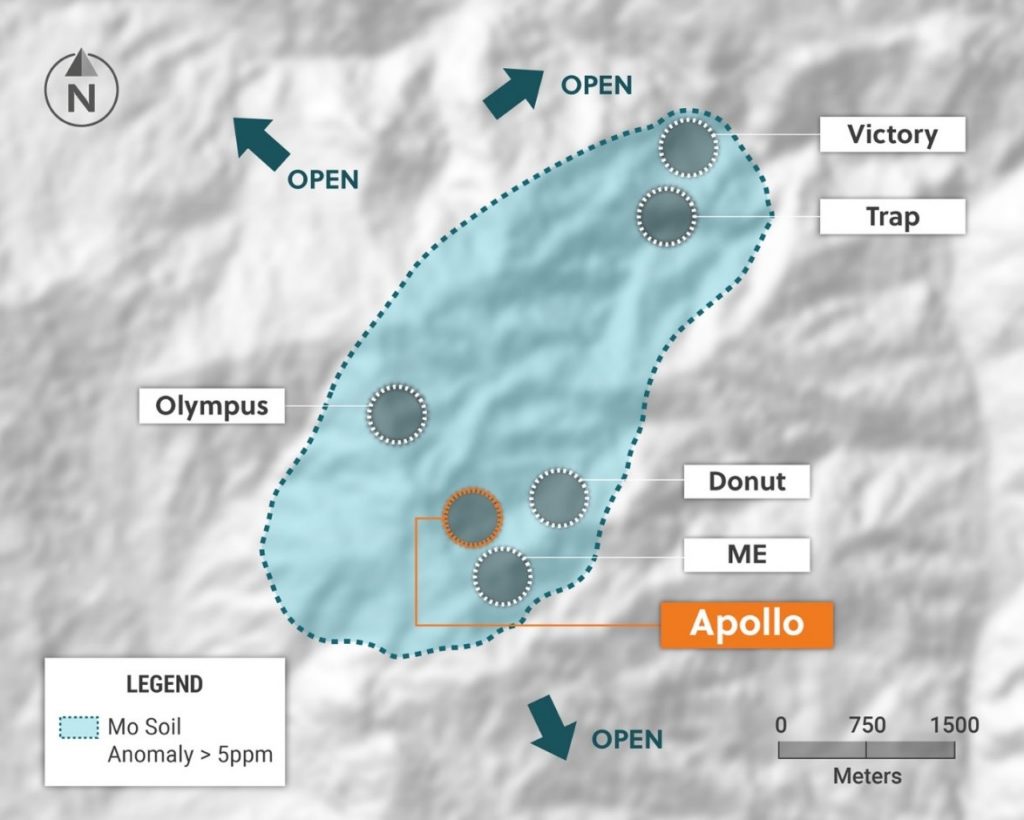
Figure 1: Plan View of the New Porphyry Target Soil Anomaly in Relation to the Main Breccia Discovery at Apollo  

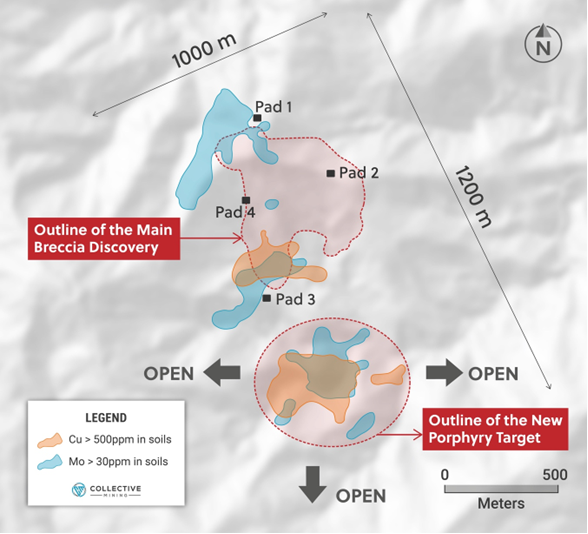
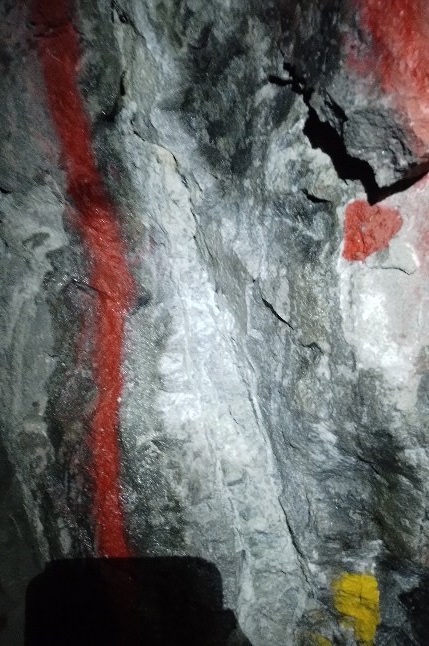
Figure 2: Detailed View of the Soil Anomaly Covering the New Porphyry Target with Photos and Assay Results for Rock Samples 

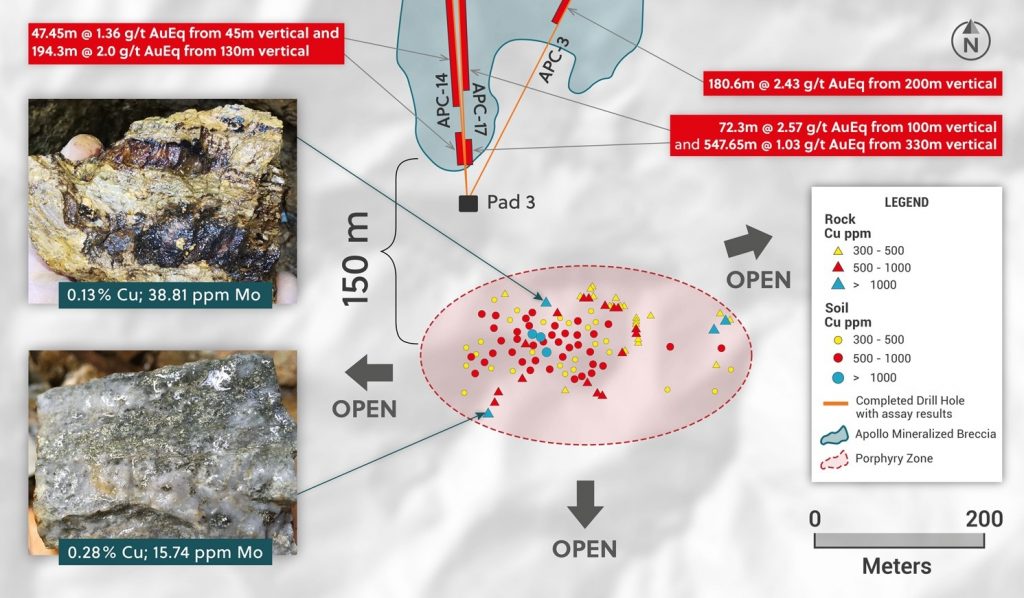
Figure 3: Plan View of the Guayabales Project Highlighting the Apollo Target Location 

About Collective Mining Ltd. 

To see our latest corporate presentation and related information, please visit www.collectivemining.com 

Founded by the team that developed and sold Continental Gold Inc. to Zijin Mining for approximately $2 billion in enterprise value, Collective Mining is a copper, silver and gold exploration company based in Canada, with projects in Caldas, Colombia. The Company has options to acquire 100% interests in two projects located directly within an established mining camp with ten fully permitted and operating mines. 

The Company’s flagship project, Guayabales, is anchored by the Apollo target, which hosts the large-scale, bulk-tonnage and high-grade copper, silver and gold Main Breccia discovery. The Company’s near-term objective is to continue with expansion drilling of the Main Breccia discovery while increasing confidence in the highest-grade portions of the system. 

Management, insiders and close family and friends own nearly 35% of the outstanding shares of the Company and as a result, are fully aligned with shareholders. The Company is listed on the TSXV under the trading symbol “CNL” and on the OTCQX under the trading symbol “CNLMF”. 

Qualified Person (QP) and NI43-101 Disclosure 

David J Reading is the designated Qualified Person for this news release within the meaning of National Instrument 43-101 (“NI 43-101”) and has reviewed and verified that the technical information contained herein is accurate and approves of the written disclosure of same. Mr. Reading has an MSc in Economic Geology and is a Fellow of the Institute of Materials, Minerals and Mining and of the Society of Economic Geology (SEG). 

Technical Information 

Rock and core samples have been prepared and analyzed at SGS laboratory facilities in Medellin, Colombia and Lima, Peru. Blanks, duplicates, and certified reference standards are inserted into the sample stream to monitor laboratory performance. Crush rejects and pulps are kept and stored in a secured storage facility for future assay verification. No capping has been applied to sample composites. The Company utilizes a rigorous, industry-standard QA/QC program. 

Contact Information 

Collective Mining Ltd.  

Steven Gold, Vice President, Corporate Development and Investor Relations 

Tel. (416) 648-4065 


FORWARD-LOOKING STATEMENTS   

This news release contains certain forward-looking statements, including, but not limited to, statements about the drill programs, including timing of results, and Collective’s future and intentions. Wherever possible, words such as “may”, “will”, “should”, “could”, “expect”, “plan”, “intend”, “anticipate”, “believe”, “estimate”, “predict” or “potential” or the negative or other variations of these words, or similar words or phrases, have been used to identify these forward-looking statements. These statements reflect management’s current beliefs and are based on information currently available to management as at the date hereof.    

Forward-looking statements involve significant risk, uncertainties, and assumptions. Many factors could cause actual results, performance, or achievements to differ materially from the results discussed or implied in the forward-looking statements. These factors should be considered carefully, and readers should not place undue reliance on the forward-looking statements. Although the forward-looking statements contained in this news release are based upon what management believes to be reasonable assumptions, Collective cannot assure readers that actual results will be consistent with these forward-looking statements. These forward-looking statements are made as of the date of this news release, and Collective assumes no obligation to update or revise them to reflect new events or circumstances, except as required by law.  

Neither the TSXV nor its Regulation Services Provider (as that term is defined in the policies of the TSXV) accepts responsibility for the adequacy or accuracy of this news release.   

Categories
Junior Mining Lion One Metals Precious Metals

Lion One Discovers New Near-Surface Lode at Tuvatu and Intersects Ore-Grade Mineralization Associated with Near-Mine CSAMT Anomaly

Lion One Metals, Proven and Probable

North Vancouver, British Columbia–(Newsfile Corp. – December 8, 2022) – Lion One Metals Limited (TSXV: LIO) (OTCQX: LOMLF) (ASX: LLO) (“Lion One” or the “Company”) provides results from near-mine exploration, identifying two new zones of significant mineralization within the footprint of the deposit. A new lode, named URA1 has been discovered during construction of the development decline; its location corresponds to Tuvatu’s near-surface and earliest scheduled production area: Zone 2. The lode has been further defined through underground channel sampling and subsequent diamond drilling. The URA1 lode will be included in the updated Mineral Resource Estimate (MRE) that the Company aims to release in early 2023. Additionally, several hundred meters to the east of Tuvatu, drillhole TUDDH-612 has intersected mineralization corresponding to a distinct CSAMT gradient anomaly. This release presents significant new results from two separate areas within the general Tuvatu deposit footprint (Figure 1).

Highlights URA1

  • Discovery of near-surface, high-grade URA1 lode from intersection with the development decline, defined through channel sampling (up to 29 g/t Au over 1m in MD-CH-002) and diamond drilling of holes TUDDH-617, 619, and 621 (up to 167.42g/t Au over 0.3m in TUDDH-617, and 27.99 g/t Au over 1.2m in TUDDH-621).
  • Provides increase in volume of mineralized material within the portion of the deposit scheduled for earliest production.
  • A general N-S orientation of the lode corresponds to other major lodes (e.g., URW1) and may indicate the presence of an additional series of undiscovered lodes further to the West of Tuvatu.
  • Underscores the substantial near-mine exploration upside.

Highlights TUDDH-612

  • New ore-grade mineralization of 18.53 g/t Au over 0.6m from 492m corresponding to a sharp CSAMT geophysical gradient anomaly.
  • May represent the possible strike extension of the UR4 lode at Tuvatu, that may also include the deep high-grade intercept in TUDDH-494 at >1100m depth.
  • Tuvatu itself is coincident with a CSAMT gradient of similar magnitude; the recurring correspondence of mineralization with such gradients provides strong validation for the viability of this method for discovery of additional mineralized centers in the caldera. Once completed, this data will provide robust drill targets and substantial projected upside for new discovery.

URA1 lode, Zone 2
During advancement of the 2022 development decline, approximately 75m from the portal entrance, a sharp, clearly defined quartz-sulfide lode was intersected striking NNE-SSW and dipping 84°SE (Figure 2a). This newly identified structure is defined through underground mapping and has control points in space from chip-channel sampling, (results: Table 1) and a three-hole DDH program (TUDDH-617, 619 and 621; Figure 2b) to test the extent of this new lode (results: Table 2). The lode is named URA1, and represents a completely new, previously unmapped structure occurring within the northwestern, near-surface portion of the Tuvatu deposit (Zone 2). The new occurrence discovered near-surface, in a portion of the Tuvatu orebody that is within the current resource estimation extents, illustrates the extraordinary upside potential of the Tuvatu orebody in general. Table 2 lists the interpreted lode for each of the mineralized intercepts in boreholes TUDDH-617, 619, and 621. It is notable that the high-grade intercepts near the bottom of hole TUDDH-617 between 140.1 and 144.6m remain undefined, potentially representing yet another new lode. Moreover, this illustrates the discovery potential of additional mineralization, especially toward the West Zone where relatively sparse drilling has been completed. Notably, this area is defined by historic drilling carried out at a N-S orientation, which would have limited the exposure of the drilling to mineralized lodes trending in the same orientation.

As the discovery and definition of new features continues to add upside, intersection with known lodes, like the Murau 8 lode, intersected with TUDDH-621 at 105.3m returning 4.8m at 30.75 g/t gold continues to provide confidence in the grade continuity of known lodes.

TUDDH-612 and CSAMT profile 6
As part of the Company’s ongoing near-mine exploration program, drillhole TUDDH-612 was completed to test the sharply defined CSAMT1 gradient anomaly on profile 6 (Figure 3). Drill hole TUDDH-612 intersected 18.53 g/t Au over 0.6m at 491.8m depth along the borehole.

As shown in Figure 1, this area is located several hundred meters from the current Tuvatu mineral resource outline. As such, the mineralization intersected at this location represents a new target zone of potential high-grade mineralization that warrants follow-up. Furthermore, the mineralized intercept in hole TUDDH-612 corresponds closely to the strike projection of the UR4 lode, along with the previously reported, deep intercept in TUDDH-494 of 12.2 g/t Au at a depth along the hole of 1106.3m (see April 8, 2022 news release). As such, these intercepts may indicate the extension of the UR4 lode toward the northeast and at depth, increasing LIO’s confidence that the mineralized structure has continuity over space for several hundred meters both to the east and at depth. This structure remains open along strike and up and down dip.

The mineralization observed (Figure 3) corresponds directly with a sharply defined CSAMT gradient anomaly, thus lending significant credence to the application of CSAMT for targeting new zones of potential mineralization. The infill CSAMT survey lines completed in 2022 to complement the previous 2019 survey, are currently in final phase of interpretation. The interpreted survey results will be the subject of a future release. It is expected that once finalized, the combined CSAMT geophysical data from previous and recent surveys will play a significant role in outlining new zones of mineralization near Tuvatu, as well as regionally throughout the Navilawa caldera. A third program of CSAMT geophysics will commence in 2023 and is expected to contribute to coverage of the Navilawa caldera within LIO’s most prospective areas of interest.

Table 1. Chip-channel results from sampling of the URA1 lode, development decline.

Channel IDFrom mTo mWidth mComposited Grade g/t AuCumulative g*m
MD-CH-0010.02.52.59.9424.86
MD-CH-0020.01.01.029.0229.02
MD-CH-0031.03.02.08.9117.83
MD-CH-0041.53.01.511.9317.89
MD-CH-0051.02.51.515.1722.75
MD-CH-0060.03.03.05.6216.87
MD-CH-0110.02.52.510.4626.15


Figure 1. Plan view of the Tuvatu deposit lodes (gray) showing the locations of the exploration and development declines (red), the new URA1 lode (blue) to the west, and TUDDH-612 borehole to the east. The dotted arrow indicates the possible strike extension of the UR4 lode.

To view an enhanced version of Figure 1, please visit:
https://images.newsfilecorp.com/files/2178/147248_0a2ed6f15443ca97_002full.jpg


Figure 2a. Photo of URA1 lode located along the northeast wall of the new development decline. The vein at this location is approximately 20 cm wide.

To view an enhanced version of Figure 2a, please visit:
https://images.newsfilecorp.com/files/2178/147248_lionfigure2.jpg


Figure 2b. Oblique view (looking NE) of the URA1 lode (blue) showing the locations of the exploration and development declines (red), and the follow-up boreholes TUDDH-617, 619, and 621.

To view an enhanced version of Figure 2b, please visit:
https://images.newsfilecorp.com/files/2178/147248_0a2ed6f15443ca97_004full.jpg


Figure 3. Oblique view showing the locations of borehole TUDDH-612 relative to the CSAMT profile 6, and the exploration and development declines. The location of the high-grade intercept in TUDDH-612 at 18.53 g/t Au is indicated by the red dot. Green dots represent values between 0.5 and 3.0 g/t Au.

To view an enhanced version of Figure 3, please visit:
https://images.newsfilecorp.com/files/2178/147248_0a2ed6f15443ca97_005full.jpg

Table 2. Results from URA1 drilling. The interpreted lode for each intercept is indicated.

Hole IDFrom (m)To (m)Interval (m)Au g/tLode
TUDDH-61751.953.11.20.99Murau 4
56.158.22.11.76URA 1
including57.958.20.36.30URA 1
59.763.33.62.93URA 1
including59.760.00.317.01URA 1
81.982.80.91.20undefined
140.1141.00.956.22undefined
including140.7141.00.3167.42undefined
143.4144.61.219.27undefined
TUDDH-61929.332.63.31.82Murau 4
41.342.51.20.52undefined
47.648.81.22.79Murau 5
50.651.20.65.03Murau 5
including50.951.20.38.26Murau 5
52.452.70.30.66Murau 5
65.065.30.33.48URA 1
72.273.71.52.78Murau 7
including73.473.70.39.66Murau 7
148.1148.70.60.59Murau 12
TUDDH-62177.780.12.46.03Murau 6
including78.378.60.343.13Murau 6
81.383.42.12.68Murau 7
including82.883.40.65.26Murau 7
84.687.63.02.24Murau 7
including86.787.30.67.37Murau 7
105.3110.14.830.75Murau 8
including105.3105.90.654.31Murau 8
and105.9106.50.68.10Murau 8
and106.5107.40.956.17Murau 8
and107.4108.30.946.55Murau 8
and108.3108.60.311.39Murau 8
and108.6108.90.313.49Murau 8
and108.9110.11.28.56Murau 8
123.6124.20.62.62Murau 10
156.0157.21.20.81Murau 11
159.3160.51.227.99URA 1
168.0170.42.417.06Murau 12
including168.0169.21.28.62Murau 12
and169.2170.41.225.51Murau 12

Table 3. Survey details of diamond drill holes referenced in this release.

Hole NoCoordinates (Fiji map grid)RLfinal depthdipazimuth
NEmmDeg.(TN)
TUDDH-6123920929.11876512.6236.3905.8-60097
TUDDH-6173920800.61876257.3203.1149.9-60266
TUDDH-6193920801.21876257.7203.2161.1-60297
TUDDH-6213920799.91876257.7203.0200.7-69225

About Tuvatu
The Tuvatu Alkaline Gold Project is located on the island of Viti Levu in Fiji. The January 2018 mineral resource for Tuvatu as disclosed in the technical report “Technical Report and Preliminary Economic Assessment for the Tuvatu Gold Project, Republic of Fiji”, dated September 25, 2020, and prepared by Mining Associates Pty Ltd of Brisbane Qld, comprises 1,007,000 tonnes indicated at 8.50 g/t Au (274,600 oz. Au) and 1,325,000 tonnes inferred at 9.0 g/t Au (384,000 oz. Au) at a cut-off grade of 3.0 g/t Au. The technical report is available on the Lion One website at www.liononemetals.com and on the SEDAR website at www.sedar.com.

Qualified Person
In accordance with National Instrument 43-101 – Standards of Disclosure for Mineral Projects (“NI 43- 101”), Sergio Cattalani, P.Geo, Senior Vice President Exploration, is the Qualified Person for the Company and has reviewed and is responsible for the technical and scientific content of this news release.

QAQC Procedures
Lion One adheres to rigorous QAQC procedures above and beyond basic regulatory guidelines in conducting its sampling, drilling, testing, and analyses. The Company utilizes its own fleet of diamond drill rigs, using PQ, HQ and NQ sized drill core rods. Drill core is logged and split by Lion One personnel on site. Samples are delivered to and analyzed at the Company’s geochemical and metallurgical laboratory in Fiji. Duplicates of all samples with grades above 0.5 g/t Au are both re-assayed at Lion One’s lab and delivered to ALS Global Laboratories in Australia (ALS) for check assay determinations. All samples for all high-grade intercepts are sent to ALS for check assays. All samples are pulverized to 80% passing through 75 microns. Gold analysis is carried out using fire assay with an AA finish. Samples that have returned grades greater than 10.00 g/t Au are then re-analyzed by gravimetric method. For samples that return greater than 0.50 g/t Au, repeat fire assay runs are carried out and repeated until a result is obtained that is within 10% of the original fire assay run. Lion One’s laboratory can also assay for a range of 71 other elements through Inductively Coupled Plasma Optical Emission Spectrometry (ICP-OES), but currently focuses on a suite of 9 important pathfinder elements. All duplicate anomalous samples are sent to ALS labs in Townsville QLD and are analyzed by the same methods (Au-AA26, and Au-GRA22 where applicable). ALS also analyses 33 pathfinder elements by HF-HNO3-HClO4 acid digestion, HCl leach and ICP-AES (method ME-ICP61).

About Lion One Metals Limited
Lion One’s flagship asset is 100% owned, fully permitted high grade Tuvatu Alkaline Gold Project, located on the island of Viti Levu in Fiji. Lion One envisions a low-cost high-grade underground gold mining operation at Tuvatu coupled with exciting exploration upside inside its tenements covering the entire Navilawa Caldera, an underexplored yet highly prospective 7km diameter alkaline gold system. Lion One’s CEO Walter Berukoff leads an experienced team of explorers and mine builders and has owned or operated over 20 mines in 7 countries. As the founder and former CEO of Miramar Mines, Northern Orion, and La Mancha Resources, Walter is credited with building over $3 billion of value for shareholders.

On behalf of the Board of Directors of Lion One Metals Limited
Walter Berukoff“, Chairman and CEO

Contact Investor Relations
Toll Free (North America) Tel: 1-855-805-1250
Email: info@liononemetals.com
Website: www.liononemetals.com

Neither the TSX Venture Exchange nor its Regulation Service Provider accepts responsibility for the adequacy or accuracy of this release

This press release may contain statements that may be deemed to be “forward-looking statements” within the meaning of applicable Canadian securities legislation. All statements, other than statements of historical fact, included herein are forward-looking information. Generally, forward-looking information may be identified by the use of forward-looking terminology such as “plans”, “expects” or “does not expect”, “proposed”, “is expected”, “budget”, “scheduled”, “estimates”, “forecasts”, “intends”, “anticipates” or “does not anticipate”, or “believes”, or variations of such words and phrases, or by the use of words or phrases which state that certain actions, events or results may, could, would, or might occur or be achieved. This forward-looking information reflects Lion One Metals Limited’s current beliefs and is based on information currently available to Lion One Metals Limited and on assumptions Lion One Metals Limited believes are reasonable. These assumptions include, but are not limited to, the actual results of exploration projects being equivalent to or better than estimated results in technical reports, assessment reports, and other geological reports or prior exploration results. Forward-looking information is subject to known and unknown risks, uncertainties and other factors that may cause the actual results, level of activity, performance or achievements of Lion One Metals Limited or its subsidiaries to be materially different from those expressed or implied by such forward-looking information. Such risks and other factors may include, but are not limited to: the stage development of Lion One Metals Limited, general business, economic, competitive, political and social uncertainties; the actual results of current research and development or operational activities; competition; uncertainty as to patent applications and intellectual property rights; product liability and lack of insurance; delay or failure to receive board or regulatory approvals; changes in legislation, including environmental legislation, affecting mining, timing and availability of external financing on acceptable terms; not realizing on the potential benefits of technology; conclusions of economic evaluations; and lack of qualified, skilled labour or loss of key individuals. Although Lion One Metals Limited has attempted to identify important factors that could cause actual results to differ materially from those contained in forward-looking information, there may be other factors that cause results not to be as anticipated, estimated or intended. Accordingly, readers should not place undue reliance on forward-looking information. Lion One Metals Limited does not undertake to update any forward-looking information, except in accordance with applicable securities laws.

1 CSAMT = Controlled Source Audio Magneto-Tellurics – a ground based geophysical technique that maps 3D electrical resistivity contrasts, inferred to be structural, lithological or hydrothermal-alteration related.

To view the source version of this press release, please visit https://www.newsfilecorp.com/release/147248

Categories
Gold Shore Resources Junior Mining Precious Metals

Goldshore Intercepts 2.65 g/t Au over 14.6m in 200 m Step-Out Hole at Moss Lake

Vancouver, British Columbia–(Newsfile Corp. – August 10, 2022) – Goldshore Resources Inc. (TSXV: GSHR) (OTCQB: GSHRF) (FSE: 8X00) (“Goldshore” or the “Company“), is pleased to announce assay results from its ongoing 100,000-meter drill program at the Moss Lake Project in Northwest Ontario, Canada (the “Moss Lake Gold Project“).

Highlights:

  • Four holes drilled to evaluate the eastern extension of the Southwest Zone have confirmed gold mineralization within anastomosing shears in altered diorite with intercepts of:
    • 39.75m @ 1.18 g/t Au from 44.25m depth in MMD-22-023, including
      • 14.60m @ 2.65 g/t Au from 462.2m 
    • 11.65m @ 1.05 g/t Au from 37.35m depth, and
    • 18.70m @ 1.37 g/t Au from 151.1m in MMD-22-031
    • 10.00m @ 1.05 g/t Au from 290.0m in MMD-22-035

President and CEO Brett Richards stated: “We are excited to continue to deliver consistent drilling results. I am encouraged about the high-grade sections we are seeing and have shared previously with the market, as this will provide optionality when we model the resource later in the year and start to look at economic pit shells. With this step out hole from historically drilled areas at Moss Lake, it will further increase the optionality.”

Technical Overviewhttps://embed.fireplace.yahoo.com/embed?ctrl=Monalixa&m_id=monalixa&m_mode=document&site=sports&os=android&pageContext=%257B%2522ctopid%2522%253A%25221542500%253B1577000%253B1580500%2522%252C%2522hashtag%2522%253A%25221542500%253B1577000%253B1580500%2522%252C%2522lmsid%2522%253A%2522a0V0W00000HOPDcUAP%2522%252C%2522revsp%2522%253A%2522newsfile_64%2522%252C%2522lpstaid%2522%253A%252252ed9616-6bdd-3e2e-8c5d-430b03b8b1a6%2522%252C%2522pageContentType%2522%253A%2522story%2522%257D

Table 1 shows the significant intercepts. Table 2 and Figure 1 show the drill hole locations.

Table 1: Significant downhole gold intercept

HOLE IDFROMTO
LENGTH
(m)
 
TRUE
WIDTH (m)

CUT
GRADE 
(g/t Au)

UNCUT
GRADE 
(g/t Au)
MMD-22-023375.95379.303.352.50.370.37
440.25502.1061.8549.40.840.88
Including440.25480.0039.7531.71.181.24
Including462.20476.8014.6011.72.652.83
and490.35502.1011.759.60.320.32
527.00529.002.001.70.360.36
565.40584.3518.9516.20.320.32
       
MMD-22-02722.8028.005.203.30.760.76
42.0048.006.003.90.540.54
58.6082.0023.4015.70.370.37
95.10220.00124.9091.30.480.48
including171.50175.453.952.92.602.60
and207.00210.653.652.83.263.26
260.00262.702.702.20.460.46
305.65314.008.356.90.420.42
336.10351.2015.1012.90.470.47
375.15379.554.403.90.320.32
386.00394.008.007.10.560.56
       
MMD-22-03115.5064.3048.8033.30.610.61
including25.0029.004.002.71.431.43
and37.3549.0011.657.91.051.05
74.4580.005.553.91.761.76
91.95174.4582.5060.30.660.66
including106.80112.806.004.31.301.30
and151.10169.8018.7013.91.371.37
193.00200.007.005.40.380.38
212.00231.6019.6015.40.370.37
including214.00216.002.001.61.911.91
273.00275.102.101.70.490.49
       
MMD-22-03583.3087.003.702.50.380.38
92.00111.0019.0013.00.490.49
135.80138.002.201.50.610.61
156.00166.0010.007.30.560.56
184.75322.40137.65109.90.370.37
including196.00201.005.003.81.301.30
and290.00300.0010.008.31.051.05
332.85355.5522.7019.70.470.47
including332.85338.005.154.41.371.37
366.00375.559.558.40.350.35
415.00435.0020.0018.10.460.46
470.00476.106.105.71.031.03
498.25514.9516.7015.80.400.40
538.00542.004.003.80.830.83
including540.00542.002.001.91.231.23
Intersections calculated above a 0.3 g/t Au cut off with a top cut of 30 g/t Au and a maximum internal waste interval of 10 metres. Shaded intervals are intersections calculated above a 1.0 g/t Au cut off. Intervals in bold are those with a grade thickness factor exceeding 20 gram x metres / tonne gold. True widths are approximate and assume a subvertical body. The fact that cut and uncut assays are the same, shows that all samples assayed less than the 30 g/t Au top cut.


Figure 1: Drill plan showing the drill holes relative to the 2013 resource model and the new parallel zones

To view an enhanced version of this graphic, please visit:
https://images.newsfilecorp.com/files/8051/133310_7659ee27e47ab9b1_002full.jpg

Table 2: Location of drill holes in this press release

HOLEEASTNORTHRLAZIMUTHDIPEOH
MMD-22-0236683005378663433135°-50°643.8m
MMD-22-0276684755378300438150°-50°494.0m
MMD-22-0316685005378300439120°-50°521.0m
MMD-22-0356684005378387479150°-50°623.05m
Approximate collar coordinates in NAD 83, Zone 15N

Results have been received for four holes that have tested the previously undrilled eastern extension of the Southwest Zone. They show that mineralization is continuous in several structurally-controlled zones. The Southwest Zone remains open in both the east and west directions.

These holes intersected several broad zones of low-grade mineralization within the altered diorite intrusion host. Examples include 61.85m @ 0.84 g/t Au from 440.25m in MMD-22-023; 124.9m @ 0.48 g/t Au from 95.1m in MMD-22-027; 64.3m @ 0.61 g/t Au from 15.5m and 82.5m @ 0.66 g/t Au from 91.95m in MMD-22-031; and 137.65m @ 0.37 g/t Au from 184.75m in MMD-22-035 among several 10-20 meter wide zones of low-grade gold mineralization throughout all holes.

All of these low-grade zones occur as envelopes to higher-grade structures. An analysis of oriented core by structural geologist, Dr. Brett Davis, confirmed that these form a three-dimensional, anastomosing shear network that has developed in response to strain on the altered diorite intrusion. Results include the broad zones of +1 g/t Au mineralization shown in the highlights (e.g., 39.75m @ 1.18 g/t Au from 440.25m in MMD-22-023) and several narrow high-grade intervals, including 0.8m @ 33.3 g/t Au from 462.2m in MMD-22-023; 0.3m @ 14.3 g/t Au from 172.3m in MMD-22-027; and 0.65m @ 15.5 g/t Au from 167.35m in MMD-22-031.

Pete Flindell, VP Exploration for Goldshore, said, “These drill results confirm the potential of the Moss Lake Gold Project. Drilling to test potential expansions to these parallel zones of mineralization will continue into the end of the year.”

Analytical and QA/QC Procedures

All samples were sent to ALS Geochemistry in Thunder Bay for preparation and analysis was performed in the ALS Vancouver analytical facility. ALS is accredited by the Standards Council of Canada (SCC) for the Accreditation of Mineral Analysis Testing Laboratories and CAN-P-4E ISO/IEC 17025. Samples were analyzed for gold via fire assay with an AA finish (“Au-AA23”) and 48 pathfinder elements via ICP-MS after four-acid digestion (“ME-MS61”). Samples that assayed over 10 ppm Au were re-run via fire assay with a gravimetric finish (“Au-GRA21”).

In addition to ALS quality assurance / quality control (“QA/QC”) protocols, Goldshore has implemented a quality control program for all samples collected through the drilling program. The quality control program was designed by a qualified and independent third party, with a focus on the quality of analytical results for gold. Analytical results are received, imported to our secure on-line database and evaluated to meet our established guidelines to ensure that all sample batches pass industry best practice for analytical quality control. Certified reference materials are considered acceptable if values returned are within three standard deviations of the certified value reported by the manufacture of the material. In addition to the certified reference material, certified blank material is included in the sample stream to monitor contamination during sample preparation. Blank material results are assessed based on the returned gold result being less than ten times the quoted lower detection limit of the analytical method. The results of the on-going analytical quality control program are evaluated and reported to Goldshore by Orix Geoscience Inc.

About Goldshore

Goldshore is an emerging junior gold development company, and owns the Moss Lake Gold Project located in Ontario. Wesdome is currently a large shareholder of Goldshore with an approximate 27% equity position in the Company. Well-financed and supported by an industry-leading management group, board of directors and advisory board, Goldshore is positioned to advance the Moss Lake Gold Project through the next stages of exploration and development.

About the Moss Lake Gold Project

The Moss Lake Gold Project is located approximately 100 km west of the city of Thunder Bay, Ontario. It is accessed via Highway 11 which passes within 1 km of the property boundary to the north. The Moss Lake Gold Project covers 14,292 hectares and consists of 282 unpatented and patented mining claims.

The Moss Lake Gold Project hosts a number of gold and base metal rich deposits including the Moss Lake Deposit, the East Coldstream Deposit (Table 3), the historically producing North Coldstream Mine (Table 4), and the Hamlin Zone, all of which occur over a mineralized trend exceeding 20 km in length. A historical preliminary economic assessment (the “Moss Lake Historical Estimate“) was completed on the Moss Lake Gold Project in 2013 and published by Moss Lake Gold Mines Ltd. (“Moss Lake Gold Mines“)1,3. A historical mineral resource estimate (the “East Coldstream Historical Estimate“) was completed on the East Coldstream Deposit in 2011 by Foundation Resources Inc.2,3 In addition to these zones, the Moss Lake Gold Project also hosts a number of under-explored mineral occurrences which are reported to exist both at surface and in historically drilled holes. The Moss Lake Deposit is a shear-hosted disseminated-style gold deposit which outcrops at surface. It has been drilled over a 2.5 km length and to depths of 300 m with 376 holes completed between 1983 and 2017. The last drilling program conducted in 2016 and 2017 by Wesdome Gold Mines Ltd. (“Wesdome“), which consisted of widely spaced holes along the strike extension of the deposit was successful in expanding the mineralized footprint and hydrothermal system 1.6 km to the northeast. Additionally, the deposit remains largely open to depth. In 2017, Wesdome completed an induced polarization survey which traced the potential extensions of pyrite mineralization associated with the Moss Lake Deposit over a total strike length of 8 km and spanning the entire extent of the survey grids.

The East Coldstream Deposit is a shear-hosted disseminated-style gold deposit which locally outcrops at surface. It has been drilled over a 1.3 km length and to depths of 200 m with 138 holes completed between 1988 and 2017. The deposit remains largely open at depth and may have the potential for expansion along strike. Historic drill hole highlights from the East Coldstream Deposit include 4.86 g/t Au over 27.3 m in C-10-15.

The historically producing North Coldstream Mine is reported to have produced significant amounts of copper, gold and silver4 from mineralization with potential iron-oxide-copper-gold deposit style affinity. The exploration potential immediately surrounding the historic mining area is not currently well understood and historic data compilation is required.

The Hamlin Zone is a significant occurrence of copper and gold mineralization, and also of potential iron-oxide-copper-gold deposit style affinity. Between 2008 and 2011, Glencore tested Hamlin with 24 drill holes which successfully outlined a broad and intermittently mineralized zone over a strike length of 900 m. Historic drill hole highlights from the Hamlin Zone include 0.9 g/t Au and 0.35% Cu over 150.7 m in HAM-11-75.

The Moss Lake, East Coldstream and North Coldstream deposits sit on a mineral trend marked by a regionally significant deformation zone locally referred to as the Wawiag Fault Zone in the area of the Moss Lake Deposit. This deformation zone occurs over a length of approximately 20 km on the Moss Lake Gold Project and there is an area spanning approximately 7 km between the Moss Lake and East Coldstream deposits that is significantly underexplored.

Table 3: Historical Mineral Resources1,2,3

INDICATEDINFERRED
DepositTonnesAu g/tAu ozTonnesAu g/tAu oz
Moss Lake Historical Estimate
Open Pit Potential39,795,0001.11,377,30048,904,0001.01,616,300
Underground Potential1,461,1002.9135,400
Moss Lake Total39,795,0001.11,377,30050,364,0001.11,751,600
East Coldstream Historical Estimate
East Coldstream Total3,516,7000.8596,40030,533,0000.78763,276
Combined Total43,311,7001.081,473,70080,897,0000.982,514,876


Notes:

(1) Source: Poirier, S., Patrick, G.A., Richard, P.L., and Palich, J. “Technical Report and Preliminary Economic Assessment for the Moss Lake Project”, prepared for Moss Lake Gold Mines Ltd. The qualified persons for the Moss Lake Historical Estimate are Pierre-Luc Richard, MSc, PGeo (InnovExplo Inc), and Carl Pelletier, BSc, PGeo (InnovExplo Inc), and the effective date of the Moss Lake Historical Estimate is February 8, 2013. In-Pit results are presented undiluted and in situ, within Whittle-optimized pit shells. Underground results are presented undiluted and in situ, outside Whittle-optimized pit shells. The Moss Lake Historical Estimate includes 18 gold-bearing zones and 1 envelope containing isolated gold intercepts. Whittle parameters: mining cost = C$2.28; pit slope angle = 50.0 degrees; production cost = C$9.55; mining Dilution = 5%; mining recovery = 95%; processing recovery = 80% to 85%; gold price = C$1,500. In-Pit and Underground resources were compiled at cut-off grades from 0.3 to 5.0 g/t Au (for sensitivity characterization). A cut-off grade of 0.5 g/t Au was selected as the official in-pit cut-off grade and a cut-off grade of 2.0 g/t Au was selected as the official underground cut-off grade. The Moss Lake Historical Estimate is based on 352 diamond drill holes (90,978 m) drilled from 1983 and 2008. A fixed density of 2.78 g/cm3 was used. A minimum true thickness of 5.0 m was applied, using the grade of the adjacent material when assayed or a value of zero when not assayed. Capping was established at 35 g/t Au, supported by statistical analysis and the high grade distribution within the deposit. Compositing was done on drill hole sections falling within the mineralized zone solids (composite = 1 m). Resources were evaluated from drill hole samples using the ID2 interpolation method in a multi-folder percent block model using Gems version 6.4. Based on geostatistics, the ellipse range for interpolation was 75m x 67.5m x 40m. The Indicated category is defined by combining the blocks within the two main zones and various statistical criteria, such as average distance to composites, distance to closest composite, quantity of drill holes within the search area. Ounce (troy) = metric tons x grade / 31.10348. Calculations used metric units (metres, tonnes and g/t). The number of metric tonnes was rounded to the nearest thousand. Any discrepancies in the totals are due to rounding effects; rounding followed the recommendations in NI 43-101.

(2) Source: McCracken, T. “Technical Report and Resource Estimate on the Osmani Gold Deposit, Coldstream Property, Northwestern Ontario”, prepared for Foundation Resources Inc. and Alto Ventures Ltd. The East Coldstream Historical Estimate is based on a 0.4 g/t Au cut-off grade. The qualified persons for the East Coldstream Historical Estimate are Todd McCracken, P.Geo. (Tetratech Wardrop), and Jeff Wilson, Ph.D., P.Geo. (Tetratech Wardrop), and the effective date of the East Coldstream Historical Estimate is December 12, 2011. Resources are presented unconstrained, undiluted and in situ. The East Coldstream Historical Estimate includes 2 gold-bearing zones. A cut-off grade of 0.4 g/t Au was selected as the official resource cut-off grade. The East Coldstream Historical Estimate is based on 116 diamond drill holes drilled from 1986 to 2011. A fixed density of 2.78 g/cm3 was used. Capping was established at 5.89 g/t Au and 5.70 g/t Au for domains EC-1 and EC-2, respectively. This is supported by statistical analysis and the high grade distribution within the deposit. Compositing was done on drill hole sections falling within the mineralized zone solids (composite = 1 m). Resources were evaluated from drill hole samples using the ID2 interpolation method in a multi-folder percent block model using Datamine Studio 3 version 3.20.5321.0. Recource categorization is based on spatial continuity based from the variography of the assays within the drillholes. Ounce (troy) = metric tons x grade / 31.10348. Calculations used metric units (metres, tonnes and g/t). The number of metric tonnes was rounded to the nearest thousand. Any discrepancies in the totals are due to rounding effects; rounding followed the recommendations in NI 43-101.

(3) The reader is cautioned that the Moss Lake Historical Estimate East and the East Coldstream Historical Estimate (the “Historical Estimates“) are considered historical in nature and as such is based on prior data and reports prepared by previous property owners. The reader is cautioned not to treat them, or any part of them, as current mineral resources or reserves. The Company has determined these historical resources are reliable, and relevant to be included here in that they demonstrate simply the mineral potential of the Moss Lake Gold Project. A qualified person has not done sufficient work to classify the Historical Estimates as current resources and Goldshore is not treating the Historical Estimates as current resources. Significant data compilation, re-drilling, re-sampling and data verification may be required by a qualified person before the Historical Estimates can be classified as a current resource. There can be no assurance that any of the historical mineral resources, in whole or in part, will ever become economically viable. In addition, mineral resources are not mineral reserves and do not have demonstrated economic viability. Even if classified as a current resource, there is no certainty as to whether further exploration will result in any inferred mineral resources being upgraded to an indicated or measured mineral resource category. The Historical Estimates relating to inferred mineral resources were calculated using prior mining industry standard definitions and practices for estimating mineral resource and mineral reserves. Such prior definitions and practices were utilized prior to the implementation of the current standards of the Canadian Institute of Mining for mineral resource estimation, and have a lower level of confidence.

Table 4: Reported Historical Production from the North Coldstream Deposit4

DepositTonnesCu %Au g/tAgCu lbsAu ozAg oz
Historical Production2,700,00001.890.565.59102,000,00044,000440,000


Note:

(4) Source: Schlanka, R., 1969. Copper, Nickel, Lead and Zinc Deposits of Ontario, Mineral Resources Circular No. 12, Ontario Geological Survey, pp. 314-316.

Peter Flindell, P.Geo., MAusIMM, MAIG, Vice President – Exploration of the Company, a qualified person under NI 43-101 has approved the scientific and technical information contained in this news release.

Neither the TSXV nor its Regulation Services Provider (as that term is defined in the policies of the TSXV) accepts responsibility for the adequacy or accuracy of this release.

For More Information – Please Contact:

Brett A. Richards
President, Chief Executive Officer and Director
Goldshore Resources Inc.

P. +1 604 288 4416
M. +1 905 449 1500
E. brichards@goldshoreresources.com
W. www.goldshoreresources.com

Facebook: GoldShoreRes | Twitter: GoldShoreRes | LinkedIn: goldshoreres

Cautionary Note Regarding Forward-Looking Statements

This news release contains statements that constitute “forward-looking statements.” Such forward looking statements involve known and unknown risks, uncertainties and other factors that may cause the Company’s actual results, performance or achievements, or developments to differ materially from the anticipated results, performance or achievements expressed or implied by such forward-looking statements. Forward looking statements are statements that are not historical facts and are generally, but not always, identified by the words “expects,” “plans,” “anticipates,” “believes,” “intends,” “estimates,” “projects,” “potential” and similar expressions, or that events or conditions “will,” “would,” “may,” “could” or “should” occur.

Forward-looking statements in this news release include, among others, statements relating to expectations regarding the exploration and development of the Moss Lake Gold Project, and other statements that are not historical facts. By their nature, forward-looking statements involve known and unknown risks, uncertainties and other factors which may cause our actual results, performance or achievements, or other future events, to be materially different from any future results, performance or achievements expressed or implied by such forward-looking statements. Such factors and risks include, among others: the Company may require additional financing from time to time in order to continue its operations which may not be available when needed or on acceptable terms and conditions acceptable; compliance with extensive government regulation; domestic and foreign laws and regulations could adversely affect the Company’s business and results of operations; the stock markets have experienced volatility that often has been unrelated to the performance of companies and these fluctuations may adversely affect the price of the Company’s securities, regardless of its operating performance; and the impact of COVID-19.

The forward-looking information contained in this news release represents the expectations of the Company as of the date of this news release and, accordingly, is subject to change after such date. Readers should not place undue importance on forward-looking information and should not rely upon this information as of any other date. The Company undertakes no obligation to update these forward-looking statements in the event that management’s beliefs, estimates or opinions, or other factors, should change.

This news release does not constitute an offer to sell, or a solicitation of an offer to buy, any securities in the United States. The securities have not been and will not be registered under the United States Securities Act of 1933, as amended (the “U.S. Securities Act”) or any state securities laws and may not be offered or sold within the United States or to U.S. Persons unless registered under the U.S. Securities Act and applicable state securities laws or an exemption from such registration is available.

To view the source version of this press release, please visit https://www.newsfilecorp.com/release/133310

Categories
Capitalism Morality Exclusive Interviews Gold Shore Resources Junior Mining Precious Metals

(VIDEO) Goldshore Resources – Moss Lake has Depth, Width and Along Strike

Goldshore Resources – (TSX.V: GSHR | OTCQB: GSHRF)
Website: https://goldshoreresources.com/
3D Deck: https://goldshoreresources.com/investors/#corporate-presentation

Goal: To Create the Next Tier One Asset in Ontario, Canada.

Flagship Project: The Moss Lake Property located in Ontario, Canada has 1.47 M oz of Indicated and 2.51 M oz of Inferred historical gold resources, along with a robust Preliminary Economic Assessment conducted in 2020.

Joining us for our conversation is Brett Richards, the CEO of Goldshore Resources.

Maurice Jackson: Mr. Richards, it’s a pleasure to be speaking with you today as Goldshore Resources has some exciting news for shareholders, as the company continues on its path to creating the next Tier One asset in Ontario, Canada. Mr. Richards, for someone new to the story, please introduce us to Goldshore Resources and the exciting opportunity the company presents to shareholders.

Brett Richards: Goldshore is a company that was formed last year. We’ve been trading for just over a year now, and on the back of acquiring the Moss Lake Project from Wesdome Gold Mines for $52 million in cash and shares last year, we have put together a strategy over the last nine months to drill this up to let’s call it critical mass. What we acquired in the Moss Lake Project was a 4 million-ounce historic resource, and our view is that the extensions of this resource, both laterally along strike and at depth, are significant, particularly along strike.

Our original strategy was let’s put together a 100,000-meter drill program. Let’s get financed and let’s get on with it, and that’s what we’ve been doing for the past nine months, and most recent results are starting to I’ll say support the original thesis we had about Moss Lake being much bigger than first thought.

Maurice Jackson: Before we deep dive into the press release, some important competitive advantages distinguish Goldshore Resources from its peers and truly make the Moss Lake property a unique value proposition. Mr. Richards, for someone new to the flagship Moss Lake property, please acquaint us with the deposit, beginning with your location and some of your neighbors in the region.

Brett Richards: The Moss Lake Property is about 120 kilometers northwest of Thunder Bay in Ontario. We are probably in the most mining-friendly jurisdiction in the world, plus we are on the Trans-Canada Highway, Yonge Street in Toronto, which happens to be the longest street in the world, going all the way to Manitoba. Our concession is adjoined to Trans-Canada Highway.

And why is that important? It’s important for several reasons, particularly about infrastructure. When I look at mining projects, at the end of the day, obviously there’s the technical side of things, but there’s also what I call the do-ability factor. Is this mine really doable? Can you get this into production easily? And the answer for Moss Lake is yes.

Being on the Trans-Canada Highway means we’re afforded 10-cent kilowatt-hour power, which goes right by our doorstep. We have a four-lane highway, so access to our site is as good as it gets. We have power, water, rail, people, consultants, contractors, and government, all within nothing more than an hour’s drive into the City of Thunder Bay, and an international port and an international airport. So, we tick all the boxes when it comes to infrastructure, so that is kind of, I’ll say the description of where we are, and why I think it’s so compelling to be where we are.

There are a lot of people around us as well. The Shebandowan Greenstone Belt where we’re located has been a bit under-explored over the years because low-grade bulk tonnage style deposits were not in favor when gold was $1,500. But now gold is kind of trading on a floor of $1,800, they seem to be much more appealing to investors. Certainly, after the success of Detour Lake, I think you’ll see these types of deposits more and more come into production.

Maurice Jackson: You referenced Goldshore Resources as having a historical resource, and the company also completed a robust Preliminary Economic Assessment (PEA) back in 2020. Can you share some of those highlights with us?

Brett Richards: Historically the area has been, let’s, so-called cobbled together as a big land package. There are three distinct areas within our domain, the Moss Lake area being kind of the flagship. It is what carries three and a half million ounces of that historical resource. Up in the Northeast, up near the highway, we have Coldstream and North Coldstream and Iris Lake against all kinds of compartmentalized land packages that were cobbled together by Wesdome.

There’s a 500,000-ounce historical resource on Coldstream, and a former actual operating mine at North Coldstream that ran for about 30 years in the, about 40 or 50 years ago. We have a very interesting kind of, I’ll say land package, and the work that has been done on this culminated in 2013 when a PEA was done on the property by Moss Lake Gold Mines.

Again, the PEA was updated in 2020 by WesDome before kind of launching a sale process and let’s face it, PEAs are a snapshot in time, and the time in 2013 and the time in 2020, and the time today are all very, very different, knowing that we are in a hyperinflationary environment today, what CAPEX might have been $500 million back in 2020, might be 600 million or $650 million today.

We have to keep that in mind as we go through. But I think back in 2013, and back in 2020, this project, at these gold levels, at $1,800 to $2,200 gold, and trades between a 27% and a 40% IRR. So, after-tax, the internal rate of return, is very, very compelling. We can look at the new present values of these projects, but again, they’re snapshots in time. What that tells me is that this is a robust project that when tested, even with inflation, even with different input assumptions, relative to the economic circumstances at the time, it is going to be a robust project.

Maurice Jackson: Goldshore Resources currently is embarked on a 100,000-meter drill program. Are you twinning the holes, and conducting step-out drilling on this?

Brett Richards: We are doing some verification drilling of the existing historical resource. We are stepping out laterally. We are stepping out along strike, and we have identified a parallel zone to the Moss Lake deposit, which is very exciting, and some high-grade structural areas within the deposit, which we’ll look to improve the overall grade and volume as we get further down the road, and get closer to a resource estimate.

Maurice Jackson: Speaking of your drill program, some of the initial assay results have just been released. What do they seem to indicate thus far?

Brett Richards: Well, I think they, we’ve always been trying to test our thesis that this is bigger and much more robust as a deposit than the historical resource illustrates. We’ve done that through a geophysical survey, and you can see that on our website, the 3D model of it, where you can see the potential for future mineralization up along strike, that goes 7 to 12 kilometers further than where Moss Lake is now.

But I think the results that we started to put out from the very beginning show between one, 1.1, 1.2, and 1.3 grams over long intervals, long intercepts of 50, 60, 70, 100, and 120 meters in some cases. I’ll say, some good intercepts, but I think what the surprise has been where we have gone kind of not twining holes, but stepping out a little bit, and stepping into an area that might be classified as inferred.

We’ve hit some high-grade structures, and I think that’s simply because of the geophysical work we’ve done, the structural work we’ve done with a structural geologist by the name of Brett Davis, who’s on-site currently. Pete Flindell, who is our VP of Exploration, he and the team have kind of figured this out. Targeting of some of these higher grade holes has been something that we wanted to do, because ultimately when we kind of go to, I’ll say, interpret all of this data, I don’t think the market is going to want another kind of $1.5 or $2 billion project that does 60,000 tons a day and produces 600,000 ounces of gold. That’s just not viable in this current economic environment.

You’re not going to be able to raise that kind of money. You’re not going to be able to get traction on that type of project. I think we have to start pivoting and looking at alternatives, and what are those? Is there a higher-grade starter pit alternative here within the deposit? I think that’s what we’re going to try and kind of focus on over the next little while. Therefore, there will be more infill and more delineation drilling than anything. But, we are still doing some step-out as well.

Maurice Jackson: All right. Well, let’s get to the press release. Goldshore Resources just received some welcoming news from the assay labs, which identify significant downhole gold intercepts. What can you share with us, Sir?

Brett Richards: We just announced, 78 meters at 1.17 grams from about 170 meters depth. This is a great hole. It’s all going to get contained within an open-pit mine. It’s going to pull a lot of tonnage in. I think, there were some high-grade areas within that, including 22 meters at 2.3 grams and 5.6 meters at 5.69 grams, in and around the 200 to the 220-meter range.

So, this is encouraging, and there are some other intercepts on some other holes that we announced, but it’s all more of the same. There’s anywhere from 20 to a hundred meters at over a gram.

Our objective is to try to maximize the grade. A little bit of grade, 0.1 grams here is going to add 10% to our resource. Even 1 gram or 1.1 gram, it’s quite meaningful at the end of the day. We’ll figure all this out once we get all the data and get towards a mineral source update at the end of the year. But I think right now, and I can talk a lot about the current market dynamics, but sadly, putting good results out into the market has not moved our share price. It’s actually, we have been impacted like all the other junior minors and we’ve been trading downwards.

Maurice Jackson: Looking forward, what can you share with us regarding optionality and economic open pit shells as you model your resource?

Brett Richards: I think we’re going to see a lot of results come out over the next six months or more of the same, illustrating our thesis that this is going to be a real project. Also, I think better delineation on defining this higher-grade starting project, but we can’t lose sight that this is, I think, this is a Tier One asset. This is going to be 10 million ounces by the time the drilling has wrapped up. Whether that’s a year or two or three from now. This is such a large area. There’s probably going to be another 100,000 meters as this gets towards a feasibility study.

Like I’ve said, we’ve got a footprint here that is a Tier One asset at the end of the day, but I think we need to start focusing on what the market is going to respond to. The market is going to respond to, is this a project that has a smaller CAPEX option, a smaller starter with that positive cash flow as soon as possible. Those types of questions need to be addressed and need to be presented to the market. So, we’re going to be looking at some permutations at the end of the day, when we do a PEA next year.

Maurice Jackson: Let’s get into some numbers. Mr. Richards, please provide the capital structure for Goldshore Resource.

Brett Richards: Goldshore Resources has about 143 million shares outstanding today, and only 5 million out warrants outstanding, and we’ve got about $13 million in the bank as of June. We’re well-positioned here and can ride this out.

As I’ve said before, we got caught in a bit of the whole market dynamics. We wanted to play a bit of catch-up, and get ahead of the curve on drilling, so we ramped up our drilling just before the whole market started crashing.

Our team took our foot off the pedal, and we put the brakes on it a little bit. We did scale up to seven rigs, but we’ve pulled back now to a couple of rigs. I want to ride this out. Preservation of cash and preservation of this company is first and foremost.

The capital markets are so volatile and so unpredictable right now, I’m very comfortable just burning a couple of million dollars a month and just watching this, or less than a couple of million dollars a month, and just watching how this unfolds to the fall because we don’t want to be in a situation where, where we have to go to the market and the market is not there for us.

Maurice Jackson: Speaking of being comfortable, I just want to share with everyone that I am a proud shareholder, and I’m looking to add to my position under these circumstances. The value proposition is extremely compelling, and I’m not discouraged by the price. I understand how markets work, and I never complain about a sale when it comes to capital goods. Now, since we’re covering numbers, how does Goldshore Resources compare with some of your peers?

Brett Richards: Well, we’ve never been able to kind of figure this one out, but we’re trading today somewhere kind of in order of magnitude around $10 an ounce, it’s crazy, but that is kind of where we are today. Our peers have also been impacted, but they also had a higher starting point. We’ve got a trading comparable sheet in our presentation that has us at the bottom of our peer group, and this is a peer group put together by a bank. At trading at $10 today, and our peers trading anywhere from $15, $20, $25, all the way up to $100 an ounce for Marathon.Looking at a pure comparison basis, Goldshore Resources is the least expensive among our peers. When you start looking at what it costs to bring ounces onto a resource statement, to put ounces into the inferred category costs about $30 an ounce. If you have a million ounces of inferred resource, it’ll probably cost $30 million to get there, then drilling in other activities.

So we’re trading at a third of that, a third of what it costs to do it. So, I think from an investment opportunity standpoint, there’s one way here, and it’s up.

Maurice Jackson: In closing, Sir, what would you like to say to shareholders?

Brett Richards: I think the really compelling investment case here is how we have performed against the general market, and where we are today. I’ll say the leverage that we have on the way back up. This is not going to go on forever. We may still feel some pain in the capital markets going forward, but we are going to recover, and commodities and equity, gold equities are going to accelerate, and probably much faster than the market when it does turn around, and when it does come back. We are actually leveraged to that even greater than the normal gold equity market, because of our size and our scale, and our potential to bring this up to a Tier One status.

So, there are some compounding, compelling investment reasons why to choose Goldshore, and I am also a major shareholder of this company. I have never continued to lose sight of the fact that this is a real project, and this is going to get into production one day.

Maurice Jackson: Mr. Richards, it’s been a pleasure speaking with you today. Wishing you and Goldshore Resources, the absolute best, Sir.

Brett Richards: Thanks, Maurice.

Maurice Jackson is the founder of Proven and Probable, a site that aims to enrich its subscribers through education in precious metals and junior mining companies that will improve the world.

Categories
Base Metals Energy Junior Mining Noram Lithium

Noram Receives Results for CVZ-75 & 76: High-Grade Intercepts of 150 Ft (45.7 M) Averaging 962 PPM, & 100 Ft (30.5 M) Averaging 1163 PPM Respectively

VANCOUVER, BC / ACCESSWIRE / June 2, 2022 / Sandy MacDougall, CEO of Noram Lithium Corp. (“Noram” or the “Company“) (TSXV:NRM)(OTCQB:NRVTF)(Frankfurt:N7R) is pleased to announce the successful completion of CVZ-75 (PH-01) and CVZ-76 (PH-02) and release of the final assay results. The Company completed core hole CVZ-75 at a depth of 326 feet (99.4 m). Sampling for assays began at 46 ft (14.0 m) and continued to the bottom of the hole, an interval thickness of 150 ft (45.7 m) was intersected from 46 ft (14.0 m) to 196 ft (59.7 m). The hole ended in mineralization and the weighted average lithium values present are summarized below. The Company completed core hole CVZ-76 at a depth of 338 feet (103.0 m). Sampling for assays began at 26 ft (7.9 m) and continued to the bottom of the hole, an interval thickness of 100 ft (30.5 m) was intersected from 26 ft (7.9 m) to 126 ft (38.4 m). The hole ended in mineralization and the weighted average lithium values present are summarized below.

Noram Ventures Inc., Thursday, June 2, 2022, Press release picture

Figure 1 – Location of all past drill holes (Phase I to Phase V) previously completed in addition to the 12 proposed holes for Phase V1. Phase VI holes are indicated in purple.

Noram Ventures Inc., Thursday, June 2, 2022, Press release picture

Figure 2 – Comparative stratigraphy and assay results for drill holes CVZ-76 and CVZ-75 as compared to CVZ-63 which was drilled as part of a prior program. The histogram on the sides of the holes are the composited lithium grades in ppm Li. The cross section has a 4X vertical exaggeration.

“Holes CVZ-75 and CVZ-76 were located near the northeast end of the Phase V and Phase VI drilling. This is an area where the sediments are thinner since we are getting close to the basin margin. However, the lithium grades continue to be high. These holes are expected to continue to upgrade portions of the Zeus resource from inferred to indicated in Noram’s upcoming PFS.” comments Brad Peek, VP of Exploration and geologist on all six phases of Noram’s Clayton Valley exploration drilling.

Hole IDSample No.From (ft)To (ft)From (m)To (m)Li (ppm)
CVZ-751748394465614.017.11690
CVZ-751748395566617.120.1890
CVZ-751748396667620.123.2840
CVZ-751748397768623.226.2910
CVZ-751748398869626.229.31420
CVZ-7517483999610629.332.31160
CVZ-75174840010611632.335.41010
CVZ-75174840111612635.438.4900
CVZ-75174840212613638.441.5870
CVZ-75174840413614641.544.5850
CVZ-75174840514615644.547.5820
CVZ-75174840615616647.550.6810
CVZ-75174840716617650.653.6620
CVZ-75174840817618653.656.7510
CVZ-75174840918619656.759.71130
CVZ-75174841019620659.762.8800
CVZ-75174841120621662.865.8560
CVZ-75174841221622665.868.9650
CVZ-75174841322623668.971.9680
CVZ-75174841423624671.975.0510
CVZ-75174841524625675.078.0650
CVZ-75174841625626678.081.1570
CVZ-75174841726627681.184.1770
CVZ-75174841827628684.187.2570
CVZ-75174841928629687.290.2510
CVZ-75174842029630690.293.3770
CVZ-75174842130631693.396.3470
CVZ-75174842231632696.399.4600

Table 1 – Sample results from CVZ-75 from 46 ft (14.0 m) to depth of 326 ft (99.4 m).

Hole IDSample No.From (ft)To (ft)From (m)To (m)Li (ppm)
CVZ-76174842626367.911.01320
CVZ-761748427364611.014.01620
CVZ-761748428465614.017.11620
CVZ-761748429566617.120.1970
CVZ-761748430667620.123.2830
CVZ-761748431768623.226.2910
CVZ-761748432869626.229.31460
CVZ-7617484339610629.332.31070
CVZ-76174843410611632.335.4930
CVZ-76174843511612635.438.4900
CVZ-76174843612613638.441.5780
CVZ-76174843713614641.544.5710
CVZ-76174843814615644.547.5670
CVZ-76174843915616847.551.2720
CVZ-76No Sample16817851.254.3
CVZ-76174844017818854.357.3460
CVZ-76174844118819857.360.4840
CVZ-76174844219820860.463.4700
CVZ-76174844320821863.466.4740
CVZ-76174844421822866.469.5720
CVZ-76174844522823869.572.5710
CVZ-76174844623824872.575.6520
CVZ-76174844724825875.678.6680
CVZ-76174844825826878.681.7640
CVZ-76174844926827881.784.7640
CVZ-76174845027828884.787.8590
CVZ-76174845128829887.890.8590
CVZ-76174845229830890.893.9449
CVZ-76174845330831893.996.9610
CVZ-76174845431832896.9100.0560
CVZ-761748455328338100.0103.0470

Table 2 – Sample results from CVZ-76 from 26 ft (7.9 m) to depth of 338 ft (103.0 m).

All samples were analyzed by the ALS laboratory in Reno, Nevada. QA/QC samples were included in the sample batch and returned values that were within their expected ranges.

The technical information contained in this news release has been reviewed and approved by Brad Peek., M.Sc., CPG, who is a Qualified Person with respect to Noram’s Clayton Valley Lithium Project as defined under National Instrument 43-101.

About Noram Lithium Corp.

Noram Lithium Corp. (TSXV:NRM | OTCQB:NRVTF | Frankfurt:N7R) is a well-financed Canadian based advanced Lithium development stage company with less than 90 million shares issued and a fully funded treasury. Noram is aggressively advancing its Zeus Lithium Project in Nevada from the development-stage level through the completion of a Pre-Feasibility Study in 2022.

The Company’s flagship asset is the Zeus Lithium Project (“Zeus”), located in Clayton Valley, Nevada. The Zeus Project contains a current 43-101 measured and indicated resource estimate* of 363 million tonnes grading 923 ppm lithium, and an inferred resource of 827 million tonnes grading 884 ppm lithium utilizing a 400 ppm Li cut-off. In December 2021, a robust PEA** indicated an After-Tax NPV(8) of US$1.3 Billion and IRR of 31% using US$9,500/tonne Lithium Carbonate Equivalent (LCE). Using the LCE long term forecast of US$14,000/tonne, the PEA indicates an NPV (8%) of approximately US$2.6 Billion and an IRR of 52% at US$14,000/tonne LCE.

Please visit our web site for further information: www.noramlithiumcorp.com.

ON BEHALF OF THE BOARD OF DIRECTORS

Sandy MacDougall
Chief Executive Officer and Director
C: 778.999.2159

For additional information please contact:

Peter A. Ball
President and Chief Operating Officer
peter@noramlithiumcorp.com
C: 778.344.4653

Neither the TSX Venture Exchange nor its Regulation Services Provider (as that term is defined in the policies of the TSX Venture Exchange) accepts responsibility for the adequacy or accuracy of this release. This news release may contain forward-looking information which is not comprised of historical facts. Forward-looking information involves risks, uncertainties and other factors that could cause actual events, results, performance, prospects and opportunities to differ materially from those expressed or implied by such forward-looking information. Forward-looking information in this news release includes statements regarding, among other things, the completion transactions completed in the Agreement. Factors that could cause actual results to differ materially from such forward-looking information include, but are not limited to, regulatory approval processes. Although Noram believes that the assumptions used in preparing the forward-looking information in this news release are reasonable, including that all necessary regulatory approvals will be obtained in a timely manner, undue reliance should not be placed on such information, which only applies as of the date of this news release, and no assurance can be given that such events will occur in the disclosed time frames or at all. Noram disclaims any intention or obligation to update or revise any forward-looking information, whether as a result of new information, future events or otherwise, other than as required by applicable securities laws. *Updated Lithium Mineral Resource Estimate, Zeus Project, Clayton Valley, Esmeralda County, Nevada, USA (August 2021) **Preliminary Economic Assessment Zeus Project, ABH Engineering (December 2021).

SOURCE: Noram Ventures Inc.


View source version on accesswire.com:
https://www.accesswire.com/703581/Noram-Receives-Results-for-CVZ-75-76-High-Grade-Intercepts-of-150-Ft-457-M-Averaging-962-PPM-100-Ft-305-M-Averaging-1163-PPM-Respectively

Categories
Precious Metals

Gold Needs to “Glow Up”


Click here

As of August 24, gold bullion1 has gained 27.13% YTD and 39.74% YOY. Gold mining equities (SGDM)2 are up 38.85% YTD and 61.54% YOY. This compares to 7.55% YTD and 11.96% YOY returns for the S&P 500 TR Index.3  Silver has posted outsized gains, climbing 49.03% YTD and 50.00% YOY.

Delivered to You

855.505.1900 | Maurice@MilesFranklin.com

Click Here