Olympio Metals Limited (ASX: OLY) will acquire an 80% interest in Scout’s Jacknife silver project for US$120,000 in cash, 45,000,000 Olympio shares, and up to 25,000,000 performance shares, with a firm commitment of 17,000 meters of drilling over six years.
Scout retains a 20% interest, free-carried through to commercial production and will be the in-country operating partner, providing geological and drilling services with its internal teams and drill rigs at cost plus 25%.
The agreement extends Scout’s vertically integrated discovery-to-partnership model: the Company profitably advances its own projects with in-house drill rigs and geologic teams while retaining a carried interest.
Coeur d’Alene, Idaho – July 20, 2026 – Scout Discoveries Corp. (“Scout” or the “Company”) is pleased to announce the execution of a binding asset sale and joint venture agreement with Olympio Metals Limited (ASX: OLY) (“Olympio”). Under the agreement, Olympio will acquire an 80% interest in Scout’s Jacknife high-grade silver project (the “Project”), located in the Lakeview Mining District, Bonner County, Idaho, part of the broader Silver Valley region, and the parties will form an 80/20 joint venture to advance the Project, summarized below and in Table 1.
Transaction HighlightsUpfront Consideration:US$20,000 non-refundable deposit within 30 days of execution of the agreement, with a 30-day due diligence period; andUS$100,000 in cash and 45,000,000 fully paid ordinary Olympio shares on satisfactory completion of due diligence, with all shares subject to a 12-month voluntary escrow from the date of issue. Based on Olympio’s most recent closing share price of A$0.048, the 45,000,000 share position is worth approximately US$1.5 million.Performance Shares: Scout is eligible to receive up to 25 million additional Olympio shares upon achievement of the following milestones:5,000,000 shares on commencement of drilling at the Project;10,000,000 shares on granting of drilling approvals for the unpatented claims; and10,000,000 shares on announcement of a JORC or NI 43-101 compliant Mineral Resource Estimate of at least 3Moz AgEq.Joint Venture and FreeCarry: Olympio (80%) and Scout (20%) will form a joint venture for further exploration and development of the Project. Scout will be free-carried through to commercial production, with Olympio funding 100% of joint venture expenditure during the carry period, including work programs, claim maintenance, permitting, bonding, underlying payments, and insurance. Scout has no cash funding obligation and is not subject to dilution during the carry. Following commencement of commercial production, Olympio may recover mine development costs from Scout’s share of production, with prior exploration, drilling, overhead, and financing costs excluded.Required Work Obligations: Olympio must fund geologic mapping and geochemistry in Year 1, geophysics in Year 2, 5,000 meters of drilling by Year 3, and 17,000 meters of cumulative drilling by Year 6. Missed milestones trigger cure rights and reduction of Olympio’s interest, including full reversion of the Project to Scout for a Year 1 failure.Scout as Operating Partner: Scout will provide geological, drilling, and exploration services to the joint venture at cost plus 25% (land and claim payments passed through at cost), executed with the Company’s internal core drill rigs and geologic team.Assumed Obligations: Olympio will assume the pre-existing third-party royalty and advance royalty obligations on the Project and will hold the benefit of Scout’s right of first refusal over the nearby historical Lakeview Mill.Post-Carry Funding: After the carry period and recovery of carried costs, the parties fund pro rata or dilute. If Scout is diluted below 10%, it may elect to convert its interest to a 1% NSR royalty or retain its diluted interest.
Curtis Johnson, Scout’s President and CEO commented, “Jacknife is a clear example of Scout’s business model in action. We consolidated a district-scale silver project anchored by patented mining claims in one of the world’s premier silver regions, outlined the targets, and have now brought on a quality partner in Olympio to fund its advancement while Scout stays directly engaged as the operating partner. We maintain continuity with the targeting by drilling with our own rigs and geologic team, while generating meaningful revenue for Scout over the coming years. Most importantly, we retain a 20% interest free-carried through to commercial production, plus meaningful equity in Olympio to share in any future discovery success.”
About the Jacknife ProjectThe Jacknife Project covers 3,940 acres in the Lakeview Mining District, approximately 35 kilometers northeast of Coeur d’Alene, Idaho, and 45 kilometers north of the prolific Silver Valley Mining District, which has produced over 1.2 billion ounces of silver (Figure 1). The Project includes 335 acres of patented mining claims covering ~80% of a ~7-kilometer trend of mineralized shear zones hosted in the same Belt Supergroup formations as the Silver Valley deposits.Patented claims are private property requiring no federal permitting for exploration and limited permitting for underground mining. Six historical mines within the Project produced over 3.2Moz of silver at an average grade of 12.7 oz/t, including ~2Moz at grades up to 22 oz/t (684 g/t) Ag from the Conjecture Mine (1956–1964), which was developed to a depth of more than 600 meters. A 1975 historical estimate for the Conjecture Mine reported 632,081 tonnes @ 13 oz/t (405 g/t) Ag for 8.22Moz of silver, and mineralization remains open along strike and at depth. Historical drilling in 2012 returned intercepts including 1.4m @ 692 g/t Ag and 0.6m @ 1,106 g/t Ag.
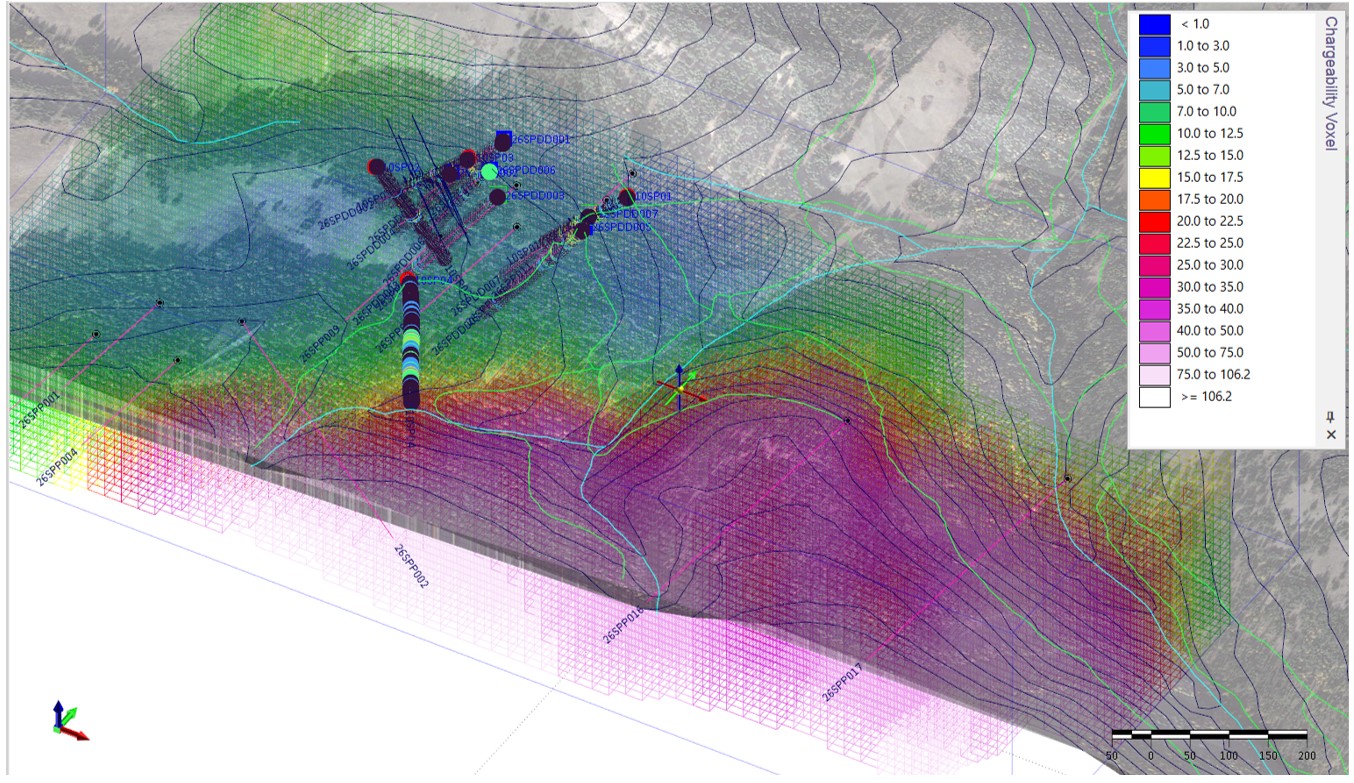
Next Steps – Work ProgramOlympio will fund a maiden core drilling program at the Conjecture Shear Zone, targeting the continuity of grade between the historical mine levels, together with Project-wide geologic mapping and soil and rock sampling to generate and prioritize additional drill targets (Figure 2). Because the patented claims provide immediate access with no federal permitting for exploration, drilling can commence once a drill rig is available. Scout will execute the work programs as operating partner using its internal core drill rigs and geologic team.
Cautionary note: The Conjecture Mine estimate is a historical estimate prepared in 1975, prior to the establishment of modern reporting codes. It is not compliant with S-K 1300, NI 43-101, or the JORC Code (2012); a qualified or competent person has not done sufficient work to classify it as a current mineral resource; and it should not be relied upon. Further evaluation, including drilling, is required to verify the estimate. Historical production and drilling results are drawn from historical records that have not been independently verified.
About Olympio Metals LimitedOlympio Metals Limited (ASX: OLY) is an Australian listed mineral exploration company headquartered in West Perth, Western Australia. Olympio’s portfolio includes the Raven high-grade silver project and the Sawtooth antimony project in the western United States.
About Scout Discoveries Corp.Scout Discoveries Corp., headquartered in Coeur d’Alene, Idaho, is a private U.S. mineral exploration company with rights to twelve separate precious and base metal projects in the western U.S.A., comprising one of the largest unpatented claim holdings in the region, totaling over 50,000 acres. Scout’s vision is to bring the full discovery process in-house from idea generation through resource drilling, lowering costs and increasing efficiency. With this model, the Company can rapidly advance its project portfolio through discovery by leveraging its five internal core drill rigs and experienced technical teams.For further information, visit: https://www.scoutdiscoveries.com/
Forward-looking StatementsCertain statements in this news release are forward-looking and involve a number of risks and uncertainties. Such forward-looking statements are within the meaning of that term in Section 27A of the Securities Act of 1933, as amended, and Section 21E of the Securities Exchange Act of 1934, as amended. Forward-looking statements are not comprised of historical facts. Forward-looking statements include estimates and statements that describe the Company’s future plans, objectives or goals, including words to the effect that the Company or management expects a stated condition or result to occur. Forward-looking statements may be identified by such terms as “believes”, “anticipates”, “expects”, “estimates”, “may”, “could”, “would”, “will”, or “plan”. Since forward-looking statements are based on assumptions and address future events and conditions, by their very nature they involve inherent risks and uncertainties. Although these statements are based on information currently available to the Company, the Company provides no assurance that actual results will meet management’s expectations. Risks, uncertainties and other factors involved with forward-looking information could cause actual events, results, performance, prospects and opportunities to differ materially from those expressed or implied by such forward-looking information. Factors that could cause actual results to differ materially from such forward-looking information include, but are not limited to those risks set out in the Company’s public documents filed on EDGAR. Although the Company believes that the assumptions and factors used in preparing the forward-looking information in this news release are reasonable, undue reliance should not be placed on such information, which only applies as of the date of this news release, and no assurance can be given that such events will occur in the disclosed time frames or at all. The Company disclaims any intention or obligation to update or revise any forward-looking information, whether as a result of new information, future events or otherwise, other than as required by law. No stock exchange, securities commission or other regulatory authority has approved or disapproved the information contained herein.
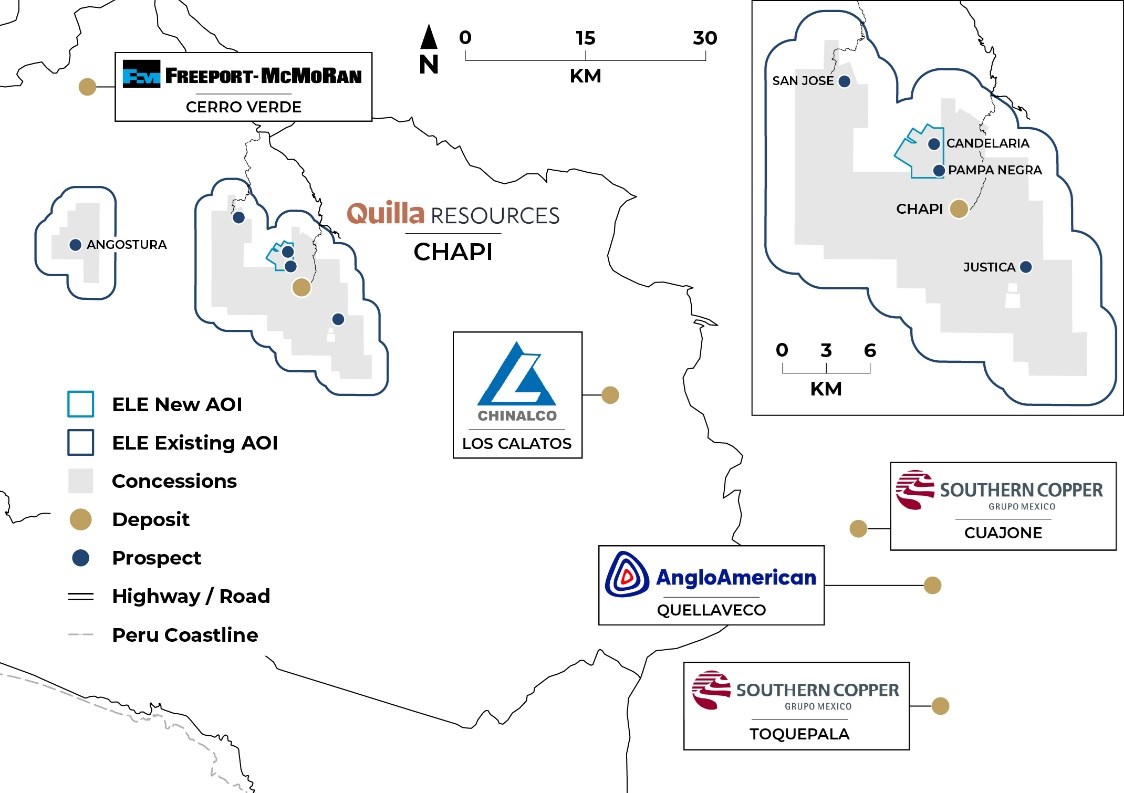
Denver, Colorado–(Newsfile Corp. – July 15, 2026) – Elemental Royalty Corporation (NASDAQ: ELE) (TSX: ELE) (“Elemental” or the “Company“) is pleased to announce that it has entered into a strategic US$25 million investment package (the “Transaction“) with Quilla Resources Inc. (“Quilla“) and its subsidiary Minera Pampa de Cobre S.A.C. (“MPC“) to expand Elemental’s royalty exposure to the producing Chapi Copper Project in Peru (“Chapi“) and support Quilla’s next phase of growth.
The Transaction includes the acquisition of both equity in Quilla, and an additional perpetual, uncapped 1.0% net smelter return (“NSR“) royalty over the Pampa Negra and Candelaria concessions, which are expected to be important contributors to Quilla’s planned expansion of Chapi.
Highlights
Existing Producing Royalty: Elemental has agreed a strategic US$25 million investment package with Quilla to expand its existing royalty exposure to the Chapi copper project and support Quilla’s next phase of growth
Increases Exposure to Project: Elemental acquired an additional perpetual, uncapped 1.0% NSR royalty over Quilla’s Pampa Negra and Candelaria concessions, increasing Elemental’s royalty interest to a total of 3.0% NSR
Expansion Plans underway: Pampa Negra and Candelaria will be important contributors to Quilla’s future expansion of Chapi from 10,000 tonnes per annum to 30,000 tonnes per annum of copper cathode production
Experienced team with track record of delivery: Quilla’s management team have an established history in Peru, including as senior executives at Rio Alto, Milpo, Buenaventura, and the Antamina mine.
Elemental Chief Executive Officer, David M. Cole, commented:“This transaction moves Chapi into a top ten royalty for Elemental by increasing our exposure to Quilla’s Phase 2 expansion at Pampa Negra and Candelaria following the recent successful commissioning of the Chapi mine. The management team’s proven track record of operating in Peru sets them up for continued growth, while Chapi is strategically located within the Southern Copper Belt alongside mines operated by Freeport-McMoRan, Buenaventura, Anglo American, and Southern Copper. We are very pleased to enhance our royalty on the project and simultaneously become a Quilla shareholder as they move toward listing on a public Exchange.”
Existing Chapi Royalty
In February 2025, EMX Royalty Corporation (“EMX“) acquired a 2.0% NSR royalty on minerals produced from the approximately 26,000 hectare property (“Property Royalty”) owned by Quilla, as well as a 2.0% NSR royalty from any minerals that are produced from outside the Property Royalty area, but that are processed at the Chapi Mine processing facilities. The agreement also includes a two-kilometre area of interest (“AOI“) (see Figure 1) around the Property Royalty area, and any property acquired by MPC within this AOI will also be subject to a 2.0% NSR royalty, stepping down to a 1.0% NSR royalty in July 2034.
Elemental acquired EMX in November 2025.
Figure 1: Existing and additional royalty Area of Interest over the Chapi Copper Project, Peru
Under the terms of the transaction, Elemental provided aggregate consideration of US$25 million to Quilla through a combined royalty and equity investment package. The package was structured to expand Elemental’s royalty exposure to the key growth areas at Chapi while also providing Quilla with capital in advance of Listing as it advances the Chapi exploration programme and expansion plans.
Elemental acquired an additional 1.0% NSR royalty over all minerals produced from the Pampa Negra and Candelaria concessions (see Figure 1). The royalty is perpetual, uncapped and not subject to any buyback, step-down or advance payment provisions. This adds to Elemental’s existing 2.0% NSR royalty footprint at Chapi and results in Elemental holding a 3.0% NSR royalty over Pampa Negra and a 3.0% NSR royalty over Candelaria, with the Candelaria royalty stepping down to 2.0% NSR in July 2034.
As part of the same transaction package, Elemental subscribed for shares in the company, representing approximately 9% of Quilla. The equity investment provides Elemental with additional alignment and upside as Quilla advances its planned expansion to 30,000 tonnes per annum of copper cathode and looks to go public.
Elemental funded the Transaction from cash on hand. Proceeds from the Transaction are to be used by Quilla to fast-track exploration as well as permitting and engineering work related to the planned expansion.
Background on Quilla
Quilla is a private Canadian company that, in December 2024, acquired MPC and the associated Chapi licence areas. Quilla was founded by a select group of shareholders, including Victor Gobitz, looking to rapidly build an intermediate-sized base metals company. Mr. Gobitz is a senior mining executive with extensive recent leadership experience at two of Peru’s most prominent mining companies. Prior to joining Quilla, he served as President and General Manager of the world-class Antamina mine, following his tenure as President and Chief Executive Officer of Compañía de Minas Buenaventura.
The Chapi Copper Project
Chapi is a former producing copper project that restarted production in Q1 2026 (see announcement dated March 2, 2026).
The Chapi Mine is located in the prolific Southern Peru porphyry copper belt across the Moquegua and Arequipa Departments, which host large scale operations including Southern Copper’s Toquepala, Anglo American’s Quellaveco Project, and Freeport-McMoRans’s majority owned Cerro Verde mine. The asset sits at an elevation of approximately 2,750 meters and has ready access approximately 50 kilometers south-southeast from the city of Arequipa. The mine, which was in operation from 2006-2012, reached maximum production levels of 8,500 tonnes per annum.
The historic Chapi Mine is comprised of two principal open pits, underground workings, a crushing and agglomeration circuit, heap leach pads, a solvent extraction plant, an electrowinning copper cathode plant, and related infrastructure including mine camp, office facilities, water supply, and power.
The restart and successful commissioning of the SX-EW plant in 2026 was achieved on time and budget, reflecting management’s strong track record as operators and work has begun on Phase 2 expansion as well as fast tracking investment in exploration and ongoing investment to optimise operations.
Technical Disclosure and Qualified Person
The scientific and technical information contained in this news release has been reviewed and approved by Michael Sheehan, a “Qualified Person” and employee of the Company as defined in National Instrument 43-101 – Standards of Disclosure for Mineral Projects (“NI 43-101“).
Elemental is a new mid-tier, gold-focused streaming and royalty company with a globally diversified portfolio of 18 producing assets and more than 200 royalties, anchored by cornerstone assets and operated by world-class mining partners. Formed through the merger of Elemental Altus and EMX, the Company combines Elemental Altus’s track record of accretive royalty acquisitions with EMX’s strengths in royalty generation and disciplined growth. This complementary strategy delivers both immediate cash flow and long-term value creation, supported by a best-in-class asset base, diversified production, and sector-leading management expertise.
Elemental trades on Nasdaq and on the Toronto Stock Exchange under the ticker Symbol “ELE”.
This news release contains “forward-looking information” and “forward-looking statements” within the meaning of applicable Canadian and United States securities laws. Forward-looking statements include, but are not limited to, statements regarding the completion of the Transaction, the timing and satisfaction of closing conditions, the expected use of proceeds by Quilla, the expected benefits of the Transaction to Elemental and its shareholders, Chapi’s expected ramp-up and expansion plans, future production levels, expected royalty revenue, potential exploration upside, Quilla’s potential IPO, copper market conditions and future opportunities for collaboration with Quilla and Hartree.
Forward-looking statements are based on assumptions that management believes to be reasonable as of the date of this news release, including assumptions regarding the receipt of required approvals, the accuracy of technical and operating information provided by the operator, future copper prices, mine plans, permitting timelines, capital availability, operating performance, exploration results and the ability of Quilla and MPC to advance Chapi.
Forward-looking statements are subject to known and unknown risks, uncertainties and other factors that may cause actual results to differ materially from those expressed or implied by such statements. These risks include, but are not limited to, the failure to complete the Transaction, changes in commodity prices, differences between projected and actual production, delays in ramp-up or expansion activities, permitting or regulatory delays, operational challenges, resource and reserve uncertainty, political and jurisdictional risks, title and royalty enforceability risks, foreign exchange fluctuations, capital markets conditions and the other risk factors described in Elemental’s public disclosure documents filed on SEDAR+ and EDGAR.
Readers should not place undue reliance on forward-looking statements. Elemental undertakes no obligation to update forward-looking statements except as required by applicable securities laws.
Ross McElroy Steps Down as President, CEO and Director Effective July 15, 2026
VANCOUVER, British Columbia, July 16, 2026 (GLOBE NEWSWIRE) — Apollo Silver Corp. (“Apollo Silver” or the “Company“) (TSX.V:APGO, OTCQB:APGOF, Frankfurt:6ZF) announces that Ross McElroy has stepped down as President and Chief Executive Officer of the Company and has resigned from the Company’s Board of Directors (the “Board”), effective July 15, 2026. The Company has entered into an agreement with Colin P. Sutherland, CPA, CA, under which Mr. Sutherland will assume the role of President and Chief Executive Officer, effective July 15, 2026. Mr. Sutherland is not joining the Board at this time.
“On behalf of the Board and the entire Apollo Silver team, I want to thank Ross for his leadership and the many contributions he has made in advancing the Company’s projects. Ross leaves the Company well positioned for its next phase of growth and we wish him well in his future endeavours,” said Tom Peregoodoff, Executive Chair of Apollo Silver. “At the same time, we are very pleased to welcome Colin Sutherland as our incoming President and CEO. Colin brings more than two decades of senior executive and financial leadership across gold and silver producers, having served as President, CEO, and CFO of companies operating internationally, in North America and more specifically, Mexico. His track record of capital markets execution, M&A leadership, and operational discipline makes him an excellent fit to lead Apollo Silver through its next stage of growth. Finally, to our shareholders, thank you for your continued trust and support as we build on the momentum Apollo Silver has established.”
“I am honoured to join Apollo Silver at such an important stage in the Company’s growth,” said Mr. Sutherland. “Apollo Silver holds one of the largest undeveloped primary silver assets in the United States, together with a high-quality option on the Cinco de Mayo project in Mexico. I believe my 20 plus years of corporate leadership and operating experience in Mexico, as well as other jurisdictions, is ideal for Apollo Silver’s current position and I look forward to working with the Board, management, and shareholders to advance these assets and build long-term value.”
About Colin Sutherland
Mr. Sutherland is a Chartered Professional Accountant with more than two decades of international experience in mining finance, capital markets, and operations, including senior executive and operating roles with Capital Gold Corporation, Nayarit Gold and McEwen Mining across projects in the broader Americas and globally.
At Capital Gold, owner of the producing El Chanate gold mine in Sonora, Mexico, he led the merger and acquisition process, including the combination with Nayarit Gold and the subsequent sale of the company, delivering positive returns to shareholders. He subsequently served as President of McEwen Mining, where he oversaw operations and capital markets activity across the company’s Mexican operations, delivering improving performance during his tenure. Mr. Sutherland’s background spans both M&A and operating sides of the mining business.
Mr. Sutherland is a permanent resident of Mexico.
Incentive Awards
Pursuant to the Company’s Omnibus Incentive Plan (the “Plan”) dated December 12, 2024, and the policies of the TSX Venture Exchange (the “TSXV”), the Company’s Board of Directors has approved the grant of incentive stock options (the “Options”) and deferred share units (the “DSUs”) to an officer and a director of the Company.
The Company has granted Options to purchase an aggregate of 250,000 common shares of the Company (each, a “Common Share”), at an exercise price of $2.52 per Common Share, being the closing price of the Common Shares on the TSXV on the date of grant. The Options vest over a 24-month period, with one-third vesting on the date of grant, one-third vesting 12 months from the date of grant, and the balance vesting 24 months from the date of grant. Once vested, each Option is exercisable into one Common Share for a period of five years from the date of grant.
The Company has also granted an aggregate of 100,000 DSUs. Each DSU entitles the holder, when settled, to receive one Common Share, and may only be settled once the holder ceases to serve as a director of the Company, in accordance with the terms of the Plan.
ABOUT APOLLO SILVER CORP.
Apollo Silver is advancing the second largest undeveloped primary silver project in the US. The Calico Silver Project hosts a large, bulk minable silver deposit with significant barite and zinc credits – recognized as critical minerals essential to the U.S. energy, industrial and medical sectors. The Company also holds an option on the Cinco de Mayo Project in Chihuahua, Mexico, which is host to a major carbonate replacement (“CRD”) deposit that is both high-grade and large tonnage. Led by an experienced and award-winning management team, Apollo Silver is well positioned to advance the assets and deliver value through exploration and development.
Neither the TSX Venture Exchange nor its Regulation Services Provider (as that term is defined in the policies of the TSX Venture Exchange) accepts responsibility for the adequacy or accuracy of this release.
Cautionary Statement Regarding “Forward-Looking” Information
This news release includes “forward-looking statements” and “forward-looking information” within the meaning of Canadian securities legislation. All statements included in this news release, other than statements of historical fact, are forward-looking statements including, without limitation, the anticipated contributions of the incoming President and CEO, and the Company’s future plans and objectives. Forward-looking statements include predictions, projections and forecasts and are often, but not always, identified by the use of words such as “anticipate”, “believe”, “plan”, “estimate”, “expect”, “potential”, “target”, “budget” and “intend” and statements that an event or result “may”, “will”, “should”, “could” or “might” occur or be achieved and other similar expressions and includes the negatives thereof.
Forward-looking statements are based on the reasonable assumptions, estimates, analysis, and opinions of the management of the Company made in light of its experience and its perception of trends, current conditions and expected developments, as well as other factors that management of the Company believes to be relevant and reasonable in the circumstances at the date that such statements are made. Forward-looking information is based on reasonable assumptions that have been made by the Company as at the date of such information and is subject to known and unknown risks, uncertainties and other factors that may have caused actual results, level of activity, performance or achievements of the Company to be materially different from those expressed or implied by such forward-looking information, including but not limited to: risks associated with mineral exploration and development; metal and mineral prices; availability of capital; accuracy of the Company’s projections and estimates; realization of mineral resource estimates, interest and exchange rates; competition; stock price fluctuations; availability of drilling equipment and access; actual results of current exploration activities; government regulation; political or economic developments; environmental risks; insurance risks; capital expenditures; operating or technical difficulties in connection with development activities; personnel relations; and changes in project parameters as plans continue to be refined. Forward-looking statements are based on assumptions management believes to be reasonable, including but not limited to the price of silver, gold, barite and zinc; the demand for silver, gold and barite; the ability to carry on exploration and development activities; the timely receipt of any required approvals; the ability to obtain qualified personnel, equipment and services in a timely and cost-efficient manner; the ability to operate in a safe, efficient and effective manner; and the regulatory framework regarding environmental matters, and such other assumptions and factors as set out herein. Although the Company has attempted to identify important factors that could cause actual results to differ materially from those contained in forward-looking information, there may be other factors that cause results not to be as anticipated, estimated or intended. There can be no assurance that forward-looking statements will prove to be accurate and actual results, and future events could differ materially from those anticipated in such statements. Accordingly, readers should not place undue reliance on forward looking information contained herein, except in accordance with applicable securities laws. The forward-looking information contained herein is presented for the purpose of assisting investors in understanding the Company’s expected financial and operational performance and the Company’s plans and objectives and may not be appropriate for other purposes. The Company does not undertake to update any forward-looking information, except in accordance with applicable securities laws.
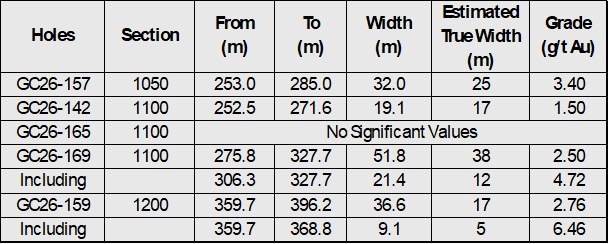
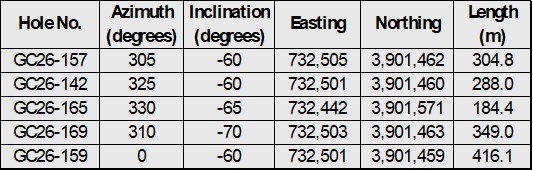
Vancouver, British Columbia–(Newsfile Corp. – July 14, 2026) – West Point Gold Corp. (TSXV: WPG) (OTCQX: WPGCF) (FSE: LRA0) (“West Point Gold” or the “Company”) is pleased to announce the results from five drill holes within the high-grade Northeast (“NE”) Tyro zone at its flagship Gold Chain Project in Arizona. Hole GC26-169 was a reverse circulation (“RC”) hole that intersected 51.9 metres (“m”) of 2.5 grams per tonne (“g/t”) gold (“Au”) from 276m, including 21.4m at 4.72 g/t. This intercept has an estimated true width (“TW”) of 38m. These holes continue to extend the zone at NE Tyro down-dip where it remains open to depth and to the northeast towards the prospective Frisco Graben target.
The Company is reporting assay results for five drill holes (1,542m), GC26-142, GC26-157, GC26-159, GC26-165 and GC26-169. Results from 14 holes representing 4,378m of the recently completed 21,079m program are still pending. All results from Tyro Main and NE Tyro are expected to contribute to the Company’s upcoming maiden resource estimate to be released later in 2026.
Highlights:
Hole GC26-169 (Line 1100) intersected 51.9m at 2.5 g/t Au, including 21.4m at 4.72 g/t Au beginning approximately 300m below surface;
Hole GC26-157 (Line 1050) cut 32.0m at 3.4 g/t Au about 60m below GC25-085 (29m at 5.24 g/t Au);
Hole GC26-159 (Line 1200) intersected 36.5m at 2.79 g/t Au, including 9.1m at 6.46 g/t Au within the NE Tyro vein at about 350m below surface;
Results from all three sections (L1050, L1100 and L1200) indicate that the NE Tyro vein is well developed up to 350m below the surface;
NE Tyro remains open to depth and to the northeast towards the Frisco Graben.
“Drilling at NE Tyro continues to demonstrate consistent grades and widths. This set of results also confirms consistent mineralization in multiple sections and bodes well for the pending maiden resource. As we move towards the Frisco Graben, we have been able to define the gold zone in areas with little to no surface expression. Drilling continues to validate the depth potential in this area, as we have demonstrated gold mineralization vertically over 300m at NE Tyro, supporting our view that NE Tyro remains open at depth. We remain on track to deliver the maiden resource at Tyro later this year,” stated Derek Macpherson, President and CEO.
Note: All widths shown are downhole; true widths are shown above and graphically presented in Figures 3 -5.
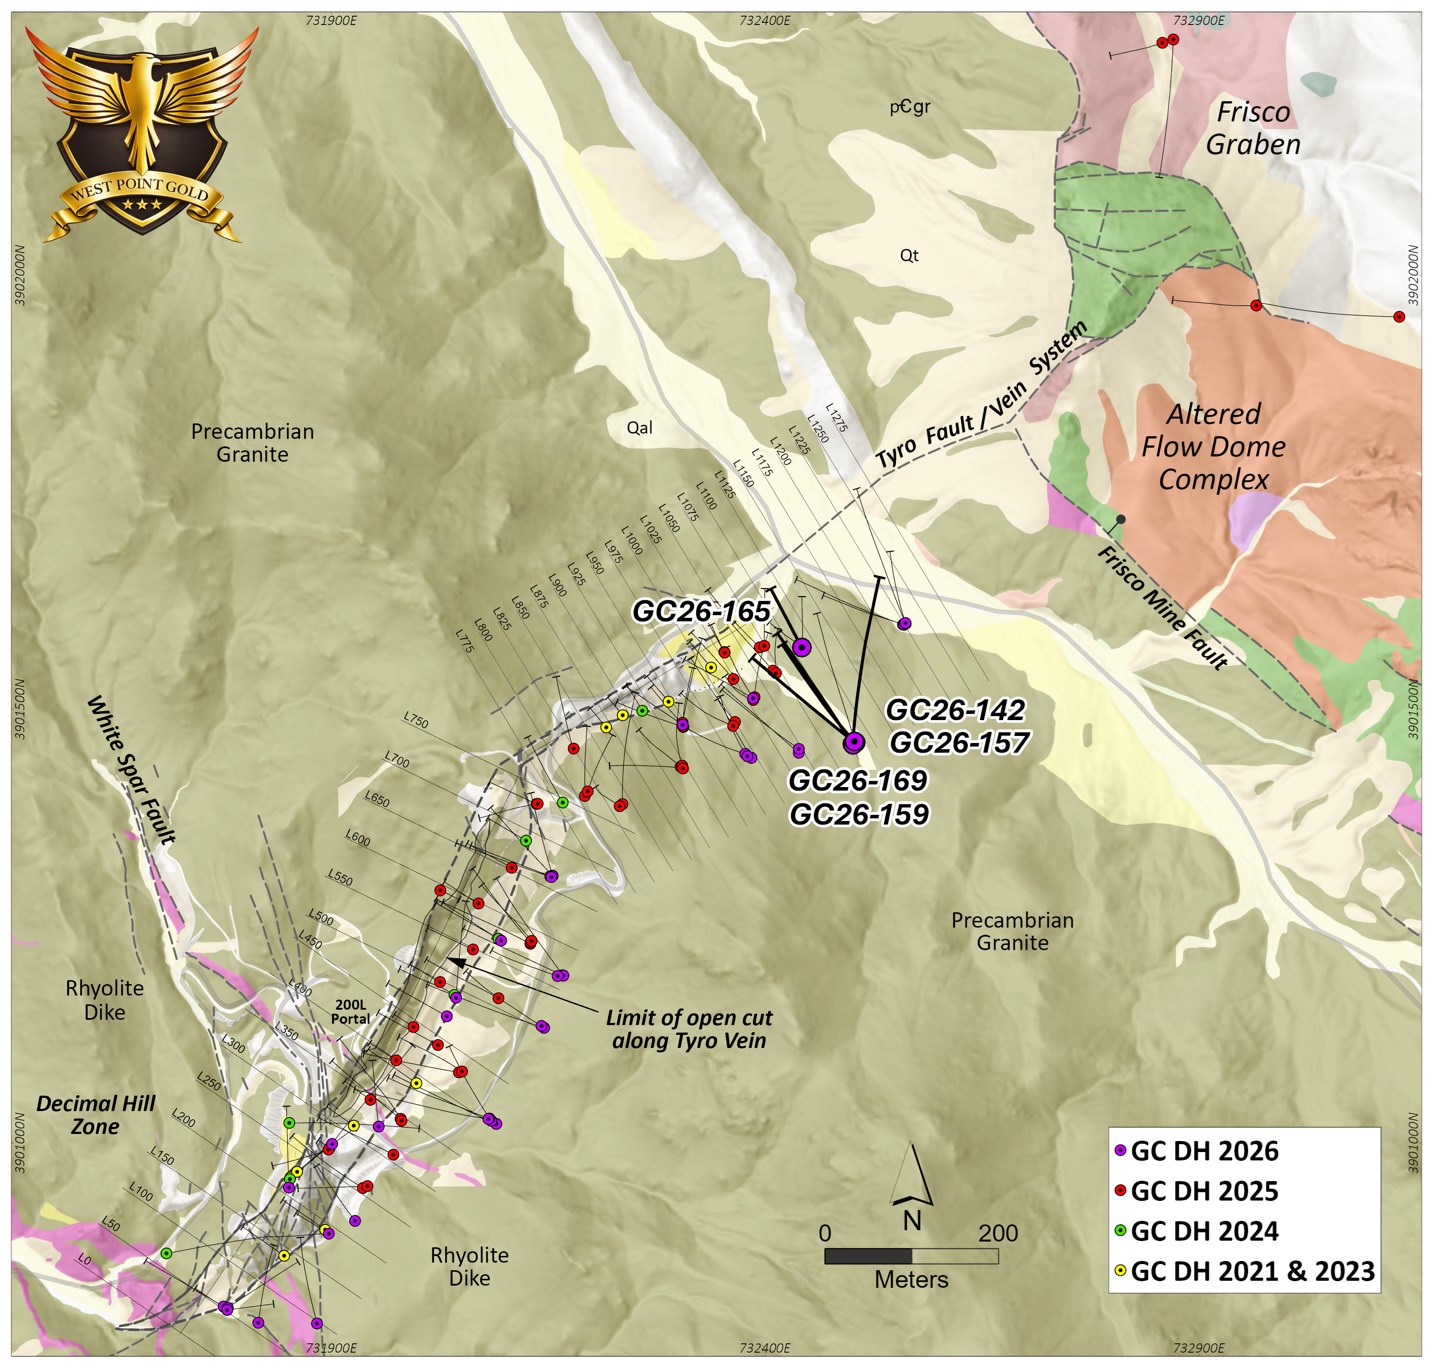
Figure 1. Plan view of the Main Tyro vein showing geology and drilling conducted in 2021, 2023, 2024, 2025, and 2026. Note the location of Hole Nos. GC26-157 (L1050), GC26-142, GC26-165, GC26-169 (L1100), and GC26-159 (L1200).
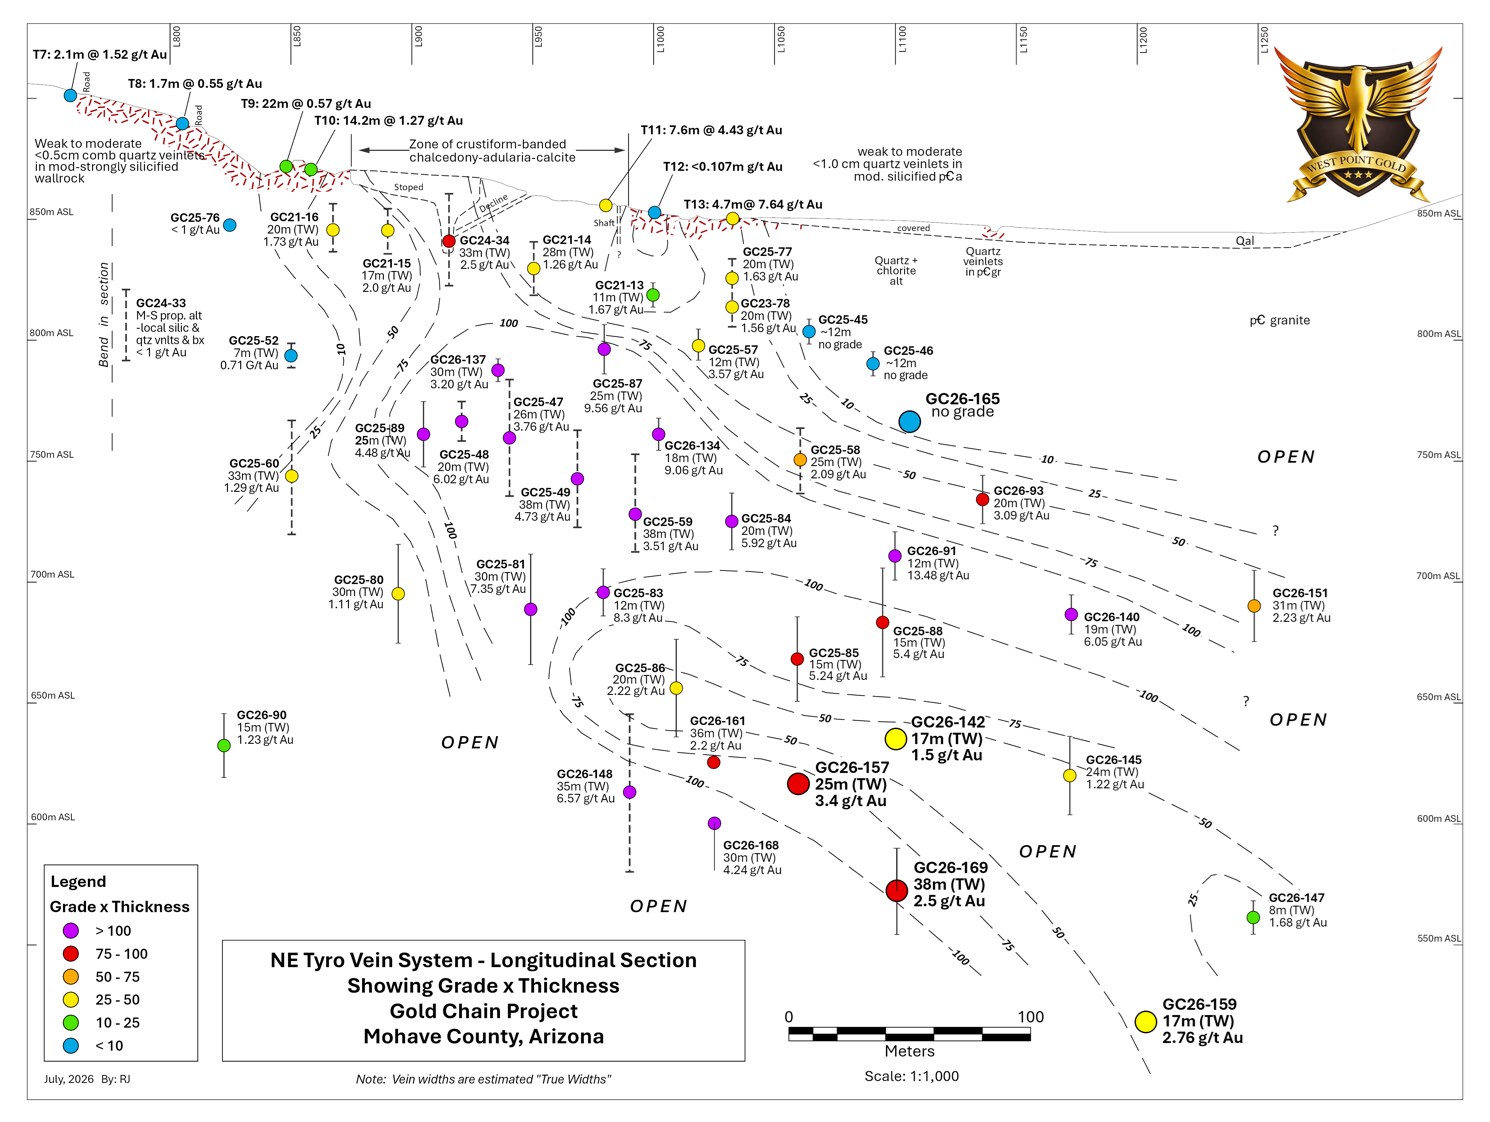
Figure 2. Longitudinal perspective of the Tyro NE zone contoured GT (g/t Au X estimated true thickness) highlighting the results from Holes GC26-142, GC26-157, GC26-159, GC26-165 and GC26-169.
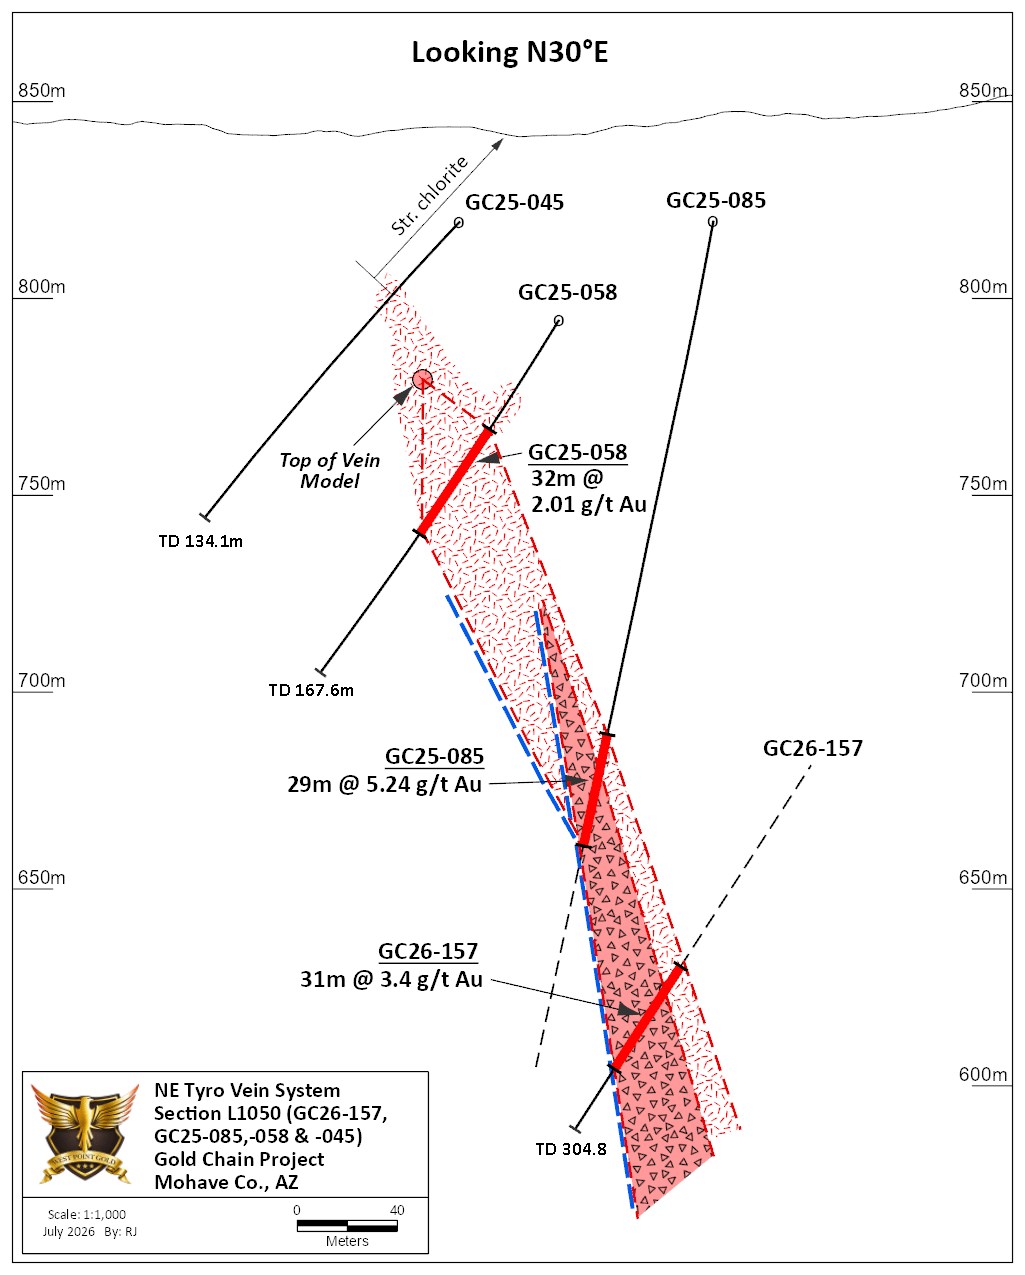
Line 1050 (GC26-157) Section L1050 (Figure 3) reveals that the NE Tyro vein system is not exposed at the surface and is considered to be ‘blind’. Holes GC25-045 and GC25-046 confirmed this and identified vein-related alteration but without quartz vein and associated gold values. The exposure of the gold zone at the surface a short distance to the southwest (L1025) suggests a northeast-trending plunge at about 30 degrees. This point (Top of the Vein Model) is shown in Figure 3.
Drill sections to the southwest, where gold mineralization is documented in surface exposures, i.e. Lines 875 to 1025, reveal robust gold deposition up to 300m vertically (down-dip) that remains open to depth. Sections to the northeast of Line 1050 show the top of the ‘gold zone’, which begins below the surface; this zone of gold deposition continues deeper as exploration proceeds to the northeast.
Hole GC26-157 intersected 32.0m at 3.4 g/t Au from 253 to 285m and contained 9.1m at 7.85 g/t Au, including a thick zone of vein and hydrothermal breccia (>50% vein). The elevation of this intercept is about 620m ASL and about 175m below the ‘top’ of the vein system and 230m below surface (Figure 3).
Figure 3. Geologic section drawn along Line 1050 showing vein and spatial relation between GC26-157 and GC25-058 and GC25-085.
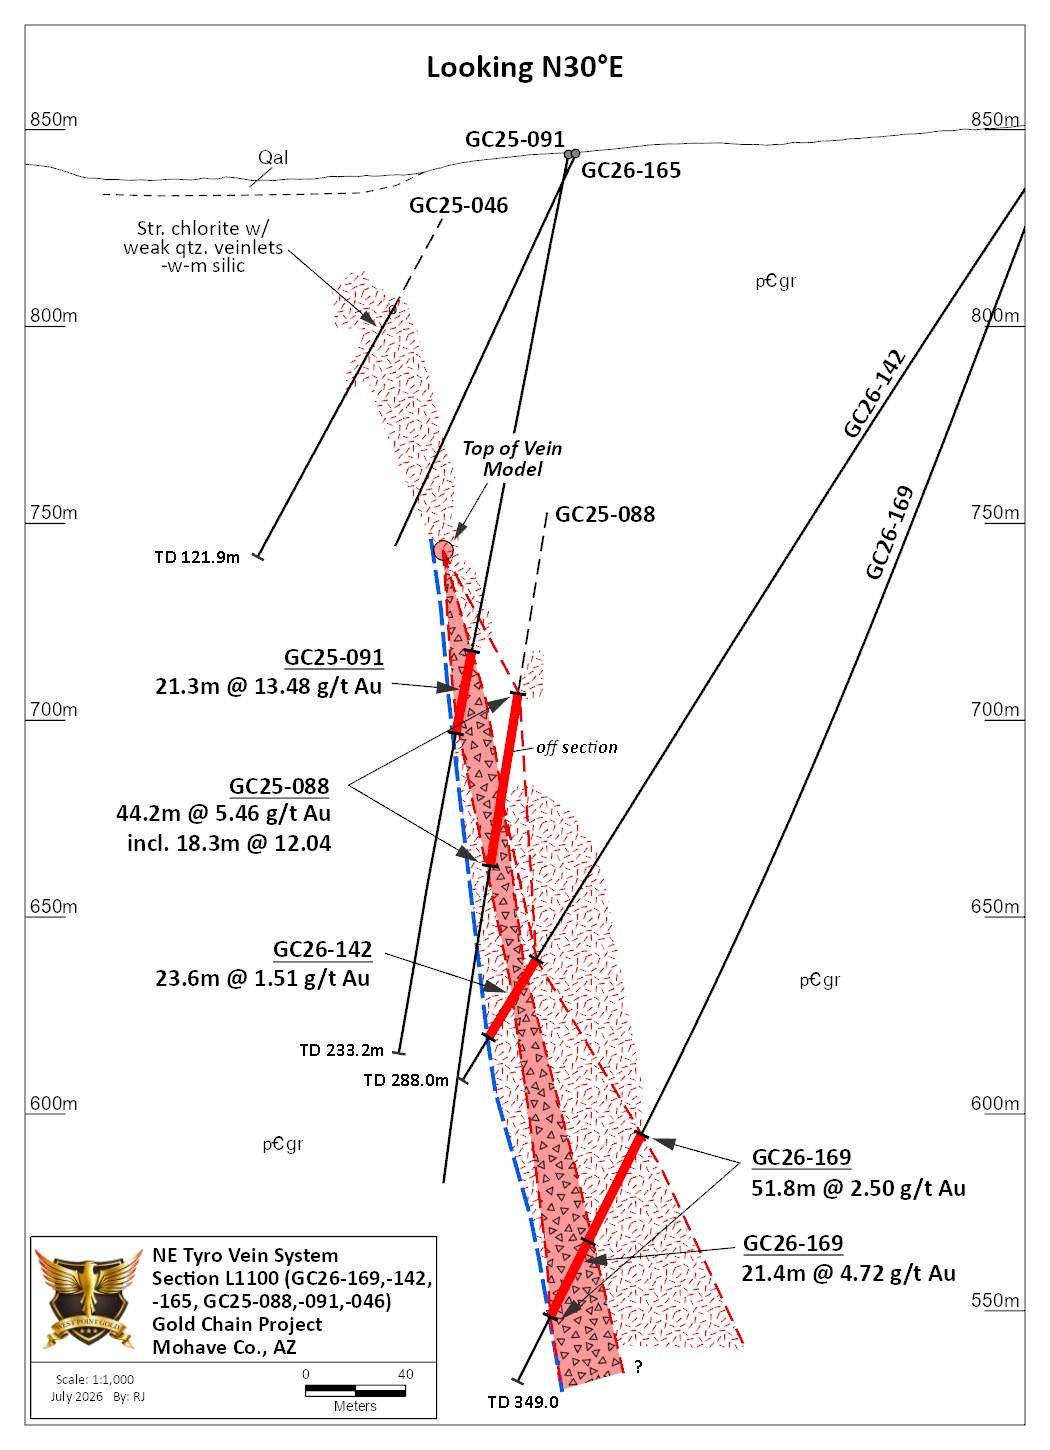
Line 1100 (GC26-142, GC26-165 and GC26-169) Section L1100, shown in Figure 4, contains Holes GC26-165, GC26-142 and GC26-169. These holes were designed to test the vein zone both above and below Holes GC25-088 and GC26-091, where drilling revealed 44.2m at 5.46 g/t Au and 21.3m at 13.48 g/t Au, respectively. Hole GC26-142 crossed the vein system about 40m below Hole GC25-088 and intersected 23.6m at 1.51 g/t Au. The upper hole, GC26-165 (core), drilled to identify the upper limit of the vein system, identified several metres of quartz veinlets and local breccia with anomalous, low-level gold values. Alteration of the Precambrian granite across this zone consisted of moderate to strong illite-pyrite alteration replacing chlorite in the propylitic selvage. This hole, shown in Figure 4, better defines the upper limit of gold mineralization.
Hole GC26-169 crossed the vein system about 60m below Hole GC26-142 and encountered 51.9m at 2.5 g/t Au from 275.8 to 327.7m; this envelope contained 21.4m at 4.72 g/t Au in mostly quartz ‘stockwork and breccia’. Relative to Hole GC26-142 (Figure 4), the mineralized package appears to be widening at depth and remains open below the 550m ASL elevation or about 150m below the upper extent of the vein package and about 300m below surface.
Figure 4. Geologic section drawn along Line 1100 showing vein and spatial relation between GC26-142, GC26-165 and GC26-169 and GC25-088 and GC25-091.
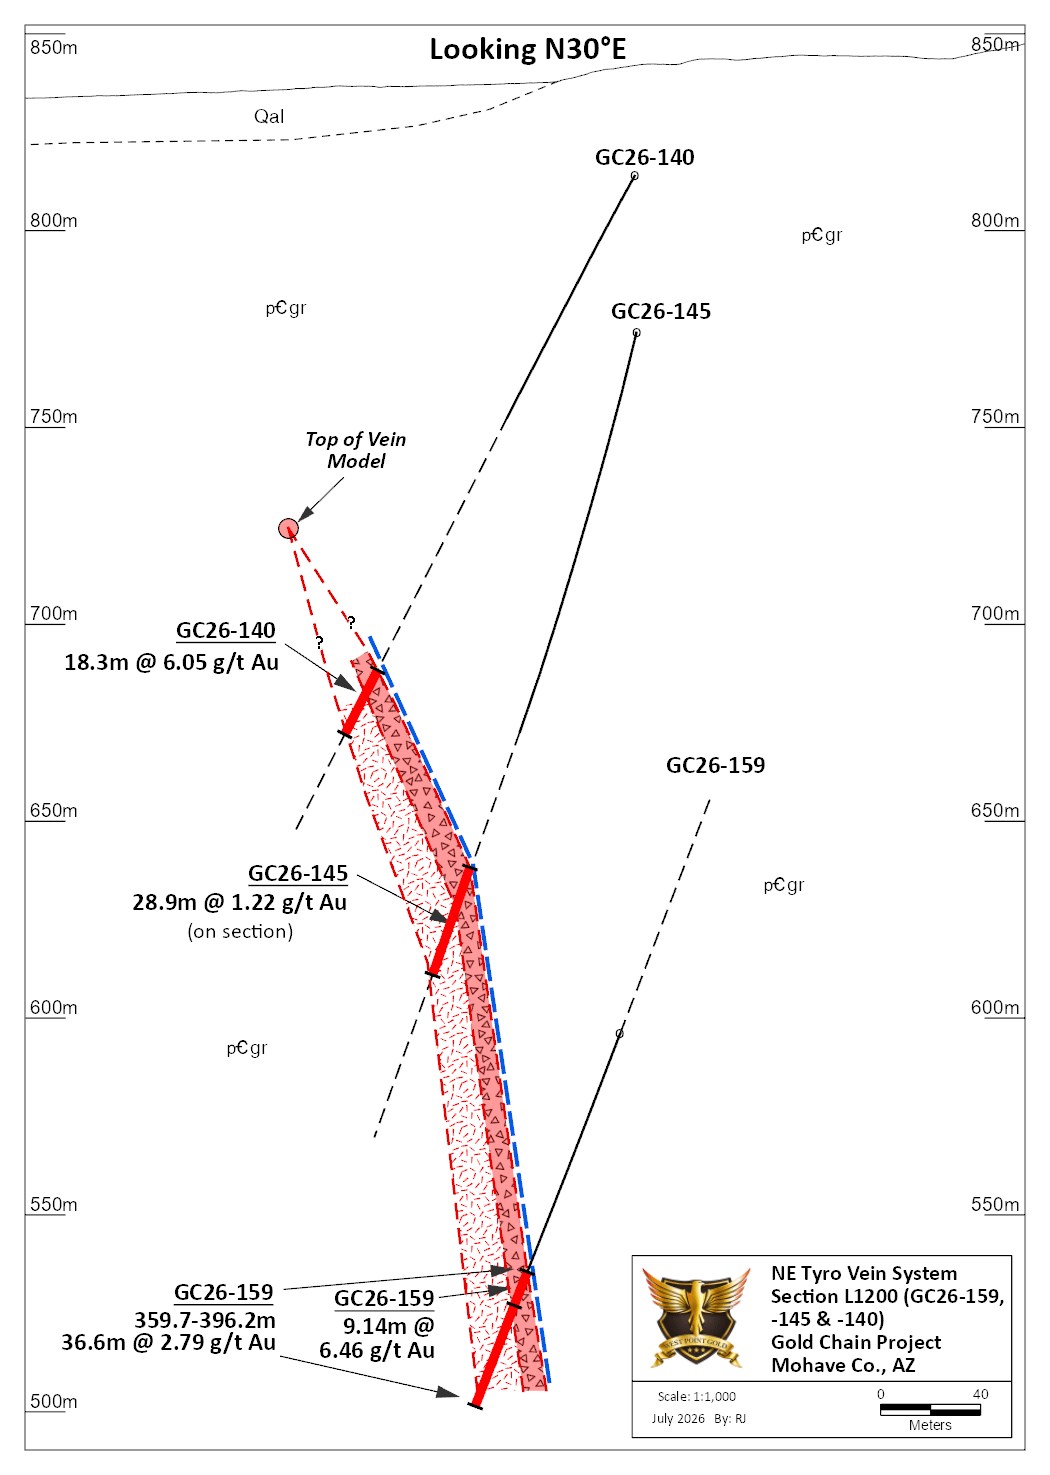
Line 1200 (GC26-159) Hole GC26-159 was designed to test the down-dip extension of gold mineralization intersected in Holes GC26-140, GC26-145, GC26-147 and GC26-151 (see press release here). Section L1200 (Figure 5) reveals an interpretation showing the top of the vein model at an elevation of about 725m ASL, about 125m below surface, which is consistent with sections to the southwest (Figures 3 and 4). The uppermost hole on this section, GC26-140, intersected 18.3m at 6.05 g/t Au (TW = 15m) while GC26-145, about 60m down-dip, cut 28.9m at 1.22 g/t Au (TW ~ 16m). Hole GC26-159, about 100m deeper, traversed 36.6m (TW ~ 17m) at 2.79 g/t Au, containing 9.14m at 6.46 g/t Au. The vein here appears to be steeper than observed in sections to the southwest. This intercept is about 150m below the top of the vein envelope and well above vein depths observed to the south; the vein system remains open.
Figure 5. Geologic section drawn along Line 1200 showing vein and spatial relation between GC26-159 and GC26-147 and GC26-151.
Qualified Person Robert Johansing, M.Sc. Econ. Geol., P. Geo., the Company’s Vice President, Exploration, is a qualified person (“QP”) as defined by NI 43-101 and has reviewed and approved the technical content of this press release. Mr. Johansing has also been responsible for overseeing all phases of the drilling program, including logging, cutting, labelling, bagging and transport from the project to American Assay Laboratories (AAL) of Sparks, Nevada. Reverse Circulation (RC) drill holes have a diameter of about 10cm (~4″), and samples have an approximate weight of 5 to 10kg. Core size is HQ (2.5″/63.5mm) and is logged, photographed and cut at the Company’s Bullhead City sampling facility, including the insertion of blanks and standards. All samples are packaged for shipment at the facility and trucked to AAL in Reno. Samples were then dried, crushed and split, and pulp samples were prepared for analysis. Gold was determined by fire assay with an ICP finish, and over-limit samples were determined by fire assay and gravimetric finish. Silver plus 15 other elements were determined by Aqua Regia ICP-AES (IM-2A16), and over-limit samples were determined by fire assay and gravimetric finish. Both certified standards and blanks were inserted on site along with duplicates, standards and blanks inserted by American Assay. The results summarized above have been carefully reviewed with reference to the QA/QC results. Standard sample chain of custody procedures were employed during drilling and sampling campaigns until delivery to the analytical facility.
About West Point Gold Corp. West Point Gold is an exploration and development company focused on unlocking value across four strategically located projects along the prolific Walker Lane Trend in Nevada and Arizona, USA, providing shareholders with exposure to multiple discovery opportunities across one of North America’s most productive gold regions. The Company’s near-term priority is advancing its flagship Gold Chain Project in Arizona.
For further information regarding this press release, please contact: Aaron Paterson, Corporate Communications Manager Phone: +1 (778) 358-6173 Email: info@westpointgold.com
FORWARD-LOOKING STATEMENTS: Certain statements contained in this press release constitute forward-looking information. These statements relate to future events or future performance. Forward-looking statements include estimates and statements that describe the Company’s plans, objectives or goals, including words to the effect that the Company or management expects a stated condition or result to occur. The use of any of the words “could”, “intend”, “expect”, “believe”, “will”, “projected”, “estimated” and similar expressions and statements relating to matters that are not historical facts are intended to identify forward-looking information and are based on the Company’s current belief or assumptions as to the outcome and timing of such future events including, among others, assumptions about future prices of gold, silver, and other metal prices, currency exchange rates and interest rates, timing of the Company’s maiden resource estimate, favourable operating conditions, political stability, obtaining government approvals and financing on time, obtaining renewals for existing licenses and permits and obtaining required licenses and permits, labour stability, stability in market conditions, availability of equipment, availability of drill rigs, and anticipated costs and expenditures. In particular, this press release contains forward-looking statements concerning the timing of a maiden resource estimate and the belief that Tyro NE will be open to depth following that estimate. The Company cautions that all forward-looking statements are inherently uncertain, and that actual performance may be affected by a number of material factors, many of which are beyond the Company’s control. Such factors include, among other things: risks and uncertainties relating to West Point Gold’s ability to complete any payments or expenditures required under the Company’s various option agreements for its projects; and other risks and uncertainties relating to the actual results of current exploration activities, the uncertainties related to resources estimates; the uncertainty of estimates and projections in relation to production, costs and expenses; risks relating to grade and continuity of mineral deposits; the uncertainties involved in interpreting drill results and other exploration data; the potential for delays in exploration or development activities; uncertainty related to the geology, grade and continuity of mineral deposits; the possibility that future exploration, development or mining results may vary from those expected; statements about expected results of operations, royalties, cash flows, financial position may not be consistent with the Company’s expectations due to accidents, equipment breakdowns, title and permitting matters, labour disputes or other unanticipated difficulties with or interruptions in operations, fluctuating metal prices, unanticipated costs and expenses, uncertainties relating to the availability and costs of financing needed in the future and regulatory restrictions, including environmental regulatory restrictions. The possibility that future exploration, development or mining results will not be consistent with adjacent properties and the Company’s expectations; operational risks and hazards inherent with the business of mining (including environmental accidents and hazards, industrial accidents, equipment breakdown, unusual or unexpected geological or structural formations, cave-ins, flooding and severe weather); metal price fluctuations; environmental and regulatory requirements; availability of permits, failure to convert estimated mineral resources to reserves; the inability to complete a feasibility study which recommends a production decision; the preliminary nature of metallurgical test results; fluctuating gold prices; possibility of equipment breakdowns and delays, exploration cost overruns, availability of capital and financing, general economic, political risks, market or business conditions, regulatory changes, timeliness of government or regulatory approvals and other risks involved in the mineral exploration and development industry, and those risks set out in the filings on SEDAR+ made by the Company with securities regulators. Although the Company believes that the assumptions and factors used in preparing the forward-looking information in this corporate press release are reasonable, undue reliance should not be placed on such information, which only applies as of the date of this news release, and no assurance can be given that such events will occur in the disclosed time frames or at all. The Company expressly disclaims any intention or obligation to update or revise any forward-looking statements whether as a result of new information, future events or otherwise, other than as required by applicable securities legislation.
Neither the TSX Venture Exchange nor its Regulation Services Provider (as that term is defined in the policies of the TSX Venture Exchange) accepts responsibility for the adequacy or accuracy of this release.
Leveraging Advanced Diagnostics and Screenings to Provide Personalized Proactive Care DALLAS, TX / ACCESS Newswire / July … · ACCESS Newswire · AIAI Holdings
Leveraging Advanced Diagnostics and Screenings to Provide Personalized Proactive Care
DALLAS, TX / ACCESS Newswire / July 14, 2026 / AIAI Holdings Corporation (NASDAQ:AIAI) (“Ai2” or the “Company”), an AI-enabled diversified holding company utilizing Transformational AI (TAI) to enhance portfolio performance, today announced that its portfolio company, MediGuide, has launched a state of the art (SOTA) precision healthcare solution that combines advanced medical intelligence, expert clinical review, and AI-enabled diagnostic support to enable more personalized, data-driven medical decision-making.
The launch represents another milestone in MediGuide’s innovation roadmap and reflects AIAI Holdings’ strategy of supporting portfolio companies that responsibly integrate advanced technologies into scalable, real-world business applications.
“Every patient is different, yet too many healthcare decisions are still guided by generalized treatment approaches. We believe people deserve care that’s informed by their unique biology, medical history, and individual health needs,” said Vera Guerreiro, Chief Executive Officer of MediGuide. “Our precision healthcare solution brings together advanced medical intelligence, expert clinical review, and AI-enabled insights to help make that level of personalized care more accessible.”
“One of AIAI Holdings’ core objectives is to partner with exceptional management teams that are building innovative, technology-enabled businesses capable of creating long-term shareholder value,” commented Todd Furniss, Chief Executive Officer and Co-Founder of AIAI Holdings.
“MediGuide’s latest state of the art healthcare offering is an excellent example of that strategy in action. By combining artificial intelligence with world-class clinical expertise, MediGuide continues to strengthen its position in one of healthcare’s fastest-growing markets while advancing solutions designed to improve patient outcomes.”
The new offering builds upon MediGuide’s established Medical Second Opinion (MSO) services by combining genetic, molecular, clinical, and lifestyle information with AI-enabled analytics and expert physician review. This integrated approach helps improve diagnostic confidence, supports earlier detection, and enables more personalized treatment recommendations tailored to each patient’s unique clinical profile.
Key capabilities of the new offering will include:
Comprehensive Diagnostics: Integrating genetic, molecular, and clinical information to provide a more complete and individualized understanding of each patient’s condition.
TAI-Enabled Clinical Insights: Leveraging artificial intelligence and machine learning to support clinical decision making and provide physicians with actionable insights that support diagnostic accuracy and clinical decision making.
Personalized Treatment Guidance: Supporting healthcare providers in identifying treatment approaches that are better aligned with each patient’s unique biological profile, moving beyond traditional one-size-fits-all care.
Earlier Detection and Personalized Proactive Care: Focusing on identifying potential health risks sooner, improving diagnostic confidence, and helping patients and physicians make more informed healthcare decisions.
The launch comes as insurers and reinsurers face rising claims tied to specialist referrals, increasing demand for international partners that can provide clinical review and evidence-based recommendations rather than reports alone.Learn more at MediGuide: www.mediguide.com.
About AIAI Holdings Corporation
AIAI Holdings Corporation (Ai2) (NASDAQ:AIAI) is an AI-enabled diversified holding company that acquires and grows companies across multiple industries. We expect to drive revenue and earnings growth throughout our portfolio by applying exclusively licensed Transformational AI to enhance operational efficiency and financial performance.
Ai2 is building a next-generation model for technology-enabled business operations, which is expected to create sustainable value for shareholders through the strategic integration of artificial intelligence across diverse industries.
About MediGuide
MediGuide is a global medical intelligence company dedicated to helping individuals make informed healthcare decisions when they matter most. Founded in 1999, the Company provides Medical Second Opinions, Medical Treatment Abroad, Digital Health, and Preventive Health solutions through an integrated healthcare platform that connects members with world-renowned medical centers and leading specialists around the globe.
Operating across more than 160 countries with a network spanning five continents, MediGuide partners with insurers, employers, financial institutions, and healthcare organizations to deliver expert clinical guidance, personalized care navigation, and innovative digital health services. By combining world-class medical expertise with advanced technology and AI-enabled healthcare solutions, MediGuide empowers patients with greater confidence, improved clinical outcomes, and access to the highest standards of care worldwide. Learn more at MediGuide.
MediGuide is a portfolio company of AIAI Holdings Corporation (NASDAQ:AIAI).
This press release contains “forward-looking statements” or “forward-looking information” within the meaning of the Private Securities Litigation Reform Act of 1995, including statements regarding the plans, intentions, beliefs, and current expectations of the Company with respect to future business activities and plans of the Company. All statements contained in this press release that do not relate to matters of historical fact should be considered forward-looking statements, including without limitation statements regarding our expectations, intentions, beliefs, plans, objectives, goals, strategies, future events or performance, and underlying assumptions. Forward-looking statements are often identified by the use of words such as “may,” “will,” “expect,” “believe,” “anticipate,” “intend,” “would,” “could,” “should”, “estimate,” “plan,” “predict,” “project,” “estimate”, or “continue,” or similar expressions, including the negative of these terms or other comparable terminology.
Forward-looking statements are based on the Company’s current expectations regarding its strategy, plans, intentions, performance, or future occurrences or results, the information on which such expectations were based may change. These forward-looking statements rely on a number of assumptions concerning future events and are subject to a number of known and unknown risks, uncertainties, and other factors, many of which are outside of the Company’s control, that could cause actual results, performance, or achievements to materially differ from any future results, performance, or achievements expressed or implied by the forward-looking statements. Such risks, uncertainties and other factors include, but are not limited to our lack of operating history, our ability to attract new investments, our failure to manage growth effectively, our acquisition activities may pose risks that could harm our business, and our licensed AI may not perform up to the expected standards, as well as general business and economic conditions, competitive pressures, regulatory changes, technological developments, and other factors identified in the Company’s most recent filings with the U.S. Securities and Exchange Commission, including our Registration Statement on Form S-1, which are available for review at www.sec.gov. Furthermore, the Company operates in a competitive environment where new and unanticipated risks may arise. Accordingly, investors should not place any reliance on forward-looking statements as a prediction of actual results.
The forward-looking statements in this press release are based on information available to us as of the date hereof, and we disclaim any intention to, and, except as may be required by law, undertake no obligation to, update or revise forward-looking statements to reflect events or circumstances that subsequently occur or of which the Company hereafter become aware. These forward-looking statements should not be relied upon as representing our views as of any date subsequent to the date of this press release.
Investor Relations
Matthew Selinger, Senior Partner Integrous Communications Email: mselinger@integcom.us Phone: 415-572-8152
Visit and follow AIAI Holdings Corporation online:
VANCOUVER, British Columbia, July 13, 2026 (GLOBE NEWSWIRE) — Riverside Resources Inc. (“Riverside” or the “Company“) (TSX-V: RRI) (OTCQB: RVSDF) (FSE: 5YY0) is pleased to announce that it has completed an internal reorganization (the “Reorganization“) of its subsidiary, formerly named RRI Holdings Limited and now renamed Ravena Resources Corp. (“Ravena“), and that Ravena has completed an initial founders’ financing (the “Founder Financing“). The Reorganization and Founder Financing are the first steps in Riverside’s plan to spin out its portfolio of gold-silver and copper-gold exploration projects in Sonora, Mexico into a separately listed company on the TSX Venture Exchange (the “Exchange” or “TSX-V“), a process that could occur following additional financing and shareholder approval, consistent with Riverside’s approach with Capitan Silver (CAPT.V) and Blue Jay Gold (JAY.V) over the past several years.
“The creation of Ravena follows the same disciplined spin-out model that Riverside has used to launch quality companies such as Capitan Silver and Blue Jay Gold and allows our Mexican exploration portfolio to be advanced by a dedicated team and balance sheet while Riverside retains meaningful long-term exposure through its share position and a portfolio of net smelter return royalties,” said John-Mark Staude, President and CEO of Riverside. “Ravena will be led by an experienced public-company team and is anchored by the drill-ready, past-producing Los Cuarentas gold-silver project, supported by Riverside’s technical network of more than 30 years in Mexico. I am excited to be the Chairman of Ravena and will maintain an active in the next growth steps.”
The Reorganization
Prior to the Reorganization, Ravena was a wholly-owned subsidiary of Riverside that holds, indirectly through its Mexican subsidiary RRM Exploraciones, S.A.P.I. de C.V. (“SAPI“), a portfolio of five exploration projects located in Sonora, Mexico: Los Cuarentas (flagship), Cecilia, Ariel, El Valle and Suaqui Grande (collectively, the “Mexican Projects“). Maps and descriptions of these properties are available on Riverside’s website. Over the past decade, the properties have received exploration funding from major companies including BHP, Antofagasta, Centerra, Hochschild and Fortuna, among others.
Ravena Financing
Concurrently with the Reorganization, Ravena completed a non-brokered private placement of 4,962,815 common shares of Ravena at a price of C$0.20 per share for aggregate gross proceeds of C$992,563. The common shares were issued at fair value to a group of founders and arm’s length investors. Consistent with Riverside’s spin-out model, no securities were issued for nominal consideration. Ravena intends to use the net proceeds of the Founder Financing to advance the Los Cuarentas project, including mapping, sampling and geophysical surveys, to update technical disclosure in support of the proposed listing, and for general and administrative expenses and working capital.
Ravena is not a reporting issuer in any jurisdiction. The common shares issued under the Founder Financing are subject to resale restrictions under applicable securities laws, including an indefinite hold period that will not begin to run until Ravena becomes a reporting issuer, and, on listing, to any hold periods or escrow that may be imposed by the Exchange. No finder’s fees were paid in connection with the Founder Financing. The Founder Financing consisted solely of common shares of Ravena, a subsidiary of Riverside, with no warrants or other rights attached.
The Founder Financing remains subject to the acceptance of the TSX-V.
About Ravena Resources Corp.
Ravena is an advanced-stage mineral exploration company focused on high-grade gold-silver and copper-gold projects in Sonora, Mexico, a premier and established mining jurisdiction. Ravena’s flagship asset is the Los Cuarentas project, a past-producing, permitted and drill-ready low-sulfidation epithermal gold-silver system covering approximately 807 hectares, with four near-surface drill-ready targets and the potential for shallow underground mineralization as outlined by past drilling by Riverside. Los Cuarentas is located near a number of operating mines and developed deposits in the region, including Las Chispas, Santa Elena and Mercedes mines.
Ravena’s broader portfolio includes the Cecilia (gold-silver), Ariel (copper-gold porphyry), El Valle (gold-silver) and Suaqui Grande (copper-molybdenum porphyry) projects. Ravena will have access to the Mexican database of information, operational infrastructure and technical services of Riverside, whose team has more than 30 years of experience operating in Mexico. Ravena is led by Chief Executive Officer Michael Graham, an experienced public-company executive with a mining capital markets background, with Dr. John-Mark Staude serving as Non-Executive Chairman. Ravena is targeting a listing on the TSX-V in the first half of 2027, subject to regulatory acceptance, completion of further financings and market conditions, and anticipates a tight, clean capital structure.
Qualified Person & QA/QC:
The scientific and technical information contained in this news release was reviewed and approved by Freeman Smith, P.Geo., a non-independent qualified person to Riverside Resources Inc. and a “qualified person” as defined under NI 43-101.
About Riverside Resources Inc.:
Riverside is a well-funded exploration company driven by value generation and discovery. The Company has a strong balance sheet, no debt and a tight share structure, with a strong portfolio of gold-silver, copper and REE assets and royalties in North America. Further information about Riverside is available on the Company’s website at www.rivres.com.
ON BEHALF OF RIVERSIDE RESOURCES INC.
“John-Mark Staude”
Dr. John-Mark Staude, President & CEO
For additional information contact:
John-Mark Staude President, CEO Riverside Resources Inc. info@rivres.com Phone: (778) 327-6671 Fax: (778) 327-6675 Web: www.rivres.com
Eric Negraeff Investor Relations Riverside Resources Inc. Phone: (778) 327-6671 TF: (877) RIV-RES1 Web: www.rivres.com
Certain statements in this press release may be considered forward-looking information. These statements can be identified by the use of forward-looking terminology (e.g., “expect”, “estimates”, “intends”, “anticipates”, “believes”, “plans”, “proposed”). Such statements include, without limitation, statements regarding the proposed spin-out of Ravena and the timing thereof, the proposed listing of Ravena on the TSX-V, the completion of further financings by Ravena, the anticipated capital structure of Ravena, the use of proceeds of the Founder Financing, the receipt of TSX-V and other regulatory acceptances, and the exploration plans for the Mexican Projects. Such information involves known and unknown risks – including the availability of funds, the results of financing and exploration activities, the interpretation of exploration results and other geological data, the failure to obtain required regulatory or Exchange acceptances, risks relating to international operations in Mexico, and other risks identified by Riverside in its public securities filings – that may cause actual events to differ materially from current expectations. Readers are cautioned not to place undue reliance on these forward-looking statements, which speak only as of the date of this press release.
Completion of the Reorganization and the Founder Financing, and the proposed spin-out and listing of Ravena, remain subject to the acceptance of the TSX Venture Exchange. There can be no assurance that the proposed spin-out or listing of Ravena will be completed as described in this news release, or at all.
Neither the TSX Venture Exchange nor its Regulation Services Provider (as that term is defined in the policies ofthe TSX Venture Exchange) accepts responsibility for the adequacy or accuracy of this release.
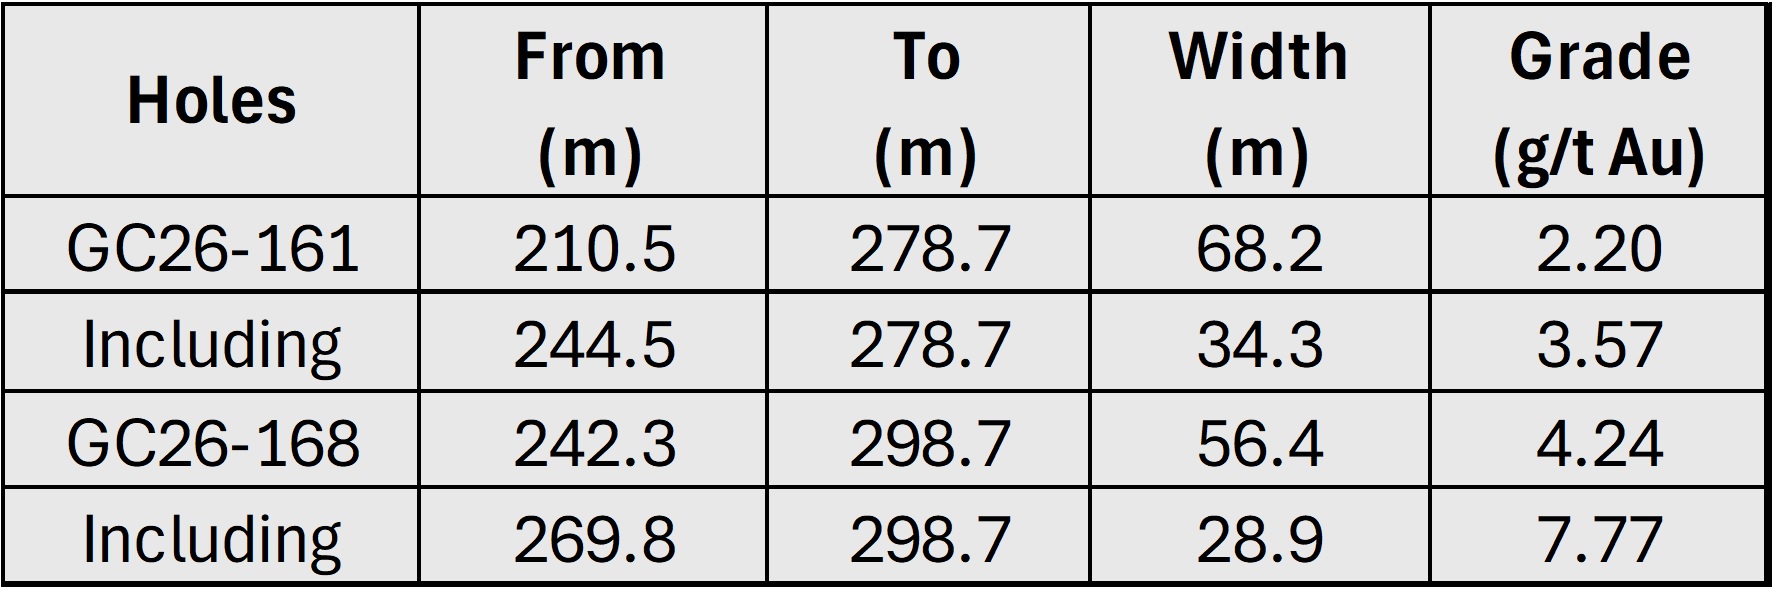
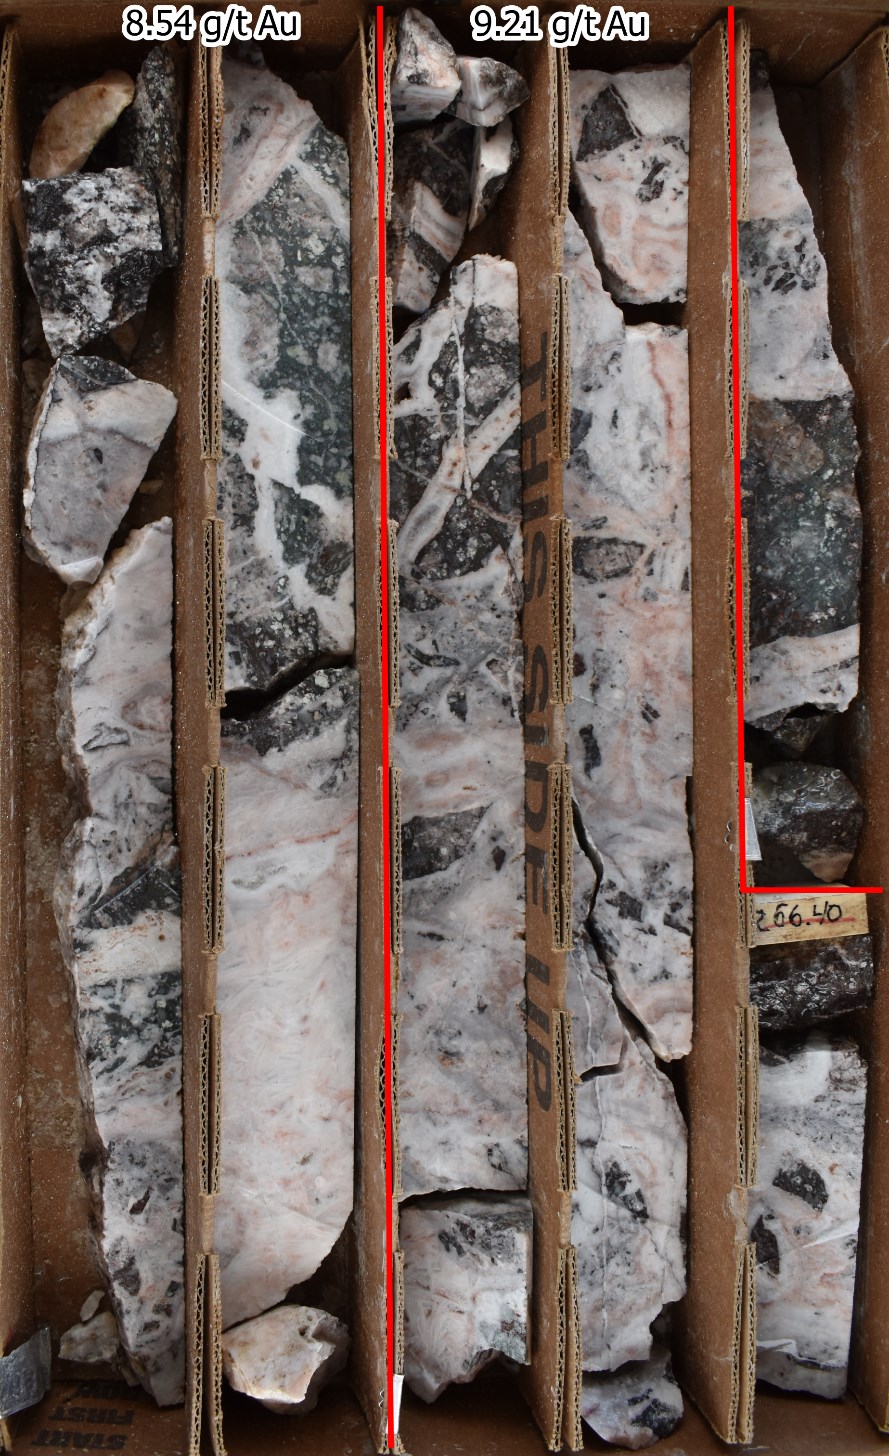
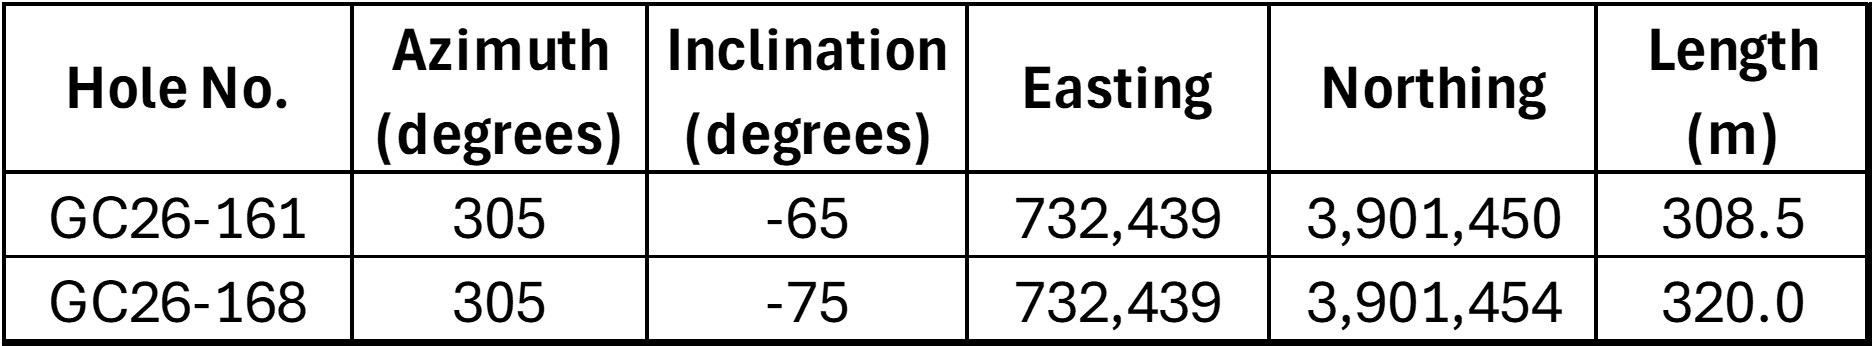
Vancouver, British Columbia–(Newsfile Corp. – July 9, 2026) – West Point Gold Corp. (TSXV: WPG) (OTCQX: WPGCF) (FSE: LRA0) (“West Point Gold” or the “Company”) is pleased to announce the results from two drill holes within the high-grade Northeast (NE) Tyro zone at its flagship Gold Chain Project in Arizona. Hole GC26-168 was a reverse circulation (“RC”) hole that intersected 56.4 metres (“m”) of 4.24 grams per tonne (“g/t”) gold (“Au”) from 242.3m, including 28.9m at 7.77 g/t. This hole was drilled as a follow-up to GC26-161, which was a core hole that intersected 68.2m at 2.20 g/t Au from 210.5m, including 34.3m at 3.57 g/t Au. These holes continue to extend the zone at NE Tyro down-dip where it remains open to depth. The previously released hole GC26-148 (see release here) suggests that the zone appears to be widening at depth.
The Company is reporting assay results for two drill holes (628.5m), GC26-161 and GC26-168. Results from 19 holes representing 5,920m of the recently completed 21,079m program are still pending. All results from Tyro Main and NE Tyro are expected to contribute to the Company’s upcoming maiden resource estimate to be released later in 2026.
Highlights:
Hole GC26-168 (RC), drilled about 20m below GC26-161, returned 56.4m of 4.24 g/t Au from 242.3 to 298.7m including 28.9m at 7.77 g/t Au. The TW is estimated to be 28m.
Hole GC26-161 (core) was drilled across the NE Tyro vein zone about 230m down-dip from surface and intersected 68.2m at 2.20 g/t Au from 210.5 to 278.7m including 34.3m at 3.57 g/t Au. The true width (TW) is estimated to be 40m.
Deep drilling across the Tyro NE zone suggests that the vein system widens and extends 270m below the surface where it remains open in all directions.
“With these results and GC26-148, the apparent widening, along with the textures observed, suggests multiple gold mineralizing events with deposition over a greater vertical range than you would typically see in low sulphidation epithermal systems. These results further support the zone remaining open to depth,” stated Derek Macpherson, President and CEO.
Note: All widths shown are downhole; true widths are approximately 50-60% of downhole widths.
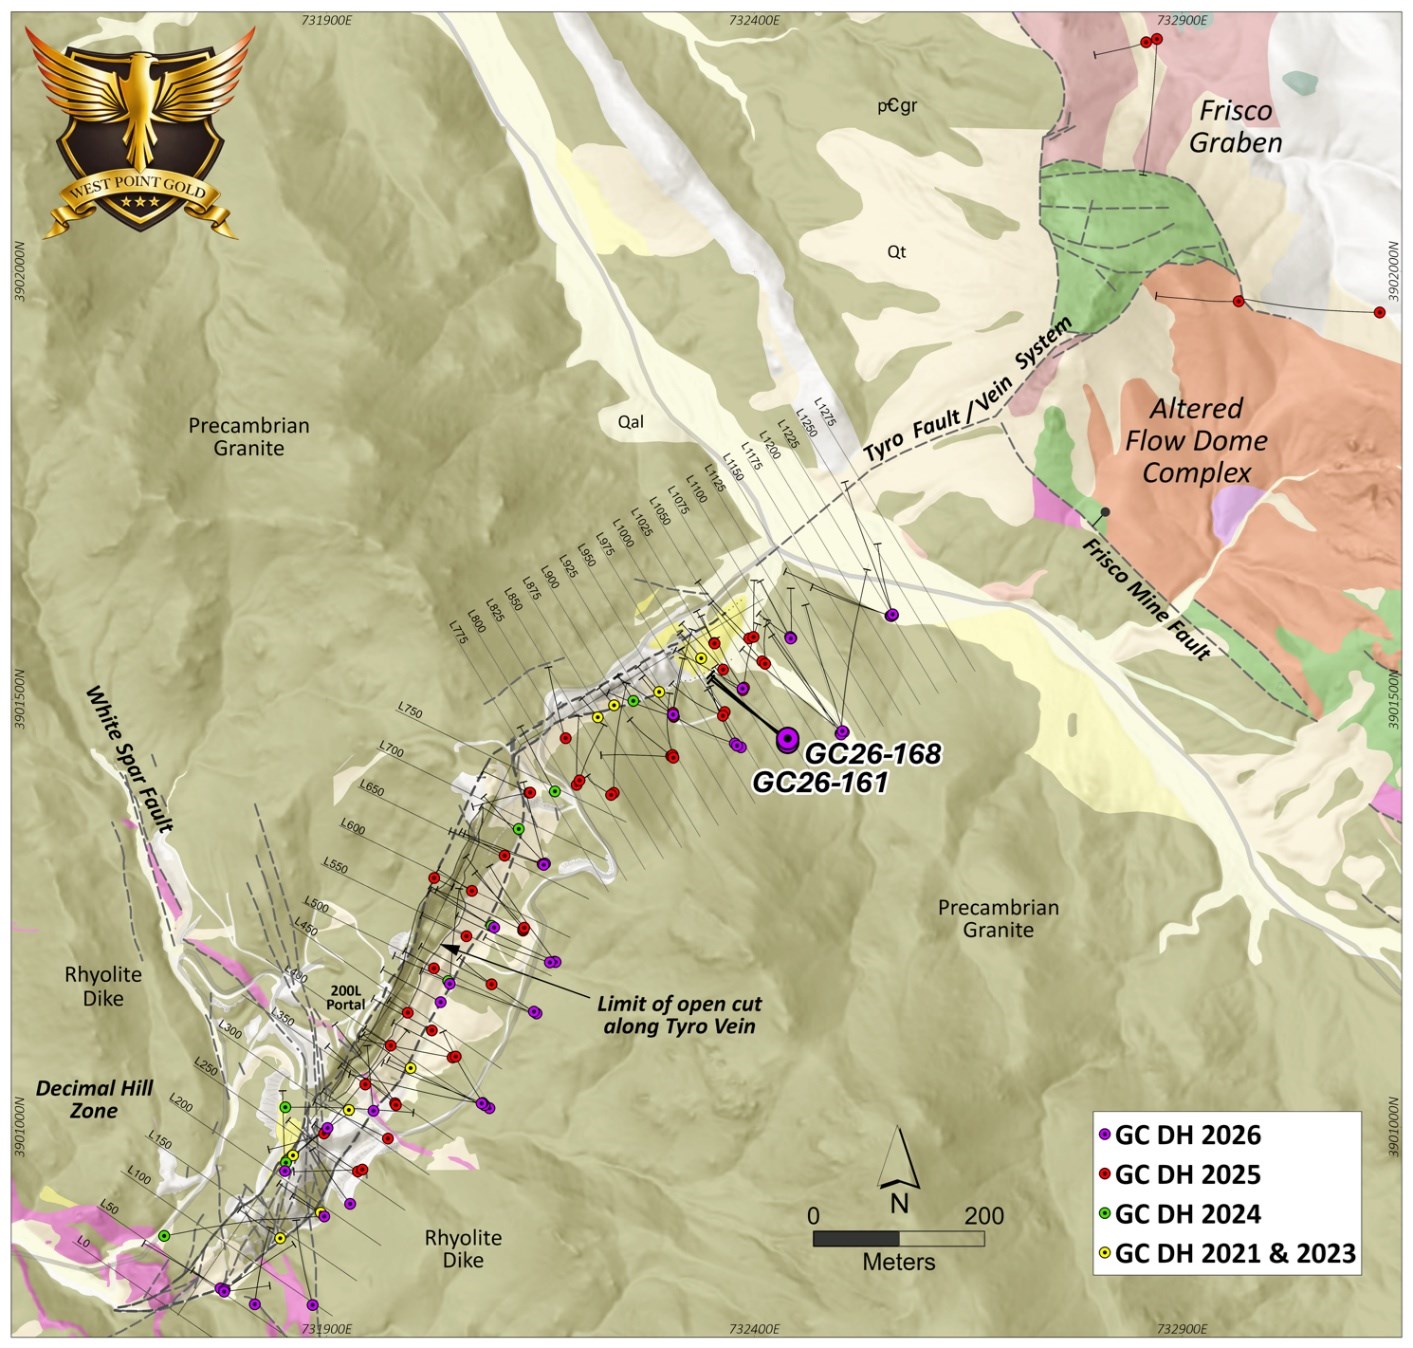
Figure 1. Plan view of the Main Tyro vein showing geology and drilling conducted in 2021, 2023, 2024, 2025, and 2026. Note the location of Hole Nos. GC26-161 and GC26-168.
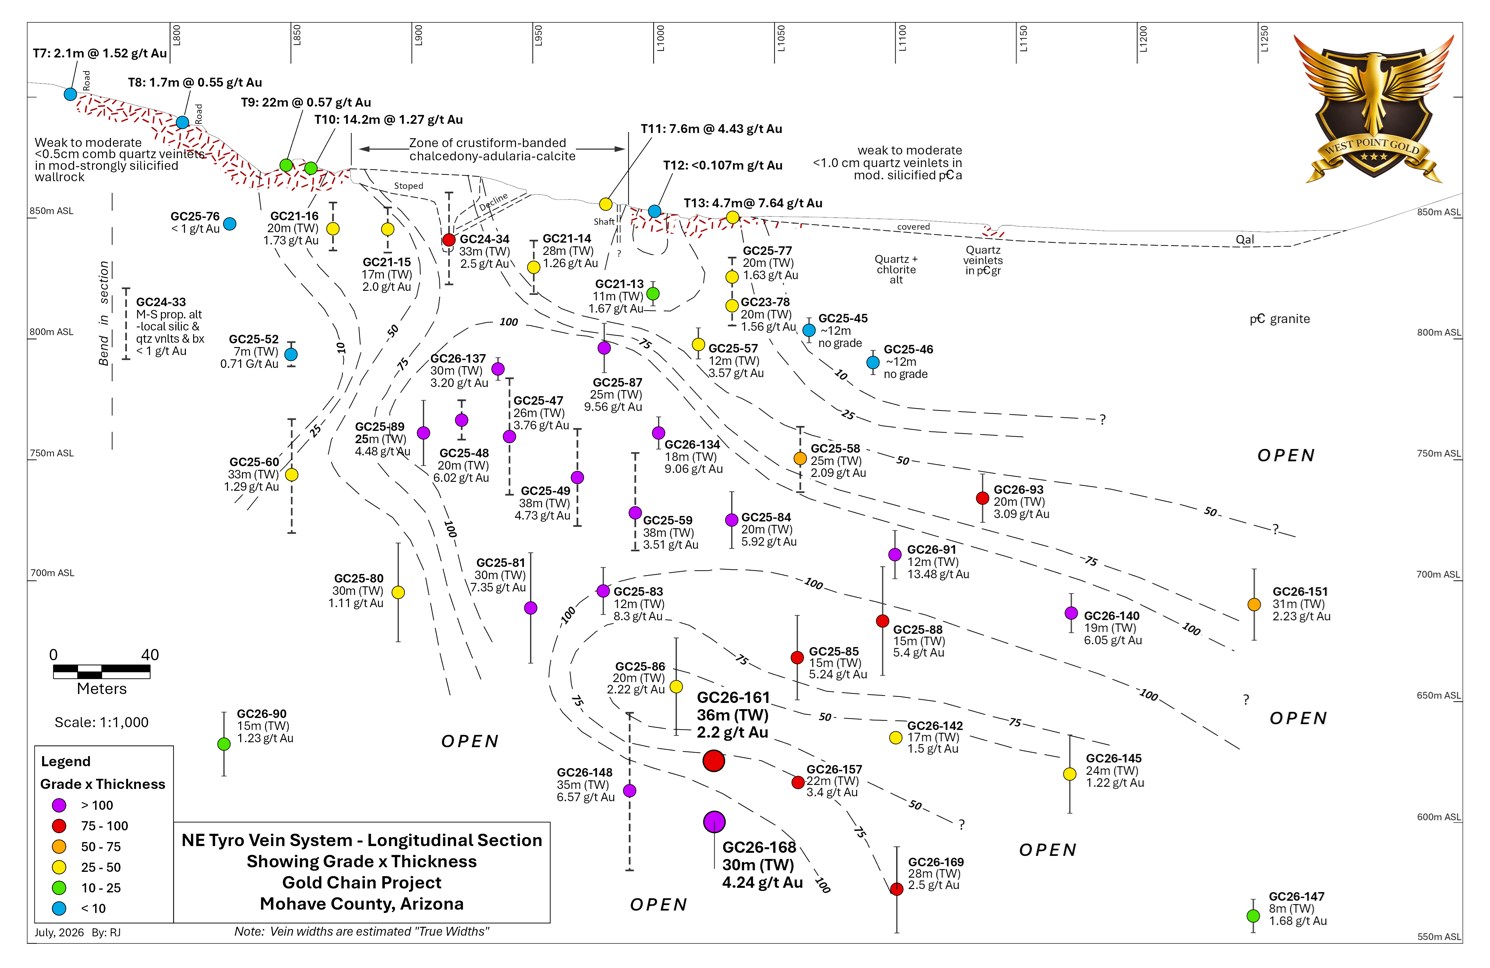
Figure 2. Longitudinal perspective of the Tyro NE zone contoured GT (g/t Au X estimated true thickness). Both Holes GC26-161 and -168 are contained within the GT >100 interval.
GC26-161 and -168 Both Holes GC26-161 (core) and -168 (RC) targeted the down-dip extension of the NE Tyro zone and crossed the vein system between holes GC26-148 (66.2m at 6.57 g/t Au) and GC26-157 (31m at 3.4 g/t Au) at an elevation of about 600m above sea level (“ASL”) which is 250m below surface (Figure 2). Both holes deviated somewhat to the south resulting in a step-out of only about 30 metres from GC26-148. The proximity of the two holes allows for a comparison between the two drilling/sampling techniques. It was also deemed important to cross higher-grade portions with core where detailed documentation of recovery, RQD, vein styles, textures and density has occurred. In summary, these two holes support the emerging geologic (Figure 3) and grade models (Figure 2) and improve the definition of the high-grade gold mineralization in the NE Tyro zone at the Company’s Gold Chain project in Arizona. The two holes comprising this release represent 628.5m of the now completed 21,079m drill program.
Both holes, shown in Figures 2 and 3, corroborate the widening of the vein system observed to the south in hole GC26-148 (see release here). The primary structural control appears to define the footwall (FW) contact where a broad, and generally high-grade, hydrothermal breccia is in sharp contact with the hosting Precambrian granite. The intensity of vein-filling (quartz-calcite-adularia) diminishes upwards toward the hanging wall (HW) along with a general decrease in gold grades. Figure 3 also suggests that the vein system may be steeping at an elevation of about 650m ASL (200m below surface), which may explain the widening of the ‘damage zone’ and associated fracturing.
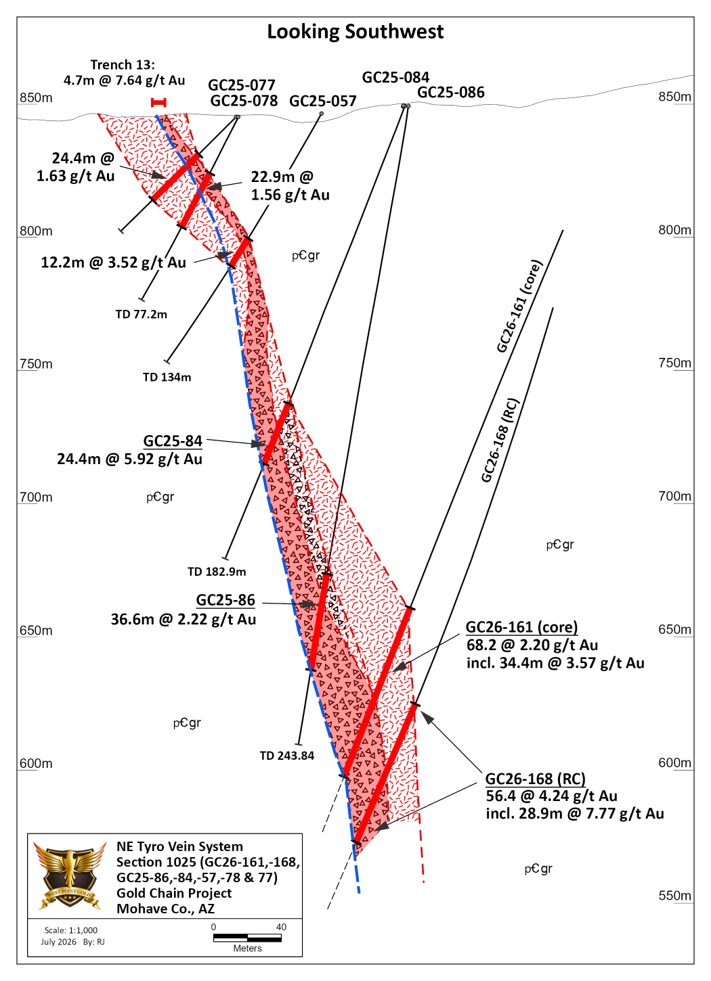
Figure 3. Geologic section drawn along GC26-161 and GC26-168 showing vein and spatial relation to GC25-77, GC25-78, GC25-57, GC25-084, and Trench 13 on the surface.
Hole GC26-161 encountered mineralization between 201.5 and 278.7m containing 2.20 g/t Au within a broad envelope of fractured, broken and altered granite. This envelope contains 34.3m at 3.57 g/t Au from 244.5m in a zone of quartz-chalcedony-calcite adularia stockwork and breccia (Figure 4). Hole GC26-168 encountered similar mineralization at a slightly greater depth (Figure 3) from 242.3 to 298.7m (56.4m) at 4.24 g/t Au, containing 28.9m at 7.77 g/t Au from 269.8m down to the FW contact (Figure 3).
The vein system along this section (Figure 3) dips 75 degrees where it steepens to near-vertical at about 650m ASL (200m below surface). The intercept has developed around a couple of fine-grained intrusive phases, i.e. dikes, that are strongly altered, broken and veined. This spatial coincidence may reflect a preference for the gold-bearing fluids to follow the dikes (more brittle) and/or the contact with the hosting Precambrian (likely broken and faulted). The modelling of these features in the upcoming weeks will provide greater insight into deeper targets.
Figure 4 provides a photo of the main mineralized zone or ‘vein breccia’ in GC26-161, which hosts most of the gold mineralization. Veins and breccia composing the NE Tyro vein are multi-stage and comprised of quartz-chalcedony-calcite (bladed)-adularia with only trace amounts of pyrite. Bladed calcite or “lattice texture” has developed in several stages and ranges from delicate bands within crustiform/coliform-banded chalcedony to coarse, angular fragments in late-stage breccia.
Figure 4. Photo GC26-161 showing a portion of the vein and corresponding gold values. Core reveals that the NE Tyro vein is a broad zone of multi-stage veins and breccia hosting a broad array of textures.
Qualified Person Robert Johansing, M.Sc. Econ. Geol., P. Geo., the Company’s Vice President, Exploration, is a qualified person (“QP”) as defined by NI 43-101 and has reviewed and approved the technical content of this press release. Mr. Johansing has also been responsible for overseeing all phases of the drilling program, including logging, cutting, labelling, bagging and transport from the project to American Assay Laboratories (AAL) of Sparks, Nevada. Reverse Circulation (RC) drill holes have a diameter of about 10cm (~4″), and samples have an approximate weight of 5 to 10kg. Core size is HQ (2.5″/63.5mm) and is logged, photographed and cut at the Company’s Bullhead City sampling facility including the insertion of blanks and standards. All samples are packaged for shipment at the facility and trucked to AAL in Reno. Samples were then dried, crushed and split, and pulp samples were prepared for analysis. Gold was determined by fire assay with an ICP finish, and over-limit samples were determined by fire assay and gravimetric finish. Silver plus 15 other elements were determined by Aqua Regia ICP-AES (IM-2A16), and over-limit samples were determined by fire assay and gravimetric finish. Both certified standards and blanks were inserted on site along with duplicates, standards and blanks inserted by American Assay. The results summarized above have been carefully reviewed with reference to the QA/QC results. Standard sample chain of custody procedures were employed during drilling and sampling campaigns until delivery to the analytical facility.
About West Point Gold Corp. West Point Gold is an exploration and development company focused on unlocking value across four strategically located projects along the prolific Walker Lane Trend in Nevada and Arizona, USA, providing shareholders with exposure to multiple discovery opportunities across one of North America’s most productive gold regions. The Company’s near-term priority is advancing its flagship Gold Chain Project in Arizona.
For further information regarding this press release, please contact: Aaron Paterson, Corporate Communications Manager Phone: +1 (778) 358-6173 Email: info@westpointgold.com
FORWARD-LOOKING STATEMENTS: Certain statements contained in this press release constitute forward-looking information. These statements relate to future events or future performance. Forward-looking statements include estimates and statements that describe the Company’s future plans, objectives or goals, including words to the effect that the Company or management expects a stated condition or result to occur. The use of any of the words “could”, “intend”, “expect”, “believe”, “will”, “projected”, “estimated” and similar expressions and statements relating to matters that are not historical facts are intended to identify forward-looking information and are based on the Company’s current belief or assumptions as to the outcome and timing of such future events including, among others, assumptions about future prices of gold, silver, and other metal prices, currency exchange rates and interest rates, timing of the Company’s maiden resource estimate, favourable operating conditions, political stability, obtaining government approvals and financing on time, obtaining renewals for existing licenses and permits and obtaining required licenses and permits, labour stability, stability in market conditions, availability of equipment, availability of drill rigs, and anticipated costs and expenditures. In particular, this press release contains forward-looking statements concerning the timing of a maiden resource estimate and the belief that Tyro NE will be open to depth following that estimate. The Company cautions that all forward-looking statements are inherently uncertain, and that actual performance may be affected by a number of material factors, many of which are beyond the Company’s control. Such factors include, among other things: risks and uncertainties relating to West Point Gold’s ability to complete any payments or expenditures required under the Company’s various option agreements for its projects; and other risks and uncertainties relating to the actual results of current exploration activities, the uncertainties related to resources estimates; the uncertainty of estimates and projections in relation to production, costs and expenses; risks relating to grade and continuity of mineral deposits; the uncertainties involved in interpreting drill results and other exploration data; the potential for delays in exploration or development activities; uncertainty related to the geology, grade and continuity of mineral deposits; the possibility that future exploration, development or mining results may vary from those expected; statements about expected results of operations, royalties, cash flows, financial position may not be consistent with the Company’s expectations due to accidents, equipment breakdowns, title and permitting matters, labour disputes or other unanticipated difficulties with or interruptions in operations, fluctuating metal prices, unanticipated costs and expenses, uncertainties relating to the availability and costs of financing needed in the future and regulatory restrictions, including environmental regulatory restrictions. The possibility that future exploration, development or mining results will not be consistent with adjacent properties and the Company’s expectations; operational risks and hazards inherent with the business of mining (including environmental accidents and hazards, industrial accidents, equipment breakdown, unusual or unexpected geological or structural formations, cave-ins, flooding and severe weather); metal price fluctuations; environmental and regulatory requirements; availability of permits, failure to convert estimated mineral resources to reserves; the inability to complete a feasibility study which recommends a production decision; the preliminary nature of metallurgical test results; fluctuating gold prices; possibility of equipment breakdowns and delays, exploration cost overruns, availability of capital and financing, general economic, political risks, market or business conditions, regulatory changes, timeliness of government or regulatory approvals and other risks involved in the mineral exploration and development industry, and those risks set out in the filings on SEDAR made by the Company with securities regulators. Although the Company believes that the assumptions and factors used in preparing the forward-looking information in this corporate press release are reasonable, undue reliance should not be placed on such information, which only applies as of the date of this news release, and no assurance can be given that such events will occur in the disclosed time frames or at all. The Company expressly disclaims any intention or obligation to update or revise any forward-looking statements whether as a result of new information, future events or otherwise, other than as required by applicable securities legislation.
Neither the TSX Venture Exchange nor its Regulation Services Provider (as that term is defined in the policies of the TSX Venture Exchange) accepts responsibility for the adequacy or accuracy of this release.
Vancouver, British Columbia–(Newsfile Corp. – July 9, 2026) – Questcorp Mining Inc. (CSE: QQQ) (OTCQB: QQCMF) (FSE: D910) (the “Company” or “Questcorp“) is pleased to announce the completion of the expanded drone magnetic and IP geophysical programs linked to the current drilling at the La Union Project, Sonora, Mexico. Geophysics targeted both known zones and new target areas defined in the H1 2026 surface program prior to drilling. Joint Venture partner Riverside Resources Inc., under the direction of CEO John-Mark Staude, continues to conduct the onsite exploration.
Highlights
A further 248-line kms of drone magnetics were completed, consisting of 193-line kms at 100m line spacings and a further 55-line kms of tie lines. The high-resolution definition survey builds on the 2025 baseline dataset, identifying multiple strong targets.
A further 8-line kms of IP were completed adding to the 4-line kms completed in 2025 and testing multiple existing and new target areas. Data processing is underway to interpret results from the completed drilling, expand targets, and extend the potential for drilling along strike and at depth.
The geophysics will be immediately applied to the active drill program, where the first holes focused on three areas: Union, Union North, and Jabali. 4 holes, totaling 400 metres, have been completed since Phase 1 drilling commenced on June 9th. Sampling continues with 4 holes now at the Zacatecas laboratory.
Initial exploration efforts relied on surface mapping, geochemistry, and past mine activity as a guide. These more robust and expansive geophysical datasets help place Union’s discovery potential in a larger regional context, similar to major deposits in Arizona and Sonora where these tools have proven effective at that scale:
Identifying cross structures trending NE and NW which potentially coincide with mapped feeder fault zones for the Carbonate Replacement Deposit (“CRD”) and sediment-hosted gold
Situating the outcropping diorite bodies within a larger context to assess their potential scale and their relationship to the known gold-zinc mineralized areas at Union
Improving imaging of structures beneath post-mineral cover, including NW trending structures newly identified by spring 2026 field mapping as potential ore controls and untested targets.
“With the IP survey now complete, combined with the processed aeromagnetic data, we have an expanded view of the Union Project’s targets and structural framework, both at depth and along strike from current drilling,” said John-Mark Staude, President and CEO, Riverside Resources Inc. “Our teams are in the field continuing Phase 2 drilling, and this data is immediately helping us expand targeting and prioritize the project’s robust set of targets. The program is going well, and our teams are processing drill core and sending samples to the laboratory for assays. We’re also now using the new geophysics to put our surface geology observations into a mineralization targeting context, helping focus our efforts toward discovering high-grade gold and base metals similar to what was previously mined here, now with geophysics to help image potential source targets at depth.”
Questcorp President & CEO Saf Dhillon added: “We want to thank John-Mark and the entire Riverside team for their continued technical rigour and close collaboration on the ground at La Union – their operational execution has been instrumental in getting us to this point. With 4 holes now in hand at the Zacatecas laboratory, we are eager to receive the first assay results as quickly as possible, and we look forward to sharing them with our shareholders the moment they are available.”
Geophysics Integration
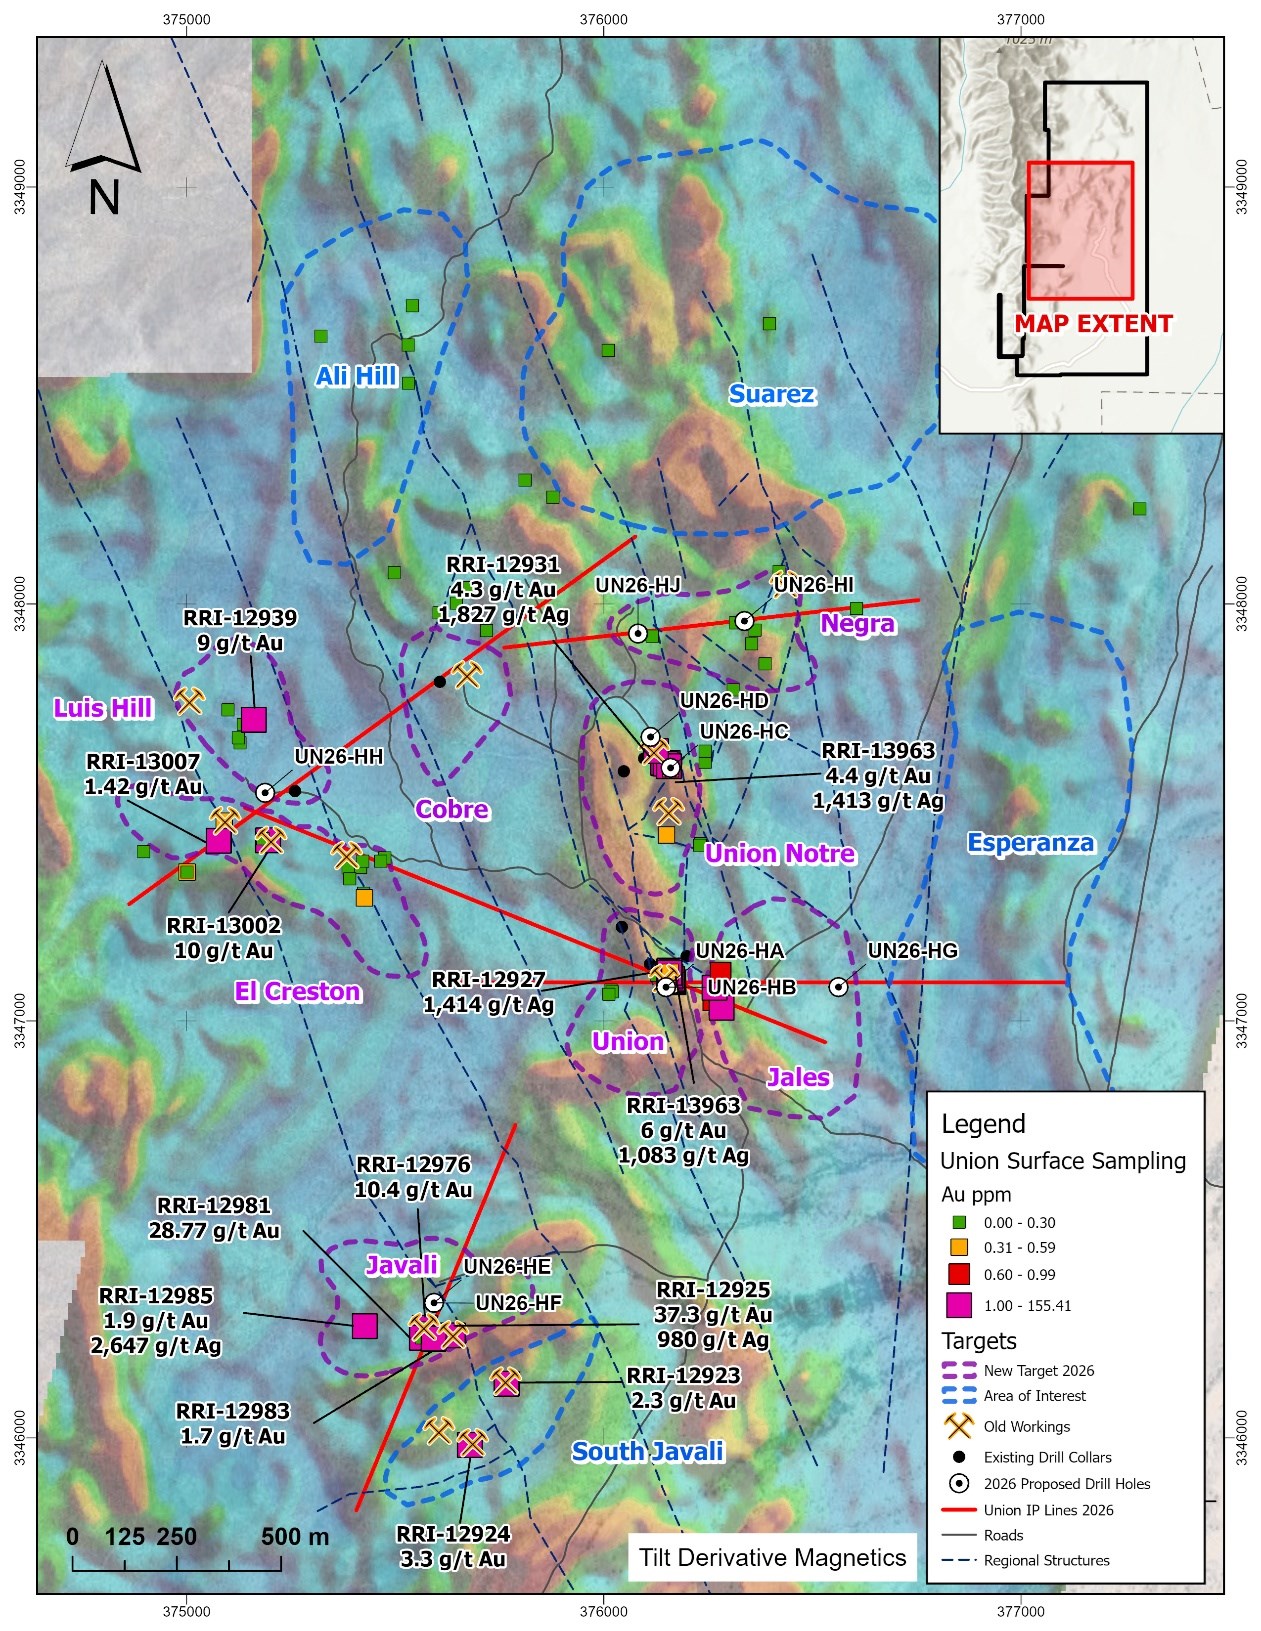
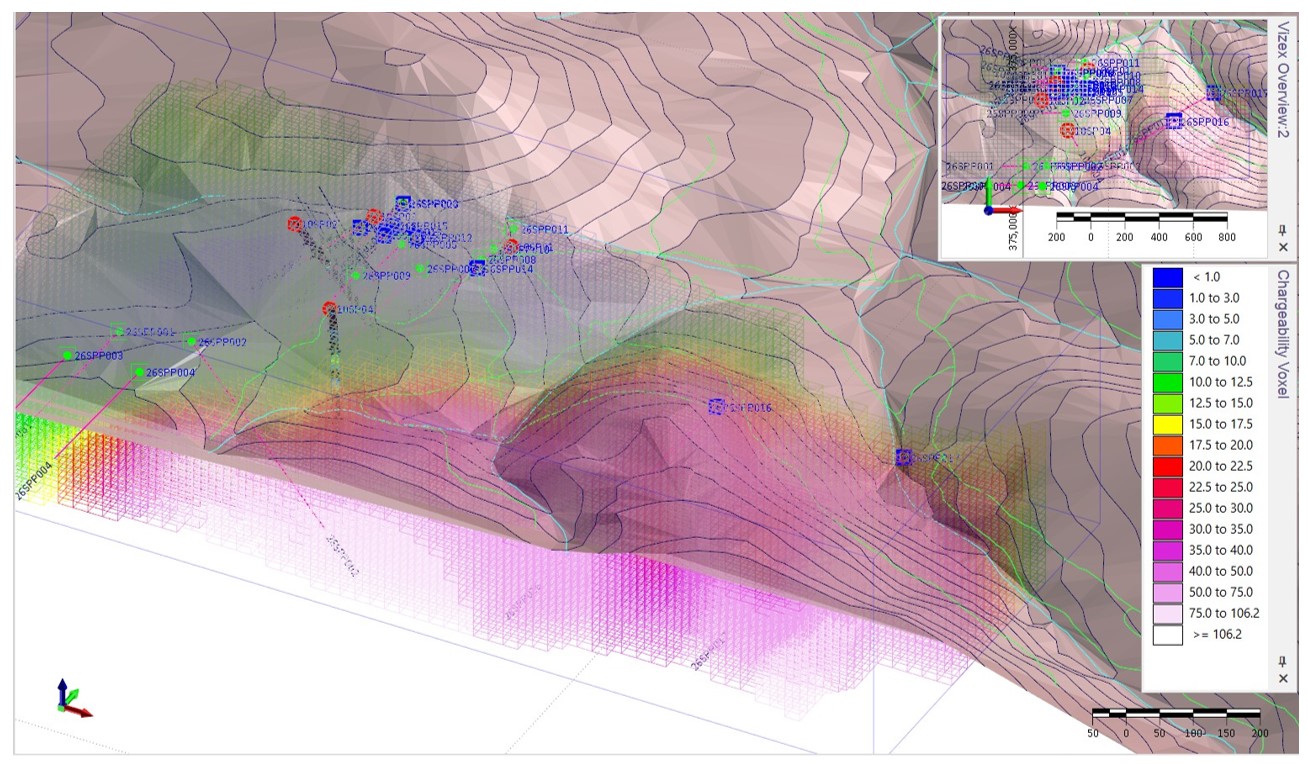
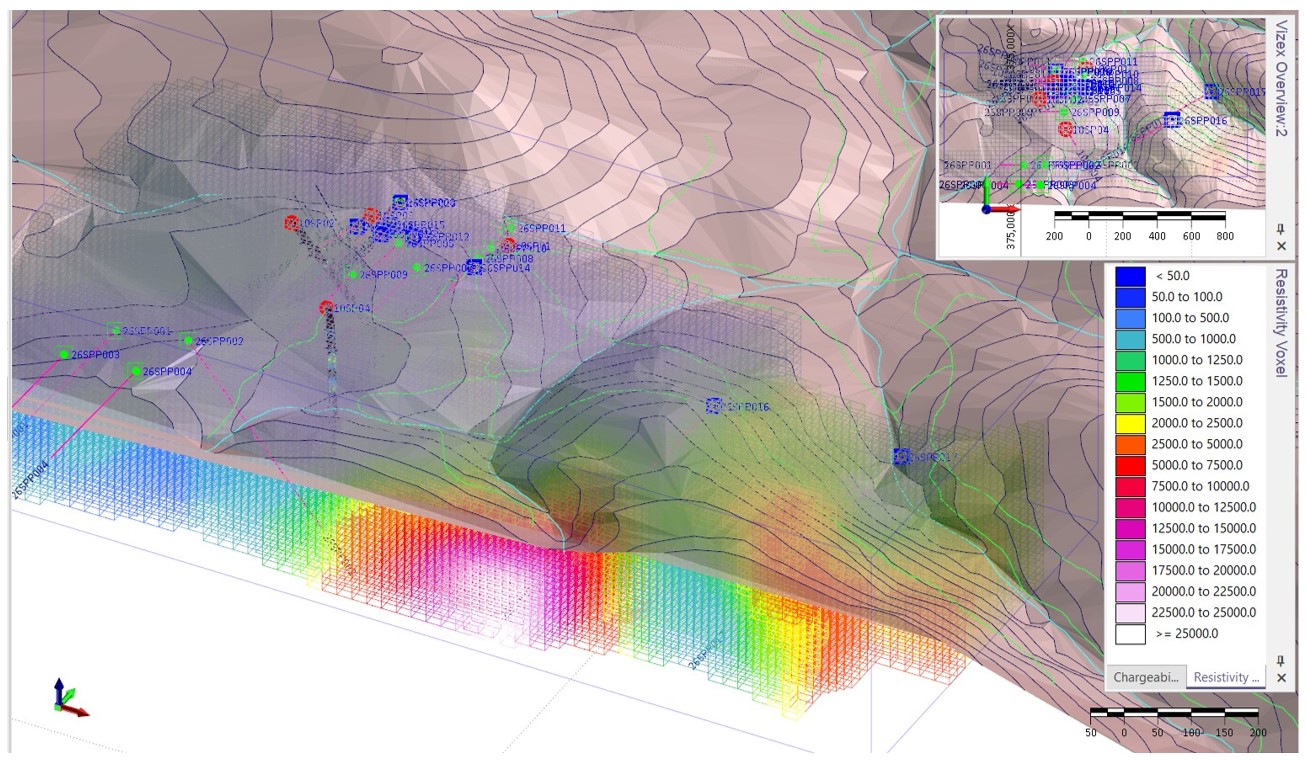
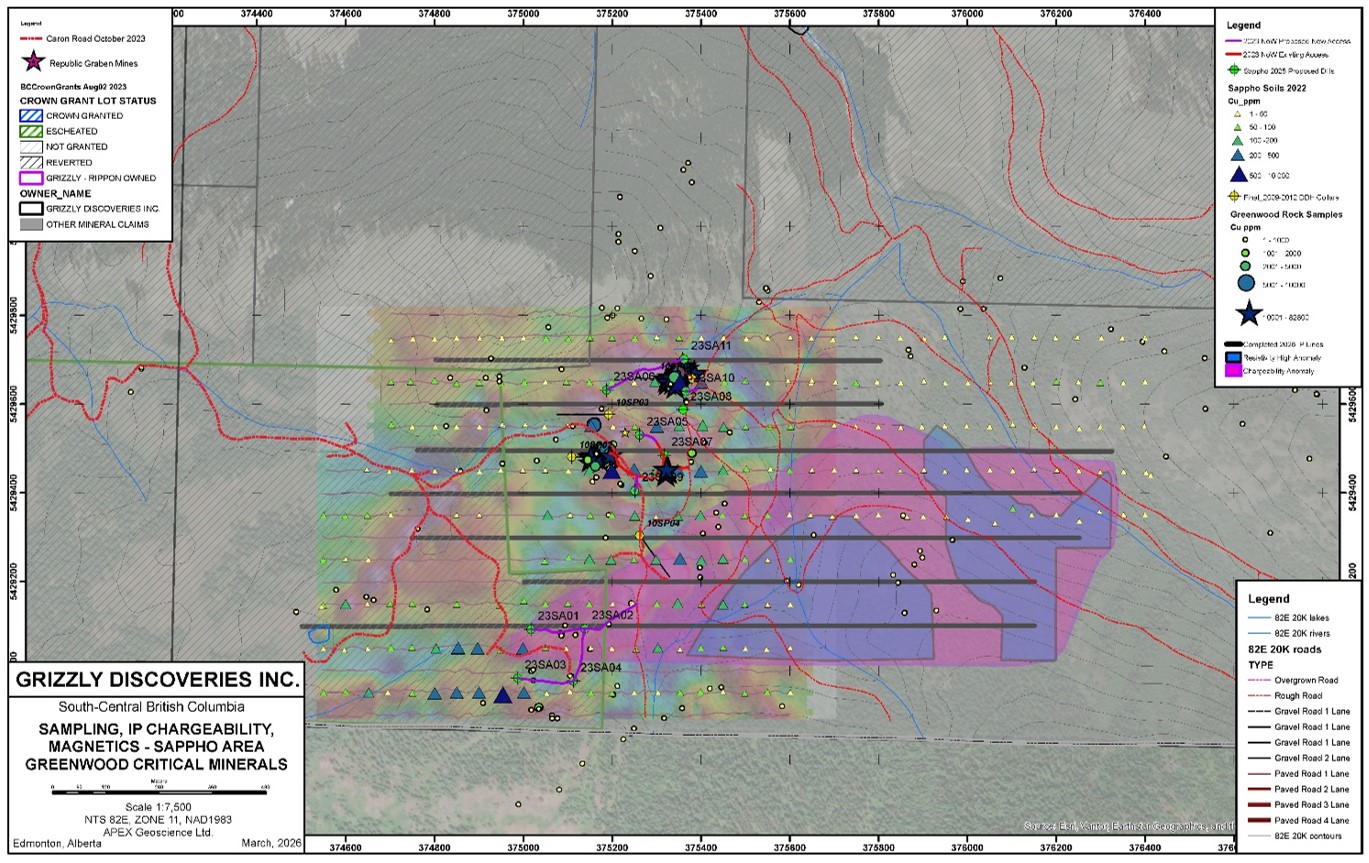
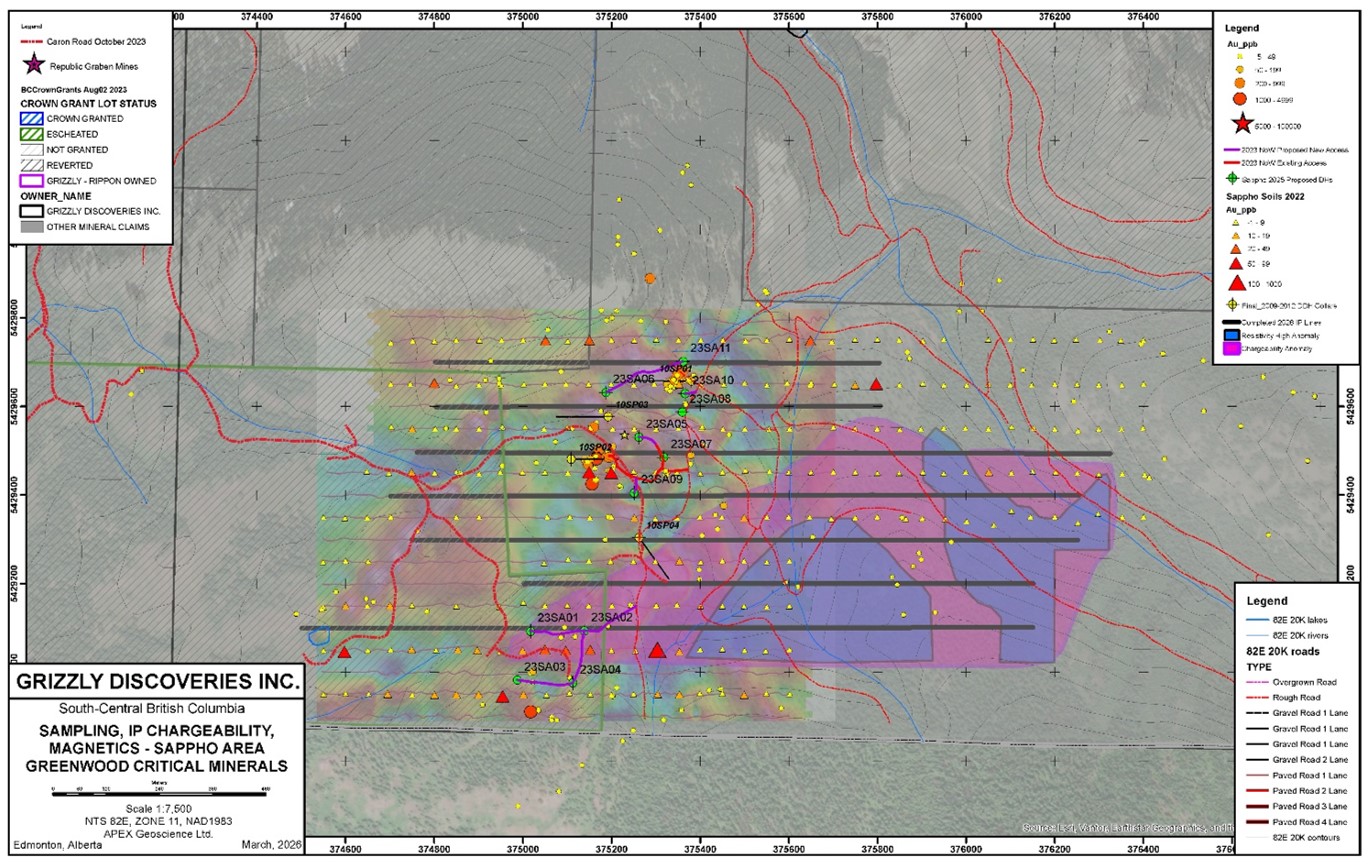
The completed Induced Polarization (“IP”) survey comprised 5 dipole-dipole lines with a 50m dipole spacing. The lines were located over areas of known mineralization in an effort to further refine drill targeting. IP provides the rock resistivity and conductivity to the depth of about 200m. The IP coupled with magnetics allows some interpretation of the existing structures and their orientations, see Figure 1. The IP lines cross over the current drilling, providing context for how the drilling fits into the larger target framework. The aeromagnetic survey measured the magnetic response of the bedrock closer to surface and showed a series of NE and NW-trending structures believed to be deeper (feeder) fault zones. Geophysics combined with surface geochemistry should provide more refined targets for the ongoing drill program focused in this area.
Figure 1: Map showing the integration of geophysics from the drone aeromagnetic survey and IP lines, along with assay data collected during Riverside’s Union exploration program. The rock sample results were released in Questcorp’s 2026-May-05 News Release.
The technical content of this news release has been reviewed and approved by R. Tim Henneberry, P. Geo (BC), a Director of the Company and a Qualified Person under National Instrument 43-101 – Standards of Disclosure for Mineral Projects.
About Questcorp Mining Inc.
Questcorp is engaged in the business of the acquisition and exploration of mineral properties in North America, with the objective of locating and developing economic precious and base metal properties of merit. The Company holds an option to acquire an undivided 100-per-cent interest in and to mineral claims totalling 1,168.09 hectares comprising the North Island Copper property, on Vancouver Island, B.C., subject to a royalty obligation. The Company also holds an option to acquire an undivided 100-per-cent interest in and to mineral claims totalling 2,520.2 hectares comprising the La Union Project located in Sonora, Mexico, subject to a royalty obligation.
ON BEHALF OF THE BOARD OF DIRECTORS,
Saf Dhillon President & CEO
Questcorp Mining Inc. saf@questcorpmining.ca Tel. (604-484-3031) Suite 550, 800 West Pender Street Vancouver, British Columbia V6C 2V6
This news release includes certain “forward-looking statements” under applicable Canadian securities legislation. Forward-looking statements include, but are not limited to, statements with respect to the intended use of proceeds from the Offering; and closing of subsequent tranches of the Offering. Forward-looking statements are necessarily based upon a number of estimates and assumptions that, while considered reasonable, are subject to known and unknown risks, uncertainties, and other factors which may cause the actual results and future events to differ materially from those expressed or implied by such forward-looking statements. Such factors include, but are not limited to, general business, economic, competitive, political and social uncertainties, uncertain capital markets; and delay or failure to receive board or regulatory approvals. There can be no assurance that such forward-looking statements will prove to be accurate, as actual results and future events could differ materially from those anticipated in such statements. Accordingly, readers should not place undue reliance on forward-looking statements. The Company disclaims any intention or obligation to update or revise any forward-looking statements, whether as a result of new information, future events or otherwise, except as required by law.
Neither the Canadian Securities Exchange nor its Regulation Services Provider (as that term is defined in the policies of the Canadian Securities Exchange) accepts responsibility for the adequacy or accuracy of this release.
Edmonton, Alberta–(Newsfile Corp. – July 6, 2026) – Grizzly Discoveries Inc. (TSXV: GZD) (FSE: G6H) (OTCQB: GZDIF) (“Grizzly” or the “Company”) is pleased to announce preliminary results from the Phase 2 Induced Polarization (IP) program, conducted in April 2026 to follow up excellent prior results from both surface sampling, historical drilling and Phase 1 IP results, at the Sappho Critical Minerals Target (Figure 1). A total of seven lines of IP for 10.1 line-kms were completed between the Phase 1 and Phase 2 surveys at Sappho outlining and extending a significant chargeability anomaly identified in the Phase 1 work. It is interpreted that a strong chargeability anomaly likely represents disseminated sulphide that is likely associated with an intrusion related porphyry target near Greenwood, British Columbia (BC).
The Company is currently in the process of permitting additional drillhole pads to complete drill testing of the chargeability target later in the year. Further IP work, geological mapping and surface sampling centered on the target are planned and in progress prior to the commencement of additional drilling.
A total of seven core holes for a total 1,485 m were completed in late April — to mid-May targeting the near surface Sappho Skarn Target looking for copper-gold-silver-platinum group elements (Cu-Au-Ag-PGEs). The Sappho Skarn Target is immediately adjacent to the chargeability anomaly. Samples from the seven core holes have all been collected and submitted to ALS Global in Kamloops and Vancouver. Results will be announced once received, verified, and interpreted.
Highlights
Phase 2 Sappho IP results extend the chargeability anomaly up to 600 m south and 800 m east and is open in both directions (Figures 2 and 3).
The core of the IP chargeability anomaly ranges from 30 mV/V up to 105+ mV/V in intensity, and in several instances is coincident with a strong resistivity anomaly or in some cases a weak conductivity anomaly (Figures 2 and 3).
Along the west edge of the chargeability anomaly, there is moderate to strong anomalism with copper and gold in soils and in rocks (Figures 4 and 5).
The Sappho Skarn Zone itself is peripheral to the strong chargeability anomaly (Figure 6).
The northwest contact of the chargeability anomaly, coincident with the associated anomalous Sappho soils, is a graben edge sympathetic fault to the northeast trend of the Toroda Graben faults which host numerous pyroxenite-monzonite-diorite (older – Jurassic) and younger quartz-feldspar porphyry (QFP)-diorite (Tertiary) intrusions into intermediate-mafic volcanics along with a complex magnetic feature at the Sappho Main Skarn Target area (Figure 1).
The 2026 IP Survey has detected a new significant deeper chargeability anomaly on the southeast part of the grid – likely up against one of the main Sappho faults (Figures 1 to 6). The chargeability anomaly is not closed off and is on the order of 30 to greater than 100 mV/V and is comparable in size and intensity with a number of porphyry targets that have yielded new porphyry discoveries across BC recently.
The chargeability anomaly and porphyry target appears to be gaining in strength approaching the USA Border. As a result, the Company has staked a total of 35 Bureau of Land Management lode mineral claims in Washington State covering the potential southern extent of the anomaly.
Brian “Griz” Testo, President & CEO of Grizzly Discoveries, states: “Anomalous ground magnetics and now IP has outlined multiple and significant new targets across the Sappho Project. I am excited to see what the next phase of drilling might show us. Grizzly will continue to refine these targets to the drill ready stage for drilling in the next couple of months and we look forward to potentially identifying new discoveries.”
Ongoing Exploration
The Company is continuing with surface exploration in the Greenwood area. Crews from APEX completed trenching and rock sampling in June at the Midway Mine area, as well as some follow up sampling at the Sappho Chargeability Target area. The 2026 exploration work is ongoing and includes prospecting and rock sampling at targets in the Motherlode area, the Rock Creek area, the Midway area, the Copper Mountain area, the Overlander-Attwood area and surrounding the Sappho (Figure 7). Additional groundwork including ground geophysical surveys are being planned and will comprise IP, magnetics and Loupe electromagnetics (EM) for the Sappho, the Midway and Motherlode areas (Figure 7). Drillhole and rock sampling results from the 2026 work are pending and will be released as they are received.
Sappho Geological Overview
The East and West Faults of the Toroda Graben likely played a role in controlling the Au-Ag mineralization for the Buckhorn Skarn and Mine to the southwest and the Cu-Au-Ag mineralization for the Motherlode/Greyhound skarns to the north (Figure 7). Skarn and porphyry style alteration and mineralization along with Cu-PGE’s-Au-Ag are observed in outcrop and drill core along with a complex magnetic signature in the Main Sappho Skarn area.
Five (5) new sulphide showings were discovered during 2022 field work, with 4 of the 5 showings yielding rock grab samples with >1% copper (Cu) up to as high as 7.25% Cu (Figure 1 and see Grizzly news release dated November 3rd, 2022).
In previous sampling. A total of 17 rock grab samples returned values >1% Cu up to 9.06% Cu, many also with anomalous gold (Au), silver (Ag), platinum (Pt) and palladium (Pd). A total of 11 samples have yielded >500 parts per billion (ppb) Pt and Pd up to 4.64 grams per tonne (g/t) Pt and up to 2.28 g/t Pd.
The Sappho area is being targeted for copper-gold skarn and porphyry type targets associated with a Jurassic alkalic intrusive complex and several younger diorite intrusions (Figure 1). A total of five new showings of copper oxide mineralization were found during the 2022 program. Previous surface sampling and drilling by Grizzly has yielded significant anomalous copper, gold, silver along with platinum and palladium. Numerous historical and new rock grab samples have yielded greater than 1% Cu, 1 g/t Au, 1 g/t Ag, 1 g/t Pt and 1 g/t Pd (Figure 1).
Figure 1: Sappho Rock Sampling Summary 2026 and IP Lines and Planned Drillhole Locations.
Historical 2010 drilling by the Company (4 core holes) yielded up to 0.31% Cu, 0.75 g/t Au, 0.34 g/t Pt, 0.39 g/t Pd and 6.57 g/t Ag over 6.5 m core length in skarn at Sappho (in hole 10SP03), including a 1 m core length intersections of 3.82 g/t Au and 199 g/t Ag, and in a separate sample 1.83 g/t Pt and 2.09 g/t Pd across 1 m – these results all are associated with >1% Cu in those samples. These higher grade zones were contained within a 63.5 m core length zone logged as a pyroxene – sulphide skarn with a grade approaching 0.7% copper equivalent derived from current metal prices for Cu, Au, Ag, Pt and Pd. Drillhole 10SP03 targeted a magnetic anomaly and had no indications of surface mineralization at the time of drilling. One of the new 2022 showings has been found proximal to drillhole 10SP03 and the targeted magnetic anomaly.
The Company is continuing with surface exploration in the Greenwood area. Crews from APEX completed trenching and rock sampling in June at the Midway Mine area, as well as some follow sampling at the Sappho Chargeability Target area. The 2026 exploration work is ongoing and includes prospecting and rock sampling at targets in the Motherlode area, the Rock Creek area, the Midway area, the Copper Mountain area, the Overlander-Attwood area and surrounding the Sappho (Figure 7). Additional groundwork including ground geophysical surveys are being planned and will comprise IP, magnetics and Loupe electromagnetics (EM) for the Sappho, the Midway and Motherlode areas (Figure 7). Drillhole and rock sampling results from the 2026 work are pending and will be released as they are received.
QUALIFIED PERSON STATEMENT The technical content of this news release and the Company’s technical disclosure has been reviewed and approved by Michael B. Dufresne, M. Sc., P. Geol., P.Geo., who is a non-independent Qualified Person as defined by National Instrument 43-101 Standards of Disclosure for Mineral Projects.
ABOUT GRIZZLY DISCOVERIES INC. Grizzly is a diversified Canadian mineral exploration company with its primary listing on the TSX Venture Exchange focused on developing its approximately 72,700 ha (approximately 180,000 acres) of precious and critical minerals properties in southeastern British Columbia. Grizzly is run by a highly experienced junior resource sector management team, who have a track record of advancing exploration projects from early exploration stage through to feasibility stage.
On behalf of the Board,
GRIZZLY DISCOVERIES INC. Brian Testo, CEO, President
Neither the TSX Venture Exchange nor its Regulation Services Provider (as that term is defined in the policies of the TSX Venture Exchange) accepts responsibility for the adequacy or accuracy of this release.
Caution concerning forward-looking information
This press release contains “forward-looking information” and “forward-looking statements” within the meaning of applicable securities laws. This information and statements address future activities, events, plans, developments and projections. All statements, other than statements of historical fact, constitute forward-looking statements or forward-looking information. Such forward-looking information and statements are frequently identified by words such as “may,” “will,” “should,” “anticipate,” “plan,” “expect,” “believe,” “estimate,” “intend” and similar terminology, and reflect assumptions, estimates, opinions and analysis made by management of Grizzly in light of its experience, current conditions, expectations of future developments and other factors which it believes to be reasonable and relevant. Forward-looking information and statements involve known and unknown risks and uncertainties that may cause Grizzly’s actual results, performance and achievements to differ materially from those expressed or implied by the forward-looking information and statements and accordingly, undue reliance should not be placed thereon.
Risks and uncertainties that may cause actual results to vary include but are not limited to the availability of financing; fluctuations in commodity prices; changes to and compliance with applicable laws and regulations, including environmental laws and obtaining requisite permits; political, economic and other risks; as well as other risks and uncertainties which are more fully described in our annual and quarterly Management’s Discussion and Analysis and in other filings made by us with Canadian securities regulatory authorities and available at www.sedarplus.ca. Grizzly disclaims any obligation to update or revise any forward-looking information or statements except as may be required by law.
AI security gateway delivering prompt injection protection, token cost reduction, and verified auditability through Constellation Digital Evidence
DALLAS, TX / ACCESS Newswire / July 8, 2026 / AIAI Holdings Corporation(NASDAQ:AIAI) (“Ai2” or the “Company”), an AI-enabled diversified holding company utilizing Transformational AI (TAI) to enhance portfolio performance, today announced that its portfolio company, Constellation Network has publicly launched Gate AI. Gate AI is a security layer that sits between an AI application and the model, protecting requests in real time. It works across most supported LLM providers, requires no changes to existing code, and is available to any developer in minutes. More information is available at constellationgate.ai.
“AI auditability is essential for both management and developers using AI in their organization and digital workflows,” said Ben Jorgensen, CEO, Constellation Network. “More importantly developers building with AI model providers manage tens, if not hundreds, of agents and have little to no protection against prompt injections because the tools designed to defend against these threats have largely only been accessible to organizations with enterprise-scale budgets. Gate AI becomes the auditability and security layer for AI allowing any organization and developer, regardless of size, to work with popular open source models as well as frontier model providers. By mitigating security threats Gate AI brings operational oversight to AI. We believe that every organization building with AI should have access to the protection needed to deploy AI systems with confidence.”
“Gate AI embodies the type of AI platform we believe will become essential for organizations as AI adoption continues to accelerate,” said Todd Furniss, Chief Executive Officer and Co-founder of AIAI Holdings Corporation. “Gate AI provides a unified security solution that protects AI workflows, reduces operating costs through intelligent token optimization, and remains model-provider agnostic. This launch demonstrates how AIAI’s strategy can produce commercial products that we can deploy across our portfolio and also have broad market applicability.”
THE SECURITY GAP IN AI DEVELOPMENT
AI development has moved fast. Security has not kept pace. Individual developers and small teams shipping AI-powered applications face the same threat landscape as large enterprises, including prompt injection attacks, data leakage through model outputs, and unauthorized access to sensitive information, but without access to the security tooling those enterprises can afford. Prompt injection, where a malicious input is crafted to override an AI agent’s instructions or extract data it should not share, is one of the most actively exploited vulnerabilities in deployed AI systems today. Most developers have no defense against it.
Gate AI was built to close this gap, starting with the developer community that builds most of the world’s AI applications.
SECURITY THAT WORKS ACROSS YOUR ENTIRE AI STACK
Gate AI integrates as a single line of code change, or in one click through Gate Connect, a desktop app for popular AI coding agents. Developers point their existing application at the Gate AI endpoint and AI requests are immediately protected, regardless of which model provider they use. There is no migration, no new SDK to learn, and no dependency on a single AI platform. Gate AI operates across most supported LLM providers, so teams are free to use the models that work best for them or connect to hundreds of models through Gate AI directly.
What Gate AI protects against at launch:
Prompt Injection: Detects and blocks attempts to hijack, override, or manipulate AI agent behavior through malicious inputs. Independently validated across 16 public benchmarks comprising 12,111 samples, with an F1 score of 97.4 percent at a strict 1 percent false-positive rate, matching or beating enterprise incumbents on the same public benchmarks. Full methodology is published at arXiv:2606.02959.
Token Cost Overruns: Lossless prompt compression reduces AI token usage by 20 percent or more per request with no change to output quality. For developers and small teams, this means lower infrastructure costs from day one.
Data and Credential Leakage: Scans AI outputs in real time for personally identifiable information, API keys, and credentials before they leave the pipeline.
Unverifiable AI Activity: Every AI decision is anchored to the Constellation Hypergraph via the Digital Evidence API. This creates a tamper-proof, on-chain record of what the AI did that any party can independently verify. There is no equivalent capability available at this price point in the market today.
BUILT FOR DEVELOPERS. ADOPTED BY THE ENTERPRISE.
The AI security market has historically been structured around enterprise procurement. Products are priced for large organizations, sold through lengthy sales cycles, and never reach the individual developer or small team making the architectural decisions that shape how AI gets deployed at scale. Gate AI inverts this model. It is priced and packaged for the developer first, with a free tier and a paid tier (priced per seat per month), both fully self-serve with no contract required.
The proposition is simple: developers who secure their AI workflows with Gate AI today, regardless of which coding agent or model provider they use, are the same people whose teams will standardize Gate AI as their organization’s scale. As AI adoption expands, Gate AI’s unified audit trail gives managers what they lack today: a single, verifiable view of usage and activity across every LLM provider. That bottom-up progression, from individual developer adoption to organization-wide standardization, is how durable infrastructure platforms are built.
A NEW STANDARD FOR AI SECURITY
The growth of AI agent deployment is creating a new attack surface at a pace regulators, enterprises, and developers are all working to understand. Gate AI is built around the premise that AI security is not a feature to be added later. It is infrastructure that should be present from the first request. The combination of real-time threat protection, token efficiency, and audit snapshots positions Gate AI as a foundation developers can build on today and that enterprises and regulators will increasingly recognize as a baseline requirement.
The launch of Gate AI represents another milestone in AIAI Holdings’ strategy of acquiring innovative technology companies and accelerating their commercial growth through operational support, strategic resources, and the Company’s Transformational AI framework. As enterprise AI adoption continues to accelerate, management believes AI security, governance, and verifiable auditability will become foundational requirements across regulated industries.
About Gate AI
Gate AI is a real-time security layer for AI applications built by Constellation Network. It provides prompt-injection defense, data leakage protection, token compression of 20 percent or more, and blockchain-verified audit trails anchored to Constellation’s Digital Evidence layer. Free to start at constellationgate.ai.
About AIAI Holdings Corporation
AIAI Holdings Corporation (Ai2) (NASDAQ:AIAI) is an AI-enabled diversified holding company that acquires and grows companies across multiple industries. We expect to drive revenue and earnings growth throughout our portfolio by applying exclusively licensed Transformational AI to enhance operational efficiency and financial performance.
Ai2 is building a next-generation model for technology-enabled business operations, which is expected to create sustainable value for shareholders through the strategic integration of artificial intelligence across diverse industries.
About Constellation Network
Constellation Network is a technology company developing products at the intersection of AI and blockchain. Its technology, including a native Layer 1 blockchain protocol, supports trusted data, verifiable provenance, and auditable flows for customers across retail intelligence, U.S. defense applications, AI security, and consumer applications. Constellation became part of the AIAI Holdings portfolio in May 2026 and continues to operate the Constellation Network protocol and ecosystem alongside the development of new commercial products including Constellation Gate AI and Arca Wallet, a self-custodial digital dollar wallet on iOS and Android featuring Arca Apps, a curated stablecoin marketplace of approved vendor partners. Learn more at https://constellationnetwork.io/.
This press release contains “forward-looking statements” or “forward-looking information” within the meaning of the Private Securities Litigation Reform Act of 1995, including statements regarding the plans, intentions, beliefs, and current expectations of the Company with respect to future business activities and plans of the Company. All statements contained in this press release that do not relate to matters of historical fact should be considered forward-looking statements, including without limitation statements regarding our expectations, intentions, beliefs, plans, objectives, goals, strategies, future events or performance, and underlying assumptions. Forward-looking statements are often identified by the use of words such as “may,” “will,” “expect,” “believe,” “anticipate,” “intend,” “would,” “could,” “should”, “estimate,” “plan,” “predict,” “project,” “estimate”, or “continue,” or similar expressions, including the negative of these terms or other comparable terminology.
Forward-looking statements are based on the Company’s current expectations regarding its strategy, plans, intentions, performance, or future occurrences or results, the information on which such expectations were based may change. These forward-looking statements rely on a number of assumptions concerning future events and are subject to a number of known and unknown risks, uncertainties, and other factors, many of which are outside of the Company’s control, that could cause actual results, performance, or achievements to materially differ from any future results, performance, or achievements expressed or implied by the forward-looking statements. Such risks, uncertainties and other factors include, but are not limited to our lack of operating history, our ability to attract new investments, our failure to manage growth effectively, our acquisition activities may pose risks that could harm our business, and our licensed AI may not perform up to the expected standards, as well as general business and economic conditions, competitive pressures, regulatory changes, technological developments, and other factors identified in the Company’s most recent filings with the U.S. Securities and Exchange Commission, including our Registration Statement on Form S-1, which are available for review at www.sec.gov. Furthermore, the Company operates in a competitive environment where new and unanticipated risks may arise. Accordingly, investors should not place any reliance on forward-looking statements as a prediction of actual results.
The forward-looking statements in this press release are based on information available to us as of the date hereof, and we disclaim any intention to, and, except as may be required by law, undertake no obligation to, update or revise forward-looking statements to reflect events or circumstances that subsequently occur or of which the Company hereafter become aware. These forward-looking statements should not be relied upon as representing our views as of any date subsequent to the date of this press release.