Categories
Base Metals Energy Junior Mining Metallic Group Stillwater Critical Minerals Uncategorized

Stillwater Critical Minerals Reports Wide and High-Grade Intervals of Platreef-Style Mineralization in Resource Expansion Drilling in the HGR Deposit Area at Stillwater West Project in Montana, USA

VANCOUVER, BC / ACCESSWIRE / July 7, 2022 / Stillwater Critical Minerals (formerly Group Ten Metals) (TSXV:PGE)(OTCQB:PGEZF)(FSE:5D32) (the “Company” or “SWCM”) today reports wide, high-grade intervals of nickel sulphide mineralization with palladium, platinum, rhodium, cobalt, copper and gold in a final tranche of first-pass drill results from the 14-hole resource expansion campaign completed at the Company’s flagship Stillwater West PGE-Ni-Cu-Co + Au project in Montana, USA. Additional rhodium results are pending.

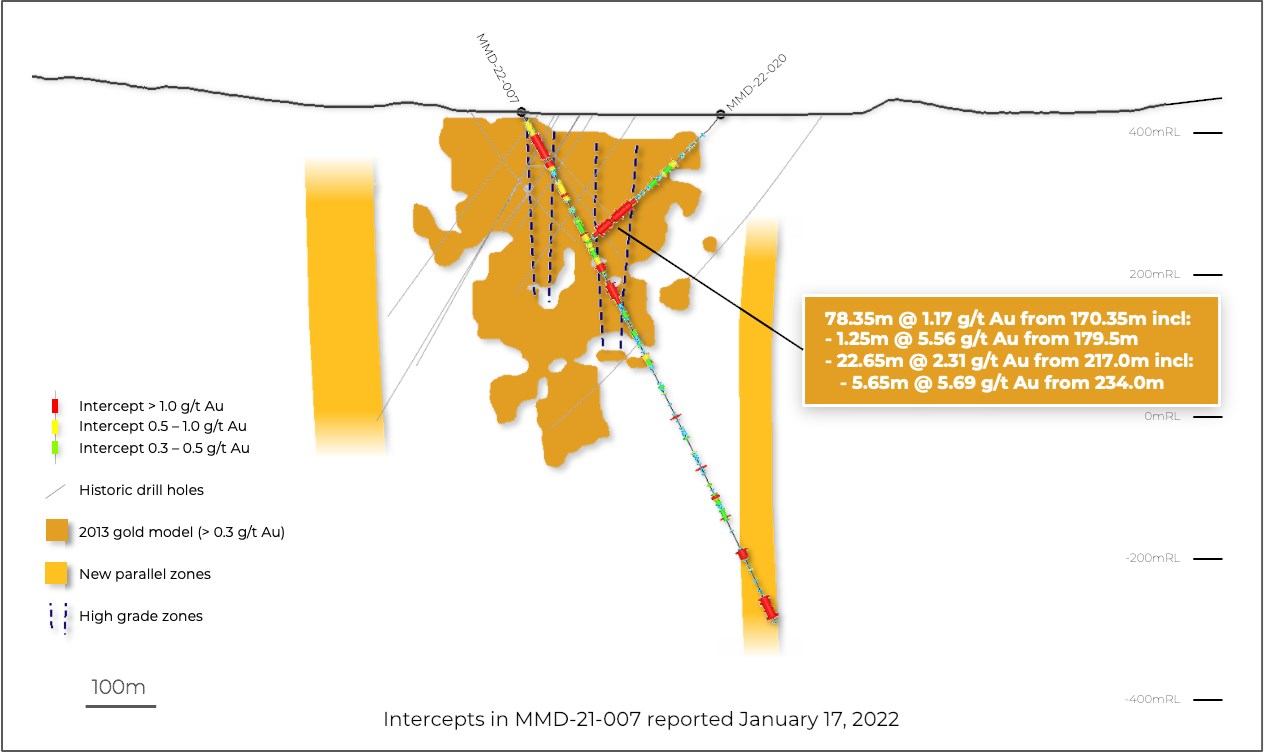
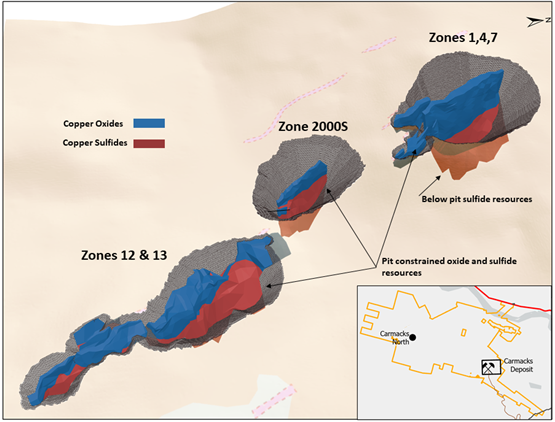
Results continue to support the Company’s priority objective of expanding the October 2021 inaugural mineral resource estimates with multiple wide and highly mineralized intervals returned in step-out drilling in six holes at the HGR deposit area at Iron Mountain (see Table 1 and Figure 1). Drilling in 2021 focused on resource expansion in three of the five deposit areas delineated by the 2021 estimates. Similar wide and well-mineralized intervals have now been reported from all three deposit areas as announced December 20, 2021, March 7, 2022, and May 3, 2022. Mineralization remains open to expansion along trend and at depth in all five deposit areas, which are set within 12 kilometers of the broader 32-kilometer-long land package in the lower Stillwater Igneous Complex (see Figure 2).

Highlights from six holes drilled in the HGR deposit area in 2021 include:

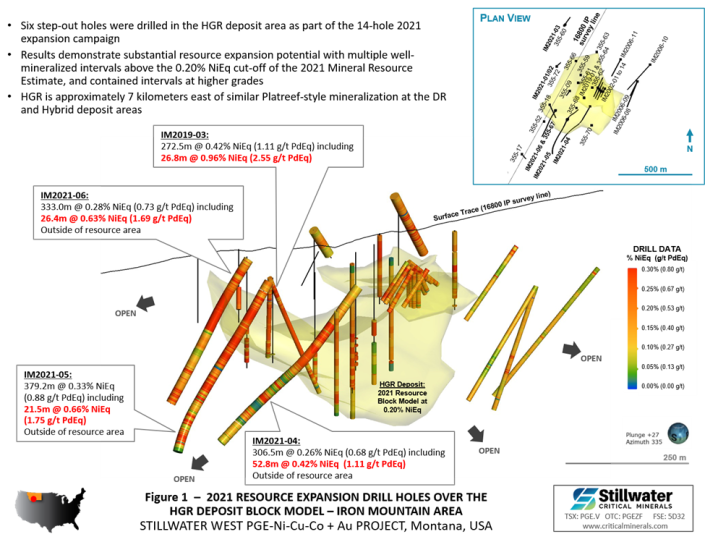
  • IM2021-05 returned379.2 meters of continuous battery and precious metal mineralization starting at surface and grading 0.33% Nickel Equivalent (“NiEq”), equal to 0.88 g/t Palladium Equivalent (“PdEq”), with successive contained higher-grade intervals including:
    • 133.2 meters of 0.38% NiEq (1.01 g/t PdEq);
    • 21.5 meters of 0.66% NiEq (1.75 g/t PdEq); and
    • 7.3 meters of 0.79% NiEq (2.11 g/t PdEq) as 0.45% Ni, 0.51 g/t Pd+Pt+Au+Rh (“4E”), 0.17% Cu and 0.026% Co .

IM2021-05 is the second most highly mineralized drill hole ever recorded in the Stillwater district with a grade-thickness value of 334 gram-meter PdEq, after CM2021-01 which returned 530 gram-meter PdEq.

  • IM2021-06 returned 94.0 meters of 0.48% NiEq (1.28 g/t PdEq) within333.0 meters of continuous mineralization grading 0.28% NiEq (0.73 g/t PdEq). Additional contained intervals at higher grades include 26.4 meters of 0.63% NiEq (1.69 g/t PdEq) and 4.8 meters of 1.38 g/t 4E which includes 0.077 g/t Rh .
  • IM2021-04 , partially reported on March 7, 2022, returned 115.0 meters of 0.38% NiEq (1.02 g/t PdEq) within 306.5 meters of continuous mineralization grading 0.26% NiEq (0.68g/t PdEq). Additional contained intervals at higher grades include:
    • 9.8 meters of high-grade PGE mineralization with 0.89% NiEq (2.38 g/t PdEq) as 1.54 g/t 4E including 1.02 g/t Pd, 0.39 g/t Pt, and 0.064 g/t Rh, along with base metal mineralization; and
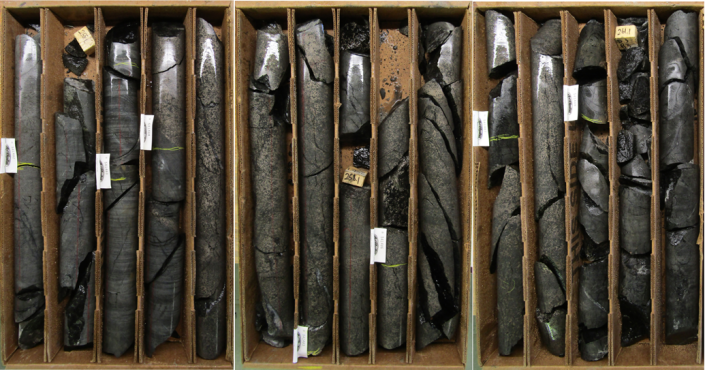
    • 4.8 meters of high-grade battery metal mineralization with 1.47% NiEq (3.91 g/t PdEq) as 0.74% Ni, 0.65% Cu, 0.070% Co, plus 0.30 g/t 4E including 0.055 g/t Rh (see photo below).
  • Drilling in the HGR deposit area in 2021 focused on step-out holes in the area of IM-2019-03 which returned 272.5 meters of 0.42% NiEq (1.11 g/t PdEq) including 26.8 meters of 0.96% NiEq (2.55 g/t PdEq) as 0.34% Ni, 0.15% Cu, 0.019% Co, 0.33 g/t Pt, 0.77 g/t Pd, 0.08 g/t Au, and 0.049 g/t Rh (see Figures 1 to 4).
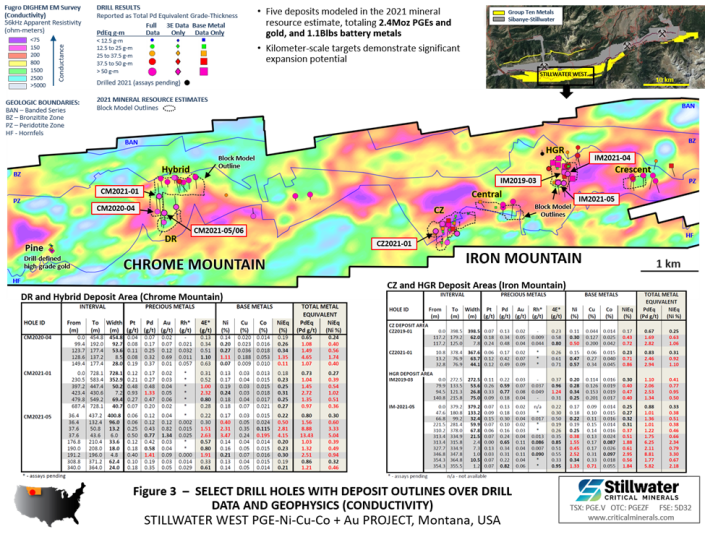
  • These results, alongside results released May 3 and March 7, 2022, and December 20, 2021, demonstrate significant potential to expand the October 2021 mineral resource estimates with multiple long intervals at grades well above the 0.20% NiEq cut-off grade used in that study (see bolded assay values on Table 1). Potential is also shown to expand existing resources at higher cut-off grades, such as 0.35% and 0.50% NiEq (red values and shaded rows, respectively, on Table 1). Moreover, as shown in Figures 1 to 4, these results provide important intercepts in step-out drill holes located up to several hundred meters from the resource estimate block models.
  • Results also continue to highlight the potential for significant co-product rhodium values at Stillwater West, with drill samples in Iron Mountain holes IM2021-04, -05, and -06 returning up to 0.365 g/t Rh within the mineralized horizons. At recent values, rhodium trades at more than 16 times the value of platinum and seven times the value of palladium on a spot price basis at over US$14,000 per ounce. Sibanye-Stillwater, adjacent to Stillwater Critical Minerals’ Stillwater West project, is the primary US producer. Supply constraints for rhodium have supported rising prices since 2017.
  • Complete first-pass assay results have now been reported from all 14 holes drilled in 2021. Additional rhodium assays are pending on mineralized intervals.
Stillwater Critical Minerals, Thursday, July 7, 2022, Press release picture

Dr. Danie Grobler, Stillwater Critical Minerals’ Vice-President of Exploration, commented “Stillwater West continues to demonstrate significant equivalence with the Platreef deposits of the northern Bushveld Complex. Albie Brits and I are actively applying our combined four decades of Platreef experience in our new roles at Stillwater Critical Minerals with a priority on updating the geologic model to support planning and refining of drill targets for the next phase of follow-on work. Our current focus is to define detailed stratigraphic and structural controls within the 2021 Inferred Resource areas. We are also in the process of reviewing and prioritizing higher-grade pegmatoidal pyroxenite targets within the Stillwater stratigraphy that have not been fully tested.”

Michael Rowley, President and CEO, commented, “Results from the Iron Mountain drill campaign continue to demonstrate the remarkable potential for expansion of our inaugural mineral resource with multiple wide intercepts of battery and precious metals and contained intervals at successive higher grades. In particular our success in targeting Platreef-style nickel sulphide mineralization in step-out holes in the area of IM2019-03 shows excellent potential for resource growth, similar to our success in the DR and Hybrid deposit areas over seven kilometers to the west. We continue to see confirmation of a large mineralized system with an impressive endowment of eight of the commodities listed as critical by the US government. We look forward to further updates on our planned resource expansion, exploration priorities for 2022, and other news in the near term.”

Table 1 – Highlight Results from the 2021 Expansion Drill Campaign at the HGR Deposit Area

Stillwater Critical Minerals, Thursday, July 7, 2022, Press release picture

Highlighted significant mineralized intercepts are presented above. Grade-thickness values cover significant mineralized intervals with total palladium and nickel equivalent grade-thickness determined by multiplying the thickness of continuous mineralization (in meters) by the palladium equivalent grade (in grams/tonne) to provide gram-meter values (g-m) or by multiplying the nickel equivalent grade (in percent) to provide percent-meter values as shown. Total nickel and palladium equivalent calculations reflect total gross metal content using long term metal prices (all USD): $7.00/lb nickel (Ni), $3.50/lb copper (Cu), $20.00/lb cobalt (Co), $1,000/oz platinum (Pt), $1,800/oz palladium (Pd), and $1,600/oz gold (Au). Equivalent values have not been adjusted to reflect metallurgical recoveries. Total metal equivalent values include both base and precious metals. Intervals are reported as drilled widths and are believed to be representative of the actual width of mineralization.

About Stillwater West

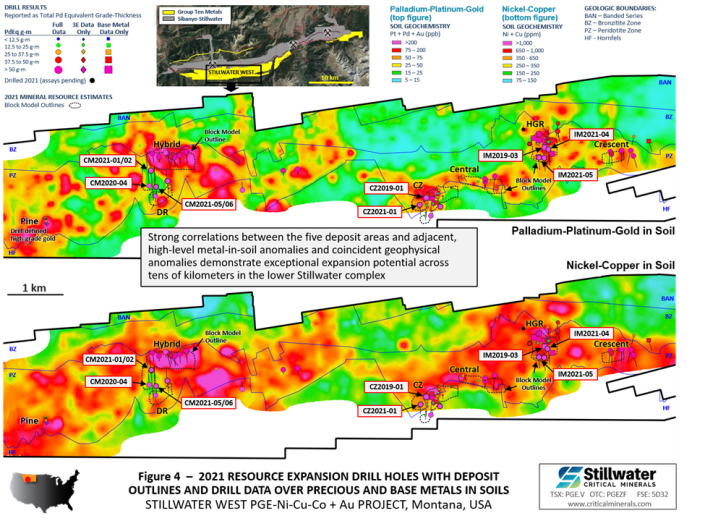
Stillwater Critical Minerals is rapidly advancing the Stillwater West PGE-Ni-Cu-Co + Au project towards becoming a world-class source of low-carbon, sulphide-hosted nickel, copper, and cobalt, critical to the electrification movement, as well as key catalytic metals including platinum, palladium and rhodium used in catalytic converters, fuel cells, and the production of green hydrogen. Stillwater West positions SWCM as the second-largest landholder in the Stillwater Complex, with a 100%-owned position adjoining and adjacent to Sibanye-Stillwater’s PGE mines in south-central Montana, USA 1 . The Stillwater Complex is recognized as one of the top regions in the world for PGE-Ni-Cu-Co mineralization, alongside the Bushveld Complex and Great Dyke in southern Africa, which are similar layered intrusions. The J-M Reef, and other PGE-enriched sulphide horizons in the Stillwater Complex, share many similarities with the highly prolific Merensky and UG2 Reefs in the Bushveld Complex. SWCM’s work in the lower Stillwater Complex has demonstrated the presence of large-scale disseminated and high-sulphide battery metals and PGE mineralization, similar to the Platreef in the Bushveld Complex 2 . Drill campaigns by the Company, complemented by a substantial historic drill database, have delineated five deposits of Platreef-style mineralization across a core 12-kilometer span of the project, all of which are open for expansion into adjacent targets. Multiple earlier-stage Platreef-style and reef-type targets are also being advanced across the remainder of the 32-kilometer length of the project based on strong correlations seen in soil and rock geochemistry, geophysical surveys, geologic mapping, and drilling.

About Stillwater Critical Minerals Corp.

Stillwater Critical Minerals (TSX.V: PGE | OTCQB: PGEZF) is a mineral exploration company focused on its flagship Stillwater West PGE-Ni-Cu-Co + Au project in the iconic and famously productive Stillwater mining district in Montana, USA. With the recent addition of two renowned Bushveld and Platreef geologists to the team, the Company is well positioned to advance the next phase of large-scale critical mineral supply from this world-class American district, building on past production of nickel, copper, and chromium, and the on-going production of platinum group and other metals by neighbouring Sibanye-Stillwater. The Platreef-style nickel and copper sulphide deposits at Stillwater West contain a compelling suite of critical minerals and are open for expansion along trend and at depth, with an updated NI 43-101 mineral resource update expected in 2022.

Stillwater Critical Minerals also holds the high-grade Black Lake-Drayton Gold project adjacent to Treasury Metals’ development-stage Goliath Gold Complex in northwest Ontario, which is currently under an earn-in agreement with an option to joint venture whereby Heritage Mining may earn up to a 90% interest in the project by completing payments and work on the project. The Company also holds the Kluane PGE-Ni-Cu-Co project on trend with Nickel Creek Platinum‘s Wellgreen deposit in Canada‘s Yukon Territory.

About the Metallic Group of Companies

The Metallic Group is a collaboration of leading precious and base metals exploration companies, with a portfolio of large, brownfield assets in established mining districts adjacent to some of the industry’s highest-grade producers of silver and gold, platinum and palladium, and copper. Member companies include Metallic Minerals in the Yukon’s high-grade Keno Hill silver district and La Plata silver-gold-copper district of Colorado, Granite Creek Copper in the Yukon’s Minto copper district, and Stillwater Critical Minerals in the Stillwater PGM-nickel-copper district of Montana. The founders and team members of the Metallic Group include highly successful explorationists formerly with some of the industry’s leading explorers/developers and major producers. With this expertise, the companies are undertaking a systematic approach to exploration using new models and technologies to facilitate discoveries in these proven, but under-explored, mining districts. The Metallic Group is headquartered in Vancouver, BC, Canada, and its member companies are listed on the Toronto Venture, US OTC, and Frankfurt stock exchanges.

Note 1: References to adjoining properties are for illustrative purposes only and are not necessarily indicative of the exploration potential, extent or nature of mineralization or potential future results of the Company’s projects.

Note 2: Magmatic Ore Deposits in Layered Intrusions-Descriptive Model for Reef-Type PGE and Contact-Type Cu-Ni-PGE Deposits, Michael Zientek, USGS Open-File Report 2012-1010.

FOR FURTHER INFORMATION, PLEASE CONTACT:

Michael Rowley, President, CEO & Director
Phone: (604) 357 4790
Toll Free: (888) 432 0075
Email: info@criticalminerals.com
Web: http://criticalminerals.com

Quality Control and Quality Assurance

2021 drill core samples were analyzed by ACT Labs in Vancouver, B.C. Sample preparation: crush (< 7 kg) up to 80% passing 2 mm, riffle split (250 g) and pulverize (mild steel) to 95% passing 105 µm included cleaner sand. Gold, platinum, and palladium were analyzed by fire assay (1C-OES) with ICP finish. Selected major and trace elements were analyzed by peroxide fusion with 8-Peroxide ICP-OES finish to insure complete dissolution of resistate minerals. Following industry QA/QC standards, blanks, duplicate samples, and certified standards were also assayed.

Mr. Mike Ostenson, P.Geo., is the qualified person for the purposes of National Instrument 43-101, and he has reviewed and approved the technical disclosure contained in this news release.

Forward-Looking Statements

Forward Looking Statements: This news release includes certain statements that may be deemed “forward-looking statements”. All statements in this release, other than statements of historical facts including, without limitation, statements regarding potential mineralization, historic production, estimation of mineral resources, the realization of mineral resource estimates, interpretation of prior exploration and potential exploration results, the timing and success of exploration activities generally, the timing and results of future resource estimates, permitting time lines, metal prices and currency exchange rates, availability of capital, government regulation of exploration operations, environmental risks, reclamation, title, and future plans and objectives of the company are forward-looking statements that involve various risks and uncertainties. Although Stillwater Critical Minerals believes the expectations expressed in such forward-looking statements are based on reasonable assumptions, such statements are not guarantees of future performance and actual results or developments may differ materially from those in the forward-looking statements. Forward-looking statements are based on a number of material factors and assumptions. Factors that could cause actual results to differ materially from those in forward-looking statements include failure to obtain necessary approvals, unsuccessful exploration results, changes in project parameters as plans continue to be refined, results of future resource estimates, future metal prices, availability of capital and financing on acceptable terms, general economic, market or business conditions, risks associated with regulatory changes, defects in title, availability of personnel, materials and equipment on a timely basis, accidents or equipment breakdowns, uninsured risks, delays in receiving government approvals, unanticipated environmental impacts on operations and costs to remedy same, and other exploration or other risks detailed herein and from time to time in the filings made by the companies with securities regulators. Readers are cautioned that mineral resources that are not mineral reserves do not have demonstrated economic viability. Mineral exploration and development of mines is an inherently risky business. Accordingly, the actual events may differ materially from those projected in the forward-looking statements. For more information on Stillwater Critical Minerals and the risks and challenges of their businesses, investors should review their annual filings that are available at www.sedar.com .

Neither the TSX Venture Exchange nor its Regulation Services Provider (as that term is defined in the policies of the TSX Venture Exchange) accepts responsibility for the adequacy or accuracy of this release.

Stillwater Critical Minerals, Thursday, July 7, 2022, Press release picture

SOURCE: Stillwater Critical Minerals

Categories
Base Metals Emx Royalty Energy Junior Mining Precious Metals Project Generators

EMX Repayment of US$7.85 Million Vendor Take Back Note

Vancouver, British Columbia–(Newsfile Corp. – July 6, 2022) – EMX Royalty Corporation (NYSE American: EMX) (TSXV: EMX; (FSE: 6E9) (the “Company” or “EMX”) is pleased to announce that it has repaid in full the US$7.85 million vendor take back note issued to SSR Mining Inc. (“SSR Mining“) on October 21, 2021 (see EMX news release dated October 21, 2021 (referred to therein as the “VTB Note“)).

To facilitate the acquisition of a portfolio of royalty interests and deferred payments from SSR Mining and certain of its subsidiaries (see EMX news release dated October 21, 2021), the Company borrowed US$7.85 million from SSR Mining pursuant to the VTB Note. The total repayment made by the Company under the VTB Note, including all principal and interest, was US$8.36 million.

About EMX. EMX is a precious, base and battery metals royalty company. EMX’s investors are provided with discovery, development, and commodity price optionality, while limiting exposure to risks inherent to operating companies. The Company’s common shares are listed on the NYSE American Exchange and TSX Venture Exchange under the symbol “EMX”, and also trade on the Frankfurt exchange under the symbol “6E9”. Please see www.EMXroyalty.com for more information.

For further information contact:

David M. Cole
President and CEO
Phone: (303) 973-8585
Dave@EMXroyalty.com

Scott Close
Director of Investor Relations
Phone: (303) 973-8585
SClose@EMXroyalty.com

Isabel Belger
Investor Relations (Europe)
Phone: +49 178 4909039
IBelger@EMXroyalty.com

Neither the TSX Venture Exchange nor its Regulation Services Provider (as that term is defined in policies of the TSX Venture Exchange) accepts responsibility for the adequacy or accuracy of this release

Forward-Looking Statements

This news release may contain “forward-looking statements” that reflect the Company’s current expectations and projections about its future results. These forward-looking statements may include statements regarding perceived merit of properties, exploration results and budgets, mineral reserves and resource estimates, work programs, capital expenditures, timelines, strategic plans, market prices for precious and base metal, or other statements that are not statements of fact. When used in this news release, words such as “estimate,” “intend,” “expect,” “anticipate,” “will”, “believe”, “potential” and similar expressions are intended to identify forward-looking statements, which, by their very nature, are not guarantees of the Company’s future operational or financial performance, and are subject to risks and uncertainties and other factors that could cause the Company’s actual results, performance, prospects or opportunities to differ materially from those expressed in, or implied by, these forward-looking statements. These risks, uncertainties and factors may include, but are not limited to unavailability of financing, failure to identify commercially viable mineral reserves, fluctuations in the market valuation for commodities, difficulties in obtaining required approvals for the development of a mineral project, increased regulatory compliance costs, expectations of project funding by joint venture partners and other factors.

Readers are cautioned not to place undue reliance on these forward-looking statements, which speak only as of the date of this news release or as of the date otherwise specifically indicated herein. Due to risks and uncertainties, including the risks and uncertainties identified in this news release, and other risk factors and forward-looking statements listed in the Company’s MD&A for the quarter ended March 31, 2022 (the “MD&A”), and the most recently filed Annual Information Form (“AIF”) for the year ended December 31, 2021, actual events may differ materially from current expectations. More information about the Company, including the MD&A, the AIF and financial statements of the Company, is available on SEDAR at www.sedar.com and on the SEC’s EDGAR website at www.sec.gov.

Categories
Gold Shore Resources Junior Mining Precious Metals

Goldshore Resources Drills 78.35m at 1.17 g/t Au and Delineates Higher Grade Lenses Within Moss Lake Deposit

Goldshore Resources, Proven and Probable

Vancouver, British Columbia–(Newsfile Corp. – June 29, 2022) –  Goldshore Resources Inc. (TSXV: GSHR) (OTCQB: GSHRF) (FSE: 8X00) (“Goldshore” or the “Company“), is pleased to announce assay results from its ongoing 100,000-meter drill program at the Moss Lake Project in Northwest Ontario, Canada. Drilling is aiming to better define and expand high-grade structural zones within the Moss Lake deposit to improve the overall grade and volume beyond that of the historic mineral resource.

Highlights:

  • Four shallow holes drilled during the winter ice program have confirmed high-grade gold mineralization within shears hosted by altered diorite with best intercepts of:
  • 78.35m @ 1.17 g/t Au from 170.35m depth in MMD-22-020, including
    • 22.65m @ 2.31 g/t Au from 217.0m, including
    • 5.65m @ 5.69 g/t Au from 234.0m
  • 24.7m @ 1.28 g/t Au from 105.3m depth in MMD-22-017, including
    • 2.75m @ 7.80 g/t Au from 106.9m
  • 24.65m @ 1.05 g/t Au from 81.2m depth in MMD-22-016, including
    • 2.0m @ 7.95 g/t Au from 103.0m
  • 12.0m @ 1.41 g/t Au from 127.0m

President and CEO Brett Richards stated: “We are excited to continue to deliver consistent drilling results supporting our belief from the beginning of our 100,000m drill program, that Moss Lake is much larger in depth, width and along strike, to the historical mineral resource. I am very encouraged about the high grade sections we are seeing, as this will provide a lot of optionality when we model the resource later in the year and start to look at economic pit shells. We see several PEA permutations, including a smaller, higher grade starting project (Phase 1) followed by a larger scale operation formulated on the global resource (Phase 2). Given the current economic climate, a lower CapEx project (Phase 1) expanding to the larger operation (Phase 2) may well be the best approach to developing Moss Lake, while not losing sight of the larger Tier One potential. We will make these determinations later in the year, as we continue to evaluate the results from our 100,000m program.

Technical Overview

Table 1 shows the significant intercepts calculated from recently received drill hole results. Figure 1 shows a typical cross section through MMD-22-020. Table 2 and Figure 2 show the drill hole locations.

Table 1: Significant downhole gold intercepts

HOLE IDFROMTOLENGTH (m)TRUE WIDTH (m)CUT GRADE
(g/t Au)
UNCUT GRADE
(g/t Au)
MMD-22-01655.0069.8514.859.70.710.71
including65.0069.854.853.21.291.29
81.20105.8524.6516.21.051.05
including81.2086.004.803.11.421.42
and103.00105.002.001.37.957.95
121.00240.00119.0078.10.530.53
including127.00139.0012.007.91.411.41
and184.60187.002.401.63.933.93
MMD-22-01749.2058.008.805.80.480.48
70.2092.0021.8014.60.440.44
105.30130.0024.7016.51.281.28
including106.90109.652.751.87.807.80
MMD-22-02092.65118.3525.7018.50.450.45
129.85142.5012.659.30.490.49
170.35248.7078.3559.11.171.17
including179.50180.751.250.95.565.56
and198.00202.004.003.02.092.09
and217.00239.6522.6517.12.312.31
including220.65221.000.350.320.720.7
and234.00239.655.654.35.695.69
MMD-22-02185.0099.5014.509.50.630.63
including96.0099.503.502.31.931.93
115.25119.003.752.50.410.41
142.35153.1010.757.20.370.37
164.00169.005.003.30.300.30
171.00177.006.004.10.320.32
including184.30189.655.353.61.111.11
184.30251.0066.7046.30.490.49
including218.60224.005.403.81.201.20
Intersections calculated above a 0.3 g/t Au cut off with a top cut of 30 g/t Au and a maximum internal waste interval of 10 metres. Shaded intervals are intersections calculated above a 1.0 g/t Au cut off. Intervals in bold are those with a grade thickness factor exceeding 20 gram x metres / tonne gold. True widths are approximate and assume a subvertical body. The fact that cut and uncut assays are the same, shows that all samples assayed less than the 30 g/t Au top cut.


Figure 1: Drill section through MMD-22-020 showing mineralized intercepts relative to the 2013 grade model, the newly defined parallel zones and high grade structures within the model

To view an enhanced version of Figure 1, please visit:
https://orders.newsfilecorp.com/files/8051/129404_9c21e1dd647f5bc4_002full.jpg


Figure 2: Drill plan showing the drill holes relative to the 2013 resource model and the new parallel zones

To view an enhanced version of Figure 2, please visit:
https://orders.newsfilecorp.com/files/8051/129404_9c21e1dd647f5bc4_003full.jpg

Table 2: Location of drill holes in this press release

HOLEEASTNORTHRLAZIMUTHDIPEOH
MMD-22-0166688745378962426335°-50°245.0m
MMD-22-0276689655379004426335°-50°130.0m
MMD-22-0206690715378898426335°-55°251.0m
MMD-22-0216689805378856426335°-55°251.0m
Approximate collar coordinates in NAD 83, Zone 15N

Four shallow drill holes were completed over ice this past winter. They were drilled to help define the resource in the upper levels of the deposit. This includes localized high grade structural zones – 2.0m @ 7.95 g/t Au, 2.75m @ 7.80 g/t Au, and 5.65m @ 5.69 g/t Au – that are common in the Main and QES Zones.

Pete Flindell, VP Exploration for Goldshore, said “Our drilling program continues to confirm that the large volume of low grade gold mineralization is plumbed by anastomosing high grade shears. These high grade zones are not reflected in the historic (2013) Mineral Resource and will be a focus of our resource update intended to be released at the end of 2022. Accurate modelling of the high grade zones will significantly improve the economics of the Moss Project. Drilling is also continuing to better define these zones within the known extents of the deposit and in parallel zones that will add to the overall tonnage.”

Analytical and QA/QC Procedures

All samples were sent to ALS Geochemistry in Thunder Bay for preparation and analysis was performed in the ALS Vancouver analytical facility. ALS is accredited by the Standards Council of Canada (SCC) for the Accreditation of Mineral Analysis Testing Laboratories and CAN-P-4E ISO/IEC 17025. Samples were analyzed for gold via fire assay with an AA finish (“Au-AA23”) and 48 pathfinder elements via ICP-MS after four-acid digestion (“ME-MS61”). Samples that assayed over 10 ppm Au were re-run via fire assay with a gravimetric finish (“Au-GRA21”).

In addition to ALS quality assurance / quality control (“QA/QC”) protocols, Goldshore has implemented a quality control program for all samples collected through the drilling program. The quality control program was designed by a qualified and independent third party, with a focus on the quality of analytical results for gold. Analytical results are received, imported to our secure on-line database and evaluated to meet our established guidelines to ensure that all sample batches pass industry best practice for analytical quality control. Certified reference materials are considered acceptable if values returned are within three standard deviations of the certified value reported by the manufacture of the material. In addition to the certified reference material, certified blank material is included in the sample stream to monitor contamination during sample preparation. Blank material results are assessed based on the returned gold result being less than ten times the quoted lower detection limit of the analytical method. The results of the on-going analytical quality control program are evaluated and reported to Goldshore by Orix Geoscience Inc.

About Goldshore

Goldshore is an emerging junior gold development company, and owns the Moss Lake Gold Project located in Ontario. Wesdome is currently a strategic shareholder of Goldshore with an approximate 27% equity position in the Company. Well-financed and supported by an industry-leading management group, board of directors and advisory board, Goldshore is positioned to advance the Moss Lake Gold Project through the next stages of exploration and development.

About the Moss Lake Gold Project

The Moss Lake Gold Project is located approximately 100 km west of the city of Thunder Bay, Ontario. It is accessed via Highway 11 which passes within 1 km of the property boundary to the north. The Moss Lake Gold Project covers 14,292 hectares and consists of 282 unpatented and patented mining claims.

Moss Lake hosts a number of gold and base metal rich deposits including the Moss Lake Deposit, the East Coldstream Deposit (Table 3), the historically producing North Coldstream Mine (Table 4), and the Hamlin Zone, all of which occur over a mineralized trend exceeding 20 km in length. A historical preliminary economic assessment was completed on Moss Lake in 2013 and published by Moss Lake Gold1. A historical mineral resource estimate was completed on the East Coldstream Deposit in 2011 by Foundation Resources Inc2,3. In addition to these zones, the Moss Lake Gold Project also hosts a number of under-explored mineral occurrences which are reported to exist both at surface and in historically drilled holes. The Moss Lake Deposit is a shear-hosted disseminated-style gold deposit which outcrops at surface. It has been drilled over a 2.5 km length and to depths of 300 m with 376 holes completed between 1983 and 2017. The last drilling program conducted in 2016 and 2017 by Wesdome, which consisted of widely spaced holes along the strike extension of the deposit was successful in expanding the mineralized footprint and hydrothermal system 1.6 km to the northeast. Additionally, the deposit remains largely open to depth. In 2017, Wesdome completed an induced polarization survey which traced the potential extensions of pyrite mineralization associated with the Moss Lake Deposit over a total strike length of 8 km and spanning the entire extent of the survey grids.

The East Coldstream Deposit is a shear-hosted disseminated-style gold deposit which locally outcrops at surface. It has been drilled over a 1.3 km length and to depths of 200 m with 138 holes completed between 1988 and 2017. The deposit remains largely open at depth and may have the potential for expansion along strike. Historic drill hole highlights from the East Coldstream Deposit include 4.86 g/t Au over 27.3 m in C-10-15.

The historically producing North Coldstream Mine is reported to have produced significant amounts of copper, gold and silver4 from mineralization with potential iron-oxide-copper-gold deposit style affinity. The exploration potential immediately surrounding the historic mining area is not currently well understood and historic data compilation is required.

The Hamlin Zone is a significant occurrence of copper and gold mineralization, and also of potential iron-oxide-copper-gold deposit style affinity. Between 2008 and 2011, Glencore tested Hamlin with 24 drill holes which successfully outlined a broad and intermittently mineralized zone over a strike length of 900 m. Historic drill hole highlights from the Hamlin Zone include 0.9 g/t Au and 0.35% Cu over 150.7 m in HAM-11-75.

The Moss Lake, East Coldstream and North Coldstream deposits sit on a mineral trend marked by a regionally significant deformation zone locally referred to as the Wawiag Fault Zone in the area of the Moss Lake Deposit. This deformation zone occurs over a length of approximately 20 km on the Moss Lake Gold Project and there is an area spanning approximately 7 km between the Moss Lake and East Coldstream deposits that is significantly underexplored.

Table 3: Historical Mineral Resources1,2,3

INDICATEDINFERRED
DepositTonnesAu g/tAu ozTonnesAu g/tAu oz
Moss Lake Deposit1 (2013 resource estimate)
Open Pit Potential39,795,0001.11,377,30048,904,0001.01,616,300
Underground Potential1,461,1002.9135,400
Moss Lake Total39,795,0001.11,377,30050,364,0001.11,751,600
East Coldstream Deposit2 (2011 resource estimate)
East Coldstream Total3,516,7000.8596,40030,533,0000.78763,276
Combined Total43,311,7001.081,473,70080,897,0000.982,514,876

Notes:

(1) Source: Poirier, S., Patrick, G.A., Richard, P.L., and Palich, J., 2013. Technical Report and Preliminary Economic Assessment for the Moss Lake Project, 43-101 technical report prepared for Moss Lake Gold Mines Ltd. Moss Lake Deposit resource estimate is based on 0.5 g/t Au cut-off grade for open pit and 2.0 g/t Au cut-off grade for underground resources.

(2) Source: McCracken, T., 2011. Technical Report and Resource Estimate on the Osmani Gold Deposit, Coldstream Property, Northwestern Ontario, 43-101 technical report prepared for Foundation Resources Inc. and Alto Ventures Ltd. East Coldstream Deposit resource estimate is based on a 0.4 g/t Au cut-off grade.

(3) The reader is cautioned that the above referenced “historical mineral resource” estimates are considered historical in nature and as such is based on prior data and reports prepared by previous property owners. A qualified person has not done sufficient work to classify the historical estimates as current resources and Goldshore is not treating the historical estimates as current resources. Significant data compilation, re-drilling, re-sampling and data verification may be required by a qualified person before the historical estimate on the Moss Lake Gold Project can be classified as a current resource. There can be no assurance that any of the historical mineral resources, in whole or in part, will ever become economically viable. In addition, mineral resources are not mineral reserves and do not have demonstrated economic viability. Even if classified as a current resource, there is no certainty as to whether further exploration will result in any inferred mineral resources being upgraded to an indicated or measured mineral resource category.

Table 4: Reported Historical Production from the North Coldstream Deposit4

DepositTonnesCu %Au g/tAgCu lbsAu ozAg oz
Historical Production2,700,00001.890.565.59102,000,00044,000440,000

Note::

(4) Source: Schlanka, R., 1969. Copper, Nickel, Lead and Zinc Deposits of Ontario, Mineral Resources Circular No. 12, Ontario Geological Survey, pp. 314-316.

Peter Flindell, MAusIMM, MAIG, Vice President – Exploration of the Company, a qualified person under NI 43-101 has approved the scientific and technical information contained in this news release.

Neither the TSXV nor its Regulation Services Provider (as that term is defined in the policies of the TSXV) accepts responsibility for the adequacy or accuracy of this release.

For More Information – Please Contact:

Brett A. Richards
President, Chief Executive Officer and Director
Goldshore Resources Inc.

P. +1 604 288 4416 M. +1 905 449 1500
E. brichards@goldshoreresources.com
W. www.goldshoreresources.com

Facebook: GoldShoreRes | Twitter: GoldShoreRes | LinkedIn: goldshoreres

Cautionary Note Regarding Forward-Looking Statements

This news release contains statements that constitute “forward-looking statements.” Such forward looking statements involve known and unknown risks, uncertainties and other factors that may cause the Company’s actual results, performance or achievements, or developments to differ materially from the anticipated results, performance or achievements expressed or implied by such forward-looking statements. Forward looking statements are statements that are not historical facts and are generally, but not always, identified by the words “expects,” “plans,” “anticipates,” “believes,” “intends,” “estimates,” “projects,” “potential” and similar expressions, or that events or conditions “will,” “would,” “may,” “could” or “should” occur.

Forward-looking statements in this news release include, among others, statements relating to expectations regarding the exploration and development of the Moss Lake Gold Project, an update to the historical resource at the Moss Lake Gold Project, and other statements that are not historical facts. By their nature, forward-looking statements involve known and unknown risks, uncertainties and other factors which may cause our actual results, performance or achievements, or other future events, to be materially different from any future results, performance or achievements expressed or implied by such forward-looking statements. Such factors and risks include, among others: the Company may require additional financing from time to time in order to continue its operations which may not be available when needed or on acceptable terms and conditions acceptable; compliance with extensive government regulation; domestic and foreign laws and regulations could adversely affect the Company’s business and results of operations; the stock markets have experienced volatility that often has been unrelated to the performance of companies and these fluctuations may adversely affect the price of the Company’s securities, regardless of its operating performance; and the impact of COVID-19.

The forward-looking information contained in this news release represents the expectations of the Company as of the date of this news release and, accordingly, is subject to change after such date. Readers should not place undue importance on forward-looking information and should not rely upon this information as of any other date. The Company undertakes no obligation to update these forward-looking statements in the event that management’s beliefs, estimates or opinions, or other factors, should change.

This news release does not constitute an offer to sell, or a solicitation of an offer to buy, any securities in the United States. The securities have not been and will not be registered under the United States Securities Act of 1933, as amended (the “U.S. Securities Act”) or any state securities laws and may not be offered or sold within the United States or to U.S. Persons unless registered under the U.S. Securities Act and applicable state securities laws or an exemption from such registration is available.

Categories
Energy Junior Mining Precious Metals

Eloro Resources Files Updated 43-101 Technical Report on Iska Iska Project

Eloro Resources Ltd.

Eloro Resources Also Announces Filing of Final Base Shelf Prospectus

TORONTO, May 11, 2022 (GLOBE NEWSWIRE) — Eloro Resources Ltd. (the “Company” or “Eloro”) (TSX-V: ELO; OTCQX: ELRRF; FSE: P2QM) is pleased to announce that it has filed on SEDAR an updated technical report (“Technical Report”) on the Company’s Iska Iska silver-tin polymetallic project, prepared by Micon International Limited (“Micon”) and in accordance with National Instrument 43-101.

Eloro also announces that it has filed a final short form base shelf prospectus with the securities regulatory authorities in each of the provinces of Canada except Québec.

Updated NI 43-101 Technical Report

The Technical Report supports the interpretation of the drilling and other exploration results thus far, and details Eloro’s next exploration phase leading to the estimation of mineral resources. Micon’s conclusions in the Technical Report include the following:https://embed.fireplace.yahoo.com/embed?ctrl=Monalixa&m_id=monalixa&m_mode=document&site=sports&os=android&pageContext=%257B%2522ctopid%2522%253A%25221542500%253B1577000%2522%252C%2522hashtag%2522%253A%25221542500%253B1577000%2522%252C%2522wiki_topics%2522%253A%2522Technical_report%253BNational_Instrument_43-101%253BCanadian_Securities_Administrators%253BHelorus%253BInternational_Sport_Karate_Association%253BCompany%2522%252C%2522lmsid%2522%253A%2522a0770000002m0AbAAI%2522%252C%2522revsp%2522%253A%2522globenewswire.com%2522%252C%2522lpstaid%2522%253A%2522bfb4f0a9-3ea8-34cb-a445-59cd20f5f3d0%2522%252C%2522pageContentType%2522%253A%2522story%2522%257D

  • The potential of the Iska Iska Project is unquestionable in terms of its regional geological setting. It is in the midst of a proven metallogenic district with well-established world-class mines such as Cerro Rico de Potosi, Chorolque, and San Vicente. The fact that nearby mines of the Bolivian polymetallic type are operating profitably, is positive for the current drill definition and metallurgical investigations at Iska Iska.
  • Proximity of the deposit to surface offers an opportunity/potential for both open pit and underground exploitation, especially in the Santa Barbara – Huayra Kasa area.
  • Geological mapping, geophysical surveys, and diamond drilling have revealed a potentially large deposit of significance but yet to be converted into a resource. So far, the mineralization/deposit is isotropic, lacking any preferred alignment; this is corroborated by variography and downhole IP surveys.
  • All holes drilled across the project to date display intervals of alteration and significant mineralization, and the limits of the system have not yet been delineated. The deposit is wide open for expansion in all directions.
  • The “epicentre” of mineralization appears to be in the Santa Barbara adit area, where the highest grades and widest widths have been encountered to date. Therefore, resource development and expansion should radiate outwards from here.

In making recommendations in the Technical Report, Micon states: Eloro’s nearer term objective is a maiden mineral resource estimate within this large target area. This work is advancing well with the initial mineral resource targeted to be completed in Q3 2022. Exploration drilling is also planned on other major targets in the Iska Iska Caldera Complex including the Porco and Mina 2 areas. Accordingly, Micon recommends a two-pronged approach for Eloro to achieve its objectives, namely an initial phase of geophysics and additional delineation drilling followed by a second phase of resource expansion and preliminary economic assessment.

Final Base Shelf Prospectus

The base shelf prospectus filed by Eloro will allow Eloro to qualify the distribution by way of prospectus of up to C$100 million, in aggregate, of common shares, warrants and units, or any combination thereof, from time to time during the 25-month period during which the base shelf prospectus is effective. The specific terms of any future offering will be established in a prospectus supplement to the base shelf prospectus, which supplement will be filed with the applicable Canadian securities regulatory authorities in connection with any such offering.

Eloro has filed the base shelf prospectus to provide the Company with greater financial flexibility going forward but has not entered into any agreements or arrangements to authorize or offer any securities of the Company at this time.

A copy of the final short form base shelf prospectus is available under Eloro’s profile on SEDAR at www.sedar.com.

This press release shall not constitute an offer to sell or the solicitation of an offer to buy, nor shall there be any sale of, any securities of the Company in any jurisdiction in which such offer, solicitation or sale would be unlawful.

Qualified Person

Dr. Bill Pearson, P.Geo., Eloro’s Executive Vice President Exploration and a Qualified Person as such term is defined in National Instrument 43-101, has reviewed and approved the technical content of this news release.

About Eloro Resources Ltd.

Eloro is an exploration and mine development company with a portfolio of gold and base-metal properties in Bolivia, Peru and Quebec. Eloro has an option to acquire a 99% interest in the highly prospective Iska Iska Property, which can be classified as a polymetallic epithermal-porphyry complex, a significant mineral deposit type in the Potosi Department, in southern Bolivia. A NI 43-101 Technical Report on Iska Iska, which was completed by Micon International Limited, is available on Eloro’s website and under its filings on SEDAR. Iska Iska is a road-accessible, royalty-free property. Eloro also owns an 82% interest in the La Victoria Gold/Silver Project, located in the North-Central Mineral Belt of Peru some 50 km south of Barrick’s Lagunas Norte Gold Mine and Pan American Silver’s La Arena Gold Mine. La Victoria consists of eight mining concessions and eight mining claims encompassing approximately 89 square kilometres. La Victoria has good infrastructure with access to road, water and electricity and is located at an altitude that ranges from 3,150 m to 4,400 m above sea level.

For further information please contact either Thomas G. Larsen, Chairman and CEO or Jorge Estepa, Vice-President at (416) 868-9168.

Information in this news release may contain forward-looking information. Statements containing forward-looking information express, as at the date of this news release, the Company’s plans, estimates, forecasts, projections, expectations, or beliefs as to future events or results and are believed to be reasonable based on information currently available to the Company (forward-looking statements in this news release include, without limitation, statements regarding an initial mineral resource estimate for the Iska Iska project and regarding future financings, if any, pursuant to the short form base shelf prospectus referred to in this news release). There can be no assurance that forward-looking statements will prove to be accurate. Actual results and future events could differ materially from those anticipated in such statements. Readers should not place undue reliance on forward-looking information.

Neither the TSX Venture Exchange nor its Regulation Services Provider (as that term is defined in the policies of the TSX Venture Exchange) accepts responsibility for the adequacy or accuracy of this release.

Categories
Base Metals Energy Granite Creek Copper Junior Mining Metallic Group Precious Metals

Granite Creek Copper Retains SGS Canada for Updated Preliminary Economic Assessment on High-Grade Carmacks Copper-Gold-Silver Project in Yukon Canada

VANCOUVER, BC / ACCESSWIRE / May 3, 2022 / Granite Creek Copper Ltd. (TSXV:GCX)(OTCQB:GCXXF) (“Granite Creek” or the “Company“) is pleased to announce that it has retained SGS to complete an updated Preliminary Economic Assessment (“PEA”) on the Carmacks project. The PEA will use the 2022 Resource Estimate (Table 1), consisting of 36.2 million tonnes (Mt) in Measured and Indicated categories (M&I), grading 1.07% CuEq (0.81% Cu, 0.26g/t Au, 3.23g/t Ag and 0.011% Mo) for a total of 651 million pounds (Mlbs) of contained M&I copper and an additional 38 Mlbs Cu Inferred as the main input. Building off a 2017 PEA(1), the updated study will encompass the following:

  • Significant Increase in Contained Copper – The 2022 resource estimate marked a 43% increase in contained copper over the previous estimate referenced(2)
  • Inclusion of Sulphide Processing – As of the publication of the 2022 resource estimate the Carmacks project consists of roughly 50/50 sulfide and oxide resources by contained metal. The Company sees the inclusion of sulphide resources as a significant potential value driver having a positive impact on the economics of the project; and
  • High Proportion of Resources Modeled in Three Conceptual Open Pits – 96% of the 2022 resources are contained within the conceptual pits (Figure 1). With a high percentage of current resources reporting in conceptual pits the cash cost per pound of copper is expected to be significantly lower when compared to a similar sized underground operation.

Timothy Johnson, Granite Creek President & CEO, stated, “The launch of the updated Preliminary Economic Assessment study marks a major milestone in the development of the Carmacks deposit at a time when commodities demand is seeing rapid growth. The Carmacks project is well-positioned by its location, access to infrastructure, and proximity to the operating, high-grade Minto mine just to the north. Both copper and molybdenum have been deemed by the Canadian government to be ‘critical minerals‘ based on their role in the transition to a low-carbon economy which we expect will provide prolonged price strength well into the future. We look forward to continuing to bring positive news as we develop this high-grade copper project.”

Upcoming Events

OTC Markets Mining and Metals Virtual Conference – Tim Johnson, President & CEO, will present live at VirtualInvestorConferences.com on May 5th, 2022 at 10am PT | 1pm ET. To register, click here.

Vancouver Resource Investment Conference – Granite Creek Copper will join fellow members of the Metallic Group of Companies at the 2022 VRIC event at the Vancouver Convention Centre on May 17-18. Visit us in Booth 111.

2022 Technical Report Filing

Granite Creek also announces that further to its news release dated March 15, 2022 it has filed on SEDAR a National Instrument 43-101 technical report (the “Technical Report”) for the Carmacks project, located in the Yukon, Canada.

The report, entitled “Technical Report on the Updated Mineral Resource Estimates for the Carmacks Cu-Au-Ag Project Near Carmacks, Yukon, Canada”, has an effective date of February 25, 2022. The Technical Report was authored Allan Armitage Ph.D., P.Geo of SGS Geological Services(“SGS”) an independent Qualified Person and was prepared in accordance with National Instrument 43-101 Standards of Disclosure for Mineral Projects.

The Technical Report is available under the Company’s profile at www.sedar.com and will also be available on the Company’s website at www.gcxcopper.com.

Table 1 – 2022 Carmacks Copper Project Mineral Resources

Granite Creek Copper Ltd., Tuesday, May 3, 2022, Press release picture

Cu=copper, Au=gold, Mo=molybdenum, Ag=silver, Mt=millions of tonnes, Mlbs=millions of pounds, klbs=thousands of pounds, koz=thousands of ounces. Mineral Resources are reported using the 2014 CIM Definition Standards. Mineral Resources are reported within a conceptual constraining pit shell that includes the following input parameters: Metal prices of $3.60/lb Cu, $1,750/Au, $22/oz Ag, $14/lb Mo and pit slope angles that vary from 35° for overburden to 55°for granodiorite host. Metal prices are in US$. Metallurgical recoveries reflective of prior test work that averages: 85% Cu, 85% Au, 65% Ag in the oxide domain and 90% Cu, 76% Au, 65% Ag in the sulphide domain. Mo recovery is assumed to be 70% in both oxide and sulphide domain. Tonnes are metric tonnes, with Cu and Mo grades as percentages and Au and Ag grades as gram per tonne units. Cu and Mo metal content is reported in lb and Au and Ag content is reported in troy oz. Totals and Metal content may not sum due to rounding and significant digits used in calculations. Cu Eq calculation is based on 100% recovery of all metals using the same metal prices used in the resource calculation: $3.60/lb Cu, $1,750/Au, $22/oz Ag, $14/lb Mo.

Figure 1 – Oblique view of 2022 resources and proposed pits (total strike length of 2,950 m)

Granite Creek Copper Ltd., Tuesday, May 3, 2022, Press release picture

Qualified Persons

The Carmacks project 2022 Resource Estimate was prepared by Allan Armitage, P.Geo., of SGS Geological Services, an independent Qualified Person, in accordance with the guidelines of the Canadian Securities Administrators’ National Instrument 43-101 – Standards of Disclosure for Mineral Projects (“NI 43-101”) with an effective date of February 25, 2022. Armitage conducted a site visit to the property on November 9, 2021.

Ms. Debbie James, P.Geo., a qualified person for the purposes of National Instrument 43-101, has reviewed and approved the technical disclosure not pertaining to the resource estimate contained in this news release. Ms. James is a Senior Geologist with TruePoint Exploration and a Project Manager at Carmacks.

1PEA: “NI 43-101 Preliminary Economic Assessment Technical Report on the Carmacks Project, Yukon, Canada” Effective Date 12 October 2016. Report Date: 25 November 2016. SEDAR Filing Date: 9 February 2017

1News Release: “Copper North Expands Oxide Mineral resources at Carmacks” Published on SEDAR 9 April 2018.

About Granite Creek Copper

Granite Creek, a member of the Metallic Group of Companies, is a Canadian exploration company focused on the 176 square kilometer Carmacks project in the Minto copper district of Canada’s Yukon Territory. The project is on trend with the high-grade Minto copper-gold mine, operated by Minto Metals Corp., to the north, and features excellent access to infrastructure with the nearby paved Yukon Highway 2, along with grid power within 12 km. More information about Granite Creek Copper can be viewed on the Company’s website at www.gcxcopper.com.

FOR FURTHER INFORMATION PLEASE CONTACT:

Timothy Johnson, President & CEO
Telephone: 1 (604) 235-1982
Toll-Free: 1 (888) 361-3494
E-mail: info@gcxcopper.com
Website: www.gcxcopper.com
Metallic Group: www.metallicgroup.ca
Twitter: @yukoncopper

Forward-Looking Statements

This news release includes certain statements that may be deemed “forward-looking statements”. All statements in this release, other than statements of historical facts including, without limitation, statements regarding potential mineralization, historic production, estimation of mineral resources, the realization of mineral resource estimates, interpretation of prior exploration and potential exploration results, the timing and success of exploration activities generally, the timing and results of future resource estimates, permitting time lines, metal prices and currency exchange rates, availability of capital, government regulation of exploration operations, environmental risks, reclamation, title, and future plans and objectives of the company are forward-looking statements that involve various risks and uncertainties. Although Granite Creek Copper believes the expectations expressed in such forward-looking statements are based on reasonable assumptions, such statements are not guarantees of future performance and actual results or developments may differ materially from those in the forward-looking statements. Forward-looking statements are based on a number of material factors and assumptions. Factors that could cause actual results to differ materially from those in forward-looking statements include failure to obtain necessary approvals, unsuccessful exploration results, changes in project parameters as plans continue to be refined, results of future resource estimates, future metal prices, availability of capital and financing on acceptable terms, general economic, market or business conditions, risks associated with regulatory changes, defects in title, availability of personnel, materials and equipment on a timely basis, accidents or equipment breakdowns, uninsured risks, delays in receiving government approvals, unanticipated environmental impacts on operations and costs to remedy same, and other exploration or other risks detailed herein and from time to time in the filings made by the companies with securities regulators. Readers are cautioned that mineral resources that are not mineral reserves do not have demonstrated economic viability. Mineral exploration and development of mines is an inherently risky business. Accordingly, the actual events may differ materially from those projected in the forward-looking statements. For more information on Granite Creek Copper and the risks and challenges of their businesses, investors should review their annual filings that are available at www.sedar.com.

Neither the TSX Venture Exchange nor its Regulation Services Provider (as that term is defined in the policies of the TSX Venture Exchange) accepts responsibility for the adequacy or accuracy of this release.

SOURCE: Granite Creek Copper Ltd.


View source version on accesswire.com:
https://www.accesswire.com/699894/Granite-Creek-Copper-Retains-SGS-Canada-for-Updated-Preliminary-Economic-Assessment-on-High-Grade-Carmacks-Copper-Gold-Silver-Project-in-Yukon-Canada

Categories
Base Metals Energy Junior Mining Top Bar

Lots of Potential for Nevada Copper in 2021

Lots Of Potential for Nevada Copper In 2021

  • Copper is on a bullish tear- More upside in 2021 in all metals
  • China is a massive buyer- A reason the US is next
  • Nevada Copper- A strong management team with solid financing
  • Proven and probable reserves in the US with the potential for more
  • An emerging producer- Risk-reward and the value proposition favors lots of upside

Finding value in the stock market is a challenge these days. At the end of 2019, Tesla shares were trading at a split-adjust level of below $90 per share. On December 18, they were at $695. Returns like that are hard to come by; they require taking a fair amount of risk. Elon Musk had more than his share of detractors in late 2019. In 2020, they became very quiet.

As we move into 2021, we are hopeful the global pandemic will fade into our rearview mirror. Vaccines that create herd immunity to the virus are already becoming available. However, the economic legacy of a tidal wave of liquidity and tsunami of stimulus will remain a reminder of the costly coronavirus.

The 2008 global financial crisis was a far different event than the 2020 pandemic. However, central banks and governments employed the same financial tools. The only difference was in 2020; the levels were much higher. In 2008, the US Treasury borrowed a record $530 billion to fund the stimulus. In May 2020, the Treasury borrowed $3 trillion. The inflationary liquidity and stimulus ignited a secular rally in the raw materials asset class.

From 2008 through 2011, copper’s price exploded from $1.2475 to $4.6495 per pound. The price rose by over 3.7 times. In March 2020, the price of copper dropped to a low of $2.0595. If history repeats, the target for the red metal could be much higher than the 2011 record peak.

Nevada Copper Corporation trades under the symbol NEVDF in the OTC market or NCU.TO on the Toronto Stock Exchange.  Nevada Copper is an emerging mid-tier copper producer that could provide incredible returns in a rising copper market.

Copper is on a bullish tear- More upside in 2021 in all metals

In 1988, the copper price rose to a record high of $1.6085 per pound in the futures market. It was not until 2005 that the red metal made a higher high.

Source: CQG

The long-term quarterly chart highlights the ascent of copper. The nonferrous metal has made higher lows since 2001. Technically, copper looks poised to reach a new all-time peak over the coming years. Price momentum and relative strength indicators point to a bullish trend as we move into 2021. After moving to a higher low in March, copper has posted gains over the past three consecutive quarters and has broken out to the upside.  

Source: CQG

The monthly chart illustrates price gains in nine of the past ten months. The next level of technical resistance stands at the 2012 peak at just below $4 per pound, a gateway to the record high at $4.6495 from 2011. Central bank and government monetary and fiscal policies are rocket fuel for the red metal and many other commodities as they weigh on fiat currencies’ purchasing power. The London Metals Exchange is the leading trading venue for copper and other base metals.

Source: LME/Kitco

The chart shows that copper inventories on the LME are closer to the lows than the highs over the past five years. At below 106,000 tons as of January 6, the low level of stockpiles is an indication that the fundamental equation is tight and favors the upside for the red metal.

China is a massive buyer- A reason the US is next

China is the demand side of the equation for copper and many other commodities. With 1.4 billion people and the world’s second-leading economy, the Chinese require massive copper inflows for infrastructure building each year.

The global pandemic has caused the US economy to falter. The high level of unemployment is a substantial challenge for the incoming Biden administration. Meanwhile, there is bipartisan support for an infrastructure rebuilding program that would make jobs available and repair the crumbling roads, bridges, tunnels, airports, government buildings, schools, and other infrastructure parts over the coming years. An infrastructure package would increase US demand for copper and other construction materials.

Meanwhile, we are likely to see demand for copper increase at a time when the expanding money supply is already pushing the price higher, creating an almost perfect bullish storm for the base metal. 

Nevada Copper- A strong management team with solid financing

In the mining business, experienced management is critical for success. Glencore is one of the leading commodity producers and trading companies in the world. Nevada Copper’s CEO, Mike Ciricillo, was the former head of global copper assets at Glencore.

Pala Investments is a company dedicated to value creation in the mining sector. Nevada Copper’s Chairman Stephen Gill is a managing partner at Pala.

Tom Albanese, the company’s leading independent director, is the former CEO of Vedanta Resources, one of the world’s leading diversified natural resource companies with operations in India, South Africa, Namibia, and Australia. The company is a producer of oil, gas, zinc, lead, silver, copper, iron ore, steel, and aluminum. He was also Rio Tinto’s CEO. Rio Tinto is a global leader in raw materials production with a market cap of over $95 billion.

Nevada Copper has an all-star team at its helm. The company can finance through a senior debt facility at a low rate of interest backed by the German government. Management has arranged for off-take agreements for its copper concentrates.

Proven and probable reserves in the US with the potential for more

Nevada Copper owns mining properties and rights in the US in a region ranked in the top three in mining jurisdictions by the Fraser Institute in 2019. The Canadian Institute is a think tank that researches natural resources and other areas that impact Canadians’ quality of life.

The company has mineral resources of six and one-half billion pounds of copper, including underground and open pit measured and indicated resources.

The desert climate and local typography in Nevada are optimal for efficient and eco-friendly mining. The company uses a dry-stack method for tailings, which achieves a high percentage of recycled water and no tailings dam requirement.

Nevada Copper has strong support from the local community and all levels of Nevada’s state government for its projects and is fully permitted. It is the first producer in the area since 1978 with a large copper inventory in the earth’s crust. And, Nevada Copper has the only processing permit in the district.

Meanwhile, the underground mine is currently in production, with commercial output targeted mid-year of 2021. The company has a net present value of $421 million in post-tax revenues at $3.50 per pound, which does not include the pre-production open pit project. The copper price is already above that level. With over 13 years of remaining mine life, the project has another 680 million pounds of inferred resource available.

The next phase of projected output will come from the open pit, fully permitted for production with five billion pounds of copper, measured and indicated. The net present value of this reserve is approximately $1.2 billion, post-tax at $3.50 per pound.

Additionally, Nevada Copper is exploring for metals on over 16,000 acres in the region. The company’s current market cap of $150 million makes for a compelling value proposition.

On January 6, the company announced a steady increase in performance from its Pumpkin Hollow underground project. The CEO, Mike Ciricillo, commented:

The team continues to improve the performance both at the mine and processing plant, evidenced by the operational metrics for December. Most importantly, they have done it safely. In addition, the commissioning of the main hoist system is progressing well, with the shaft reaching its full production speed further enabling the ramp-up to our goal of 5,000 tpd of hoisted material. We are well on our way to show the potential of the Pumpkin Hollow Underground Project.”

The company also announced it closed the previous announcement amendment to its existing senior credit facility on December 30, 2020. The amendment included a $15 million increase in the loan amount and a deferral of $26 million of planned debt service until 2023. Nevada Copper drew down the fill $15 million on December 30, 2020. The full details of the latest new can be accessed via this link.

An emerging producer- Risk-reward and the value proposition favors lots of upside

Emerging producers carry lots of risk in the world of commodities. However, the reward is always a function of risk in all markets. An experienced management team with a top-notch pedigree, production permits in a copper-rich area in Nevada, in the politically stable United States, and the prospects for a rising copper price make Nevada Copper a company to put on your investment radar. Nevada Copper trades on the Toronto Exchange under the symbol NCU.TO

Source: Barchart

Since November 2, the stock has traded from a low of 5.0 cents to a high of 13.3 cents per share on January 6. NEVDF, the US OTC shares, has a market cap of $192.14 million and trades an average of over one million shares each day. At 13.30 cents on January 6, NEVDF is a company that could offer incredible growth over the coming years. A rising copper price in a world where demand is increasing will support more production. There is always lots of risk in stocks that trade for pennies. However, NEVDF/NCU.TO is a company that could be trading for dollars as the prospects for the red metal look bright.

It is always challenging to identify companies that can experience explosive growth. A reward is always a function of risk. Nevada Copper could be one of those diamonds in the rough in the mining business for 2021 and beyond.

Written By: Andrew Hecht, on behalf of Maurice Jackson of Proven and Probable.

Any investment involves substantial risks, including, but not limited to, pricing volatility, inadequate liquidity, and the potential complete loss of principal. This document does not in any way constitute an offer or solicitation of an offer to buy or sell any investment, security, or commodity discussed herein, or any security in any jurisdiction in which such an offer would be unlawful under the securities laws of such jurisdiction.

Categories
Junior Mining

Drilling Ramps up as Government Approvals Published

Tristar Gold (TSX.V: TSG)

“With two rigs, we’re able to make rapid progress on the pre-feasibility program” Mr. Nick Appleyard, President and CEO, commented. “Final approval for the reports that cover the optimized pits is an important milestone on the path to permitting.”

For Direct Inquiries on Tristar Gold:

Telephone: +1-480-794-1244

Email: info@tristargold.com

https://youtu.be/TxgANbrKxLA

Press Release