Silver has outpaced gold in 2025, with a growth of about 71%, compared to gold’s 54%.
Silver mine production has been decreasing for the past ten years, especially in Central and South America, due to mine closures, resource depletion and infrastructure challenges.
While industrial demand for silver is expected to decline slightly in 2025, the metal is increasingly used in electric vehicles, for AI components and in photovoltaics.
Silver, often nicknamed the ‘Devil’s metal’ because of its volatility, has reached record highs this year and still has further to run despite a supply crunch, according to experts.
The metal’s growth value has been running alongside gold’s, which has seen its own rally with the price surging past $4,000 an ounce this year.
Silver prices reached a historic peak of $54.47 per troy ounce in mid October, marking a 71% rise year-on-year. They’ve since pared back gains somewhat, but are now growing again, despite low supply levels.
“Some people were having to transport silver by plane rather than on cargo ships to meet delivery demand,” Paul Syms, head of EMEA ETF Fixed Income and commodity product management at Invesco, told CNBC.
“While we’ve seen the spike up, we’ve seen the price come down a little bit. Longer term, there’s a different dynamic this time that could keep silver at reasonably high prices and maybe continuing to go up for some time to come,” he added.
October was only the third time in the past 50 years where silver prices peaked. Other silver price highs include January 1980, when the Hunt brothers amassed a third of the world’s supply as they attempted to corner the market, as well as 2011, following the U.S. debt ceiling crisis when silver and gold were embraced as safe haven assets.
“Silver is only about a tenth the size of the gold market, and that short squeeze, obviously, sort of caught a few investors by surprise,” said Syms.
Unlike the previous investment waves, silver’s boom in 2025 relied on a mix of low supply and high demand from India as well as industrial needs and tariffs.
“After Liberation Day, the gold price spiked, but silver actually went down a little bit. And the gold-silver ratio spiked to above 100,” said Syms, referring to the gold-silver ratio which reflects how many ounces of silver are needed to buy one ounce of gold.
A low ratio means gold is relatively cheap, while a high ratio indicates silver is undervalued and likely to rise. In April, the ratio reached a historic high.
“The risk managers in financial and industrial entities did not want to let any metal go out of the States for fear that it might come back in at 35% higher for example,” said Rhona O’Connell, head of market analysis EMEA and Asia at Stone X.
Fast forward to the Autumn and silver entered its peak demand, especially as India’s monsoon and harvest seasons came to an end.
“Farmers don’t really like the banks very much, so gold and latterly, silver, tend to be the first port of call when they’ve got the harvest in,” said O’Connell.
India is also the world’s largest consumer of silver, with about 4,000 metric tons used every year, mostly for jewelry, utensils and ornaments.
The silver appeal this Autumn also coincided with Diwali, a five-day ‘Festival of Lights’ celebrating prosperity and good fortune and also India’s biggest public holiday.
Supply crunch
While gold is traditionally a favorite, this year silver — an affordable investment option in a country where about 55% of the population depends on agriculture for their livelihood — outshined other metals.
On Oct. 17, the price of silver in India rose sharply, reaching a record high of 170,415 rupees a kilogram — an 85% rise since the start of the year.
However, 80% of India’s silver supply is imported. The UAE and China are increasingly supporting that demand, but the U.K. is traditionally India’s largest silver supplier.
Yet, London’s vaults have been emptying rapidly for the past few years. In June 2022, the London Bullion Market Association held 31,023 metric tons of silver. By March 2025, volumes had fallen by around a third to 22,126 metric tons — its lowest point in years.
“What isn’t necessarily so visible to people is what’s happening in the vaults,” said O’Connell. “And that had reached a point where there was basically there was no available metal left in London.”
In October, the squeeze was such that traders had to pay much higher borrowing costs – or lease rates – to close their positions.
“At one stage, to borrow overnight was costing 200% on an annualized basis, so a lot of people were very stressed to put it mildly,” said O’Connell.
Supply is a constant issue for silver, as for other precious and rare metals. The Silver Institute’s 2025′s World Silver Survey estimates that mine production has been decreasing over the past 10 years, especially in Central and South America.
“Over the course of the past twelve months or so, the underlying surplus has started to turn into a deficit for three reasons: the impact of the electrification of the vehicle fleet, artificial intelligence, and photovoltaics,” said O’Connell.
(Bloomberg) — Platinum surged to its highest level since 2014 as supply concerns and a wave of speculative buying jolted the market.
The precious metal surged as much as 4.6%, while palladium was up more than 5% at one point. Gold edged higher as investors waited for clearer signs that Israel-Iran tensions won’t spill over again, and for more certainty on the Federal Reserve’s interest rate path.
“The recent surge in Chinese investment and jewelry replacement is shining a spotlight on platinum’s supply deficit,” said Justin Lin, an analyst at Global X ETFs. “Palladium and platinum are intrinsically linked as they can be substituted for one another for use in autocatalysts depending on relative prices, so we can expect some positive momentum in palladium off of platinum’s rally.”
The dominant platinum spot market in London and Zurich has shown signs of tightness for months, after approximately half a million ounces surged into US warehouses, spurred by a lucrative arbitrage and fear of tariffs.
Forward prices for platinum are now trading well below spot, a situation known as backwardation, which indicates tight market conditions. The implied cost of borrowing the metal is also still high, at an annualized rate of roughly 13% for a one-month lease, well above the usual rate of close to zero.
Platinum surged 3.4% to $1,400.75 an ounce as of 11:25 a.m. in London and palladium jumped 2.4% to $1,093.46. Gold rose 0.2% to $3,339.20 and silver added 1%. The Bloomberg Dollar Spot Index declined 0.5%.
In this episode of ‘Proven and Probable,’ we engage with Bob Moriarty, a distinguished commentator on geopolitical and economic affairs. Bob’s extensive experience includes serving as a Marine F-4B pilot during the Vietnam War, where he flew over 820 combat missions and became one of the most highly decorated pilots of the conflict.
We delve into the recent tragic collision between an American Airlines plane and a military helicopter near Washington, D.C., exploring Bob’s insights on the incident, the National Transportation Safety Board’s investigative approach, and media coverage.
The discussion also covers U.S. tariff policies, international responses, and the current state of gold and precious metals, providing a comprehensive analysis of these pressing issues.
Join us for an in-depth conversation that offers clarity and depth on these complex topics.
In 2024, Americans faced several financial challenges that impacted their ability to save and manage their finances effectively. Inflation remained a top concern, leading to increases in the cost of essentials such as housing, groceries, and utilities, and straining household budgets.
Credit card debt also reached record highs. Rising interest rates on credit cards and loans made it harder for consumers to pay down their balances. Additionally, many households depleted the excess savings they accumulated during the pandemic, leaving them with less of a financial cushion.
With all of this in mind, Yahoo Finance partnered with Marist Poll to survey more than 3,000 banked adults in the U.S. (those with at least one checking or savings account) to shed light on the financial struggles and concerns facing households. Here’s what Americans say have been their biggest barriers to saving and how they feel about their finances heading into 2025. (See our full methodology here.)
This embedded content is not available in your region.
Key findings
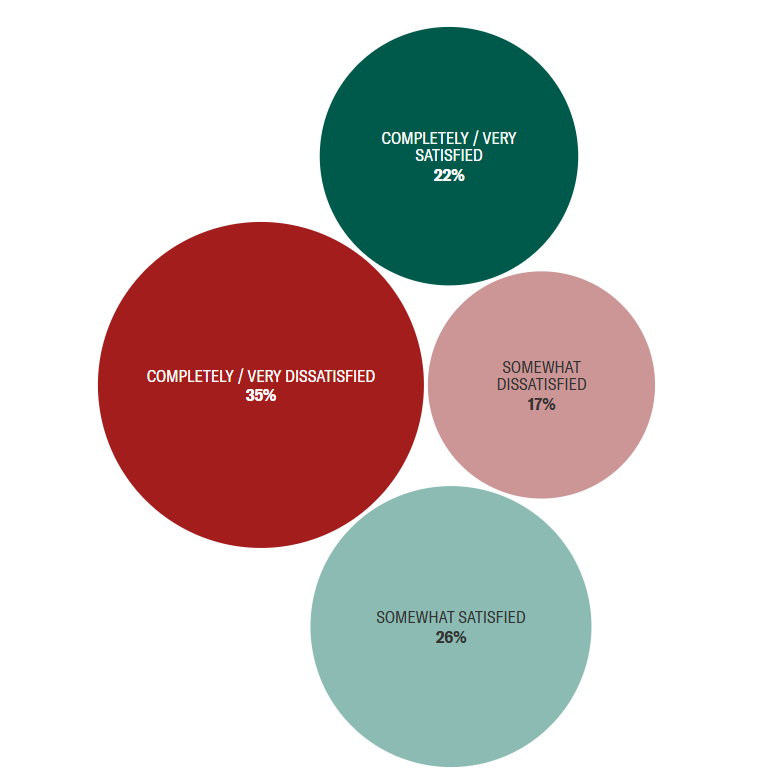
Only 22% of respondents report being very or completely satisfied with their savings, while 35% are very or completely dissatisfied. Forty percent of women are very or completely dissatisfied with their savings, compared to 28% of men.
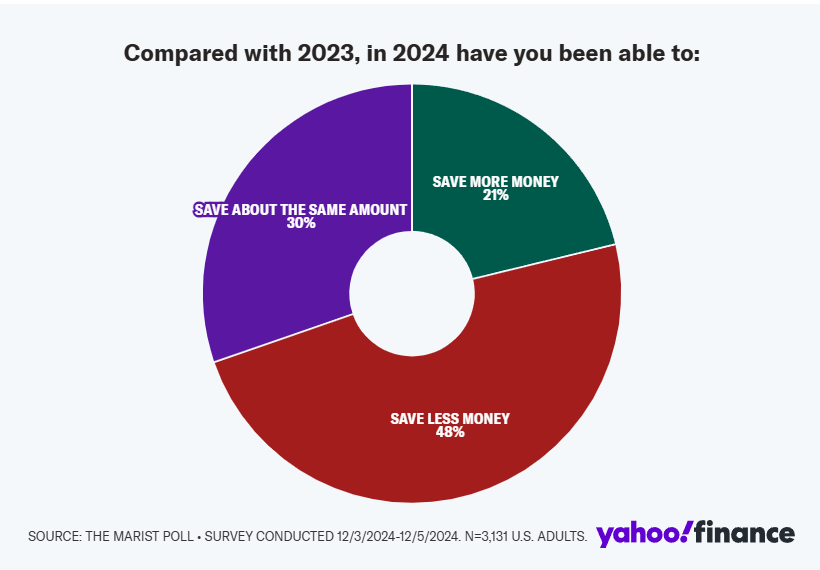
Nearly half (48%) of respondents saved less in 2024 compared to the previous year, with only 21% saving more.
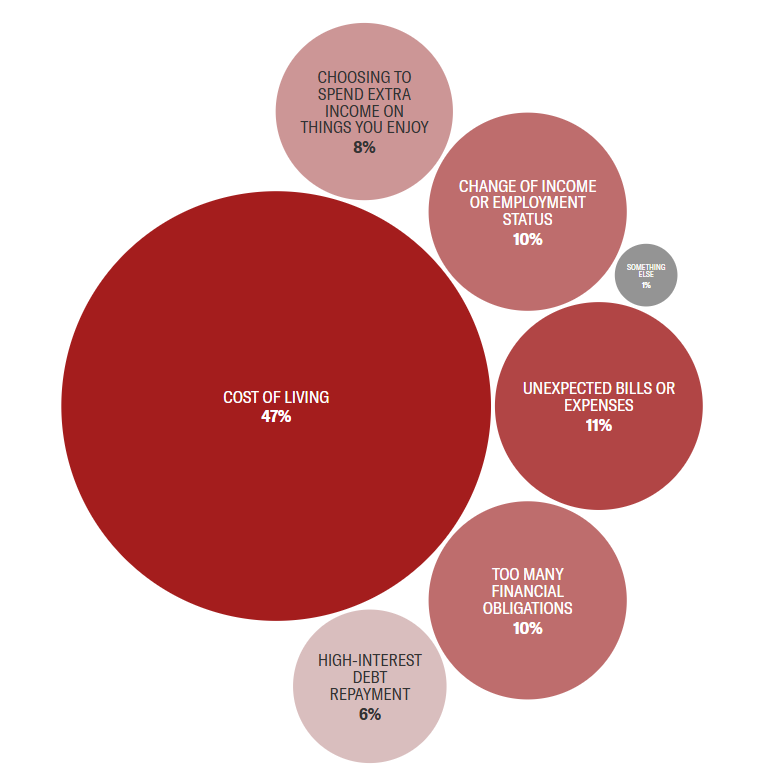
Nearly half (47%) of respondents cite the cost of living as their biggest obstacle to saving.
One-third (33%) of respondents couldn’t cover bills for even one month if they lost their income.
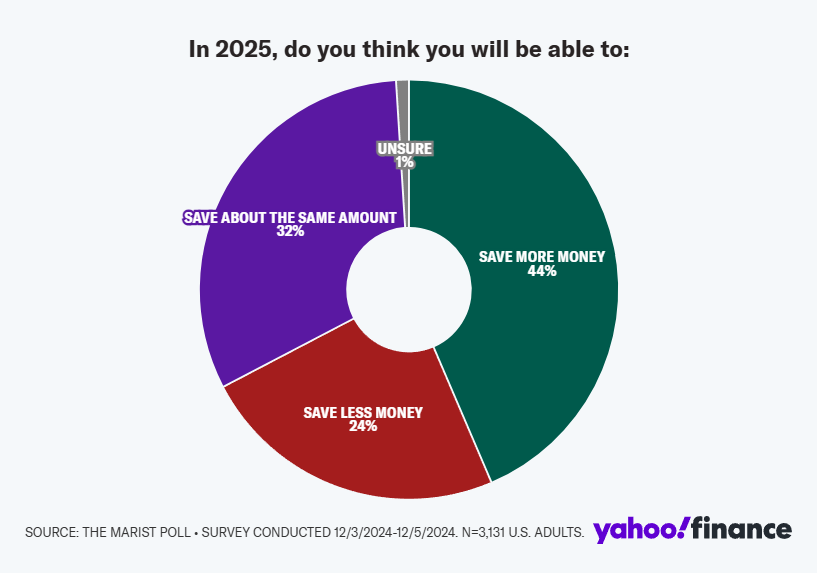
44% of respondents believe they will save more in 2025, with optimism highest among Gen Z (63%) and millennials (53%).
60% of respondents say they are more optimistic about their finances for the coming year with Donald Trump as president. This optimism crosses generational lines, with Gen Z (70%) as the most optimistic.
The Yahoo Finance/Marist Poll 2025 national survey on the state of savings
We set out to learn more about how higher costs and competing financial obligations have impacted Americans’ savings. Here’s what we found:
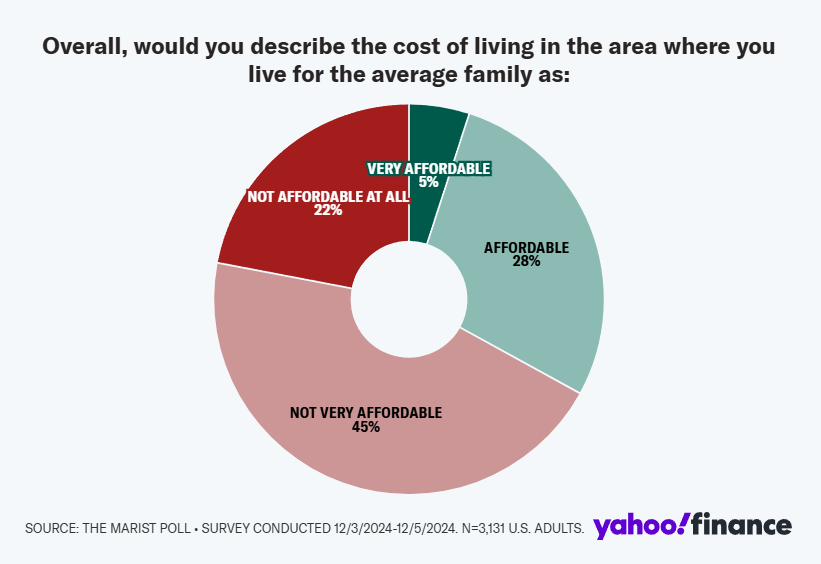
Two-thirds of respondents say the cost of living for the average family in their area is not affordable
In a post-COVID-19 world, the rising cost of living dominated financial news headlines. Many households felt the pinch as inflation reached a 40-year high of 9.1% in June 2022. Though the inflation rate has since tempered (the Consumer Price Index was up 2.7% year over year in November 2024), the sky-high costs of housing, groceries, and other essentials are here to stay for the foreseeable future.
Overall, our survey found that most respondents describe the cost of living in their area as “not very affordable” (45%), while another 22% say it’s not affordable at all.
On the other hand, Gen Z respondents were more likely to describe the cost of living as “very affordable” (9%) compared to other generations: millennials (8%), Gen X (3%), and baby boomers/silent/greatest generations (2%).
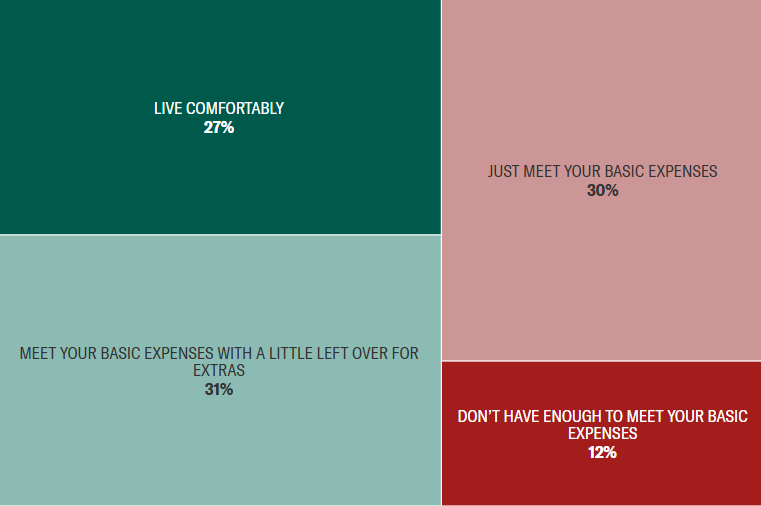
Only one-quarter of Americans say they live comfortably
Not only are survey respondents unhappy with the cost of living in their area, but most are struggling to pay for necessities while putting money away for the future.
Just over a quarter of survey respondents say they live comfortably. Older Americans (baby boomer/silent/greatest generations) were more likely to say they live comfortably (40%).
Meanwhile, 31% of respondents are able to meet their basic expenses with a little money left over for extras, while another 30% are just able to meet their basic expenses. And 12% say they don’t have enough money to cover their basic living expenses.
More women are dissatisfied with how much they’ve saved than men
Everyone’s savings goals are different, based on lifestyle, family size, debt obligations, and more. When it comes to whether Americans are satisfied with how much they’ve saved so far, the results are mixed.
Thirty-five percent of respondents in our survey are dissatisfied with the amount of money they’ve saved. Women (40%) are more likely than men (28%) to say that they are very or completely dissatisfied with their savings — perhaps not surprising given the financial challenges that many women face, including the gender pay gap and a higher burden of caregiving responsibilities.
About half of Americans say they saved less in 2024 compared to 2023
This past year proved to be a difficult one for Americans’ savings. Despite historically high deposit account interest rates, consumers were also faced with inflation, skyrocketing interest rates on debt, record-level education costs, and more.
Nearly half of respondents in our survey report they saved less money in 2024 compared to 2023; only 21% reported saving more money. Nearly a third of respondents said they saved about the same amount.
Overall, women were more likely to say they’ve saved less money in 2024 than they did in 2023 (53% versus 42% of men), especially millennial and Gen X women (57% and 59%, respectively).
Younger generations are more optimistic about their savings potential in the new year
With a new year — and a new administration — we sought to find out how Americans believe their savings habits will change in 2025.
It’s not all doom and gloom, especially for younger savers. Younger Americans are more likely to say they will save more: 63% of Gen Z and 53% of millennials versus 44% of Gen X and 25% of baby boomers/silent/greatest generations.
Most likely to save about the same amount in 2025 are those in the baby boomer/silent/greatest generations (44%). Women, however, are more likely than men to say they will save less this year (27% vs. 20%, respectively).
Cost of living has been the most significant barrier to saving
We wanted to learn more about the various challenges savers are facing that are preventing them from reaching their savings goals.
Nearly half of respondents (47%) pointed to cost of living as their biggest obstacle when it comes to saving money. Other common reasons included unexpected bills or expenses (11%), too many financial obligations (10%), and change of income or employment status (10%).
Older Americans were most likely to report they face no challenges to saving money (19%).
Gen Zers and millennials are most likely to ask family and friends for help in a financial emergency
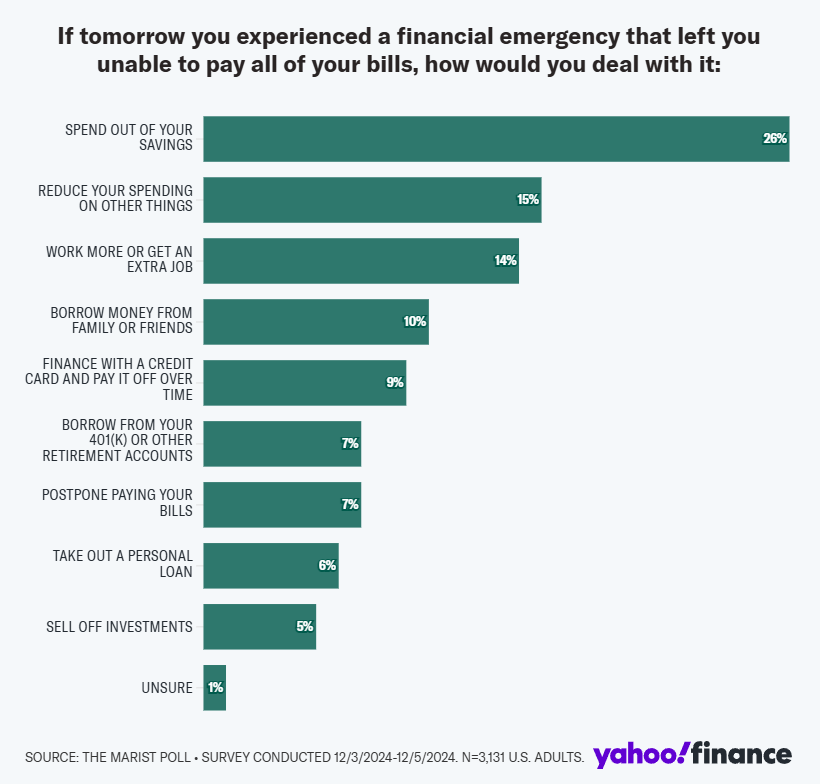
In times of financial distress, there are several avenues you might take to cover your bills — some of which are better for your bottom line than others.
The largest percentage of respondents (26%) say that their solution would be to tap into their savings. Fifteen percent say they’d cut down on their spending, while 14% would pick up an extra job or more hours at work.
Another 10% of respondents say they would ask a family member or friend for help in a financial emergency, with Gen Zers and millennials the most likely to do so (15% for both).
Gen Xers and baby boomers/silent/greatest generations are more likely to put their expenses on a credit card (10%).
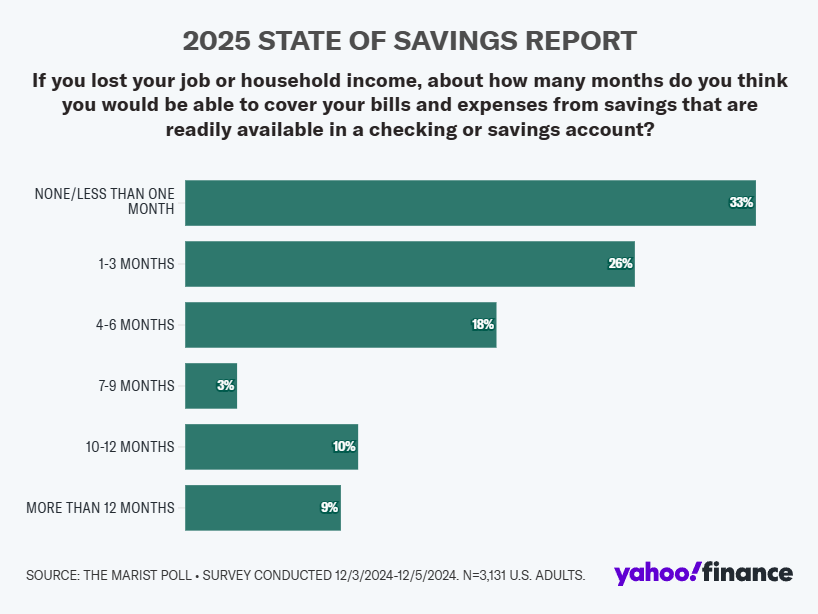
A third of households couldn’t cover one month’s worth of bills if they lost their job or source of income
Most experts recommend saving at least three to six months’ worth of expenses in an emergency fund. However, given the many barriers to saving that Americans face, not everyone is able to meet this guideline.
The average length of time respondents could cover their expenses using money that is readily available in their checking or savings account is seven months.
However, about 1 in 3 respondents say they would not be able to cover their bills and expenses for even one month. Gen Z (38%) and millennials (41%) are more likely than other generations to say they could not pay their bills for one month.
In contrast, Gen X and baby boomers/silent/greatest generations (19% for both) are more likely than younger generations to have enough savings to manage for one year or more.
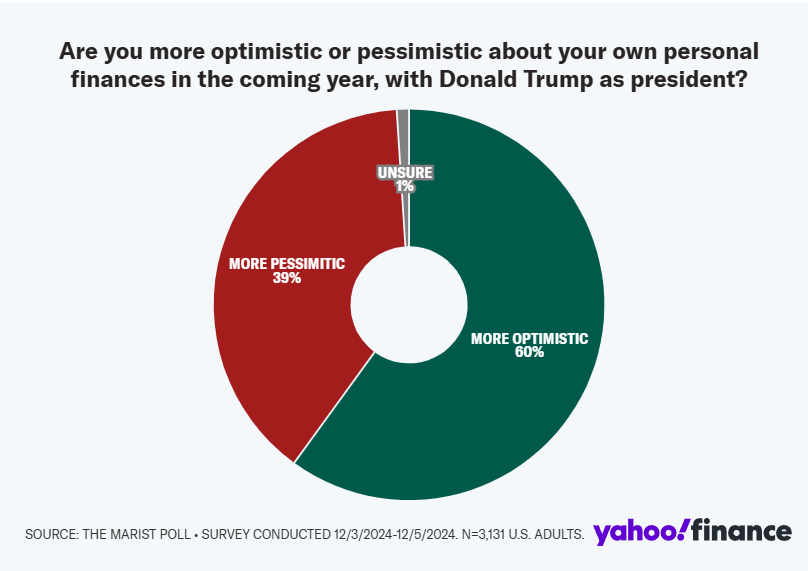
60% of Americans are more optimistic about their finances in the coming year with Donald Trump as president
For better or worse, with a new administration often comes a new economic agenda. And most Americans are expecting positive changes.
A majority of respondents (60%) are more optimistic about their personal finances with Trump as the next president. This was the consensus across generations, with Gen Z being the most optimistic (70%). Baby boomers/silent/greatest generations were the most pessimistic (46%).
This survey of 3,131 adults was conducted Dec. 3 through Dec. 5, 2024, by the Marist Poll sponsored in partnership with Yahoo Finance. Adults 18 years of age and older residing in the United States were contacted through a multi-mode design: By phone using live interviewers, by text, or online. All potential respondents were screened for age.
Probability-based sampling frames include RDD landline plus listed landline, RDD cell phone sample plus cell phone sample based on billing address to account for inward and outward mobility within a state. These samples were provided by Dynata and used to administer the surveys collected via phone and text to web. A sampling frame based on aggregated non-probability online research panels was randomly selected from Cint’s digital insights platform to administer the surveys collected via web.
Survey questions were available in English or Spanish. All samples were selected to ensure that each region was represented in proportion to its adult population. The samples were then combined and balanced to reflect the 2022 American Community Survey five-year estimates for age, gender, income, race, and region.
Results for all adults (n=3,131) are statistically significant within ±2.1 percentage points. Results for banked households (n=2,828) are statistically significant within ±2.2 percentage points. The design effect for this survey is 1.4 which has been incorporated in the calculation of all reported margins of error. The partisan breakdown for this survey among registered voters is 38% Democrat, 36% Republican, and 25% Independent.