
Widths of Mineralized System Expanded Significantly
Vancouver, British Columbia–(Newsfile Corp. – February 2, 2023) – Goldshore Resources Inc. (TSXV: GSHR) (OTCQB: GSHRF) (FSE: 8X00) (“Goldshore” or the “Company“), is pleased to announce assay results from its ongoing 100,000-meter drill program at the Moss Lake Project in Northwest Ontario, Canada (the “Moss Lake Gold Project“).
Highlights:
- Hole MMD-22-063 has confirmed the presence of high-grade mineralization within the previously perceived low grade and low tonnage Southwest Zone and shown the zone to be almost 300 meters wide. Best intercepts include:
- 1.60 g/t Au over 57.5m from 230.5m depth in MMD-22-063 including:
- 9.46 g/t Au over 7.45m from 234.0m
- 9.46 g/t Au over 7.45m from 234.0m
- 1.18 g/t Au over 18.25m from 387.75m
- 1.60 g/t Au over 57.5m from 230.5m depth in MMD-22-063 including:
- Results for thirteen holes drilled to explore the northern and southern flanks of the mineralized shear zone system in the Main Zone have expanded the cumulative width of multiple, close-spaced, high-grade gold shears by 150-200 meters to over 550 meters at the Main Zone with best intercepts of:
- 0.93 g/t Au over 126.0m from 467.0m depth in MMD-22-059 including:
- 1.64 g/t over 48.0m from 513.0m
- 1.64 g/t over 48.0m from 513.0m
- 3.67 g/t Au over 13.65m from 612.35m
- 1.05 g/t Au over 34.0m from 257.0m depth in MMD-22-088 including:
- 1.51 g/t Au over 15.0m from 276.0m
- 1.51 g/t Au over 15.0m from 276.0m
- 1.84 g/t Au over 14.95m from 483.05m
- 0.93 g/t Au over 126.0m from 467.0m depth in MMD-22-059 including:
President and CEO, Brett Richards, stated: “These results once again support our thesis that the size and scale of the Moss Lake Gold Project will be large enough to support a material and meaningful update to the mineral resource estimate (“MRE”) in April 2023, followed by a preliminary economic assessment (“PEA”) on the updated resource. We continue to find additions to the resource on step out holes laterally and along strike from the historic resource profile, and we look to continue to explore the impact of these additions to the resource model, as well as guiding us in future drill targets.”
Technical Overview
Figure 1 shows the better intercepts in plain view and Figure 2 is a typical section through hole MMD-22-063. Table 1 shows the significant intercepts. Table 2 shows the drill hole locations.

Figure 1: Drill plan showing best of several +1 g/t Au intercepts relative to the current Mineral Resource and highlighting the additional shears.
To view an enhanced version of this graphic, please visit:
https://images.newsfilecorp.com/files/8051/153300_2909b97504e5db83_002full.jpg
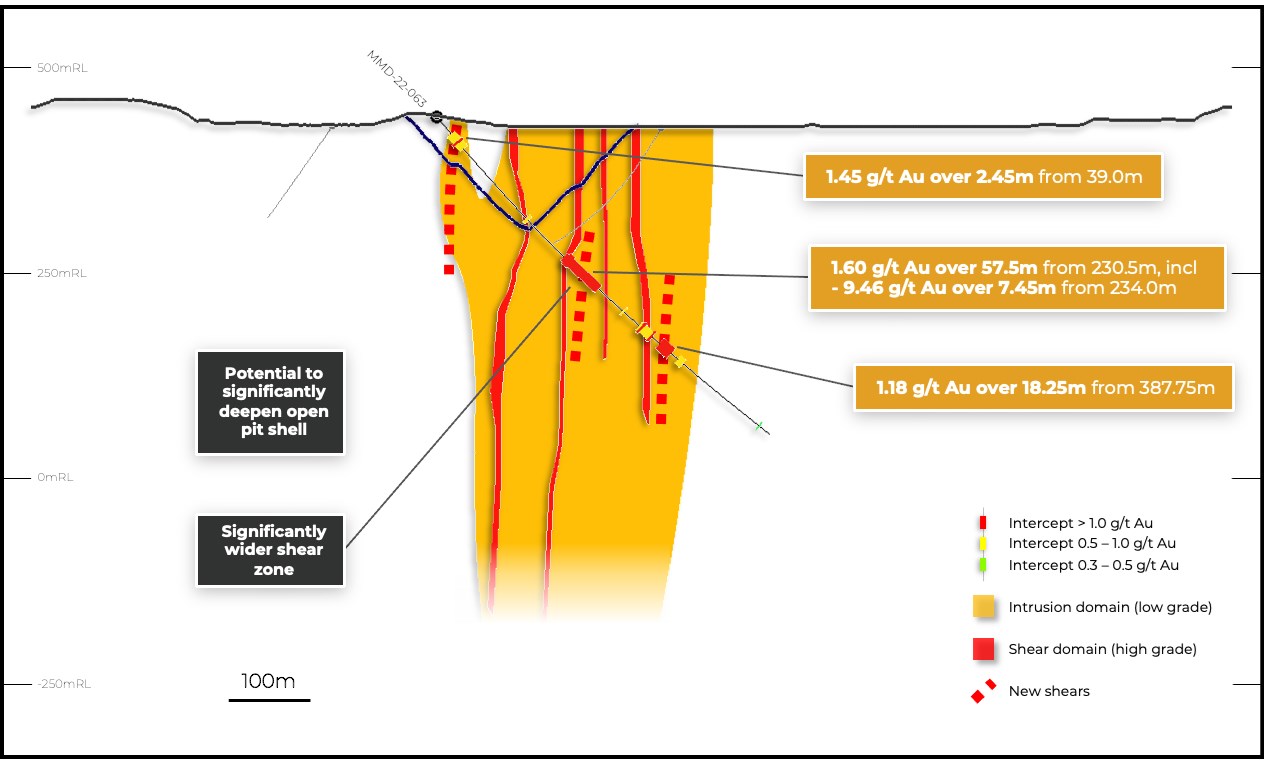
Figure 2: Drill section through MMD-22-063 relative to the current Mineral Resource and highlighting the additional shears and potential to significantly deepen the open pit shell.
To view an enhanced version of this graphic, please visit:
https://images.newsfilecorp.com/files/8051/153300_2909b97504e5db83_003full.jpg
Results have been received for MMD-22-063, which was the final hole from the first pass drill pattern at the Southwest Zone. The hole infills two previous holes and has shown that there is continuity to the high-grade core of the zone. In addition to the high-grade lenses highlighted above, the hole also intersected multiple lenses of lower grade mineralization throughout the hole including 0.58 g/t Au over 23.2m from 27.9m, 0.81 g/t Au over 20.6m from 355m, and 0.55 g/t Au over 7.95m from 417.05m. These confirm the increased tonnage potential in the Southwest Zone with mineralization above the low-grade cutoff of 0.40 g/t Au used for the current mineral resource estimate over a zone that is almost 300 meters wide.
A second pass drill pattern over the Southwest zone was completed in January, infilling the newly discovered high-grade shears and exploring for additional shears.
Results have also been received for thirteen holes that have explored the edges of the Main Zone on its northern and southern flanks. Six holes targeted the northern side of the shear system, and seven holes targeted the southern side. These holes intersected high-grade shears over a zone that is 200 meters wider than previously understood, making the main zone over 550 meters wide at its widest point.
As with the center of the Main Zone, these shears lie within broad zones of low-grade mineralization within the altered diorite intrusion host. Examples include 0.84 g/t Au over 37m from 608m in MQD-22-058; 0.33 g/t Au over 35.65m from 231.35m, 0.42 g/t Au over 34m from 273m and 0.86 g/t Au over 126m from 467m in MMD-22-059; 0.58 g/t Au over 75m from 543.5m in MMD-22-060; 0.91 g/t Au over 33m from 257m in MMD-22-088; 0.58 g/t Au over 75m from 422m in MMD-22-089; 0.39 g/t Au over 40.5m from 453.8m in MQD-22-091; and 0.72 g/t Au over 15m from 207 in MMD-22-095.
The shears in the north and south were sparsely drilled by historical drill holes and represent opportunity to potentially expand the mineral resource and to properly understand the mineralizing system.
A detailed review of current and previous high-grade intercepts has identified various gold, silver, and bismuth bearing tellurides across all three zones of the Moss Lake Gold Project deposit. The tellurides have been located within pyrite±-chalcopyrite bearing quartz-chlorite-carbonate veins and sulphide-rich hydrothermal breccias previously identified in the vein paragenesis to be emplaced near the end of deformational history. Identifying and outlining the late structural events will allow for enhanced targeting of the high-grade portions of Moss Lake Gold Project and will assist in refining generative targets by focusing on preferred horizons for these structures to occur.

Figure 3: Tellurides identified at 234.1m of MQD-21-009 within a py+cpy bearing undulating qt+ch±cb shear vein. The sample yielded 39.7g/t Au, 73.7g/t Ag, 63.5g/t Te over 0.9m.
To view an enhanced version of this graphic, please visit:
https://images.newsfilecorp.com/files/8051/153300_2909b97504e5db83_004full.jpg
Pete Flindell, VP Exploration for Goldshore, said, “The high-grade drill results in the Southwest Zone provide confidence that this area has significant resource potential. The results along the northern and southern flanks of the Main Zone also represent a significant expansion to the width of the mineralized zone, which should assist our goal of potentially expanding the mineral resource and improving its quality in early Q2.”
Table 1: Significant downhole gold intercepts
| HOLE ID | FROM | TO | LENGTH (m) | TRUE WIDTH (m) | CUT GRADE (g/t Au) | UNCUT GRADE (g/t Au) |
| MMD-22-058 | 314.00 | 321.00 | 7.00 | 4.1 | 0.41 | 0.41 |
| 374.90 | 392.30 | 17.40 | 10.3 | 0.36 | 0.36 | |
| 466.00 | 468.30 | 2.30 | 1.4 | 0.38 | 0.38 | |
| 491.70 | 505.00 | 13.30 | 8.1 | 0.39 | 0.39 | |
| 517.00 | 519.00 | 2.00 | 1.2 | 0.35 | 0.35 | |
| 553.45 | 574.45 | 21.00 | 13.3 | 0.37 | 0.37 | |
| 593.00 | 595.00 | 2.00 | 1.3 | 0.37 | 0.37 | |
| 608.00 | 645.00 | 37.00 | 23.9 | 0.87 | 0.87 | |
| including | 614.00 | 621.00 | 7.00 | 4.5 | 1.40 | 1.40 |
| and | 628.00 | 636.00 | 8.00 | 5.2 | 1.04 | 1.04 |
| and | 641.00 | 645.00 | 4.00 | 2.6 | 1.54 | 1.54 |
| MMD-22-059 | 231.35 | 307.00 | 75.65 | 51.8 | 0.36 | 0.36 |
| including | 236.00 | 239.20 | 3.20 | 2.2 | 1.01 | 1.01 |
| and | 280.00 | 284.00 | 4.00 | 2.7 | 1.45 | 1.45 |
| 342.00 | 348.00 | 6.00 | 4.2 | 0.36 | 0.36 | |
| 361.00 | 392.00 | 31.00 | 22.0 | 0.36 | 0.36 | |
| 467.00 | 593.00 | 126.00 | 92.3 | 0.93 | 0.93 | |
| including | 475.60 | 484.70 | 9.10 | 6.6 | 1.50 | 1.50 |
| and | 504.65 | 509.30 | 4.65 | 3.4 | 1.08 | 1.08 |
| and | 513.00 | 561.00 | 48.00 | 35.3 | 1.64 | 1.64 |
| 612.35 | 626.00 | 13.65 | 10.2 | 2.56 | 3.67 | |
| MMD-22-060 | 95.20 | 102.00 | 6.80 | 3.5 | 0.40 | 0.40 |
| 336.95 | 346.00 | 9.05 | 5.1 | 0.31 | 0.31 | |
| 361.10 | 379.00 | 17.90 | 10.2 | 0.70 | 0.70 | |
| including | 364.00 | 368.10 | 4.10 | 2.3 | 2.14 | 2.14 |
| 475.80 | 481.10 | 5.30 | 3.1 | 0.39 | 0.39 | |
| 543.50 | 569.00 | 25.50 | 16.1 | 0.79 | 0.79 | |
| 584.00 | 592.15 | 8.15 | 5.2 | 0.46 | 0.46 | |
| MMD-22-061 | 113.55 | 121.00 | 7.45 | 3.9 | 0.30 | 0.30 |
| 125.25 | 130.00 | 4.75 | 2.5 | 0.31 | 0.31 | |
| 213.00 | 216.40 | 3.40 | 1.9 | 0.38 | 0.38 | |
| 234.95 | 237.00 | 2.05 | 1.1 | 0.46 | 0.46 | |
| 331.65 | 343.30 | 11.65 | 6.7 | 0.58 | 0.58 | |
| 449.00 | 455.10 | 6.10 | 3.6 | 0.39 | 0.39 | |
| 460.00 | 462.00 | 2.00 | 1.2 | 0.64 | 0.64 | |
| 570.00 | 593.00 | 23.00 | 14.5 | 0.31 | 0.31 | |
| MMD-22-063 | 27.90 | 51.10 | 23.20 | 15.0 | 0.58 | 0.58 |
| including | 39.00 | 41.95 | 2.95 | 1.9 | 1.45 | 1.45 |
| 165.00 | 169.00 | 4.00 | 2.7 | 0.53 | 0.53 | |
| 230.50 | 288.00 | 57.50 | 42.0 | 1.60 | 1.60 | |
| including | 234.00 | 241.45 | 7.45 | 5.4 | 9.46 | 9.46 |
| 328.00 | 330.00 | 2.00 | 1.5 | 0.89 | 0.89 | |
| 355.00 | 375.60 | 20.60 | 15.5 | 0.81 | 0.81 | |
| including | 357.00 | 360.00 | 3.00 | 2.2 | 3.57 | 3.57 |
| and | 373.00 | 375.60 | 2.60 | 2.0 | 1.28 | 1.28 |
| 387.75 | 406.00 | 18.25 | 13.8 | 1.18 | 1.18 | |
| 417.05 | 425.00 | 7.95 | 6.0 | 0.55 | 0.55 | |
| 544.00 | 546.00 | 2.00 | 1.6 | 0.31 | 0.31 | |
| MMD-22-068 | 17.15 | 23.00 | 5.85 | 2.9 | 0.34 | 0.34 |
| 307.00 | 327.00 | 20.00 | 11.8 | 0.42 | 0.42 | |
| 337.10 | 341.40 | 4.30 | 2.5 | 0.45 | 0.45 | |
| 347.95 | 350.55 | 2.60 | 1.5 | 0.44 | 0.44 | |
| 361.00 | 376.00 | 15.00 | 9.0 | 0.61 | 0.61 | |
| including | 370.00 | 373.00 | 3.00 | 1.8 | 1.78 | 1.78 |
| 570.40 | 581.30 | 10.90 | 7.1 | 0.32 | 0.32 | |
| 625.55 | 672.00 | 46.45 | 31.3 | 0.35 | 0.35 | |
| MMD-22-069 | 57.00 | 63.00 | 6.00 | 3.3 | 0.77 | 0.77 |
| 266.50 | 276.00 | 9.50 | 6.5 | 0.52 | 0.52 | |
| 525.00 | 530.00 | 5.00 | 3.5 | 0.35 | 0.35 | |
| 540.15 | 545.00 | 4.85 | 3.4 | 0.45 | 0.45 | |
| 567.00 | 569.95 | 2.95 | 2.1 | 0.61 | 0.61 | |
| 581.90 | 588.20 | 6.30 | 4.5 | 0.32 | 0.32 | |
| MMD-22-071 | 629.85 | 633.80 | 3.95 | 3.0 | 0.45 | 0.45 |
| MMD-22-084 | 194.00 | 213.15 | 19.15 | 14.9 | 0.53 | 0.53 |
| including | 198.00 | 203.00 | 5.00 | 3.9 | 1.32 | 1.32 |
| 229.00 | 231.00 | 2.00 | 1.6 | 0.47 | 0.47 | |
| 255.00 | 258.50 | 3.50 | 2.8 | 1.74 | 1.74 | |
| 292.55 | 294.55 | 2.00 | 1.6 | 0.43 | 0.43 | |
| 399.00 | 403.65 | 4.65 | 3.8 | 0.96 | 0.96 | |
| MMD-22-088 | 55.25 | 58.05 | 2.80 | 2.0 | 0.31 | 0.31 |
| 111.00 | 115.55 | 4.55 | 3.3 | 0.31 | 0.31 | |
| 149.00 | 166.00 | 17.00 | 12.8 | 0.45 | 0.45 | |
| 179.00 | 186.00 | 7.00 | 5.3 | 0.41 | 0.41 | |
| 209.70 | 222.00 | 12.30 | 9.4 | 0.46 | 0.46 | |
| 257.00 | 291.00 | 34.00 | 26.3 | 1.05 | 1.05 | |
| including | 276.00 | 291.00 | 15.00 | 11.6 | 1.51 | 1.51 |
| 432.00 | 434.00 | 2.00 | 1.6 | 0.46 | 0.46 | |
| 444.95 | 468.10 | 23.15 | 18.5 | 0.32 | 0.32 | |
| 483.05 | 498.00 | 14.95 | 12.0 | 1.84 | 1.84 | |
| including | 483.05 | 496.00 | 12.95 | 10.4 | 2.04 | 2.04 |
| MMD-22-089 | 302.10 | 309.00 | 6.90 | 5.1 | 0.63 | 0.63 |
| including | 307.00 | 309.00 | 2.00 | 1.5 | 1.30 | 1.30 |
| 321.00 | 334.80 | 13.80 | 10.3 | 0.34 | 0.34 | |
| 390.00 | 392.00 | 2.00 | 1.5 | 0.41 | 0.41 | |
| 422.00 | 497.00 | 75.00 | 58.4 | 0.59 | 0.59 | |
| including | 431.00 | 433.00 | 2.00 | 1.5 | 3.66 | 3.66 |
| and | 444.00 | 456.00 | 12.00 | 9.3 | 1.05 | 1.05 |
| and | 478.00 | 488.00 | 10.00 | 7.8 | 1.19 | 1.19 |
| MMD-22-091 | 153.70 | 162.55 | 8.85 | 6.1 | 0.53 | 0.53 |
| 201.00 | 206.95 | 5.95 | 4.2 | 0.42 | 0.42 | |
| 363.55 | 378.00 | 14.45 | 10.7 | 0.32 | 0.32 | |
| 397.00 | 401.55 | 4.55 | 3.4 | 0.45 | 0.45 | |
| 453.80 | 494.30 | 40.50 | 30.8 | 0.41 | 0.41 | |
| MMD-22-093 | 473.25 | 481.00 | 7.75 | 6.0 | 0.61 | 0.61 |
| 496.00 | 512.80 | 16.80 | 13.2 | 0.44 | 0.44 | |
| including | 509.25 | 512.80 | 3.55 | 2.8 | 1.05 | 1.05 |
| 523.00 | 525.25 | 2.25 | 1.8 | 3.04 | 3.04 | |
| 551.00 | 555.20 | 4.20 | 3.3 | 0.32 | 0.32 | |
| 587.20 | 606.20 | 19.00 | 15.1 | 0.33 | 0.33 | |
| 617.40 | 620.55 | 3.15 | 2.5 | 0.33 | 0.33 | |
| 628.00 | 630.80 | 2.80 | 2.2 | 0.56 | 0.56 | |
| MMD-22-095 | 161.20 | 167.45 | 6.25 | 4.4 | 1.10 | 1.10 |
| including | 163.00 | 165.00 | 2.00 | 1.4 | 2.41 | 2.41 |
| 186.30 | 190.00 | 3.70 | 2.6 | 0.33 | 0.33 | |
| 207.00 | 222.00 | 15.00 | 10.7 | 0.72 | 0.72 | |
| including | 211.65 | 215.05 | 3.40 | 2.4 | 1.56 | 1.56 |
| 267.00 | 276.00 | 9.00 | 6.5 | 0.46 | 0.46 | |
| including | 274.00 | 276.00 | 2.00 | 1.4 | 1.61 | 1.61 |
| 373.60 | 376.15 | 2.55 | 1.9 | 0.44 | 0.44 | |
| 412.50 | 418.00 | 5.50 | 4.1 | 0.71 | 0.71 | |
| Intersections calculated above at 0.3 g/t Au cut off with a top cut of 30 g/t Au and a maximum internal waste interval of 10 metres. Bordered intervals are intersections calculated above a 1.0 g/t Au cut off. Intervals in bold are those with a grade thickness factor exceeding 20 gram x metres / tonne gold. True widths are approximate and assume a subvertical body. |
Table 2: Location of drill holes in this press release
| HOLE | EAST | NORTH | RL | AZIMUTH | DIP | EOH |
| MMD-22-058 | 668,743 | 5,379,407 | 454 | 153° | -60° | 645.00 |
| MMD-22-059 | 668,819 | 5,379,436 | 439 | 154° | -50° | 648.00 |
| MMD-22-060 | 668,909 | 5,379,474 | 436 | 155° | -60° | 600.05 |
| MMD-22-061 | 669,091 | 5,379,558 | 448 | 155° | -60° | 600.00 |
| MMD-22-063 | 668,481 | 5,378,460 | 439 | 148° | -50° | 563.00 |
| MMD-22-068 | 669,177 | 5,379,614 | 455 | 154° | -60° | 699.10 |
| MMD-22-069 | 669,254 | 5,379,629 | 445 | 151° | -59° | 600.00 |
| MMD-22-071 | 669,077 | 5,378,242 | 432 | 335° | -51° | 648.00 |
| MMD-22-084 | 668,973 | 5,378,574 | 428 | 337° | -45° | 414.15 |
| MMD-22-088 | 669,031 | 5,378,642 | 431 | 336° | 45° | 498.00 |
| MMD-22-089 | 668,972 | 5,378,560 | 428 | 314° | -51° | 497.90 |
| MMD-22-091 | 669,172 | 5,378,762 | 431 | 332° | -49° | 494.30 |
| MMD-22-093 | 669,018 | 5,378,463 | 430 | 289° | -50° | 651.00 |
| MMD-22-095 | 669,090 | 5,378,690 | 428 | 345° | -45° | 420.00 |
| Approximate collar coordinates in NAD 83, Zone 15N |
Analytical and QA/QC Procedures
All samples were sent to ALS Geochemistry in Thunder Bay for preparation and analysis was performed in the ALS Vancouver analytical facility. ALS is accredited by the Standards Council of Canada (SCC) for the Accreditation of Mineral Analysis Testing Laboratories and CAN-P-4E ISO/IEC 17025. Samples were analyzed for gold via fire assay with an AA finish (“Au-AA23”) and 48 pathfinder elements via ICP-MS after four-acid digestion (“ME-MS61”). Samples that assayed over 10 ppm Au were re-run via fire assay with a gravimetric finish (“Au-GRA21”).
In addition to ALS quality assurance / quality control (“QA/QC”) protocols, Goldshore has implemented a quality control program for all samples collected through the drilling program. The quality control program was designed by a qualified and independent third party, with a focus on the quality of analytical results for gold. Analytical results are received, imported to our secure on-line database and evaluated to meet our established guidelines to ensure that all sample batches pass industry best practice for analytical quality control. Certified reference materials are considered acceptable if values returned are within three standard deviations of the certified value reported by the manufacture of the material. In addition to the certified reference material, certified blank material is included in the sample stream to monitor contamination during sample preparation. Blank material results are assessed based on the returned gold result being less than ten times the quoted lower detection limit of the analytical method. The results of the on-going analytical quality control program are evaluated and reported to Goldshore by Orix Geoscience Inc.
About Goldshore
Goldshore is an emerging junior gold development company, and owns 100% of the Moss Lake Gold Project located in Ontario. Wesdome is currently a large shareholder of Goldshore with an approximate 22% equity position in the Company. Well-financed and supported by an industry-leading management group, board of directors and advisory board, Goldshore is positioned to advance the Moss Lake Gold Project through the next stages of exploration and development.
Peter Flindell, P.Geo., MAusIMM, MAIG, Vice President – Exploration of the Company, a qualified person under NI 43-101 has approved the scientific and technical information contained in this news release.
Neither the TSXV nor its Regulation Services Provider (as that term is defined in the policies of the TSXV) accepts responsibility for the adequacy or accuracy of this release.
For More Information – Please Contact:
Brett A. Richards
President, Chief Executive Officer and Director
Goldshore Resources Inc.
P. +1 604 288 4416 M. +1 905 449 1500
E. brichards@goldshoreresources.com
W. www.goldshoreresources.com
Facebook: GoldShoreRes | Twitter: GoldShoreRes | LinkedIn: goldshoreres
Cautionary Note Regarding Forward-Looking Statements
This news release contains statements that constitute “forward-looking statements.” Such forward looking statements involve known and unknown risks, uncertainties and other factors that may cause the Company’s actual results, performance or achievements, or developments to differ materially from the anticipated results, performance or achievements expressed or implied by such forward-looking statements. Forward looking statements are statements that are not historical facts and are generally, but not always, identified by the words “expects,” “plans,” “anticipates,” “believes,” “intends,” “estimates,” “projects,” “potential” and similar expressions, or that events or conditions “will,” “would,” “may,” “could” or “should” occur. Forward-looking statements in this news release include, among others, statements relating to: expectations regarding the exploration and development of the Moss Lake Gold Project; an updated mineral resource estimate and the timing thereof; completion of a PEA and the timing thereof, and other statements that are not historical facts.
By their nature, forward-looking statements involve known and unknown risks, uncertainties and other factors which may cause our actual results, performance or achievements, or other future events, to be materially different from any future results, performance or achievements expressed or implied by such forward-looking statements. Such factors and risks include, among others: the Company may require additional financing from time to time in order to continue its operations which may not be available when needed or on acceptable terms and conditions acceptable; compliance with extensive government regulation; domestic and foreign laws and regulations could adversely affect the Company’s business and results of operations; the stock markets have experienced volatility that often has been unrelated to the performance of companies and these fluctuations may adversely affect the price of the Company’s securities, regardless of its operating performance; and the impact of COVID-19.
The forward-looking information contained in this news release represents the expectations of the Company as of the date of this news release and, accordingly, is subject to change after such date. Readers should not place undue importance on forward-looking information and should not rely upon this information as of any other date. The Company undertakes no obligation to update these forward-looking statements in the event that management’s beliefs, estimates or opinions, or other factors, should change.
This news release does not constitute an offer to sell, or a solicitation of an offer to buy, any securities in the United States. The securities have not been and will not be registered under the United States Securities Act of 1933, as amended (the “U.S. Securities Act”) or any state securities laws and may not be offered or sold within the United States or to U.S. Persons unless registered under the U.S. Securities Act and applicable state securities laws or an exemption from such registration is available.

To view the source version of this press release, please visit https://www.newsfilecorp.com/release/153300