VANCOUVER, British Columbia, June 21, 2022 (GLOBE NEWSWIRE) — Millrock Resources Inc. (TSX-V: MRO, OTCQB: MLRKF) (“Millrock” or the “Company”) reports that it has entered into a Loan Agreement with Redplug Capital Corporation. The loan is in the amount of $500,000 and will be used for general working capital. Millrock intends to repay the loan within the coming year by 1) liquidation of shares that it holds in other companies, 2) sale of royalty interests, and/or 3) from proceeds that may be realized on sale or purchase agreements concerning Millrock mineral exploration projects. The term of the loan is one year. Interest for the first six months of the loan is 6.0% per annum and thereafter at 12.0% per annum. Additionally, Millrock will pay the Redplug Capital Corporation 2,000,000 bonus shares of the Company upon acceptance of the TSX Venture Exchange.
Millrock President & CEO, Gregory Beischer, commented: “Millrock has found itself in a tight financial position at a time when market conditions limit our ability to raise further operating funds. In any event, an equity financing at the current share price would be highly dilutive to existing shareholders. At the same time, Millrock has many catalysts that have potential to drive the Company’s share price higher. More than 18,000 metres of drilling has been planned and budgeted at several projects in which Millrock has an interest. All the funds for these drilling programs come from partner companies. Additionally, Millrock is closing in on option agreements on other projects that could bring more cash into the company treasury. Shareholders that have invested in Millrock over the past few years have looked forward to the big year of drilling underway in 2022. Millrock has determined that it is best not to incur excessive dilution by equity financing at this particular juncture. The less dilutive loan transaction will allow operations to continue in the short term. Potential asset sales will cover longer term needs while results of ongoing drilling programs unfold. We are hopeful that results of the drilling programs will make an equity financing under more favourable and less dilutive terms later in 2022 possible. We think all the drilling programs have a good chance at making gold discoveries.”
Qualified Person The scientific and technical information disclosed within this document has been prepared, reviewed, and approved by Gregory A. Beischer, President, CEO, and a director of Millrock Resources. Mr. Beischer is a qualified person as defined in NI 43-101.
About Millrock Resources Inc. Millrock Resources Inc. is a premier project generator to the mining industry. Millrock identifies, packages, and operates large-scale projects for joint venture, thereby exposing its shareholders to the benefits of mineral discovery without the usual financial risk taken on by most exploration companies. The company is recognized as the premier generative explorer in Alaska, holds royalty interests in British Columbia, Canada, and Sonora State, Mexico, is a significant shareholder of junior explorer ArcWest Exploration Inc., and owns a large shareholding in each of Resolution Minerals Limited and Felix Gold Limited. Funding for drilling at Millrock’s exploration projects is primarily provided by its joint venture partners. Business partners of Millrock have included some of the leading names in the mining industry: EMX Royalty, Coeur Explorations, Centerra Gold, First Quantum, Teck, Kinross, Vale, Inmet, and Altius, as well as junior explorers Resolution, Riverside, PolarX, Felix Gold and Tocvan.
ON BEHALF OF THE BOARD “Gregory Beischer” Gregory Beischer, President & CEO
FOR FURTHER INFORMATION, PLEASE CONTACT: Melanee Henderson, Investor Relations Toll-Free: 877-217-8978 | Local: 604-638-3164 Twitter | Facebook | LinkedIn
Some statements in this news release may contain forward-looking information (within the meaning of Canadian securities legislation) including without limitation the intention of partner companies to complete all the planned drilling they have indicated, the sale of Millrock assets, that Millrock has many catalysts that have potential to drive the Company’s share price higher, that Millrock is closing in on option agreements on other projects that could bring more cash into the company treasury, that potential asset sales will cover longer term needs, that all the drilling programs have a good chance at making gold discoveries, and the possibility of share price increase upon receipt of future drilling results. These statements address future events and conditions and, as such, involve known and unknown risks, uncertainties and other factors which may cause the actual results, performance or achievements to be materially different from any future results, performance or achievements expressed or implied by the statements. Such factors include, without limitation, customary risks of the resource industry and the risk factors identified in Millrock’s management’s discussion and analysis for the three-month period ended March 31, 2022, which is available under Millrock’s profile on SEDAR at www.sedar.com. Forward-looking statements speak only as of the date those statements are made. Except as required by applicable law, Millrock assumes no obligation to update or to publicly announce the results of any change to any forward-looking statement contained or incorporated by reference herein to reflect actual results, future events or developments, changes in assumptions or changes in other factors affecting the forward-looking statements. If Millrock updates any forward-looking statement(s), no inference should be drawn that it will make additional updates with respect to those or other forward-looking statements.
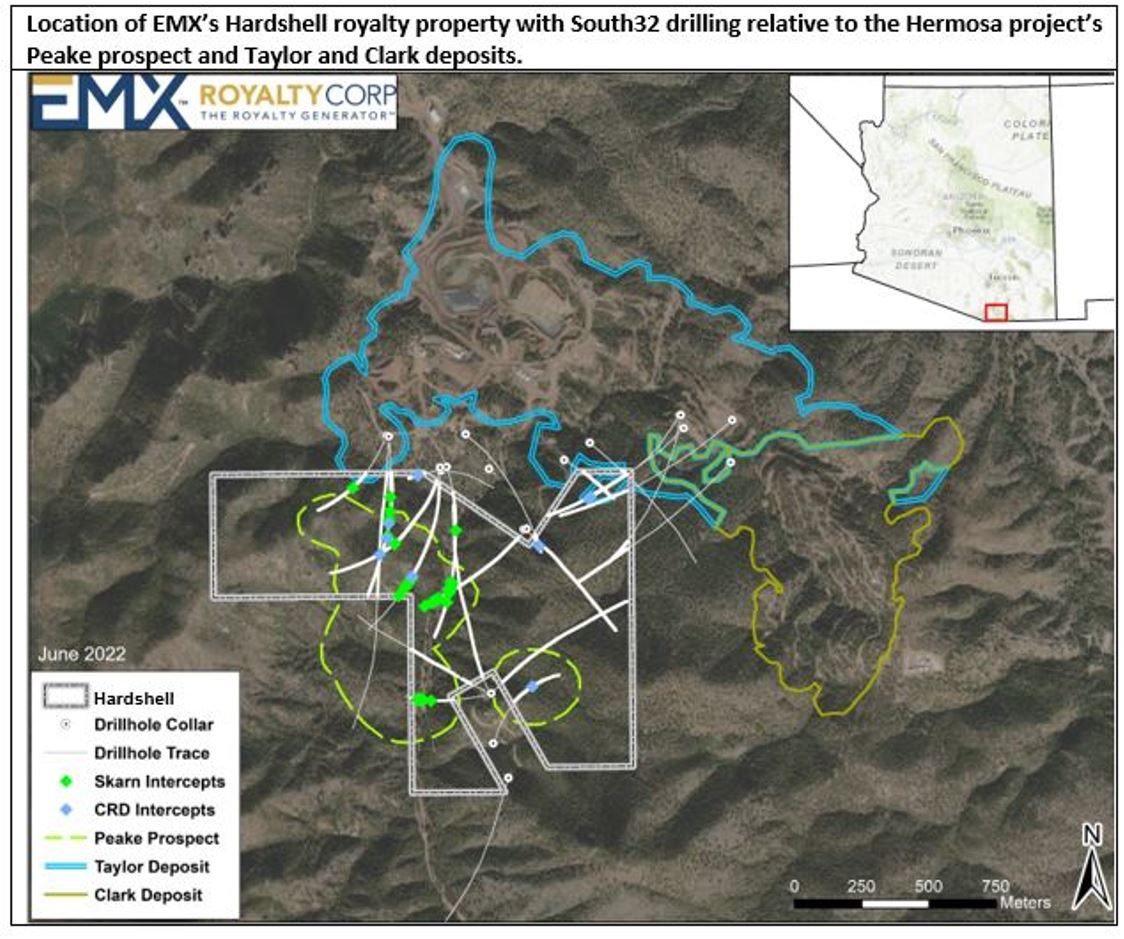
Vancouver, British Columbia–(Newsfile Corp. – June 21, 2022) – EMX Royalty Corporation (NYSE American: EMX) (TSXV: EMX) (FSE: 6E9) (the “Company” or “EMX”) is pleased to announce drill results from EMX’s Hardshell royalty property at a new exploration target, named the Peake prospect, which is part of South32 Limited’s Hermosa project in southeast Arizona (Figure 1). Hermosa also includes the feasibility stage Taylor lead-zinc-silver deposit situated directly north of EMX’s royalty claim block (see map in Appendix 1). EMX retains a 2% net smelter return (“NSR”) royalty on Hardshell that is not capped nor subject to buy down.
Drill results from Peake, which is partially covered by the Hardshell royalty, include copper-enriched skarn type mineralized intercepts of 76.5 meters (1,308.2-1,384.7 m) averaging 1.52% copper, 0.2% zinc, 0.4% lead, and 25 g/t silver in hole HDS-552, as well as 73.8 meters (1,386.8-1,460.6 m) averaging 1.06% copper, 0.5% zinc, 0.7% lead, and 67 g/t silver in HDS-661. In addition, intercepts more typical of Taylor carbonate replacement deposit (“CRD”) style mineralization include 9.8 meters (966.2-976.0 m) averaging 0.69% copper, 12.2% zinc, 8.2% lead, and 77 g/t silver in HDS-353. South32’s geological model indicates the potential for Peake to host a structurally and lithologically controlled mineralized skarn system that connects to the Taylor CRD mineralization.
EMX’s Hardshell royalty was organically generated by the Company’s wholly-owned subsidiary Bronco Creek Exploration Inc. (“BCE”). BCE recognized the alteration and mineralization zoning patterns within the district, and staked prospective open ground. Hardshell was optioned in 2015 for a 2% NSR retained royalty interest. The Hermosa project, including Hardshell, was subsequently acquired by South32 in 2018. South32 has steadily advanced Hermosa, which now includes the step-out exploration drilling that has delineated Peake. The Peake mineralization covered by the Hardshell royalty highlights the discovery optionality within EMX’s royalty portfolio.
Discussion of Drill Results. South32’s drilling at Hardshell has focused on the copper-rich skarn mineralization at the Peake prospect, but has also intersected potential extensions of the Taylor CRD system. Peake consists of copper-lead-zinc-silver mineralization delineated as a 1,200 meter by 550 meter, west-northwest trending zone of variable thickness at depths of 1,300 to 1,500 meters. South32 is following up on the Peake drill results as part of its Hermosa exploration programs, and has directed US$13 million to its exploration programs at Hermosa in the nine months ended March 2022.1
EMX’s royalty covers much of the currently known extents of the Peake prospect, and South32 has provided EMX a database with ~23,300 meters of angled diamond drilling from within the Hardshell royalty footprint. Select intercepts are summarized in Table 1. Copper-enriched skarn intercepts are reported at a 0.2% copper cutoff, reflecting the early-stage nature of exploration and evaluation of the Peake prospect. CRD style intercepts are reported at a 2.0% zinc equivalent (“ZnEq”) cutoff, reflecting the current feasibility stage of evaluation for the Taylor deposit.
Table 1. Select drill intercepts from EMX’s Hardshell royalty property.
Skarn intercepts in green and CRD intercepts in light blue. ZnEq cutoff calculated using metal prices of Zn (US$2,695/t), Pb (US$1,992/t), and Ag (US$25.50/oz) and recoveries of Zn (90%), Pb (91%) and Ag (81%). Cu was NOT included in the ZnEq calculation. True widths are approximately 65-85% of the reported interval lengths. *Note: HDS-661 missing data from 1563.4 meters to EOH.
Figure 1. EMX’s Hardshell royalty property and South32 drill intercepts.
Hermosa Project and Hardshell Royalty Property Overview. South32’s Hermosa project, located in the Patagonia mining district of southeastern Arizona, includes CRD sulfide (i.e., Taylor) and oxide (i.e., Clark) deposits (which are not covered by EMX’s Hardshell royalty), as well as the Peake skarn prospect (partially covered by EMX’s Hardshell royalty). In a July 21, 2021 Public Report titled “Hermosa Project – Mineral Resource Estimate Update” South32 disclosed a JORC (2012) Mineral Resource estimate for Taylor at a US$80/dmt NSR cutoff as a) 29 Mtonnes @ 4.10% Zn, 4.05% Pb, and 57 g/t Ag Measured, b) 86 Mtonnes @ 3.76% Zn, 4.44% Pb, and 86 g/t Ag Indicated, c) and 24 Mtonnes @ 3.73% Zn, 3.82% Pb, and 91 g/t Ag Inferred.2 The resource estimate was prepared by M. Hastings, MAusIMM, of SRK Consulting (US), a Competent Person in accordance with the requirements of the JORC Code. JORC is an “acceptable foreign code” under NI 43-101 for disclosure of mineral resources and mineral reserves.
In a January 17, 2022 Public Report, South32 announced an update to the Hermosa project with the completion of a pre-feasibility study on the Taylor deposit and a scoping study for the Clark deposit.3 South32 also stated that 1) Taylor had moved to the feasibility stage of evaluation with a final investment decision expected by mid-2023, and 2) shaft development is expected to commence in FY2024, subject to a final investment decision and receipt of required permits.
EMX’s Hardshell 2% NSR royalty property consists of 16 unpatented federal lode mining claims that are included as part of South32’s Hermosa project. Mineralization is primarily hosted within a sequence of dipping upper Paleozoic (i.e., Pennsylvanian-Permian) carbonate sedimentary rocks adjacent to the Sunnyside porphyry system which is being explored by Barksdale Resources. The delineation of the Peake prospect by South32 represents the potential to create significant value for the Company’s Hardshell royalty property. EMX looks forward to South32’s continued exploration success at Hardshell, as well as from the greater Hermosa project.
Comments on Adjacent Properties. The adjacent properties, which include South32’s Taylor deposit and Barksdale’s Sunnyside Project, provide geological context for the Peake prospect, which is partially covered by EMX’s Hardshell royalty claim block. However, this is not necessarily indicative that the Hardshell royalty claim block represents similar tonnages or grades of mineralization as at the Taylor deposit, nor a similar style of mineralization as the Sunnyside porphyry.
Qualified Person. Michael P. Sheehan, CPG, a Qualified Person as defined by National Instrument 43-101 and employee of the Company, has reviewed, verified and approved the disclosure of the technical information contained in this news release.
About EMX. EMX is a precious, base and battery metals royalty company. EMX’s investors are provided with discovery, development, and commodity price optionality, while limiting exposure to risks inherent to operating companies. The Company’s common shares are listed on the NYSE American Exchange and TSX Venture Exchange under the symbol “EMX”, and also trade on the Frankfurt exchange under the symbol “6E9”. Please see www.EMXroyalty.com for more information.
Neither the TSX Venture Exchange nor its Regulation Services Provider (as that term is defined in policies of the TSX Venture Exchange) accepts responsibility for the adequacy or accuracy of this release
Forward-Looking Statements
This news release may contain “forward-looking statements” that reflect the Company’s current expectations and projections about its future results. These forward-looking statements may include statements regarding perceived merit of properties, exploration results and budgets, mineral reserves and resource estimates, work programs, capital expenditures, timelines, strategic plans, market prices for precious and base metal, or other statements that are not statements of fact. When used in this news release, words such as “estimate,” “intend,” “expect,” “anticipate,” “will”, “believe”, “potential” and similar expressions are intended to identify forward-looking statements, which, by their very nature, are not guarantees of the Company’s future operational or financial performance, and are subject to risks and uncertainties and other factors that could cause the Company’s actual results, performance, prospects or opportunities to differ materially from those expressed in, or implied by, these forward-looking statements. These risks, uncertainties and factors may include, but are not limited to unavailability of financing, failure to identify commercially viable mineral reserves, fluctuations in the market valuation for commodities, difficulties in obtaining required approvals for the development of a mineral project, increased regulatory compliance costs, expectations of project funding by joint venture partners and other factors.
Readers are cautioned not to place undue reliance on these forward-looking statements, which speak only as of the date of this news release or as of the date otherwise specifically indicated herein. Due to risks and uncertainties, including the risks and uncertainties identified in this news release, and other risk factors and forward-looking statements listed in the Company’s MD&A for the quarter ended March 31, 2022 (the “MD&A”), and themost recently filed Annual Information Form (“AIF”) for the year ended December 31, 2021, actual events may differ materially from current expectations. More information about the Company, including the MD&A, the AIF and financial statements of the Company, is available on SEDAR at www.sedar.com and on the SEC’s EDGAR website at www.sec.gov.
Appendix 1
Location of EMX’s Hardshell royalty property with South32 drilling relative to the Hermosa project’s Peake prospect and Taylor and Clark deposits.
Joining us for a conversation is Jayant Bhandari the Founder of Capitalism and Morality and highly sought out advisor to institutional investors. As we will travel the globe today to get some insights on geopolitical events that are taking shape that may impact you, along with some arbitrage opportunities for your portfolio, and see how philosophy impacts the aforementioned
NEW YORK, June 10, 2022 (GLOBE NEWSWIRE) — Virtual Investor Conferences, the leading proprietary investor conference series, today announced the agenda for the upcoming OTCQX Best 50 Companies Virtual Investor Conference to be held on June 16 th . Individual investors, institutional investors, advisors, and analysts are invited to attend. The program begins at 9:30 AM ET on Thursday, June 16th.
It is recommended that investors pre-register and run the online system check to expedite participation and receive event updates. There is no cost to log-in, attend live presentations and schedule 1×1 meetings.
“We are delighted to welcome ten of our OTCQX Best 50 companies participating in our upcoming Virtual Investor Conference,” said Jason Paltrowitz, OTC Markets Group EVP of Corporate Services. “We are proud to highlight the impressive efforts of these companies which span a range of industries including Technology, Metals & Mining, Industrial Goods, Financials and more.”
To facilitate investor relations scheduling and to view a complete calendar of Virtual Investor Conferences, please visit www.virtualinvestorconferences.com .
About Virtual Investor Conferences ®
Virtual Investor Conferences (VIC) is the leading proprietary investor conference series that provides an interactive forum for publicly traded companies to seamlessly present directly to investors.
Providing a real-time investor engagement solution, VIC is specifically designed to offer companies more efficient investor access. Replicating the components of an on-site investor conference, VIC offers companies enhanced capabilities to connect with investors, schedule targeted one-on-one meetings and enhance their presentations with dynamic video content. Accelerating the next level of investor engagement, Virtual Investor Conferences delivers leading investor communications to a global network of retail and institutional investors.
In twenty-first-century America, ordinary people are at the mercy of well-paid, unelected government experts who wield vast power. That is, we live in the age of the technocrats: people who claim to have special wisdom that entitles them to control, manipulate, and manage society’s institutions using the coercive power of the state.
We’re told these people are “nonpolitical” and will use their impressive scientific knowledge to plan the economy, public health, public safety, or whatever goal the regime has decided the technocrats will be tasked with bringing about.
These people include central bankers, Supreme Court justices, “public health” bureaucrats, and Pentagon generals. The narrative is that these people are not there to represent the public or bow to political pressure. They’re just there to do “the right thing” as dictated by economic theory, biological sciences, legal theory, or the study of military tactics.
We’re also told that in order to allow these people to act as the purely well-meaning apolitical geniuses they are, we must give them their independence and not question their methods or conclusions.
We were exposed to this routine yet again last week as President Joe Biden announced he will “respect the Fed’s independence” and allow the central bankers to set monetary policy without any bothersome interference from the representatives of the taxpayers who pay all the bills and who primarily pay the price when central bankers make things worse. (Biden, of course, didn’t mention that central bankers have been spectacularly wrong about the inflation threat in recent years, with inflation rates hitting forty-year highs, economic growth going negative, and consumer credit piling up as families struggle to cope with the cost of living.)
Conveniently, Biden’s deferral to the Fed allows him to blame it later when economic conditions get even worse. Nonetheless, his placing the economy in the hands of alleged experts will no doubt appear laudable to many. This is because the public has long been taught by public schools and media outlets that government experts should have the leeway to exercise vast power in the name of “fixing” whatever problems society faces.
The Expert Class as a Tool for State Building
The success of this idea represents a great victory for progressive ideology. Progressives have long been committed to creating a special expert class as a means of building state power. In the United States, for example, the cult of expertise really began to take hold in the late nineteenth and early twentieth centuries, and it led directly to support for more government intervention in the private sector. As Maureen Flanagan notes in “Progressives and Progressivism in an Era of Reform,”
Social science expertise gave political Progressives a theoretical foundation for cautious proposals to create a more activist state…. Professional social scientists composed a tight circle of men who created a space between academia and government from which to advocate for reform. They addressed each other, trained their students to follow their ideas, and rarely spoke to the larger public.
These men founded new organizations—such as the American Economics Association—to promote this new class of experts and their plans for a more centrally planned society. Ultimately, the nature of the expert class was revolutionary. The new social scientists thought they knew better than the patricians, religious leaders, local representatives, and market actors who had long shaped local institutions. Instead,
Progressives were modernizers with a structural-instrumentalist agenda. They rejected reliance on older values and cultural norms to order society and sought to create a modern reordered society with political and economic institutions run by men qualified to apply fiscal expertise, businesslike efficiency, and modern scientific expertise to solve problems and save democracy. The emerging academic disciplines in the social sciences of economics, political economy and political science, and pragmatic education supplied the theoretical bases for this middle-class expert Progressivism.
The Progressive impulse for expertise-based rule was perhaps exemplified by the Progressive transportation planner Emory Johnson, who advocated for a strong federal executive branch that would be resistant to political pressure while relying on the supposedly “scientific” judgments of government planners and other bureaucrats. Johnson
explicitly took up the question of the role of expertise in the American state…. he maintained that success relied upon what he termed “executive functions.” He sought to empower the federal government’s executive branch as experts’ natural home.1
In the Progressive view, business leaders and machine politicians lacked a rational and broad view of the needs of society. In contrast, the government experts would approach society’s problems as scientists. Johnson felt this model already somewhat existed in the Department of War, where Johnson imagined the secretary of war was “quite free from political pressure and [relied] on the counsel of the engineers.” Johnson imagined that these science-minded bureaucrats could bring a “really economic and scientific application” of policy.2
“Disinterested” Central Planners
Johnson was part of a wave of experts and intellectuals attempting to develop “a new realm of state expertise” that favored apolitical technocrats who would plan the nation’s infrastructure and industry.2 Many historians have recognized that these efforts were fundamentally “state-building activities … [and that] their emergence marked and symbolized a watershed in which an often-undemocratic new politics of administration and interest groups displaced the nineteenth century’s partisan, locally oriented public life” (emphasis added).3
In short, these efforts sowed the seeds for the idealized technocracy we have today: unresponsive to the public and imbued with vast coercive power that continually displaces private discretion and private prerogatives.
Indeed, the Progressive devotion to expertise followed “the core pattern of Progressive politics,” which is “the redirection of decision making upward within bureaucracies.”4 Thus, in contrast to the populist political institutions of an earlier time, decision-making in the Progressive Era became more white-collar, more middle class—as opposed to the working-class party workers—and more hierarchical within bureaucracies directly controlled by the state’s executive agencies.
Although Progressives thought of themselves as the saviors of democracy, they nonetheless recognized the conflict between their professed democratic ideals and a reliance on experts:
[Progressives] reconciled the conflict between using hierarchical bureaucracy to seek efficiency and dispersing power to achieve equality by depicting bureaucratic systems as safeguards of public order…. Since authority flowed from supposedly disinterested facts and “scientific” expertise, bureaucratic systems were presented by their champions as objective, coherent, and essentially democratic structures.5
This idealized notion of the “disinterested expert” formed a key component of the Progressive agenda:
Progressive reformers proposed an antidote to the corruption of patronage politics, emphasizing disinterested experts and rationalized administration: a city council would appoint an executive officer, the city manager, who would in turn appoint qualified lieutenants to assist him. The rationalized and centralized bureaucracies presided over by city managers would be run “scientifically,” meaning objectively, insulated from patronage politics.6
Who Should Rule?
In many ways, then, this aspect of Progressive ideology turned the political agenda oflaissez-faire classical liberalism on its head. Liberals of the Jeffersonian and Jacksonian variety had sought to increase outside political influence in the policy-making process through elections and the appointment of party activists loyal to elected representatives. This was because liberals feared that an insulated class of government experts would function more in its own interests than those of the taxpayers.
The Progressives, however, imagined they could create a disinterested nonpolitical class of experts devoted only to objective science. The fundamental question, then, became who should rule: insulated experts or nonexpert representatives with closer ties to the taxpayers.
We can see today that the Progressives largely succeeded in granting far greater power to today’s technocratic class of experts. The technocrats are praised for their allegedly scientific focus, and we are told to respect their independence.
If the goal was ever to protect public checks on state power, however, this was always an unworkable ideal. By creating a special class of expert bureaucrats with decades-long careers within the regime itself, we are simply creating a new class of officials able to wield state power with little accountability. Anyone with a sufficiently critical view of state power could see the danger in this. Interestingly, it was anarcho-communist Mikhail Bakunin who recognized the impossibility of solving the problem of state power by putting scientific experts in charge. Such a move only represented a transfer of power from one group to another. Bakunin warned:
The State has always been the patrimony of some privileged class or other; a priestly class, an aristocratic class, a bourgeois class, and finally a bureaucratic class.
Moreover, state bureaucratic efforts to plan society from the center, Bakunin noted,
will demand an immense knowledge and many “heads overflowing with brains” in this government. It will be the reign of scientific intelligence, the most aristocratic, despotic, arrogant, and contemptuous of all regimes. There will be a new class, a new hierarchy of real and pretended scientists and scholars.
It is not necessary, of course, to have full-blown socialism to create this “new class.” The modern state with its mixed economy in most cases already has all the bureaucratic infrastructure necessary to make this a reality. As long as we defer to this ruling class of “scientists and scholars,” the Progressives have won.
1.Drew VandeCreek, “Emory Johnson and the Rise of Economic Expertise in the Progressive State, 1898-1913,” Journal of the Gilded Age and Progressive Era 17, no. 2 (April 2018): 276–96, esp. 279.
4.Heather A. Haveman, Srikanth Parachuri, and Hayagreeva Rao, “The Winds of Change: The Progressive Movement and the Bureaucratization of Thrift,” American Sociological Review 72, no. 1 (February 2007): 117–42, esp. 125.
Ryan McMaken (@ryanmcmaken) is a senior editor at the Mises Institute. Send him your article submissions for the Mises Wire and Power and Market, but read article guidelines first. Ryan has a bachelor’s degree in economics and a master’s degree in public policy and international relations from the University of Colorado. He was a housing economist for the State of Colorado. He is the author of Commie Cowboys: The Bourgeoisie and the Nation-State in the Western Genre.
Dolly Varden Silver Corporation is a mineral exploration company focused on advancing its 100% held Kitsault Valley Project located in the Golden Triangle of British Columbia, Canada, 25kms by road to deep tide water. The 163 sq. km. project hosts the high-grade silver and gold resources of Dolly Varden and Homestake Ridge along with the past producing Dolly Varden and Torbrit silver mines.
It is considered to be prospective for hosting further precious metal deposits, being on the same structural and stratigraphic belts that host numerous other, on-trend, high-grade deposits, such as Eskay Creek and Brucejack. The project also contains the Big Bulk property which is prospective for porphyry and skarn style copper and gold mineralization, similar to other such deposits in the region (Red Mountain, KSM, Red Chris).
Total Width of the Main Zone Expands from 300m-350m to 600m-650m
Vancouver, British Columbia–(Newsfile Corp. – June 14, 2022) – Goldshore Resources Inc. (TSXV: GSHR) (OTCQB: GSHRF) (FSE: 8X00) (“Goldshore” or the “Company“), is pleased to announce assay results from its ongoing 100,000-meter drill program at the Moss Lake Project in Northwest Ontario, Canada. Drilling is aiming to expand and better define high-grade structural zones within the Moss Lake deposit to improve the overall grade and volume beyond that of the historic mineral resource.
Highlights:
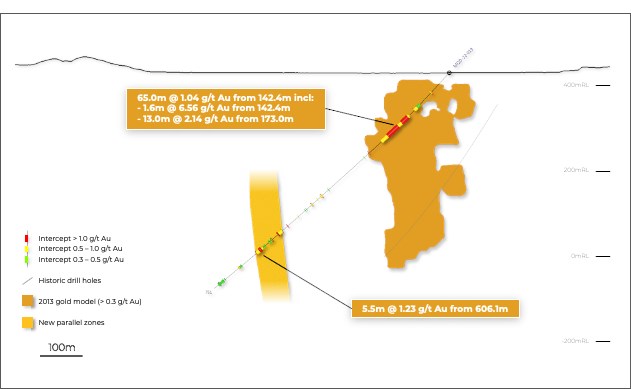
MQD-22-019 at the QES Zone, has upgraded the mineralization within the modeled volume and confirmed the parallel zone of mineralization to the north with best intercepts of:
65.0m @ 1.04 g/t Au from 142.4m depth, including
1.6m @ 6.56 g/t Au from 142.4m and
13.0m @ 2.14 g/t Au from 173.0m
5.5m @ 1.23 g/t Au from 606.1m
A recent evaluation of assay zones parallel to the 2013 resource body has enabled the preliminary modelling of shears that combine to extend the width of mineralization from its previous 300-400 meters to a zone that is 600-650 meters wide.
This work suggests that the Southwest Zone is not a structural offset as previously thought and is instead an extension of the southern parallel zone, compounding additional resource tonnage (in width) and along strike.
Exploration work has begun targeting additional parallel structures to further expand the width of gold mineralization.
President and CEO Brett Richards stated: “As we have demonstrated since the beginning of our drill program, our thesis that Moss Lake is larger (in depth, in width and along strike) is proving to be true. I am also encouraged about the high grade sections we are seeing, as this will provide us with optionality when we model the resource later in the year and start to look at economic pit shells. We see several PEA permutations including: a low tonnage / higher grade starting project (Phase 1); and a larger scale operation on the global resource (Phase 2). Given the current economic climate (high/hyper inflationary economy), a lower CapEx project (Phase 1) then expanding the operation (Phase 2) may well be the best approach to developing Moss Lake, while not losing sight of our Tier One potential. We will make these determinations later in the year, as we evaluate the results from our 100,000m program.”
Technical Overview
Table 1 shows the significant intercepts calculated from recently received drill hole results. Figure 1 shows a cross section through MQD-22-019. Table 2 and Figure 2 show the drill hole locations.
Table 1: Significant downhole gold intercepts
HOLE ID
FROM
TO
LENGTH (m)
TRUE WIDTH (m)
CUT GRADE (g/t Au)
UNCUT GRADE (g/t Au)
MQD-22-019
62.70
64.70
2.00
1.4
0.85
0.85
102.00
120.50
18.50
12.9
0.36
0.36
137.00
227.00
90.00
65.8
0.85
0.85
including
142.40
207.40
65.00
47.5
1.04
1.04
including
142.40
144.00
1.60
1.2
6.56
6.56
and
173.00
186.00
13.00
9.5
2.14
2.14
415.50
419.75
4.25
3.2
0.65
0.65
445.40
448.40
3.00
2.2
0.54
0.54
546.00
554.00
8.00
6.0
0.79
0.79
including
552.00
554.00
2.00
1.5
2.31
2.31
572.15
574.90
2.75
2.1
0.49
0.49
601.00
621.25
20.25
15.5
0.52
0.52
including
606.10
611.60
5.50
4.2
1.23
1.23
667.00
676.00
9.00
7.0
0.45
0.45
722.00
738.00
16.00
12.4
0.32
0.32
MMD-22-026
47.00
59.95
12.95
9.8
0.71
0.71
72.70
79.00
6.30
4.8
0.56
0.56
90.10
94.25
4.15
3.1
0.56
0.56
121.65
155.70
34.05
26.1
0.54
0.54
including
149.00
155.70
6.70
5.1
1.50
1.50
308.55
324.65
16.10
12.7
0.78
0.78
including
312.00
315.00
3.00
2.4
2.25
2.25
403.35
410.80
7.45
5.9
0.36
0.36
566.00
570.00
4.00
3.3
0.38
0.38
MMD-22-029
60.00
83.70
23.70
18.4
0.31
0.31
193.00
230.00
37.00
29.5
0.49
0.49
including
210.00
212.00
2.00
1.6
1.69
1.69
and
225.00
230.00
5.00
4.0
1.71
1.71
250.40
263.85
13.45
10.7
0.32
0.32
276.25
286.00
9.75
7.9
0.74
0.74
298.00
304.00
6.00
4.9
0.31
0.31
309.70
317.70
8.00
6.5
0.42
0.42
344.00
351.00
7.00
5.7
0.33
0.33
594.95
608.00
13.05
10.8
0.34
0.34
Intersections calculated above a 0.3 g/t Au cut off with a top cut of 30 g/t Au and a maximum internal waste interval of 10 metres. italicized intervals are intersections calculated above a 1.0 g/t Au cut off. Intervals in bold are those with a grade thickness factor exceeding 20 gram x metres / tonne gold. True widths are approximate and assume a subvertical body.
Figure 1: Drill section through MQD-22-019 showing mineralized intercepts relative to the 2013 grade model and the new parallel zone to the north
MQD-22-019 was drilled to the west of the high grade holes MQD-22-009 and MQD-22-014 reported on January 28, 2022 and May 5, 2022, respectively. The results of this hole extend the envelope of +1 g/t Au mineralization further to the west in what appears to be a significant zone of high grade mineralization.
The deeper section of the hole confirmed gold mineralization in an anastomosing shear that is becoming a significant parallel zone. Drilling in the coming months will target the near surface extension of this zone, as well as the high-grade portion of the QES Zone.
Holes MMD-22-026 and -029 were drilled to test the patchily mineralized eastern extension of the Main Zone. These holes confirmed the nature of this part of the deposit and added valuable infill data. Structural data collected since the start of the drill program from our oriented core program that is used to correctly orient the structural controls in the deposit has allowed for a more detailed interpretation of the highly foliated zones controlling part of the Moss Lake Main Zone mineralization. These zones are believed to be part of several anastomosing shears encountered over a width of 600-650m.
Pete Flindell, VP Exploration for Goldshore, said, “I am very encouraged by the extent of the parallel zones that we are seeing at both the Main Zone and QES Zone at Moss Lake, as the greater width will reduce the amount of waste in an open pit; thereby improving the economics of the project. Historic scout drilling, previously thought to be unrelated to Moss Lake, suggests that additional parallel zones will be discovered. Furthermore, our understanding of the high grades in the deposit – whereby 29% of the mineralized samples exceed 1 g/t Au; is improving to the point where we will be able to model them separately to ensure that they are accurately represented in the mineral resource update later in the year. This will also enhance the economics by allowing the optimization of a smaller, high-grade starter pit.”
Analytical and QA/QC Procedures
All samples were sent to ALS Geochemistry in Thunder Bay for preparation and analysis was performed in the ALS Vancouver analytical facility. ALS is accredited by the Standards Council of Canada (SCC) for the Accreditation of Mineral Analysis Testing Laboratories and CAN-P-4E ISO/IEC 17025. Samples were analyzed for gold via fire assay with an AA finish (“Au-AA23”) and 48 pathfinder elements via ICP-MS after four-acid digestion (“ME-MS61”). Samples that assayed over 10 ppm Au were re-run via fire assay with a gravimetric finish (“Au-GRA21”).
In addition to ALS quality assurance / quality control (“QA/QC”) protocols, Goldshore has implemented a quality control program for all samples collected through the drilling program. The quality control program was designed by a qualified and independent third party, with a focus on the quality of analytical results for gold. Analytical results are received, imported to our secure on-line database and evaluated to meet our established guidelines to ensure that all sample batches pass industry best practice for analytical quality control. Certified reference materials are considered acceptable if values returned are within three standard deviations of the certified value reported by the manufacture of the material. In addition to the certified reference material, certified blank material is included in the sample stream to monitor contamination during sample preparation. Blank material results are assessed based on the returned gold result being less than ten times the quoted lower detection limit of the analytical method. The results of the on-going analytical quality control program are evaluated and reported to Goldshore by Orix Geoscience Inc.
About Goldshore
Goldshore is an emerging junior gold development company, and owns the Moss Lake Gold Project located in Ontario. Wesdome Gold Mines Ltd. is currently a strategic shareholder of Goldshore with an approximate 27% equity position in the Company. Well-financed and supported by an industry-leading management group, board of directors and advisory board, Goldshore is positioned to advance the Moss Lake Gold Project through the next stages of exploration and development.
About the Moss Lake Gold Project
The Moss Lake Gold Project is located approximately 100 km west of the city of Thunder Bay, Ontario. It is accessed via Highway 11 which passes within 1 km of the property boundary to the north. The Moss Lake Gold Project covers 14,292 hectares and consists of 282 unpatented and patented mining claims.
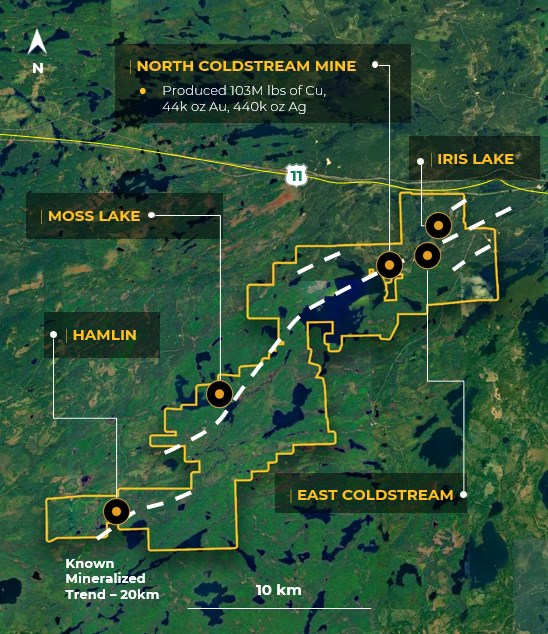
Moss Lake hosts a number of gold and base metal rich deposits including the Moss Lake Deposit, the East Coldstream Deposit (Table 3), the historically producing North Coldstream Mine (Table 4), and the Hamlin Zone, all of which occur over a mineralized trend exceeding 20 km in length. A historical preliminary economic assessment was completed on Moss Lake in 2013 and published by Moss Lake Gold1. A historical mineral resource estimate was completed on the East Coldstream Deposit in 2011 by Foundation Resources Inc2,3. In addition to these zones, the Moss Lake Gold Project also hosts a number of under-explored mineral occurrences which are reported to exist both at surface and in historically drilled holes. The Moss Lake Deposit is a shear-hosted disseminated-style gold deposit which outcrops at surface. It has been drilled over a 2.5 km length and to depths of 300 m with 376 holes completed between 1983 and 2017. The last drilling program conducted in 2016 and 2017 by Wesdome, which consisted of widely spaced holes along the strike extension of the deposit was successful in expanding the mineralized footprint and hydrothermal system 1.6 km to the northeast. Additionally, the deposit remains largely open to depth. In 2017, Wesdome completed an induced polarization survey which traced the potential extensions of pyrite mineralization associated with the Moss Lake Deposit over a total strike length of 8 km and spanning the entire extent of the survey grids.
The East Coldstream Deposit is a shear-hosted disseminated-style gold deposit which locally outcrops at surface. It has been drilled over a 1.3 km length and to depths of 200 m with 138 holes completed between 1988 and 2017. The deposit remains largely open at depth and may have the potential for expansion along strike. Historic drill hole highlights from the East Coldstream Deposit include 4.86 g/t Au over 27.3 m in C-10-15.
The historically producing North Coldstream Mine is reported to have produced significant amounts of copper, gold and silver4 from mineralization with potential iron-oxide-copper-gold deposit style affinity. The exploration potential immediately surrounding the historic mining area is not currently well understood and historic data compilation is required.
The Hamlin Zone is a significant occurrence of copper and gold mineralization, and also of potential iron-oxide-copper-gold deposit style affinity. Between 2008 and 2011, Glencore tested Hamlin with 24 drill holes which successfully outlined a broad and intermittently mineralized zone over a strike length of 900 m. Historic drill hole highlights from the Hamlin Zone include 0.9 g/t Au and 0.35% Cu over 150.7 m in HAM-11-75.
The Moss Lake, East Coldstream and North Coldstream deposits sit on a mineral trend marked by a regionally significant deformation zone locally referred to as the Wawiag Fault Zone in the area of the Moss Lake Deposit. This deformation zone occurs over a length of approximately 20 km on the Moss Lake Gold Project and there is an area spanning approximately 7 km between the Moss Lake and East Coldstream deposits that is significantly underexplored.
Table 3: Historical Mineral Resources1,2,3
INDICATED
INFERRED
Deposit
Tonnes
Au g/t
Au oz
Tonnes
Au g/t
Au oz
Moss Lake Deposit1 (2013 resource estimate)
Open Pit Potential
39,795,000
1.1
1,377,300
48,904,000
1.0
1,616,300
Underground Potential
–
–
–
1,461,100
2.9
135,400
Moss Lake Total
39,795,000
1.1
1,377,300
50,364,000
1.1
1,751,600
East Coldstream Deposit2 (2011 resource estimate)
East Coldstream Total
3,516,700
0.85
96,400
30,533,000
0.78
763,276
Combined Total
43,311,700
1.08
1,473,700
80,897,000
0.98
2,514,876
Notes:
(1) Source: Poirier, S., Patrick, G.A., Richard, P.L., and Palich, J., 2013. Technical Report and Preliminary Economic Assessment for the Moss Lake Project, 43-101 technical report prepared for Moss Lake Gold Mines Ltd. Moss Lake Deposit resource estimate is based on 0.5 g/t Au cut-off grade for open pit and 2.0 g/t Au cut-off grade for underground resources.
(2) Source: McCracken, T., 2011. Technical Report and Resource Estimate on the Osmani Gold Deposit, Coldstream Property, Northwestern Ontario, 43-101 technical report prepared for Foundation Resources Inc. and Alto Ventures Ltd. East Coldstream Deposit resource estimate is based on a 0.4 g/t Au cut-off grade.
(3) The reader is cautioned that the above referenced “historical mineral resource” estimates are considered historical in nature and as such is based on prior data and reports prepared by previous property owners. A qualified person has not done sufficient work to classify the historical estimates as current resources and Goldshore is not treating the historical estimates as current resources. Significant data compilation, re-drilling, re-sampling and data verification may be required by a qualified person before the historical estimate on the Moss Lake Gold Project can be classified as a current resource. There can be no assurance that any of the historical mineral resources, in whole or in part, will ever become economically viable. In addition, mineral resources are not mineral reserves and do not have demonstrated economic viability. Even if classified as a current resource, there is no certainty as to whether further exploration will result in any inferred mineral resources being upgraded to an indicated or measured mineral resource category.
Table 4: Reported Historical Production from the North Coldstream Deposit4
Deposit
Tonnes
Cu %
Au g/t
Ag
Cu lbs
Au oz
Ag oz
Historical Production
2,700,0000
1.89
0.56
5.59
102,000,000
44,000
440,000
Note::
(4) Source: Schlanka, R., 1969. Copper, Nickel, Lead and Zinc Deposits of Ontario, Mineral Resources Circular No. 12, Ontario Geological Survey, pp. 314-316.
Peter Flindell, MAusIMM, MAIG, Vice President – Exploration of the Company, a qualified person under NI 43-101 has approved the scientific and technical information contained in this news release.
Neither the TSXV nor its Regulation Services Provider (as that term is defined in the policies of the TSXV) accepts responsibility for the adequacy or accuracy of this release.
For More Information – Please Contact:
Brett A. Richards President, Chief Executive Officer and Director Goldshore Resources Inc.
This news release contains statements that constitute “forward-looking statements.” Such forward looking statements involve known and unknown risks, uncertainties and other factors that may cause the Company’s actual results, performance or achievements, or developments to differ materially from the anticipated results, performance or achievements expressed or implied by such forward-looking statements. Forward looking statements are statements that are not historical facts and are generally, but not always, identified by the words “expects,” “plans,” “anticipates,” “believes,” “intends,” “estimates,” “projects,” “potential” and similar expressions, or that events or conditions “will,” “would,” “may,” “could” or “should” occur.
Forward-looking statements in this news release include, among others, statements relating to expectations regarding the exploration and development of the Moss Lake Gold Project, and other statements that are not historical facts. By their nature, forward-looking statements involve known and unknown risks, uncertainties and other factors which may cause our actual results, performance or achievements, or other future events, to be materially different from any future results, performance or achievements expressed or implied by such forward-looking statements. Such factors and risks include, among others: the Company may require additional financing from time to time in order to continue its operations which may not be available when needed or on acceptable terms and conditions acceptable; compliance with extensive government regulation; domestic and foreign laws and regulations could adversely affect the Company’s business and results of operations; the stock markets have experienced volatility that often has been unrelated to the performance of companies and these fluctuations may adversely affect the price of the Company’s securities, regardless of its operating performance; and the impact of COVID-19.
The forward-looking information contained in this news release represents the expectations of the Company as of the date of this news release and, accordingly, is subject to change after such date. Readers should not place undue importance on forward-looking information and should not rely upon this information as of any other date. The Company undertakes no obligation to update these forward-looking statements in the event that management’s beliefs, estimates or opinions, or other factors, should change.
This news release does not constitute an offer to sell, or a solicitation of an offer to buy, any securities in the United States. The securities have not been and will not be registered under the United States Securities Act of 1933, as amended (the “U.S. Securities Act”) or any state securities laws and may not be offered or sold within the United States or to U.S. Persons unless registered under the U.S. Securities Act and applicable state securities laws or an exemption from such registration is available.
Geological Plan Map showing Drilling in Santa Barbara and Porco Areas with Holes referred to in this release highlighted.
Figure 2
3D Location of > 90 g Ag eq/t Grade Shell Model for Santa Barbara relative to the 3D Magnetic Susceptibility Inverse Model. The high-grade likely feeder zone at Santa Barbara extends approximately 750m along strike, is 650m wide and extends to a depth of at least 750m. The deposit is open in all directions.
Figure 3
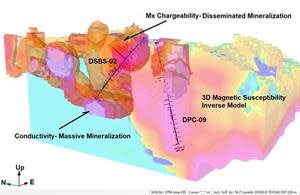
3D Model of Inverse Magnetic Susceptibility and BHIP Mx Chargeability and Conductivity, Iska Iska. Note that BHIP data is primarily only available in the Santa Barbara area.
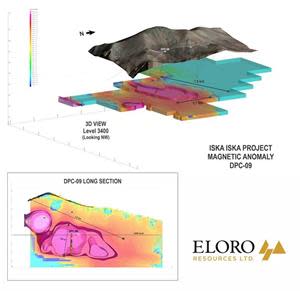
Figure 4
Strong inverse magnetic susceptibility anomaly in the Porco Area that extends for approximately 1.6km along strike by 700m wide with a vertical extent of approximately 750m.
Hole DSBS-02 was drilled across the interpreted Santa Barbara feeder zone to a length of 1,023.4m, corresponding to a vertical depth of 745m. Notably, 67% of the overall length of this hole yielded reportable intersections which collectively average 100.42 g Ag eq/t.
Grade shell modelling in Leapfrog of the Santa Barbara Deposit indicates that, as of this date, drilling has defined a higher-grade zone >90 g Ag eq/t that is approximately 750m along strike, 650m wide and extends to a depth of at least 750m. This deposit remains open in all directions.
Hole DPC-09, the first of a series of holes to test the major inverse magnetic susceptibility anomaly in the Porco area, intersected 41 reportable mineralized intersections representing 29% of this 1,124.4m long hole that collectively average 94.73 g Ag eq/t. Significantly, the last reportable intersection near the bottom of this hole is higher in Ag and Sn with very low values of Zn and Pb. This is typical of what is seen in the Santa Barbara area in the transition from the Ag-Zn-Pb-Sn polymetallic mineralization to the more tin dominant mineralization at depth.
The coincidence of the magnetic inverse model with the chargeability/conductivity model from Bore Hole Induced Polarization (BHIP) surveys provides a powerful tool to outline very prospective drill targets. BHIP surveys to a depth of almost 1,000m show that the conductivity increases with depth at Santa Barbara, indicating that the potential feeder zone could be even more substantive.
TORONTO, June 14, 2022 (GLOBE NEWSWIRE) — Eloro Resources Ltd. (TSX-V: ELO; OTCQX: ELRRF; FSE: P2QM) (“Eloro”, or the “Company”) is pleased to announce assay results from an additional two (2) diamond drill holes from its on-going drilling program at the Iska Iska silver-tin polymetallic project in the Potosi Department, southern Bolivia. Hole DSBS-02 is a surface hole drilled due north at -300 from the south side of Santa Barbara across the higher-grade likely feeder zone. Hole DPC-09 is the first in a series of drill holes to test the extensive magnetic susceptibility anomaly in the Porco area in the southern part of the property. Four drills including three surface drills and one underground drill are focussed on completing drilling in the Santa Barbara Resource Definition Drilling Area. The underground drill is on its last hole and will be moved to surface to complete drill holes requested by Micon International Limited (“Micon”) to better define the preliminary open pit to be utilized for the maiden mineral resource estimate targeted for completion at the end of Q3.
Overall, the Company has completed 59,499m in 95 drill holes to-date, including four holes in progress, as shown in Figure 1. Tables 1 and 2 list significant assay results for the two drill holes reported. Prices used for calculating Ag equivalent grades are as outlined in Eloro’s February 1, 2022, press release. Table 3 summarizes drill holes with assays pending. Highlights are as follows:
Santa Barbara Mineral Resource Definition Target Area – Surface Drilling
Hole DSBS-02 was collared in the south part of the Santa Barbara target at an azimuth of 00 and dip of -300 to test across the likely higher grade feeder zone for the Santa Barbara Ag-Sn polymetallic mineralization. This hole was drilled to a length of 1,023.4m, corresponding to a vertical depth of 745m, with 67% of the hole containing reportable intersections which collectively average 100.42 g Ag eq/t. Significant results are as follows:
146.65 g Ag eq/t (10.74 g Ag/t, 1.01 g Au/t, 0.31% Zn, 0.11% Pb and 0.06% Sn) over 88.66m from 319.36m to 408.02m, including a higher-grade section of:
737.33 g Ag eq/t (51.11 g Ag/t, 6.82 g Au/t, 0.24% Zn, 0.31% Pb, and 0.19% Sn) over 12.06m from 355.39m to 367.45m. Notably, this is the strongest gold-bearing intercept encountered to date at Iska Iska.
131.86 g Ag eq/t (21.38 g Ag/t, 0.06 g Au/t, 0.25% Zn, 0.24% Pb and 0.14% Sn) over 104.38m from 531.22m to 635.60m, including higher-grade sections of:
224.16g Ag eq/t (50.19 g Ag/t, 0.02 g Au/t, 0.41% Zn, 0.38% Pb and 0.24%Sn) over 26.79m from 543.09 to 569.88,
300.90g Ag eq/t (35.33 g Ag/t, 0.20 g Au/t, 0.26 % Zn. 0.78% Pb and 0.36% Sn) over 10.38m from 590.84m to 601.22m.
78.94 g Ag eq/t (12.77 g Ag/t, 0.06 g Au/t, 0.66% Zn, 0.12% Pb and 0.04% Sn) over 235.43m from 670.27m to 905.70m which included higher grade sections of:
494.81 g Ag eq/t (170.06 g Ag/t, 0.49 g Au/t, 0.37% Zn, 0.35 %Pb, 0.40 % Sn) over 4.46m from 722.70m to 727.16m,
181.64 g Ag eq/t (76.79 g Ag/t, 0.19g Au/t, 0.76% Zn, 0.23 %Pb and 0.07% Sn) over 4.35m from 770.73m to 775.08m,
120.54 g Ag eq/t (15.50g Ag/t, 0.01 g Au/t, 1.57% Zn, 0.34% Pb and 0.03%Sn) over 10.96 m from 800.44m to 811.40m, and
129.54 g Ag eq/t (6.44 g Ag/t, 0.08 g Au/t, 2.03% Zn, 0.34% Pb and 0.02% Sn) over 8.94 m from 853.28m to 862.22m.
Dr. Bill Pearson, P.Geo. Eloro’s Executive Vice President, Exploration commented: “Grade shell modelling in Leapfrog of the Santa Barbara Deposit by the Iska Iska geological team indicates that drilling has defined a higher-grade zone >90 g Ag eq/t that extends approximately 750m along strike, is 650m wide and extends to a depth of at least 750m. The deposit is open in all directions. Figure 2 shows the Santa Barbara deposit model relative to the extensive 3D inverse magnetic susceptibility model, demonstrating the remarkable scale of this enormous mineralized system.”
Dr. Pearson continued: “Figure 3 is a 3D model combining the inverse magnetic susceptibility model and the bore hole induced polarization (“BHIP”) chargeability and conductivity data that clearly shows how this new hole DSBS-02 intersected significant mineralization in an area of an extensive chargeability anomaly coincident with a magnetic high. In the lower part of this hole conductivity increases substantially and indicates that this hole stopped just short of a likely area of massive sulphide mineralization. The coincidence of the magnetic inverse model with the chargeability/conductivity model provides a powerful tool to outline very prospective drill targets. BHIP surveys to a depth of almost 1,000m show that the conductivity increases with depth at Santa Barbara, indicating that the potential feeder zone could be even more substantive.”
Dr. Chris Hale, P.Geo., Chief Geophysicist for Eloro said: “Geophysical targeting is very useful at Iska Iska because the mineralization often occurs in association with pyrrhotite, a mineral that affects both the electrical and magnetic properties of the host rock. BHIP helps to correlate mineralization between the holes because it samples a much larger volume around the borehole than each assay does. BHIP provides two electrical measures of the quantity of mineralization; chargeability that measures the amount of disseminated mineralization and conductivity that shows when the strength of mineralization reaches the point of “connectivity”, resulting in a conductive deposit. This explains the strong spatial correlation between the grade of mineralization and the chargeable volume around DSBS-02. We do not yet have BHIP surveys under DPC-09 but this hole was targeted to test a peak in the magnetic susceptibility that was modelled using surface magnetic data. The excellent spatial coincidence between the mineralized intersection and the peak in magnetic susceptibility gives us confidence that we will also likely intersect mineralization when we drill the larger magnetic susceptibility zone that is modelled deeper and farther to the south.”
Porco Area – Magnetic Inverse Anomaly – Surface Drilling
Hole DPC-09 is the first of a series of holes to test the major inverse magnetic susceptibility anomaly in the Porco area, as outlined in Eloro’s March 1, 2022 press release. This hole intersected 41 reportable mineralized intersections, representing 29% of this 1,124.4m long hole that collectively averaged 94.73 g Ag eq/t. Highlights include:
143.47 g Ag eq/t (10.67 g Ag/t, 0.25 g Au/t, 1.90 % Zn, 0.23%Pb, 0.09% Cu and 0.01% Sn) over 11.96m from 363.57 to 375.53m
84.46 g Ag eq/t (6.52 g Ag/t, 0.03 g Au/t, 1.13% Zn, 0.37% Pb and 0.01% Sn) over 10.63m from 410.09 to 420.72m
79.46 g Ag eq/t (4.47 g Ag/t, 0.02 g Au/t, 1.12% Zn, 0.08 %Pb and 0.03 % Sn) over 42.55m from 740.63m to 783.18m.
82.64 g Ag eq/t (3.48 g Ag/t, 0.05 g Au/t, 0.50% Zn, 0.09% Pb, and 0.08% Sn) over 57.34m from 798.15m to 855.49m including a higher grade section of:
127.94 g Ag eq/t (3.37 g Ag/t, 0.05 g Au/t, 0.50% Zn,0.12% Pb and 0.16% Sn) over 12.02m from 798.15 to 810.17m,
96.13 g Ag eq/t (8.14 g Ag/t, 0.15 g Au/t, 0.40% Zn, 0.11% Pb and 0.09% Sn) over 14.83m from 972.51m to 987.34m,
69.88 g Ag eq/t (8.73 g Ag/t, 0.11 g Au/t, 0.22% Zn, 0.05% Pb and 0.06% Sn) over 40.24m from 1045.82m to 1086.06m including a higher grade section of
100.05 g Ag eq/t (16.71 g Ag/t, 0.08 g Au/t, 0.35% Zn, 0.06% Pb and 0.09% Sn) over 13.25m from 1068.37 to 1081.62m
163.35 g Ag eq/t (48.35 g Ag/t, 0.12 g Au/t, 0.05% Zn, 0.05% Pb, 0.09% Cu and 0.15% Sn) over 5.95m from 1114.63m to 1120.58m
As shown in Figure 4, this hole intersected a very extensive inverse magnetic susceptibility anomaly which, at elevation 3,400m, extends for approximately 1.6km along strike by 700m wide with a vertical extent of approximately 750m. The 3,400m elevation is approximately 100m above the valley floor. Significantly, the last reportable intersection near the bottom of the hole is higher in Ag and Sn with very low values of Zn and Pb. This is typical of what is seen in the Santa Barbara area in the transition from the Ag-Zn-Pb-Sn polymetallic mineralization to the more tin dominant mineralization at depth.
Table 1: Significant Results, Surface Diamond Drilling, Santa Barbara Resource Definition Target Area as at June 14, 2022.
SANTA BARBARA RESOURCE DEFINITION TARGET ZONE
SURFACE DIAMOND DRILLING
Hole No.
From (m)
To (m)
Length (m)
Ag
Au
Zn
Pb
Cu
Sn
Bi
Cd
Ag eq
g/t
g/t
%
%
%
%
%
%
g/t
DSBS-02
7.84
24.44
16.60
1.36
0.01
0.00
0.01
0.00
0.07
0.001
0.001
44.49
116.64
119.75
3.11
11.60
0.01
0.04
0.54
0.03
0.04
0.001
0.001
58.37
140.40
153.60
13.20
0.72
0.01
1.11
0.15
0.00
0.01
0.001
0.003
60.89
170.99
174.10
3.11
0.74
0.01
0.99
0.07
0.01
0.01
0.001
0.004
53.28
181.52
210.84
29.32
1.61
0.01
1.04
0.11
0.02
0.02
0.001
0.004
64.93
Incl.
204.66
209.33
4.67
4.63
0.01
2.69
0.35
0.06
0.04
0.002
0.008
172.94
235.15
255.86
20.71
5.43
0.06
1.83
0.55
0.01
0.09
0.003
0.007
168.10
270.96
281.72
10.76
7.62
0.04
0.49
0.22
0.02
0.06
0.001
0.002
78.72
290.74
293.71
2.97
15.53
0.05
0.06
0.14
0.04
0.05
0.001
0.001
59.26
298.26
308.78
10.52
26.84
0.11
0.05
0.09
0.08
0.02
0.001
0.001
65.08
319.36
408.02
88.66
10.74
1.01
0.31
0.11
0.01
0.06
0.008
0.001
146.65
Incl.
355.39
367.45
12.06
51.11
6.82
0.24
0.31
0.02
0.19
0.047
0.001
737.33
438.04
447.12
9.08
3.67
0.21
1.53
0.10
0.01
0.05
0.001
0.007
126.04
469.60
483.12
13.52
1.17
0.06
0.59
0.05
0.01
0.06
0.001
0.002
69.05
489.14
517.80
28.66
6.00
0.02
0.55
0.34
0.01
0.04
0.001
0.002
68.65
522.20
525.40
3.20
6.50
0.04
0.27
0.12
0.01
0.07
0.001
0.001
66.24
531.22
635.60
104.38
21.38
0.06
0.25
0.24
0.01
0.14
0.002
0.001
131.86
Incl.
543.09
569.88
26.79
50.19
0.02
0.41
0.38
0.01
0.24
0.001
0.001
224.16
Incl.
590.84
601.22
10.38
35.33
0.20
0.26
0.78
0.01
0.36
0.006
0.001
300.90
647.53
658.12
10.59
10.57
0.01
0.23
0.28
0.01
0.14
0.001
0.001
116.41
670.27
905.70
235.43
12.77
0.06
0.66
0.12
0.01
0.04
0.005
0.002
78.94
Incl.
722.70
727.16
4.46
170.06
0.49
0.37
0.35
0.04
0.40
0.104
0.003
494.81
Incl.
770.73
775.08
4.35
76.79
0.19
0.76
0.23
0.01
0.07
0.013
0.001
181.64
Incl.
800.44
811.40
10.96
15.50
0.01
1.57
0.34
0.01
0.03
0.001
0.004
120.54
Incl.
853.28
862.22
8.94
6.44
0.08
2.03
0.34
0.01
0.02
0.001
0.006
129.54
917.78
931.28
13.50
7.05
0.03
0.78
0.13
0.01
0.04
0.002
0.002
73.10
953.83
955.34
1.51
16.00
0.01
0.48
1.24
0.01
0.19
0.001
0.001
191.90
964.38
971.84
7.46
5.96
0.01
0.53
0.14
0.01
0.04
0.001
0.001
62.14
980.80
1022.40
41.60
38.97
0.08
0.24
0.34
0.03
0.10
0.007
0.001
132.38
Note: True width of the mineralization is not known at the present time, but based on the current understanding of the relationship between drill orientation/inclination and the mineralization within the breccia pipes and the host rocks such as sandstones and dacites, it is estimated that true width ranges between 70% and 90% of the down hole interval length but this will be confirmed by further drilling and geological modelling.
Chemical symbols: Ag= silver, Au = gold, Zn = zinc, Pb = lead, Cu = copper, Sn = tin, Bi = bismuth, Cd = cadmium and g Ag eq/t = grams silver equivalent per tonne. Quantities are given in percent (%) for Zn, Pb Cu, Sn, Bi and Cd and in grams per tonne (g/t) for Ag, Au and Ag eq.
Metal prices and conversion factors used for calculation of g Ag eq/t (grams Ag per grams x metal ratio) are as follows (Prices updated as of February 1, 2022, to more accurately reflect current metal prices):
Element
Price $US (per kg)
Ratio to Ag
Ag
$722.56
1.0000
Sn
$42.56
0.0589
Zn
$3.30
0.0046
Pb
$2.33
0.0032
Au
$57,604.00
79.7221
Cu
$9.68
0.0134
Bi
$12.76
0.0177
Cd
$5.50
0.0076
In calculating the intersections reported in this press release a sample cutoff of 30 g Ag eq/t was used with generally a maximum dilution of 3 continuous samples below cutoff included within a mineralized section unless more dilution is justified geologically.
The equivalent grade calculations are based on the stated metal prices and are provided for comparative purposes only, due to the polymetallic nature of the deposit. Metallurgical tests are in progress by Blue Coast Ltd. to establish levels of recovery for each element reported but currently the potential recovery for each element has not yet been established. While there is no assurance that all or any of the reported concentrations of metals will be recoverable, Bolivia has a long history of successfully mining and processing similar polymetallic deposits which is well documented in the landmark volume “Yacimientos Metaliferos de Bolivia” by Dr. Osvaldo R. Arce Burgoa, P.Geo.
Table 2: Significant Results, Surface Diamond Drilling, Porco Area – Magnetic Inverse Anomaly as at June 14, 2022.
Table 3: Summary of Diamond Drill Holes Completed with Assays Pending and Drill Holes in Progress at Iska Iska from June 14, 2022 press release.
SUMMARY DIAMOND DRILLING ISKA ISKA
Hole No.
Type
Collar Easting
Collar Northing
Elev
Azimuth
Angle
Hole length (m)
Surface Drilling Santa Barbara Breccia
DHK-24
S
205529.4
7656222.5
4153.4
225°
-60°
926.3
DHK-25
S
205526.9
7656384.7
4178.1
225°
-55°
1,147.3
Subtotal
2,073.6
Surface Drilling Northwest Extension Santa Barbara
DSB-16
S
204973.9
7657053.1
4147.1
225°
-65°
862.0
DSB-17
S
205136.3
7656770.8
4168.1
225°
-40°
841.0
DSB-18
S
205209.3
7656683.3
4172.5
225°
-40°
890.4
DSB-19
S
205209.9
7656684
4172.5
225°
-65°
803.3
DSB-23
S
205343.3
7656534.4
4176.1
225°
-40°
863.2
DSB-27
S
205044.5
7656982.6
4150
225°
-65°
800.4
DSB-28
S
205512
7656112
4162
225°
-60°
851.4
Subtotal
5,911.7
DSB-29
S
205511
7655966.9
4134
225°
-60°
In progress
DSB-30
S
205440.27
7656179.06
4192
225°
-60°
In progress
DSB-31
S
205652.403
7656108.35
4088
225°
-60°
In progress
Underground Drilling Santa Barbara Adit
DSBU-09
UG
205284.5
7656080
4167.1
90°
-60°
904
DSBU-10
UG
205284.5
7656080.0
4167.1
40°
-60°
878.9
Subtotal
1,782.9
DSBU-11
UG
205284.502
7656080.03
4167.117
180°
-55°
In progress
Surface Drilling South Extension Santa Barbara
DSBS-02
S
205300
7655563
4195
0°
-45°
1,023.4
Subtotal
1,023.4
Porco Target Area – Surface Drill Program Testing Magnetic Inverse Model
DPC-07
S
205090.1
7655340.9
4310
235°
-60°
791.4
DPC-08
S
205585
7655423.6
4089
235°
-65°
800.4
DPC-09
S
205456.7
7655516.6
4125
180°
-75°
1,124.4
DPC-10
S
205396.5
7655701.2
4148
225°
-60°
1,088.4
DPC-11
S
205456.7
7655516.6
4125
235°
-70°
1,065.0
DPC-12
S
205650
7655200
4100
235°
-70°
941.4
Subtotal
5,811.0
Mina 2 Target Area – Surface Drill Program Testing Magnetic Inverse Model
DM2-01
S
205944
7654211
3674
30°
-60°
860.3
Subtotal
860.3
TOTAL
17,463.3
S = Surface UG=Underground; collar coordinates in metres; azimuth and dip in degrees. Total drilling completed since the start of the program on September 13, 2020 to December 17, 2021 is 40,468 m in 73 holes (26 underground holes and 47 surface holes). From re-start of drilling on January 17, 2022, an additional 19,031m have been completed bringing the overall total to 59,499 m in 95 drill holes (31 underground drill holes and 64 surface drill holes) including 4 holes in progress.
Qualified Person
Dr. Osvaldo Arce, P. Geo., General Manager of Eloro’s Bolivian subsidiary, Minera Tupiza S.R.L., and a Qualified Person in the context of NI 43-101, has reviewed and approved the technical content of this news release. Dr. Bill Pearson, P.Geo., Executive Vice President Exploration Eloro, and who has more than 45 years of worldwide mining exploration experience, including extensive work in South America, manages the overall technical program, working closely with Dr. Osvaldo Arce, P.Geo. Dr. Quinton Hennigh, P.Geo., Senior Technical Advisor to Eloro and Independent Technical Advisor, Mr. Charley Murahwi P. Geo., FAusIMM of Micon are regularly consulted on technical aspects of the project.
The magnetic survey was carried out by MES Geophysics using a GEM Systems GSM-19W Overhauser magnetometer. Dr. Chris Hale, P.Geo. and Mr. John Gilliatt, P.Geo. of Intelligent Exploration provided the survey design, preparation of the maps and interpretation from data processed and quality reviewed by Rob McKeown, P. Geo. of MES Geophysics. Messrs. Hale, Gilliatt and McKeown are Qualified Persons as defined under NI 43-101. Mr. Joe Mihelcic, P.Eng., P.Geo., of Clearview Geophysics, a QP under NI 43-101, completed the 3D magnetic inversion model in consultation with Dr. Hale and Mr. Gilliatt. The Borehole IP surveys are being carried out by MES Geophysics under the supervision of Dr. Hale and Mr. Gilliatt.
Eloro is utilizing both ALS and AHK for drill core analysis, both of whom are major international accredited laboratories. Drill samples sent to ALS are prepared in both ALS Bolivia Ltda’s preparation facility in Oruro, Bolivia and the preparation facility operated by AHK in Tupiza with pulps sent to the main ALS Global laboratory in Lima for analysis. More recently Eloro has had ALS send pulps to their laboratory at Galway in Ireland. Eloro employs an industry standard QA/QC program with standards, blanks and duplicates inserted into each batch of samples analyzed with selected check samples sent to a separate accredited laboratory.
Drill core samples sent to AHK Laboratories are prepared in a preparation facility installed and managed by AHK in Tupiza with pulps sent to the AHK laboratory in Lima, Peru. Au and Sn analysis on these samples is done by ALS Bolivia Ltda in Lima. Check samples between ALS and AHK are regularly done as a QA/QC check. AHK is following the same analytical protocols used as with ALS and with the same QA/QC protocols. Turnaround time continues to improve, as laboratories return to more normal staffing levels.
About Iska Iska
Iska Iska silver-tin polymetallic project is a road accessible, royalty-free property, wholly controlled by the Title Holder, Empresa Minera Villegas S.R.L. and is located 48 km north of Tupiza city, in the Sud Chichas Province of the Department of Potosi in southern Bolivia. Eloro has an option to earn a 99% interest in Iska Iska.
Iska Iska is a major silver-tin polymetallic porphyry-epithermal complex associated with a Miocene possibly collapsed/resurgent caldera, emplaced on Ordovician age rocks with major breccia pipes, dacitic domes and hydrothermal breccias. The caldera is 1.6km by 1.8km in dimension with a vertical extent of at least 1km. Mineralization age is similar to Cerro Rico de Potosí and other major deposits such as San Vicente, Chorolque, Tasna and Tatasi located in the same geological trend.
Eloro began underground diamond drilling from the Huayra Kasa underground workings at Iska Iska on September 13, 2020. On November 18, 2020, Eloro announced the discovery of a significant breccia pipe with extensive silver polymetallic mineralization just east of the Huayra Kasa underground workings and a high-grade gold-bismuth zone in the underground workings. On November 24, 2020, Eloro announced the discovery of the SBBP approximately 150m southwest of the Huayra Kasa underground workings.
Subsequently, on January 26, 2021, Eloro announced significant results from the first drilling at the SBBP including the discovery hole DHK-15 which returned 129.60 g Ag eq/t over 257.5m (29.53g Ag/t, 0.078g Au/t, 1.45%Zn, 0.59%Pb, 0.080%Cu, 0.056%Sn, 0.0022%In and 0.0064% Bi from 0.0m to 257.5m. Subsequent drilling has confirmed significant values of Ag-Sn polymetallic mineralization in the SBBP and the adjacent CBP. A substantive mineralized envelope which is open along strike and down-dip extends around both major breccia pipes. Continuous channel sampling of the Santa Barbara Adit located to the east of SBBP returned 442 g Ag eq/t (164.96 g Ag/t, 0.46%Sn, 3.46% Pb and 0.14% Cu) over 166m including 1,092 g Ag eq/t (446 g Ag/t, 9.03% Pb and 1.16% Sn) over 56.19m. The west end of the adit intersects the end of the SBBP.
Since the initial discovery hole, Eloro has released a number of significant drill results in the SBBP and the surrounding mineralized envelope which along with geophysical data has defined a target zone 1400m along strike, 500m wide and that extends to a depth of 600m. This zone is open along strike to the northwest and southeast as well as to the southwest. The Company’s nearer term objective is to outline a maiden NI 43-101 compliant mineral resource within this large target area. This work is advancing well with the mineral resource targeted to be completed in Q3 2022. Exploration drilling is also planned on other major targets in the Iska Iska Caldera Complex, including the Porco and Mina 2 areas.
About Eloro Resources Ltd.
Eloro is an exploration and mine development company with a portfolio of gold and base-metal properties in Bolivia, Peru and Quebec. Eloro has an option to acquire a 99% interest in the highly prospective Iska Iska Property, which can be classified as a polymetallic epithermal-porphyry complex, a significant mineral deposit type in the Potosi Department, in southern Bolivia. A recent NI 43-101 Technical Report on Iska Iska, which was completed by Micon International Limited, is available on Eloro’s website and under its filings on SEDAR. Iska Iska is a road-accessible, royalty-free property. Eloro also owns an 82% interest in the La Victoria Gold/Silver Project, located in the North-Central Mineral Belt of Peru some 50 km south of Barrick’s Lagunas Norte Gold Mine and Pan American Silver’s La Arena Gold Mine. La Victoria consists of eight mining concessions and eight mining claims encompassing approximately 89 square kilometres. La Victoria has good infrastructure with access to road, water and electricity and is located at an altitude that ranges from 3,150 m to 4,400 m above sea level.
For further information please contact either Thomas G. Larsen, Chairman and CEO or Jorge Estepa, Vice-President at (416) 868-9168.
Information in this news release may contain forward-looking information. Statements containing forward-looking information express, as at the date of this news release, the Company’s plans, estimates, forecasts, projections, expectations, or beliefs as to future events or results and are believed to be reasonable based on information currently available to the Company. There can be no assurance that forward-looking statements will prove to be accurate. Actual results and future events could differ materially from those anticipated in such statements. Readers should not place undue reliance on forward-looking information.
Neither the TSXV nor its Regulation Services Provider (as that term is defined in the policies of the TSXV) accepts responsibility for the adequacy or accuracy of this release.
VANCOUVER, BC / ACCESSWIRE / June 13, 2022 / Metallic Minerals (TSX.V:MMG | US OTCQB:MMNGF) (“Metallic Minerals“, or the “Company“) is pleased to report that, further to its news release dated April 26, 2022, it has filed on SEDAR a National Instrument 43-101 technical report, entitled, “Technical Report on the Inaugural Mineral Resource Estimate for the Allard Cu-Ag Porphyry Deposit, La Plata Project Southwestern Colorado USA”, has an effective date of April 3rd, 2022.
Scott Petsel, President of Metallic Minerals, stated, “The inaugural resource, which defined 889 million pounds of copper and 15 million ounces of silver (Inferred) at the Allard Cu-Ag Porphyry deposit, was a major milestone for the Company. The project team is currently working to finalize the next phases of exploration to include additional ground and airborne geophysical surveys, resource expansion drilling and the testing of newly identified targets representing both potential porphyry centers and high-grade silver-gold-telluride epithermal targets. We look forward to meeting with existing and potential shareholders this week during PDAC 2022 in Toronto June 13-15, as well as during the Yukon Mining Alliance Property Tours and Conference June 20-24 in Dawson City to discuss the exciting potential we see for both our flagship projects.”
The Technical Report was authored by Allan Armitage, Ph.D., P.Geo. of SGS Geologic Services (“SGS”) an independent Qualified Person and was prepared in accordance with National Instrument 43-101 Standards of Disclosure for Mineral Projects. The report is available under the Company’s profile at www.sedar.com and will also be available on the Company’s website at www.mmgsilver.com.
About SGS Geological Services
SGS Geological Services has an experienced and respected mining team focused on the domestic and international mining industry. The team has considerable experience in estimation and modeling of deposits of all types and practical and theoretical experience having realized hundreds of assessments for clients. The SGS team consists of a multi-disciplinary group of qualified persons with a strong understanding of the disclosure requirements for Mineral Resources set out in the NI 43-101 Standards of Disclosure for Mineral Projects (2016), CIM Definition Standards – For Mineral Resources and Mineral Reserves (2014) and a strong understanding of the CIM Estimation of Mineral Resources & Mineral Reserves Best Practice Guidelines 2019.
Upcoming Events
PDAC 2022 – Metallic will join fellow Metallic Group members Stillwater Critical Minerals (formerly Group Ten Metals) and Granite Creek Copper in Booth 2851 at the Prospectors and Developers Association Convention in Toronto, ON from June 13-15.
Yukon Property Tours & Conference – Metallic will be in Dawson City June 20-24 for the 2022 Yukon Property Tours, with President, Scott Petsel, and CEO, Greg Johnson, both visiting the Keno Silver Project for exploration planning.
About Metallic Minerals
Metallic Minerals Corp. is an exploration and development stage company, focused on silver, gold and copper in the high-grade Keno Hill and La Plata mining districts of North America. Our objective is to create shareholder value through a systematic, entrepreneurial approach to making exploration discoveries, growing resources and advancing projects toward development. Metallic Minerals has consolidated the second-largest land position in the historic Keno Hill silver district of Canada’s Yukon Territory, directly adjacent to Alexco Resource Corp’s operations, with more than 300 million ounces of high-grade silver in past production and current M&I resources. In addition, the Company recently announced the inaugural resource estimate for the La Plata silver-gold-copper project in southwestern Colorado. The Company also continues to add new production royalty leases on its holdings in the Klondike gold district in the Yukon. All three districts have seen significant mineral production and have existing infrastructure, including power and road access. Metallic Minerals is led by a team with a track record of discovery and exploration success on several major precious and base metal deposits, as well as having large-scale development, permitting and project financing expertise.
About the Metallic Group of Companies
The Metallic Group is a collaboration of leading precious and base metals exploration and development companies, with a portfolio of large, brownfields assets in established mining districts adjacent to some of the industry’s highest-grade producers of silver and gold, platinum and palladium, and copper. Member companies include Metallic Minerals in the Yukon’s high-grade Keno Hill silver district and La Plata silver-gold-copper district of Colorado, Granite Creek Copper in the Yukon’s Minto copper district, and Stillwater Critical Minerals in the Stillwater PGM-nickel-copper district of Montana and Kluane district in the Yukon. The founders and team members of the Metallic Group include highly successful explorationists formerly with some of the industry’s leading explorer/developers and major producers. With this expertise, the companies are undertaking a systematic approach to exploration and development using new models and technologies to facilitate discoveries in these proven, but under-explored, mining districts. Members of the Metallic Group have been recognized as recipients of awards for excellence in environmental stewardship demonstrating commitment to responsible resource development and appropriate ESG practices. The Metallic Group is headquartered in Vancouver, BC, Canada, and its member companies are listed on the Toronto Venture, US OTCQB and Frankfurt stock exchanges.
Forward Looking Statements: This news release includes certain statements that may be deemed “forward-looking statements”. All statements in this release, other than statements of historical facts including, without limitation, statements regarding potential mineralization, historic production, estimation of mineral resources, the realization of mineral resource estimates, interpretation of prior exploration and potential exploration results, the timing and success of exploration activities generally, the timing and results of future resource estimates, permitting time lines, metal prices and currency exchange rates, availability of capital, government regulation of exploration operations, environmental risks, reclamation, title, and future plans and objectives of the company are forward-looking statements that involve various risks and uncertainties. Although Metallic Minerals believes the expectations expressed in such forward-looking statements are based on reasonable assumptions, such statements are not guarantees of future performance and actual results or developments may differ materially from those in the forward-looking statements. Forward-looking statements are based on a number of material factors and assumptions. Factors that could cause actual results to differ materially from those in forward-looking statements include failure to obtain necessary approvals, unsuccessful exploration results, changes in project parameters as plans continue to be refined, results of future resource estimates, future metal prices, availability of capital and financing on acceptable terms, general economic, market or business conditions, risks associated with regulatory changes, defects in title, availability of personnel, materials and equipment on a timely basis, accidents or equipment breakdowns, uninsured risks, delays in receiving government approvals, unanticipated environmental impacts on operations and costs to remedy same, and other exploration or other risks detailed herein and from time to time in the filings made by the companies with securities regulators. Readers are cautioned that mineral resources that are not mineral reserves do not have demonstrated economic viability. Mineral exploration and development of mines is an inherently risky business. Accordingly, the actual events may differ materially from those projected in the forward-looking statements. For more information on Metallic Minerals and the risks and challenges of their businesses, investors should review their annual filings that are available at www.sedar.com
Neither the TSX Venture Exchange nor its Regulation Services Provider (as that term is defined in the policies of the TSX Venture Exchange) accepts responsibility for the adequacy or accuracy of this release.
Newsfile Corp.Mon, June 13, 2022, 8:00 AMIn this article:
GSHRF+4.18%
Vancouver, British Columbia–(Newsfile Corp. – June 13, 2022) – Goldshore Resources Inc. (TSXV: GSHR) (OTCQB: GSHRF) (FSE: 8X00) (“Goldshore” or the “Company“), is pleased to announce that drilling has commenced in the Coldstream region at the Moss Lake Project with two drill rigs mobilized in this area, of the seven drill rigs currently operating on the Company’s land package.
Highlights:
Two rigs mobilized to evaluate gold mineralization at East Coldstream and copper-gold-cobalt mineralization at North Coldstream
Company to issue a drill plan for the next several months, indicating the locations of step out drilling and infill drilling at the Moss Lake Project; as well as the key targets identified at East Coldstream, North Coldstream, Iris Lake and Hamlin
President and CEO Brett Richards stated: “We are pleased to announce commencement of drilling in the Coldstream Region. In the coming weeks, we will lay out the drill plan for the market to follow with our progress as we step out and infill at Moss Lake, and illustrate our progress in the Coldstream region, as well as commencing drilling in the other key targets within our land package.”
Vice President Exploration, Pete Flindell commented: “Drilling has commenced at East and North Coldstream to evaluate historic drill holes, understand the controls on mineralization, test for higher grade shoots within the two deposits and explore for strike extensions to the known mineralized zones. We look forward to seeing the results in the coming months.”
Goldshore is an emerging junior gold development company, and owns the Moss Lake Gold Project located in Ontario. Wesdome Gold Mines Ltd. (“Wesdome“) is currently a strategic shareholder of Goldshore with an approximate 27% equity position in the Company. Well-financed and supported by an industry-leading management group, board of directors and advisory board, Goldshore is positioned to advance the Moss Lake Gold Project through the next stages of exploration and development.
About the Moss Lake Gold Project
The Moss Lake Gold Project is located approximately 100 km west of the city of Thunder Bay, Ontario. It is accessed via Highway 11 which passes within 1 km of the property boundary to the north. The Moss Lake Gold Project covers 14,292 hectares and consists of 282 unpatented and patented mining claims.
Moss Lake hosts a number of gold and base metal rich deposits including the Moss Lake Deposit, the East Coldstream Deposit (Table 1), the historically producing North Coldstream Mine (Table 2), and the Hamlin Zone, all of which occur over a mineralized trend exceeding 20 km in length. A historical preliminary economic assessment was completed on Moss Lake in 2013 and published by Moss Lake Gold1. A historical mineral resource estimate was completed on the East Coldstream Deposit in 2011 by Foundation Resources Inc2,3. In addition to these zones, the Moss Lake Gold Project also hosts a number of under-explored mineral occurrences which are reported to exist both at surface and in historically drilled holes. The Moss Lake Deposit is a shear-hosted disseminated-style gold deposit which outcrops at surface. It has been drilled over a 2.5 km length and to depths of 300 m with 376 holes completed between 1983 and 2017. The last drilling program conducted in 2016 and 2017 by Wesdome, which consisted of widely spaced holes along the strike extension of the deposit was successful in expanding the mineralized footprint and hydrothermal system 1.6 km to the northeast. Additionally, the deposit remains largely open to depth. In 2017, Wesdome completed an induced polarization survey which traced the potential extensions of pyrite mineralization associated with the Moss Lake Deposit over a total strike length of 8 km and spanning the entire extent of the survey grids.
The East Coldstream Deposit is a shear-hosted disseminated-style gold deposit which locally outcrops at surface. It has been drilled over a 1.3 km length and to depths of 200 m with 138 holes completed between 1988 and 2017. The deposit remains largely open at depth and may have the potential for expansion along strike. Historic drill hole highlights from the East Coldstream Deposit include 4.86 g/t Au over 27.3 m in C-10-15.
The historically producing North Coldstream Mine is reported to have produced significant amounts of copper, gold and silver4 from mineralization with potential iron-oxide-copper-gold deposit style affinity. The exploration potential immediately surrounding the historic mining area is not currently well understood and historic data compilation is required.
The Hamlin Zone is a significant occurrence of copper and gold mineralization, and also of potential iron-oxide-copper-gold deposit style affinity. Between 2008 and 2011, Glencore tested Hamlin with 24 drill holes which successfully outlined a broad and intermittently mineralized zone over a strike length of 900 m. Historic drill hole highlights from the Hamlin Zone include 0.9 g/t Au and 0.35% Cu over 150.7 m in HAM-11-75.
The Moss Lake, East Coldstream and North Coldstream deposits sit on a mineral trend marked by a regionally significant deformation zone locally referred to as the Wawiag Fault Zone in the area of the Moss Lake Deposit. This deformation zone occurs over a length of approximately 20 km on the Moss Lake Gold Project and there is an area spanning approximately 7 km between the Moss Lake and East Coldstream deposits that is significantly underexplored.
Table 1: Historical Mineral Resources1,2,3
INDICATED
INFERRED
Deposit
Tonnes
Au g/t
Au oz
Tonnes
Au g/t
Au oz
Moss Lake Deposit1 (2013 resource estimate)
Open Pit Potential
39,795,000
1.1
1,377,300
48,904,000
1.0
1,616,300
Underground Potential
–
–
–
1,461,100
2.9
135,400
Moss Lake Total
39,795,000
1.1
1,377,300
50,364,000
1.1
1,751,600
East Coldstream Deposit2 (2011 resource estimate)
East Coldstream Total
3,516,700
0.85
96,400
30,533,000
0.78
763,276
Combined Total
43,311,700
1.08
1,473,700
80,897,000
0.98
2,514,876
Notes: (1)Source: Poirier, S., Patrick, G.A., Richard, P.L., and Palich, J., 2013. Technical Report and Preliminary Economic Assessment for the Moss Lake Project, 43-101 technical report prepared for Moss Lake Gold Mines Ltd. Moss Lake Deposit resource estimate is based on 0.5 g/t Au cut-off grade for open pit and 2.0 g/t Au cut-off grade for underground resources.
(2)Source: McCracken, T., 2011. Technical Report and Resource Estimate on the Osmani Gold Deposit, Coldstream Property, Northwestern Ontario, 43-101 technical report prepared for Foundation Resources Inc. and Alto Ventures Ltd. East Coldstream Deposit resource estimate is based on a 0.4 g/t Au cut-off grade.
(3)The reader is cautioned that the above referenced “historical mineral resource” estimates are considered historical in nature and as such is based on prior data and reports prepared by previous property owners. A qualified person has not done sufficient work to classify the historical estimates as current resources and Goldshore is not treating the historical estimates as current resources. Significant data compilation, re-drilling, re-sampling and data verification may be required by a qualified person before the historical estimate on the Moss Lake Gold Project can be classified as a current resource. There can be no assurance that any of the historical mineral resources, in whole or in part, will ever become economically viable. In addition, mineral resources are not mineral reserves and do not have demonstrated economic viability. Even if classified as a current resource, there is no certainty as to whether further exploration will result in any inferred mineral resources being upgraded to an indicated or measured mineral resource category.
Table 2: Reported Historical Production from the North Coldstream Deposit4
Deposit
Tonnes
Cu %
Au g/t
Ag
Cu lbs
Au oz
Ag oz
Historical Production
2,700,0000
1.89
0.56
5.59
102,000,000
44,000
440,000
Note: (4) Source: Schlanka, R., 1969. Copper, Nickel, Lead and Zinc Deposits of Ontario, Mineral Resources Circular No. 12, Ontario Geological Survey, pp. 314-316.
Peter Flindell, MAusIMM, MAIG, Vice President – Exploration of the Company, a qualified person under NI 43-101 has approved the scientific and technical information contained in this news release.
Neither the TSXV nor its Regulation Services Provider (as that term is defined in the policies of the TSXV) accepts responsibility for the adequacy or accuracy of this release.
For More Information – Please Contact:
Brett A. Richards President, Chief Executive Officer and Director Goldshore Resources Inc.
This news release contains statements that constitute “forward-looking statements.” Such forward-looking statements involve known and unknown risks, uncertainties and other factors that may cause the Company’s actual results, performance or achievements, or developments to differ materially from the anticipated results, performance or achievements expressed or implied by such forward-looking statements. Forward-looking statements are statements that are not historical facts and are generally, but not always, identified by the words “expects,” “plans,” “anticipates,” “believes,” “intends,” “estimates,” “projects,” “potential” and similar expressions, or that events or conditions “will,” “would,” “may,” “could” or “should” occur.
Forward-looking statements in this news release include, among others, statements relating to expectations regarding the exploration and development of the Moss Lake Gold Project and other statements that are not historical facts. By their nature, forward-looking statements involve known and unknown risks, uncertainties and other factors which may cause our actual results, performance or achievements, or other future events, to be materially different from any future results, performance or achievements expressed or implied by such forward-looking statements. Such factors and risks include, among others: the Company may require additional financing from time to time in order to continue its operations which may not be available when needed or on acceptable terms and conditions acceptable; compliance with extensive government regulation; domestic and foreign laws and regulations could adversely affect the Company’s business and results of operations; the stock markets have experienced volatility that often has been unrelated to the performance of companies and these fluctuations may adversely affect the price of the Company’s securities, regardless of its operating performance; and the impact of COVID-19.
The forward-looking information contained in this news release represents the expectations of the Company as of the date of this news release and, accordingly, is subject to change after such date. Readers should not place undue importance on forward-looking information and should not rely upon this information as of any other date. The Company undertakes no obligation to update these forward-looking statements in the event that management’s beliefs, estimates or opinions, or other factors, should change.