BY MARIA SMIRNOVA | THURSDAY, MAY 26, 2022
My colleague Paul Wong wrote about silver’s recent flat performance in his recent monthly, April Pressures Risk Assets. Wong aptly explained silver’s interesting role: “Silver has a distinct duality pricing function that, at times, may be contradictory due to its industrial component and its monetary role.”
In this report, we provide our current outlook for silver. Ultimately, we believe recent market dynamics are creating short-term headwinds for precious metals from a monetary standpoint, but those trends could reverse – and silver supply constraints are likely to become more relevant in the face of sustained demand, with notable momentum in silver’s industrial uses related to the green energy transition.The strength of silver’s fundamentals has been fueled by strong gains across all demand components.
Silver’s Behavior Since COVID
Silver bullion1 posted a 47% gain in 2020 (see red oval in Figure 1) and has recently been in a holding pattern. Despite this, silver traded in the range of $22-$28 in 2021, and its average price for the year reached a nine-year high of $25.14.
Since silver’s outperformance in 2020, the global macroeconomic environment has changed dramatically and become increasingly volatile. Markets continue to grapple with the impacts of the COVID pandemic, geopolitical concerns have increased substantially, and the recent sell-off of stocks has not yet found a stopping point. Rising interest rates have created a headwind for precious metals assets, particularly gold and silver.
Silver is More Volatile than Gold
Silver’s response to current macroeconomic challenges has been to follow its traditional pattern of reacting with more volatility than gold. Silver is down modestly YTD; priced at $23.35 per ounce on December 31, 2021, it was $21.72 as of May 23, 2022, a decline of 7.02%. Gold, by contrast, gained 1.38% YTD2 through May 23. Both are strong showings, given the S&P 5003 declined 16.65% in the same period.
Figure 1. Silver Price vs. Gold Price (2000-2022)
 Source: Bloomberg. Data as of 4/30/2022. Included for illustrative purposes only. Past performance is no guarantee of future results.
But to fully understand our current positive outlook for silver, we should revisit the supply-demand dynamics of the silver market — the fundamental relationship that directs long-term pricing trends. To assess these dynamics, we looked to the annual silver outlook published by the Silver Institute and Metals Focus in April, the World Silver Survey 2022.
Although the risk-off tenor of the moment may be a headwind for short-term silver pricing trends, over the longer term, we believe silver supply constraints will become more relevant in the face of sustained, growing demand.
Silver Supply Headwinds in the Post-COVID Era
As expected on the back of silver’s price rise in 2020, silver mining rebounded in 2021 — but to a lesser degree than forecasted. Mine production was up about 5% in 2021 from 2020 levels. Recycling volumes grew by 7% as higher pricing attracted more scrap to the market. Still, Metals Focus analysts had predicted growth for mining supply to be higher, in the range of 8%. As shown in Figure 2, silver supplies have dropped into a deficit since last year, and Metals Focus analysts predict another sizeable deficit of 72 million ounces in 2022.
Figure 2. Silver Supply Dives into Deficit in 2021
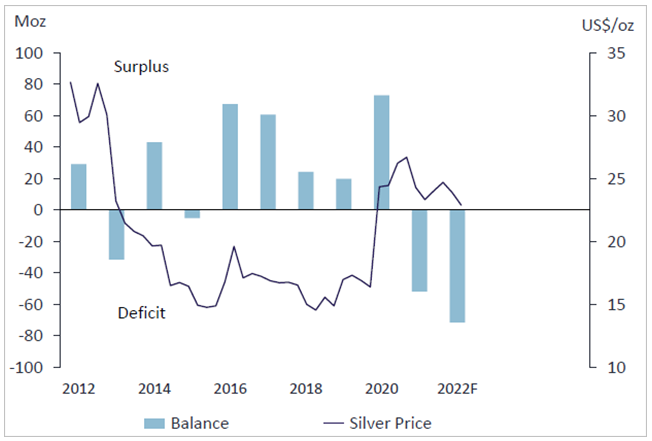
Source: Metals Focus, April 2022. Included for illustrative purposes only. Past performance is no guarantee of future results.
In addition to tighter silver supply, silver grades have been declining for several years. Ore grades depend on several things, including rising silver prices (which make it profitable to accept lower grades) and how the silver is mined. Going forward, mining companies will likely have to invest more in exploration and development in order to increase or even maintain supply.
Figure 3. Grades of Mined Silver Ore have Declined ~55% Since 2005
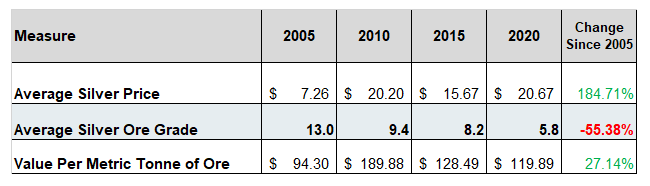
Source: CPM Group. Average grade data on seven primary silvers mines unsubstantiated by SPM Group, 3/16/2021. Included for illustrative purposes only. Past performance is no guarantee of future results.
Byproduct prices are also a big input for total silver mining activity. More than 70% of silver mining supply is a result of byproduct mining. Higher prices for byproduct metals — lead, zinc and copper, for instance — drive higher mining activity for those metals, essentially subsidizing silver mining in the process. That impact has contributed to supply in recent quarters. But, it’s a tailwind to supply that is potentially at risk. If macroeconomic conditions soften in the medium-term and price support eases for those byproduct metals, silver mining supply is also vulnerable. Without the subsidy effect of higher byproduct prices, the outlook for silver supply could be even weaker than expected.
Figure 4. Higher Prices for Byproduct Metals have Helped Silver Mining Output

Source: Bloomberg, as of 5/13/2022. Orange = Copper Futures. Green = Zinc Futures (3 month contracts). Blue = Silver Spot. Gold = Gold Spot. Included for illustrative purposes only. Past performance is no guarantee of future results.
Miners must also contend with inflation, which directly impacts their fuel costs in production and exploration. If costs are expected to increase and silver miners aren’t sufficiently confident in higher silver prices, it’s difficult to envision a scenario where they are likely to ramp up mining activity substantially. There are also continued reports of worker shortages in silver mining as the tight labor market and waves of COVID outbreaks hamper operations in some locations.
These supply trends have already resulted in a drop in global silver reserves. In 2021, 122 million ounces (Moz) of silver were added to reserves, but 270 Moz were taken in production, as shown in Figure 5. Reserves dropped by about 4% to 3,412 Moz at yearend. Exploration and discoveries were also underwhelming in 2021. Globally, total identified silver resources (excluding reserves) only grew 1% last year. At the same time, there was subdued merger and acquisition activity in 2021 in the primary silver sector, with only eight deals totaling just US$11 million.
Figure 5. Global Silver Mine Reserves Drop in 2021
Primary silver reserves declined as mining depletion exceeded additions.

Source: Metals Focus, April 2022. Included for illustrative purposes only. Past performance is no guarantee of future results.
Silver Demand: Green Technologies Support Sustained Growth
While silver supply faces some constricting trends, the rebound in demand could prove sustainable, thanks to silver’s critical role in growing green energy initiatives.
Photovoltaic demand — silver inputs for solar panel production — is a prime example, growing 13% as a category in 2021 and contributing to a new record high for global silver demand in 2021. This rebound, even in the face of the supply-chain constraints that have plagued global manufacturing since COVID began, reflects the substantial green-energy investment that is underway.
We believe this trend could drive continued demand growth even if other manufacturing activity softens incrementally. Industrial demand overall accounts for about half of annual silver demand, and photovoltaic demand is about a fifth of all industrial offtake (and growing in share, since photovoltaic is growing faster than overall industrial use at large).
Figure 6. Silver Industrial Demand Tops Pre-COVID Highs, with Higher Photovoltaic (PV) Fabrication

Source: Metals Focus, April 2022. Included for illustrative purposes only. Past performance is no guarantee of future results.
The outlook for green energy investment has only strengthened in the face of the Russia-Ukraine conflict, which is pushing global sentiment towards energy security and renewables. Vehicle electrification and renewable energy demand could have more staying power in an environment where developed economies are turning a corner toward weaker growth or even recession. Industry forecasts project that silver demand for electric vehicles is likely to eventually surpass the volume of silver used in photovoltaics. As Paul Wong discussed last month, silver prices have demonstrated a growing correlation to energy transition equities. According to Wong, “Silver pricing has become highly correlated (R-square4 of 0.82) with energy transition equities, as illustrated in Figure 7. This Energy Transition Index is comprised of 12 large ETFs in the energy transition space (solar, renewables, wind, carbon, infrastructure, uranium, etc.).”
Figure 7. Silver Correlates with Energy Transition Equities

Source: Bloomberg and Sprott Asset Management LP. Data as of 4/30/2022. Included for illustrative purposes only. You cannot invest directly in an index. Past performance is no guarantee of future results.
The Energy Transition Story is a Large Force for Silver
The current environment may be dominated by risk-off behavior, but that’s not the primary factor for longer-term silver demand, particularly given its dual nature as a precious metal and an industrial metal.
We see the energy transition story as a large force for silver demand — this year and in future years. The geopolitical issues dominating the current environment only strengthen that trend, even as they weaken other components of silver demand. The pandemic and the war in Ukraine have both served to reinforce investment in energy-transition initiatives.
Silver is a critical component of electric vehicles (EVs), which are experiencing strong demand growth globally. EV sales are slated to represent >30% of total light-vehicle sales by 2030, mainly stemming from China, Europe and the U.S. EVs are going to require a new set of manufacturing materials versus traditional ICE (internal combustion vehicles) vehicles. Silver’s high conductivity and ductility make EVs more efficient by establishing lightweight but strong electrical connections between batteries and other car components. Battery electric vehicles use between ~25-50 grams of silver per vehicle.
At present, EV inventories remain backlogged. Ford announced in January that it would double production of its electric F-150 pickup truck to work through a three-year backlog. Tesla reported that some models were backlogged until 2023, even after price increases. Solar panels have also been backlogged in recent months, according to some reports.
Figure 8. A Surge in EVs

Source: BMO Capital Markets, HIS, CAAM, InsideEVs, Industry Reports as of 2/07/2022.
Positive Non-Industrial Demand Trends
Looking at non-industrial demand for silver, trends have been milder but positive. In photography — which represents a small and declining share of silver demand — there was a small post-COVID rebound related to the catch-up trend of X-rays in healthcare after lockdowns subsided. Jewelry and silverware are more closely tied to economic growth, and both rebounded substantially in 2021. The return of weddings and social events in India supported higher jewelry production. Italy and China also accounted for healthy rebounding demand for jewelry amid economic recoveries. Silverware also reflected these trends. However, jewelry and silverware purchases both remained below pre-COVID levels.
Physical demand for silver coins and bars is the most volatile category of demand (and hard to get real-time data for mid-year). Physical demand grew 36% in 2021 over the year prior, driving the category up to represent a full quarter of global demand for the year. Bar and coin investments have not retreated since 2016/17.
Figure 9. Silver Bar and Coin Investment Surged by 36% in 2021
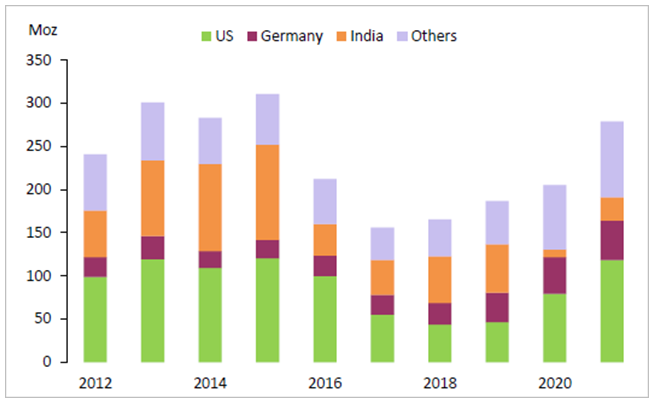
Source: Metals Focus, April 2022. Included for illustrative purposes only. Past performance is no guarantee of future results.
Why We Remain Bullish on Silver
From a pricing standpoint, silver is historically undervalued relative to gold right now, and offers an attractive investment opportunity. We see a picture of silver fundamentals where supply trends cannot keep up with longer-term demand. Overall, the silver market has been in a physical deficit since 2019, and silver mine supply has been in decline since 2016. There has been a lack of funds going into silver mine development and the timelines from discovery to production have gotten longer. On the demand side, all segments of silver demand are rebounding, led by industrial, jewelry and physical investment. We continue to believe that silver is likely to benefit from supply constraints in the face of growing demand. We expect green technology and de-carbonization trends to continue and increase, even if economic growth slows globally.
| 1 | Silver bullion is measured by Bloomberg Silver (XAG Curncy) U.S. dollar spot rate. |
| 2 | Gold bullion is measured by the Bloomberg GOLDS Comdty Spot Price. |
| 3 | The S&P 500 or Standard & Poor’s 500 Index is a market-capitalization-weighted index of the 500 largest U.S. publicly traded companies. |
| 4 | R-squared values range from 0 to 1 and are commonly stated as percentages from 0% to 100%. An R-squared of 100% means that all movements of a security (or another dependent variable) are completely explained by movements in the index (or the independent variable(s) you are interested in). Source: Investopedia. |

Maria Smirnova, MBA, CFA
Managing Director, Sprott Inc.; Senior Portfolio Manager & Chief Investment Officer, Sprott Asset Management
Sprott Physical
Silver Trust
Important Disclosure
Past performance is no guarantee of future results. You cannot invest directly in an index. Investments, commentary and statements are that of the author and may not be reflective of investments and commentary in other strategies managed by Sprott Asset Management USA, Inc., Sprott Asset Management LP, Sprott Inc., or any other Sprott entity or affiliate. Opinions expressed in this commentary are those of the author and may vary widely from opinions of other Sprott affiliated Portfolio Managers or investment professionals.
This content may not be reproduced in any form, or referred to in any other publication, without acknowledgment that it was produced by Sprott Asset Management LP and a reference to sprott.com. The opinions, estimates and projections (“information”) contained within this content are solely those of Sprott Asset Management LP (“SAM LP”) and are subject to change without notice. SAM LP makes every effort to ensure that the information has been derived from sources believed to be reliable and accurate. However, SAM LP assumes no responsibility for any losses or damages, whether direct or indirect, which arise out of the use of this information. SAM LP is not under any obligation to update or keep current the information contained herein. The information should not be regarded by recipients as a substitute for the exercise of their own judgment. Please contact your own personal advisor on your particular circumstances. Views expressed regarding a particular company, security, industry or market sector should not be considered an indication of trading intent of any investment funds managed by Sprott Asset Management LP. These views are not to be considered as investment advice nor should they be considered a recommendation to buy or sell. SAM LP and/or its affiliates may collectively beneficially own/control 1% or more of any class of the equity securities of the issuers mentioned in this report. SAM LP and/or its affiliates may hold short position in any class of the equity securities of the issuers mentioned in this report. During the preceding 12 months, SAM LP and/or its affiliates may have received remuneration other than normal course investment advisory or trade execution services from the issuers mentioned in this report.
SAM LP is the investment manager to the Sprott Physical Bullion Trusts (the “Trusts”). Important information about the Trusts, including the investment objectives and strategies, purchase options, applicable management fees, and expenses, is contained in the prospectus. Please read the document carefully before investing. Investment funds are not guaranteed, their values change frequently and past performance may not be repeated. This communication does not constitute an offer to sell or solicitation to purchase securities of the Trusts. You will usually pay brokerage fees to your dealer if you purchase or sell units of the Trusts on the Toronto Stock Exchange (“TSX”) or the New York Stock Exchange (“NYSE”). If the units are purchased or sold on the TSX or the NYSE, investors may pay more than the current net asset value when buying units or shares of the Trusts and may receive less than the current net asset value when selling them.
The risks associated with investing in a Trust depend on the securities and assets in which the Trust invests, based upon the Trust’s particular objectives. There is no assurance that any Trust will achieve its investment objective, and its net asset value, yield and investment return will fluctuate from time to time with market conditions. There is no guarantee that the full amount of your original investment in a Trust will be returned to you. The Trusts are not insured by the Canada Deposit Insurance Corporation or any other government deposit insurer. Please read a Trust’s prospectus before investing.
The information contained herein does not constitute an offer or solicitation to anyone in the United States or in any other jurisdiction in which such an offer or solicitation is not authorized or to any person to whom it is unlawful to make such an offer or solicitation. Prospective investors who are not resident in Canada or the United States should contact their financial advisor to determine whether securities of the Funds may be lawfully sold in their jurisdiction.
The information provided is general in nature and is provided with the understanding that it may not be relied upon as, nor considered to be, the rendering or tax, legal, accounting or professional advice. Readers should consult with their own accountants and/or lawyers for advice on their specific circumstances before taking any action.