VANCOUVER, BC / ACCESSWIRE / September 5, 2023 / Rover Metals Corp. (TSXV:ROVR)(OTCQB:ROVMF)(FSE:4XO) (“Rover” or the “Company“) is pleased to announce that further to its releases of July 20, 2023 and June 23, 2023, Rover has received additional orders of $120,000 for its $0.08 Unit Financing. The Company has received approval from the Toronto Venture Exchange (the “TSXV”) to close the third and final tranche of its unit financing for gross proceeds of $120,000 (the “Third Closing”). The Company will issue 1,500,000 common shares and 1,500,000 warrants. The shares and warrants issued under the Third Closing will bear the minimum four-month regulatory hold period from the date of issuance.
The Company has raised a total of $797,000 under all closings of this financing, resulting in the issuance of 9,962,500 common shares and 9,962,500 common share purchase warrants. The warrants have a useful life of 30 months and an exercise price of $0.12. Finder’s fees in the amount of $36,200 and 452,500 finder’s warrants were paid in connection with this financing. The finder’s warrants bear the same terms as the unit warrants. The financing was led by experienced lithium investors from Europe and Australia.
Use of Proceeds
The proceeds from the Third Closing will be used for general and administrative expenses. Due to the wildfires and evacuation orders that remain in place, in and around the Yellowknife area, management of the Company is putting exploration plans for its IML Zinc-Copper project on hold until 2024.
Rover is a publicly traded junior mining company that trades on the TSXV under symbol ROVR, on the OTCQB under symbol ROVMF, and on the FSE under symbol 4XO. The Company has a diverse portfolio of mining resource development projects with varying exploration timelines. Its critical mineral projects include lithium, zinc, and copper. Its precious metals projects include gold and silver. The Company is exclusive to the mining jurisdictions of the U.S. and Canada.
You can follow Rover on its social media channels:
This news release contains statements that constitute “forward-looking statements.” Such forward-looking statements involve known and unknown risks, uncertainties and other factors that may cause Rover’s actual results, performance or achievements, or developments in the industry to differ materially from the anticipated results, performance or achievements expressed or implied by such forward-looking statements. Forward-looking statements are statements that are not historical facts and are generally, but not always, identified by the words “expects,” “plans,” “anticipates,” “believes,” “intends,” “estimates,” “projects,” “potential” and similar expressions, or that events or conditions “will,” “would,” “may,” “could” or “should” occur. There can be no assurance that such statements prove to be accurate. Actual results and future events could differ materially from those anticipated in such statements, and readers are cautioned not to place undue reliance on these forward-looking statements. Any factor could cause actual results to differ materially from Rover’s expectations. Rover undertakes no obligation to update these forward-looking statements in the event that management’s beliefs, estimates or opinions, or other factors, should change.
THE FORWARD-LOOKING INFORMATION CONTAINED IN THIS NEWS RELEASE REPRESENTS THE EXPECTATIONS OF THE COMPANY AS OF THE DATE OF THIS NEWS RELEASE AND, ACCORDINGLY, IS SUBJECT TO CHANGE AFTER SUCH DATE. READERS SHOULD NOT PLACE UNDUE IMPORTANCE ON FORWARD-LOOKING INFORMATION AND SHOULD NOT RELY UPON THIS INFORMATION AS OF ANY OTHER DATE. WHILE THE COMPANY MAY ELECT TO, IT DOES NOT UNDERTAKE TO UPDATE THIS INFORMATION AT ANY PARTICULAR TIME EXCEPT AS REQUIRED IN ACCORDANCE WITH APPLICABLE LAWS.
NEITHER THE TSX VENTURE EXCHANGE NOR ITS REGULATION PROVIDER (AS THAT TERM IS DEFINED IN THE POLICIES OF THE TSX VENTURE EXCHANGE) ACCEPTS RESPONSIBILITY FOR THE ADEQUACY OF THIS RELEASE.
HALIFAX, Nova Scotia, Aug. 22, 2023 (GLOBE NEWSWIRE) — Morien Resources Corp. (“Morien” or the “Company“) (TSX-V:MOX), is pleased to announce that its Board of Directors (the “Board”) has declared a dividend of $0.0025 (one quarter of one cent) per common share for the third quarter of 2023. The dividend will be paid on September 28, 2023, to shareholders of record at the close of business on September 12, 2023.
Morien’s quarterly dividend is intended to be step-variable in relation to Donkin Mine production expansion and coal price, having regard for the stability of cash flow, balance sheet protection and the need to maintain flexibility to secure new royalty assets. The declaration, amount and timing of future dividends will be subject to the Board’s determination that the payment of a dividend is in the best interest of Morien and its shareholders, having regard to the Company’s cash reserves, anticipated financial requirements, legal requirements for the declaration of dividends and other conditions existing at such time, including forward production guidance from Kameron Collieries LLC, owner/operator of the Donkin Mine. The Company’s Q3 2023 dividend payment will qualify as an ‘eligible dividend’ for Canadian income tax purposes.
Donkin Stop Work Order
As of the date of this news release, there remains a Stop Work Order (“SWO”) in effect at the Donkin Mine, put in place by the Nova Scotia Department of Labour, Skills and Immigration (“DOL”), the province’s regulator for the Mine, in response to a roof fall in one of Donkin’s two access tunnels. While SWO’s are meant to be temporary in duration, the timing for its release is unknown as it depends on DOL’s ability to timely assess the situation and suggest what corrective measures, if any, are required going forward. For additional detail, please see Morien’s recent news releases dated August 11, 2023, and August 15, 2023.
About Morien
Morien is a Canada based, mining development company that holds royalty interests in two tidewater accessed projects. The Donkin Coal Mine re-commenced production during the third quarter of 2022 and royalties to Morien have commenced. The Black Point Aggregate Project is permitted, and although production has not begun, Morien is receiving advanced minimum royalty payments on a quarterly basis. Morien’s management team exercises ruthless discipline in managing both the assets and liabilities of the Company. The Company’s management and its Board of Directors consider shareholder returns to be paramount over corporate size, number or scale of assets and industry recognition. The Company has 51,292,000 issued and outstanding common shares and a fully diluted position of 54,192,000. Further information is available at www.MorienRes.com.
Forward-Looking Statements
Some of the statements in this news release may constitute “forward-looking information” as defined under applicable securities laws. These statements reflect Morien’s current expectations of future revenues and business prospects and opportunities and are based on information currently available to Morien. Morien cautions that actual performance will be affected by a number of factors, many of which are beyond its control, and that future events and results may vary substantially from what Morien currently foresees. Factors that could cause actual results to differ materially from those in forward-looking statements include risks and uncertainties described in documents filed by Morien with the Canadian securities regulators on SEDAR (www.sedar.com) from time to time. Morien cautions that its royalty revenue will be based on production by third party property owners and operators who will be responsible for determining the manner and timing for the properties forming part of Morien’s royalty portfolio. These third party owners and operators are also subject to risk factors that could cause actual results to differ materially from those predicted herein including: volatility in financial markets or general economic conditions; capital requirements and the need for additional financing; fluctuations in the rates of exchange for the currencies of Canada and the United States; prices for commodities including coal and aggregate; unanticipated changes in production, mineral reserves and mineral resources, metallurgical recoveries and/or exploration results; changes in regulations and unpredictable political or economic developments; loss of key personnel; labour disputes; and ineffective title to mineral claims or property. There are other business risks and hazards associated with mineral exploration, development and mining. Although Morien believes that the forward-looking information contained herein is based on reasonable assumptions (including assumptions relating to economic, market and political conditions, the Company’s working capital requirements and the accuracy of information supplied by the operators of the properties in which the Company has a royalty interest), readers cannot be assured that actual results will be consistent with such statements. Morien expressly disclaims any intention or obligation to update or revise any forward-looking information in this news release, whether as a result of new information, events or otherwise, except in accordance with applicable securities laws. All dollar values discussed herein are in Canadian dollars. Any financial outlook or future-oriented financial information in this news release, as defined by applicable securities laws, has been approved by management of Morien as of the date of this news release. Such financial outlook or future-oriented financial information is provided for the purpose of providing information about management’s current expectations and plans relating to the future. Readers are cautioned that such outlook or information should not be used for purposes other than for which it is disclosed in this news release.
Neither the TSX Venture Exchange nor its Regulation Services Provider (as that term is defined in the policies of the TSX Venture Exchange) accepts responsibility for the adequacy or accuracy of this release.
For more information, please contact:
Dawson Brisco, President & CEO Phone: (902) 403-3149 dbrisco@MorienRes.com or John P.A. Budreski, Executive Chairman Phone: (416) 930-0914 www.MorienRes.com
Ottawa, Ontario–(Newsfile Corp. – August 15, 2023) – Gold79 Mines Ltd. (TSXV: AUU) (OTCQB: AUSVF) (“Gold79” or the “Company”) announces that it has issued 2,062,548 common shares of the Company in connection with a US$48,000 ($63,283) share payment due under the option agreement covering a portion of the Company’s landholdings for the Gold Chain project in Arizona. The common shares issued have a statutory hold period until December 15, 2023.
About Gold79 Mines Ltd.
Gold79 Mines Ltd. is a TSX Venture listed company focused on building ounces in the Southwest USA. Gold79 holds 100% earn-in option to purchase agreements on three gold projects: the Jefferson Canyon Gold Project and the Tip Top Gold Project both located in Nevada, USA, and, the Gold Chain Project located in Arizona, USA. In addition, Gold79 holds a 32.3% interest in the Greyhound Project, Nunavut, Canada under JV by Agnico Eagle Mines Limited.
For further information regarding this press release contact:
This press release may contain forward looking statements that are made as of the date hereof and are based on current expectations, forecasts and assumptions which involve risks and uncertainties associated with our business including the uncertainty as to whether further exploration will result in the target(s) being delineated as a mineral resource, capital expenditures, operating costs, mineral resources, recovery rates, grades and prices, estimated goals, expansion and growth of the business and operations, plans and references to the Company’s future successes with its business and the economic environment in which the business operates. All such statements are made pursuant to the ‘safe harbour’ provisions of, and are intended to be forward-looking statements under, applicable Canadian securities legislation. Any statements contained herein that are statements of historical facts may be deemed to be forward-looking statements. By their nature, forward-looking statements require us to make assumptions and are subject to inherent risks and uncertainties. We caution readers of this news release not to place undue reliance on our forward-looking statements as a number of factors could cause actual results or conditions to differ materially from current expectations. Please refer to the risks set forth in the Company’s most recent annual MD&A and the Company’s continuous disclosure documents that can be found on SEDAR at www.sedar.com. Gold79 does not intend, and disclaims any obligation, except as required by law, to update or revise any forward-looking statements whether as a result of new information, future events or otherwise.
Neither the TSX Venture Exchange nor its Regulation Services Provider (as that term is defined in the policies of the TSX Venture Exchange) accepts responsibility for the adequacy or accuracy of this release.
The Best Video on Why and When to Buy and Sell Physical Precious Metals:
I’m a licensed broker for Miles Franklin Precious Metals Investments, The Only Online Dealer that is Licensed and Bonded Period! Where we provide unlimited options to expand your precious metals portfolio, from:
Vancouver, British Columbia–(Newsfile Corp. – March 28, 2023) – EMX Royalty Corporation (NYSE American: EMX) (TSXV: EMX) (FSE: 6E9) (the “Company” or “EMX”) – is pleased to announce the filing of its 2022 annual report Form 40-F, which includes the audited financial statements for the year ended December 31, 2022, with the U.S. Securities and Exchange Commission (“SEC”) on EDGAR (www.sec.gov). EMX has also filed its Annual Information Form (AIF), audited Financial Statements (FS), and Management’s Discussion and Analysis (MD&A) for 2022 with Canadian securities regulators on SEDAR (www.sedar.com). The Company’s Form 40-F, AIF, audited FS, and MD&A are also available on EMX’s website at www.EMXroyalty.com under the heading “Investors”. Shareholders may receive a printed copy of the Company’s complete Financial Statements, or its complete Annual Information Form, free of charge, upon request to the Corporate Secretary at Suite 501 – 543 Granville Street, Vancouver, British Columbia V6C 1X8, Canada. All dollar amounts in this news release are USD unless otherwise noted.
HIGHLIGHTS
Financial Updates for the Year Ended December 31, 2022
Revenue and other income for the year ended December 31, 2022 was $18,277,000 (2021 – $7,526,000). Adjusted revenue and other income1 of $25,403,000 (2021 – $11,044,000) included $7,126,000 (2021 – $3,518,000) in income for the Company’s share of royalty revenue from the Caserones Mine (effective) royalty interest in Chile.
Net income for the year ended December 31, 2022 was $3,349,000 (2021 – loss of $23,731,000).
Operating cash flow for the year ended December 31, 2022 was $16,729,000 (2021 – cash used of $8,062,000). Adjusted operating cash flow1 from operations for the year ended December 31, 2022 was $21,953,000 (2021 – cash used of $6,356,000).
As at December 31, 2022, EMX had cash and cash equivalents of $15,508,000 (December 31, 2021 – $19,861,000), investments, long-term investments and loans receivable valued at $14,561,000 (December 31, 2021 – $18,170,000) and loans payable of $40,489,000 (December 31, 2021 – $50,733,000).
Corporate Updates
Timok Dispute Update On January 27, 2022 the Company announced that it had suspended the filing of a Notice of Arbitration to Zijin Mining Group Ltd (“Zijin”) regarding its royalty agreement covering the Timok project in Serbia, which includes the producing Cukaru Peki copper and gold mine. This suspension followed EMX’s previous announcement of its intention to file the Notice of Arbitration to formally dispute the royalty rate as defined under the Royalty Agreement (see EMX news release dated December 17, 2021). Discussions with Zijin have since proved amicable and productive. Both companies are expecting to execute a modified royalty agreement in 2023.
Settlement of the Bullion Litigation The Company’s wholly owned subsidiary, Bullion Monarch Mining, Inc. (“Bullion”), reached a settlement with Barrick Gold Corporation (“Barrick”) and Barrick affiliates and subsidiaries (“Barrick Entities”) with respect to Bullion’s claim of non-payment of royalties by the Barrick Entities to Bullion on production from properties in the Carlin Trend, Nevada. Bullion initiated litigation in 2008, before EMX acquired Bullion in 2012. Pursuant to the settlement, Barrick paid Bullion $25,000,000. Of the $25,000,000 settlement, $6,175,000 was paid as a fee to Bullion’s Reno, Nevada lawyers. The settlement of the lawsuit did not affect our 1% gross smelter return royalty from portions of Nevada Gold Mine’s Leeville, Carlin East, Four Corners, and other northern Carlin Trend underground gold mining operations (the “Leeville Royalty”), which continue to be paid.
Acquisition of Additional Royalty Interest on Caserones EMX acquired an additional (effective) 0.3155% Net Smelter Return (“NSR”) royalty on the Caserones Copper-Molybdenum Mine located in northern Chile for $25,742,000. When combined with EMX’s (effective) 0.418% NSR interest acquired in August 2021 (see EMX news release dated August 17, 2021), EMX’s new total totals to an (effective) 0.7335% NSR royalty interest.
Subsequent to the year ended December 31, 2022, the Company entered into certain agreements to acquire an additional 2.263% ownership in the underlying royalty holder, Sociedad Legal Minera California Una de la Sierra Peña Negra (“SLM”), for cash consideration of $3,517,000 pursuant to agreements with existing shareholders of SLM. The acquisition provides EMX with a further 0.0424% (effective) NSR interest in the Caserones property, increasing the Company’s NSR royalty interest to 0.7759%.
Acquisition of Royalty Portfolio from Nevada Exploration EMX executed a purchase and sale agreement (the “Agreement”) for a portfolio of royalties with Pediment Gold LLC, a wholly owned subsidiary of Nevada Exploration Inc. (“NGE”), for $500,000 (see EMX news release dated September 2, 2022). The portfolio consists of a 2% NSR royalty on NGE’s Nevada gold exploration portfolio covering ~62.5 square miles and includes four district-scale land positions, as well as certain other interests. In addition, if NGE options, farms out, or sells a project, then beginning on the first anniversary of the third-party agreement, EMX will receive advanced annual royalties of $20,000 that escalate $10,000 per year and are capped at $50,000. NGE has the right to buy back half of EMX’s 2% NSR royalty by purchasing a 0.5% NSR interest for $1,000,000 any time prior to the 7th anniversary of the Agreement and then, if the first NSR interest has been purchased, may purchase the second 0.5% NSR interest any time prior to production for $1,500,000.
Appointment of Independent Director EMX announced that Mr. Geoff Smith was appointed to the Board of Directors of the Company effective July 5, 2022. Mr. Smith brings to the board the benefit of 17 years of M&A and corporate finance experience having advised on or financed many of the largest, most complex and innovative streaming transactions in the past 10 years.
Royalty and Royalty Generation Updates In 2022, the Company’s royalty generation business was active in North America, South America, Europe, Turkey, Australia and Morocco. The Company spent $17,512,000 on royalty generation costs and recovered $8,577,000 from partners. Royalty generation costs include exploration related activities, technical services, project marketing, land and legal costs, as well as third party due diligence for acquisitions. During the year the Company also completed 10 partnerships across the portfolio while continuing to replace partnered properties with new royalty generation projects. In addition, our partners directly spent approximately $31,996,000 in exploration on the portfolio.
Producing Royalties
6
Advanced Royalties
11
Exploration Royalties
155
Royalty Generation Properties
96
Figure 1. EMX’s royalty and mineral property portfolio.
Initial production royalty payments were received from the Company’s Gediktepe oxide gold (silver) Royalty Property and Balya North polymetallic Royalty Property in Turkey (see respective EMX news releases dated September 9, and September 15, 2022). From Gediktepe EMX recognized $3,709,000 in royalty revenue and $4,000,000 in deferred milestone payments which will be paid in Q2 2023. EMX earned $276,000 from the Balya North Royalty Property in 2022.
EMX received a $3,000,000 milestone payment from Arizona Sonoran Copper Company, Inc. (“ASCU”) based upon declared resources totaling 200 million pounds or more of contained copper covered by the Company’s Parks-Salyer Royalty Property. ASCU’s maiden resource for its Parks-Salyer project, which is partially covered by EMX’s Royalty Property, was reported as total inferred underground resources of 143.6 million tons averaging 1.015% (total) copper and containing 2,915 million pounds of copper as oxide, enriched, and primary mineralization at variable cutoffs (see ASCU news release dated September 28, 2022). The Company retains a 1.5% NSR royalty covering the Parks-Salyer Royalty Property.
In the US, the Company added to its growing royalty portfolio with the completion of five new royalty agreements, the advancement of more than twenty-five partner-funded work programs, including nine drill projects, the acquisition of four large royalty positions from Nevada Exploration covering key land positions in Nevada, and new generative work leading to the acquisition of a district-wide land position at Tonopah, Nevada as well as a large (approximately 1,890 hectares), prospective land position in the Silver Valley district in Idaho. For the year, partners spent more than $18,000,000 on EMX’s early-stage US portfolio.
EMX’s Regional Strategic Alliance (“RSA”) with South32 Limited (“South32”) concluded in Q4 2022 after four years of generative exploration and project work. The Company is now following up on eleven priority projects identified by the RSA and retained by South32 for additional work, including an ongoing drill program at the Copper Springs porphyry copper project in Arizona’s Globe-Miami district.
In Canada, EMX programs advanced available properties in the portfolio as partners conducted multiple field programs, including drill programs on optioned and EMX royalty properties. EMX received C$577,000 in cash payments and C$52,000 in share equity payments during the year, while partners spent more than $3,700,000 in exploration expenditures advancing the portfolio.
EMX’s Latin American royalty portfolio advanced through field programs by Austral Gold Limited (at Morros Blancos and Morros Colorado), Pampa Metals Corporation (Block 4), and drill programs conducted by AbraSilver Resource Corp. (Diablillos), Aftermath Silver Ltd (Berenguela), and GR Silver Mining Ltd (San Marcial). In particular, the drill programs continued to produce significant results that expanded known resources and added new discoveries at nearby targets.
AbraSilver Resource Corp. (“AbraSilver”) announced an updated, open pit constrained mineral resource estimate for the Diablillos project’s Oculto deposit that included measured and indicated resources of 51.3 Mtonnes averaging 66 g/t silver (109 Moz contained Ag) and 0.79 g/t gold (1.3 Moz contained Au), as well as inferred resources of 2.2 Mtonnes averaging 30 g/t silver (2.1 Moz contained Ag) and 0.51 g/t gold (37 Koz contained Au) (see AbraSilver news release dated November 3, 2022). The updated resource was based upon drilling through Phase II. The ongoing Phase III drill program is designed to delineate a maiden resource estimate for the high-grade JAC zone discovery (see AbraSilver news release dated February 21, 2023).
In Northern Europe, the Company continued to develop its portfolio of projects, acquiring new gold and battery metals (nickel, copper and cobalt) royalty generation projects totaling nearly 175,000 hectares, and partnering four available properties. EMX also assisted with multiple partner-funded exploration and drilling programs. Overall, approximately $6,700,000 was spent by partners on EMX’s exploration royalty properties in Northern Europe during 2022.
Royalty generation programs proceeded in the Balkans and in Morocco, where multiple exploration license applications have been filed by the Company. New target areas are being assessed for further acquisitions.
Financing Updates
Sprott Credit Facility The Company entered into a credit facility in 2021 with Sprott Private Resource Lending II (Collector), LP (“Sprott”) totaling $44,000,000 (the “Credit Facility”). On January 24, 2022, the Company signed a credit agreement modification extending the maturity date to December 31, 2024. In connection with the extension, an additional 1.50% of the principal ($660,000) was added to the principal balance as at January 24, 2022.
Private Placement with Franco-Nevada The Company completed a $10,000,000 private placement with Franco-Nevada Corporation (“Franco-Nevada”). The proceeds were used to acquire the additional (effective) 0.3155% NSR royalty on the Caserones open pit mine in northern Chile (see EMX’s news release dated April 14, 2022).
Franco-Nevada purchased 3,812,121 units at C$3.30 per unit. Each unit consisted of one common share of EMX and one warrant to purchase one common share of EMX for C$4.45 exercisable until April 14, 2027. Franco-Nevada now owns approximately 3.5% of the issued and outstanding shares of EMX on an undiluted basis.
Repayment of Vendor Take Back Note The Company repaid in full the vendor take back note issued to SSR Mining Inc. totaling $8,319,000 including interest owed.
Exercise of Stock Options granted by EMX 1,110,000 stock options were exercised pursuant to the Company’s Stock Option Plan, which generated proceeds of $1,037,000 to EMX.
Investment Updates As at December 31, 2022, the Company had marketable securities of $9,970,000 (December 31, 2021 – $7,409,000), and $4,591,000 (December 31, 2021 – $8,761,000) in private investments. The Company will continue to generate cash flow by selling certain of its investments when appropriate. Much of the investment portfolio was derived from strategic investments, including Premium Nickel Resources Corporation (“PNR”), and royalty deals completed as part of our organic royalty generation business.
Strategic Investment in Premium Nickel Resources From 2020 through 2022, EMX acquired 5,412,702 shares of PNR, a private company with nickel-copper-cobalt assets in Botswana. On April 26, 2022, PNR announced the execution of a definitive agreement for a reverse takeover transaction (“RTO”) with North American Nickel Inc. (“NAN”) to create a new reporting entity, Premium Nickel Resources Ltd (“PNRL”). PNRL began trading on the TSX Venture Exchange in Q3 of 2022, having completed the RTO process with NAN. As a result of the RTO transaction, EMX’s interests were converted to 5,704,987 shares of PNRL, which represents roughly 5% of the issued and outstanding shares of PNRL.
OUTLOOK
The 2023 year will continue to see revenue and other income coming from our cash flowing royalties, including Leeville in Nevada, Gediktepe in Turkey, potentially Timok in Serbia (pending conclusion of discussions with Zijin), and our effective royalty interest on Caserones in Chile. As in previous years, production royalties will continue to be complemented by option, advance royalty, and other pre-production payments from partnered projects across the global asset portfolio. As a royalty holder, the Company has limited, if any, access to information on properties for which it holds royalties. Additionally, the Company may receive information from the owners and operators of the properties, which the Company is not permitted to disclose to the public pursuant to the underlying agreement or the information is not NI 43-101 compliant. Accordingly, the Company has not, and does not anticipate that it will have the ability to, provide guidance or outlook as to future production.
The Company will continue to strengthen its balance sheet over the course of the year by looking to retire portions of our long-term debt, continuing to evaluate equity markets, and the ongoing monetization of the Company’s marketable securities.
EMX is well positioned to identify and pursue new royalty and investment opportunities, while further filling a pipeline of royalty generation properties that provide opportunities for additional cash flow, as well as exploration, development, and production success.
Qualified Person. Michael P. Sheehan, CPG, a Qualified Person as defined by NI 43-101 and employee of the Company, has reviewed, verified, and approved the above technical disclosure on North America and Latin America. Eric P. Jensen, CPG, a Qualified Person as defined by NI 43-101 and employee of the Company, has reviewed, verified, and approved the above technical disclosure on Europe, Turkey, Australia, and Strategic Investments.
About EMX. EMX is a precious, base and battery metals royalty company. EMX’s investors are provided with discovery, development, and commodity price optionality, while limiting exposure to risks inherent to operating companies. The Company’s common shares are listed on the NYSE American Exchange and TSX Venture Exchange under the symbol “EMX”, and also trade on the Frankfurt exchange under the symbol “6E9”. Please see www.EMXroyalty.com for more information.
Neither the TSX Venture Exchange nor its Regulation Services Provider (as that term is defined in policies of the TSX Venture Exchange) accepts responsibility for the adequacy or accuracy of this release
Forward-Looking Statements This news release may contain “forward looking statements” that reflect the Company’s current expectations and projections about its future results. These forward-looking statements may include statements regarding perceived merit of properties, exploration results and budgets, mineral reserves and resource estimates, work programs, capital expenditures, timelines, strategic plans, market prices for precious and base metal, or other statements that are not statements of fact. When used in this news release, words such as “estimate,” “intend,” “expect,” “anticipate,” “will”, “believe”, “potential” and similar expressions are intended to identify forward-looking statements, which, by their very nature, are not guarantees of the Company’s future operational or financial performance, and are subject to risks and uncertainties and other factors that could cause the Company’s actual results, performance, prospects or opportunities to differ materially from those expressed in, or implied by, these forward-looking statements. These risks, uncertainties and factors may include, but are not limited to unavailability of financing, failure to identify commercially viable mineral reserves, fluctuations in the market valuation for commodities, difficulties in obtaining required approvals for the development of a mineral project, increased regulatory compliance costs, expectations of project funding by joint venture partners and other factors.
Readers are cautioned not to place undue reliance on these forward-looking statements, which speak only as of the date of this news release or as of the date otherwise specifically indicated herein. Due to risks and uncertainties, including the risks and uncertainties identified in this news release, and other risk factors and forward-looking statements listed in the Company’s MD&A for the year ended December 31, 2022 (the “MD&A”), and themost recently filed Annual Information Form (“AIF”) for the year ended December 31, 2022, actual events may differ materially from current expectations. More information about the Company, including the MD&A, the AIF and financial statements of the Company, is available on SEDAR at www.sedar.com and on the SEC’s EDGAR website at www.sec.gov.
1 Adjusted revenue and other income and adjusted cash provided by (used in) operating activities are non-IFRS financial measures with no standardized meaning under IFRS and might not be comparable to similar financial measures disclosed by other issuers. Refer to the “Non-IFRS financial measures” section of the Company’s annual MD&A for the year ended December 31, 2022 for more information on each non-IFRS financial measure.
The Best Video on Why and When to Buy and Sell Physical Precious Metals:
I’m a licensed broker for Miles Franklin Precious Metals Investments, The Only Online Dealer that is Licensed and Bonded Period! Where we provide unlimited options to expand your precious metals portfolio, from:
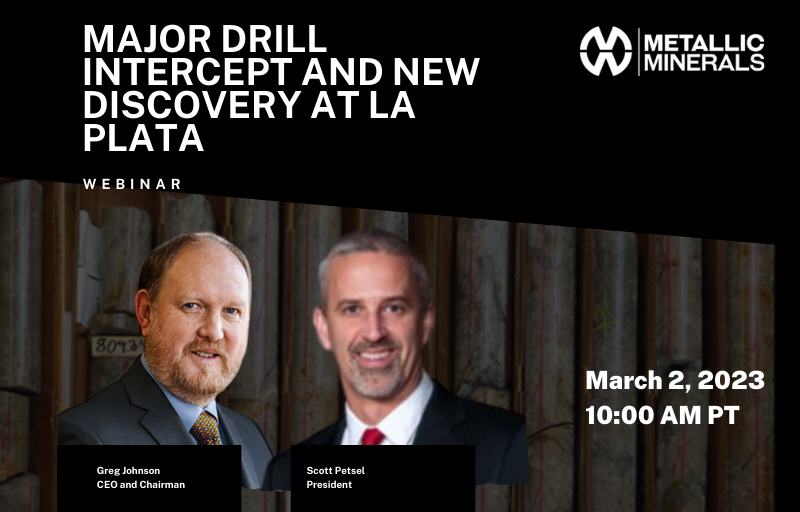
Register Here for the Metallic Minerals Live Webinar: https://bit.ly/3KPXJpn Press Release: https://bit.ly/3ZwEN31 Website: https://mmgsilver.com/ Investor Relations: Chris Ackerman Email: chris.ackerman@metallic-minerals.com Phone: 604-629-7800 ext. 1 Toll Free: 1-888-570-4420
TimeStamp: :47 Introduction to Metallic Minerals 1:18 On-Site to the La Plata Project/Mineral Resource Overview 3:31 Highlight from Press Release 6:00 Next Steps on the La Plata 7:13 Updated Resource 2023? 7:48 Latest Updates on the Keno Silver Project 12:13 MMG Partners with Discovery Channel – Parker Schnabel – Gold Rush 15:00 Will MMG be on the Show? 15:12 Alluvial Project Updates 17:00 Live Webinar (https://bit.ly/3KPXJpn) 18:24 MMG Capital Structure 19:09 Message to Shareholders
Metallic Minerals Corp. (TSX-V: MMG / US OTC: MMNGF) is a growth stage exploration company focused on the acquisition and development of high-grade silver and gold projects within underexplored districts proven to produce top-tier assets. Our objective is to create value through a disciplined, systematic approach to exploration, reducing investment risk and maximizing probability of long-term success. Our core Keno Silver Project is located in the historic Keno Hill Silver District of Canada’s Yukon Territory, a region which has produced over 200 million ounces of silver and currently hosts one of the world’s highest-grade silver resources. The Company’s La Plata silver-gold-copper project is located in the high-grade La Plata district of the prolific Colorado Mineral Belt and our McKay Hill project northeast of Keno Hill is a high-grade historic silver-gold producer. Metallic Minerals is also building a portfolio of gold royalties in the historic Klondike Gold District. Metallic Minerals is led by a team with a track record of discovery and exploration success, including large scale development, permitting and project financing.
Group Ten Metals: (TSX-V: PGE | OTCQB: PGEZF) Website: https://grouptenmetals.com/ Corporate Presentation: https://grouptenmetals.com/investors/presentations/
Granite Creek Copper: (TSX.V: GCX) Website: https://www.gcxcopper.com/ Corporate Presentation: https://www.gcxcopper.com/investors/presentations/
The Best Video on Why and When to Buy and Sell Physical Precious Metals:
I’m a licensed broker for Miles Franklin Precious Metals Investments, The Only Online Dealer that is Licensed and Bonded Period! Where we provide unlimited options to expand your precious metals portfolio, from:
TORONTO, Feb. 23, 2023 /CNW/ – Franco-Nevada Corporation (“Franco-Nevada” or the “Company“) (TSX: FNV) (NYSE: FNV) has been advised by its partner First Quantum Minerals Ltd. (“First Quantum“) that First Quantum’s subsidiary, Minera Panama, S.A. (“MPSA“), has suspended ore processing operations at the Cobre Panama mine. As previously announced, the Panama Maritime Authority (“AMP“) issued a resolution on January 26, 2023 requiring the suspension of concentrate loading operations at the Cobre Panama Port, Punta Rincón, until certification of the calibration of the scales by an accredited company had been initiated. Key updates as reported by First Quantum include:
MPSA believes it has complied with all requirements of the AMP resolution but copper concentrate loading operations are still not being permitted by the AMP
MPSA will begin a partial demobilization of its workforce and will take a systematic approach to reducing operations to ensure the safety of its workforce, prevent damage and degradation of equipment and preserve the integrity of the mine
If the AMP is to permit the recommencement of concentrate loading operations, MPSA could begin shipping concentrate and resuming operations at the mine within hours
Negotiations with the Government of Panama on a refreshed contract are continuing and First Quantum remains committed to achieving an outcome that will be to the benefit of all stakeholders and support the long-term operations of the Cobre Panama mine.
Please refer to First Quantum’s press release dated February 23, 2023 for further details.
Impact on Franco-Nevada
Franco-Nevada (Barbados) Corporation, a subsidiary of Franco-Nevada, holds two precious metal streams indexed to the copper-in-concentrate shipped by Cobre Panama. First Quantum’s 2023 guidance for uninterrupted production from Cobre Panama provided on January 16, 2023 was for 350kt to 380kt of copper production. This would translate into 131koz to 142koz of attributable GEO production to Franco-Nevada (calculating gold equivalence using $1,800/oz Au and $21.00/oz Ag prices).
Provided operations resume at Cobre Panama, the impact to Franco-Nevada of the suspension of operations should be limited to a deferral of revenue as the streams do not bear any associated carrying costs while operations are suspended.
Despite operations at the mine being suspended, Franco-Nevada remains highly profitable, continues to generate substantial cash flow, is debt-free, and has cash and working capital in excess of US$1 billion, an undrawn US$1 billion credit facility and limited financial commitments. Franco-Nevada remains in communication with First Quantum and will provide further updates as they are available.
Forward-Looking Statements
This press release contains “forward-looking information” and “forward-looking statements” within the meaning of applicable Canadian securities laws and the United States Private Securities Litigation Reform Act of 1995, respectively, which may include, but are not limited to, statements with respect to future events or future performance, management’s expectations regarding Franco-Nevada’s growth, results of operations, estimated future revenues, performance guidance, carrying value of assets, future dividends and requirements for additional capital, mineral reserve and mineral resource estimates, production estimates, production costs and revenue, future demand for and prices of commodities, expected mining sequences, business prospects and opportunities, the performance and plans of third party operators, audits being conducted by the CRA, the expected exposure for current and future assessments and available remedies, the outcome of any discussions between the Government of Panama and the operator of the Cobre Panama mine and the remedies relating to and consequence of any actions taken by the Government of Panama or the operator of the Cobre Panama mine. In addition, statements relating to reserves and resources, gold equivalent ounces (“GEOs”) and mine life are forward-looking statements, as they involve implied assessment, based on certain estimates and assumptions, and no assurance can be given that the estimates and assumptions are accurate and that such reserves and resources, GEOs or mine life will be realized. Such forward-looking statements reflect management’s current beliefs and are based on information currently available to management. Often, but not always, forward-looking statements can be identified by the use of words such as “plans”, “expects”, “is expected”, “budgets”, “potential for”, “scheduled”, “estimates”, “forecasts”, “predicts”, “projects”, “intends”, “targets”, “aims”, “anticipates” or “believes” or variations (including negative variations) of such words and phrases or may be identified by statements to the effect that certain actions “may”, “could”, “should”, “would”, “might” or “will” be taken, occur or be achieved. Forward-looking statements involve known and unknown risks, uncertainties and other factors, which may cause the actual results, performance or achievements of Franco-Nevada to be materially different from any future results, performance or achievements expressed or implied by the forward-looking statements. A number of factors could cause actual events or results to differ materially from any forward-looking statement, including, without limitation: fluctuations in the prices of the primary commodities that drive royalty and stream revenue (gold, platinum group metals, copper, nickel, uranium, silver, iron ore and oil and gas); fluctuations in the value of the Canadian and Australian dollar, Mexican peso, and any other currency in which revenue is generated, relative to the U.S. dollar; changes in national and local government legislation, including permitting and licensing regimes and taxation policies and the enforcement thereof; the adoption of a global minimum tax on corporations; regulatory, political or economic developments in any of the countries where properties in which Franco-Nevada holds a royalty, stream or other interest are located or through which they are held; risks related to the operators of the properties in which Franco-Nevada holds a royalty, stream or other interest, including changes in the ownership and control of such operators; relinquishment or sale of mineral properties; influence of macroeconomic developments; business opportunities that become available to, or are pursued by Franco-Nevada; reduced access to debt and equity capital; litigation; title, permit or license disputes related to interests on any of the properties in which Franco-Nevada holds a royalty, stream or other interest; whether or not the Company is determined to have “passive foreign investment company” (“PFIC”) status as defined in Section 1297 of the United States Internal Revenue Code of 1986, as amended; potential changes in Canadian tax treatment of offshore streams; excessive cost escalation as well as development, permitting, infrastructure, operating or technical difficulties on any of the properties in which Franco-Nevada holds a royalty, stream or other interest; access to sufficient pipeline capacity; actual mineral content may differ from the reserves and resources contained in technical reports; rate and timing of production differences from resource estimates, other technical reports and mine plans; risks and hazards associated with the business of development and mining on any of the properties in which Franco-Nevada holds a royalty, stream or other interest, including, but not limited to unusual or unexpected geological and metallurgical conditions, slope failures or cave-ins, flooding and other natural disasters, terrorism, civil unrest or an outbreak of contagious disease; the impact of the COVID-19 (coronavirus) pandemic; and the integration of acquired assets. The forward-looking statements contained in this press release are based upon assumptions management believes to be reasonable, including, without limitation: the ongoing operation of the properties in which Franco-Nevada holds a royalty, stream or other interest by the owners or operators of such properties in a manner consistent with past practice; the accuracy of public statements and disclosures made by the owners or operators of such underlying properties; no material adverse change in the market price of the commodities that underlie the asset portfolio; the Company’s ongoing income and assets relating to determination of its PFIC status; no material changes to existing tax treatment; the expected application of tax laws and regulations by taxation authorities; the expected assessment and outcome of any audit by any taxation authority; no adverse development in respect of any significant property in which Franco-Nevada holds a royalty, stream or other interest; the accuracy of publicly disclosed expectations for the development of underlying properties that are not yet in production; integration of acquired assets; and the absence of any other factors that could cause actions, events or results to differ from those anticipated, estimated or intended. However, there can be no assurance that forward-looking statements will prove to be accurate, as actual results and future events could differ materially from those anticipated in such statements. Investors are cautioned that forward-looking statements are not guarantees of future performance. In addition, there can be no assurance as to the outcome of the ongoing audit by the CRA or the Company’s exposure as a result thereof. Franco-Nevada cannot assure investors that actual results will be consistent with these forward-looking statements. Accordingly, investors should not place undue reliance on forward-looking statements due to the inherent uncertainty therein.
For additional information with respect to risks, uncertainties and assumptions, please refer to Franco-Nevada’s most recent Annual Information Form filed with the Canadian securities regulatory authorities on www.sedar.com and Franco-Nevada’s most recent Annual Report filed on Form 40-F filed with the SEC on www.sec.gov. The forward-looking statements herein are made as of the date of this press release only and Franco-Nevada does not assume any obligation to update or revise them to reflect new information, estimates or opinions, future events or results or otherwise, except as required by applicable law.
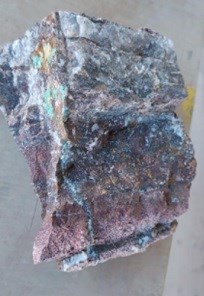
Burlington, Ontario–(Newsfile Corp. – February 15, 2023) – Silver Bullet Mines Corp. (TSXV: SBMI) (OTCQB: SBMCF) (‘SBMI’ or ‘the Company’) announces strong initial assay results from the interception of the upper main vein at the Buckeye Mine near Globe, Arizona.
The vein was intercepted approximately 380 feet from the entrance to the adit. Immediately on contact with the vein, the first significant assays from the vein were 43, 178.6, and 270.6 ounces silver per ton. The samples yielding these results did not include material from the footwall. The samples were selected at random from the mineralized material removed from the vein and then were sent to SBMI’s assay lab for processing.
The Company is now mining along the exposed vein with assay results pending from the face. SBMI has extended the workings to 420 feet from the entrance to the adit, the vein is ten feet wide and eleven feet high, and the footwall is estimated by the field team to be four feet wide.
SBMI has stockpiled in excess of 450 tons of vein material at surface at the Buckeye Mine site, for shipment to the mill. The Company is mining 150 to 200 tons of mineralized material per day, although this rate will vary. The Company believes it has achieved the targetted grade necessary to support processing this material at the Company’s mill and to then pour dore bars or create concentrate. Both the dore bars and the concentrate will saleable product, and the Company does not expect to encounter any significant difficulties in finding buyers for those products.
SBMI is also pleased to announce it has begun to resolve the issues with pouring dore bars from this material. The picture below shows a malformed dore bar from September, 2022.
The Company thanks Dr. Andrew Macdonald, a mineralogist with Harquail School of Earth Sciences at Laurentian University, for his assistance. Initial results from his work indicate the presence of a highly magnetic iron alloy in the mineralized material. The iron alloy smelts at temperatures of over 3000 degrees F, which is above the silver smelting temperature of roughly 1800 degrees F, and therefore it interferes with the silver smelting process. SBMI has confirmed this thesis by using a high intensity magnet to pull the iron alloy from the concentrate prior to smelting. The dore bar below, poured in February, 2023, resulted from concentrate after the iron alloy was removed.
Dore bar poured after the iron alloy was removed; Feb 2023
As a result, the Company intends to permanently install a high intensity magnetic separator in the milling operation to improve the likelihood the Company can smelt silver dore bars. The Company intends to store the magnetic concentrates for future research. Continued research will be needed.
The Company is still awaiting the check assay results from American Assay Labs and Actlabs.
SBMI’s near term goal is to process the higher grade material at the Company’s mill to produce saleable product.
QAQC
All the samples above were collected by SBMI’s field team. Samples were collected and placed in sample bags with their appropriate tag and processed at the Company’s own assay lab. Like any responsible producer, the Company owns its own assay lab and regularly takes samples as part of its production process.
The samples analyzed by SBMI at its facility near Globe, Arizona were processed through the Lab Jaw Crusher, Lab Hammer Mill and Splitter Box into an aliquot. Most of the pulverized aliquot was mixed with a flux and flour combination and melted in a crucible at 1,850 degree Fahrenheit, with the remainder being logged and archived. Upon cooling, the poured melt was in the form of a metal button and slag, following which a bone ash cupel was utilized to eliminate the lead in the button to form a bead. The bead was then weighed, following which a solution of 6 to 1 distilled water to nitric acid was utilized to dissolve the silver in the bead at approximately 175 degrees Fahrenheit. A much more detailed description of the process and a picture of the assay lab can be found at https://www.silverbulletmines.com/qaqcassaylab.
Readers should be aware that the SBMI facilities have been designed for quick production grade control and are not ISO compliant; however, duplicate sampling with other ISO labs has been done on past samples with good correlation.
Mr. Robert G. Komarechka, P.Geo., an independent consultant, has reviewed and verified SBMI’s work referred to herein, and is the Qualified Person for this release.
For further information, please contact:
John Carter Silver Bullet Mines Corp., CEO cartera@sympatico.ca +1 (905) 302-3843
Peter M. Clausi Silver Bullet Mines Corp., VP Capital Markets pclausi@brantcapital.ca +1 (416) 890-1232
Cautionary and Forward-Looking Statements
This news release contains certain statements that constitute forward-looking statements as they relate to SBMI and its subsidiaries. Forward-looking statements are not historical facts but represent management’s current expectation of future events, and can be identified by words such as “believe”, “expects”, “will”, “intends”, “plans”, “projects”, “anticipates”, “estimates”, “continues” and similar expressions. Although management believes that the expectations represented in such forward-looking statements are reasonable, there can be no assurance that they will prove to be correct.
By their nature, forward-looking statements include assumptions, and are subject to inherent risks and uncertainties that could cause actual future results, conditions, actions or events to differ materially from those in the forward-looking statements. If and when forward-looking statements are set out in this new release, SBMI will also set out the material risk factors or assumptions used to develop the forward-looking statements. Except as expressly required by applicable securities laws, SBMI assumes no obligation to update or revise any forward-looking statements. The future outcomes that relate to forward-looking statements may be influenced by many factors, including but not limited to: the impact of SARS CoV-2 or any other global virus; reliance on key personnel; the thoroughness of its QA/QA procedures; the continuity of the global supply chain for materials for SBMI to use in the production and processing of mineralized material; the presence of mineable economic mineralized material; shareholder and regulatory approvals; activities and attitudes of communities local to the location of the SBMI’s properties; risks of future legal proceedings; income tax matters; fires, floods and other natural phenomena; the rate of inflation; availability and terms of financing; distribution of securities; commodities pricing; currency movements, especially as between the USD and CDN; effect of market interest rates on price of securities; and, potential dilution. SARS CoV-2 and other potential global pathogens create risks that at this time are immeasurable and impossible to define.