VANCOUVER, BC / ACCESSWIRE / October 5, 2023 / Rover Metals Corp. (TSXV:ROVR)(OTCQB:ROVMF)(FSE:4XO) (“Rover” or the “Company“) is pleased to announce that it has added 2,400 acres of new claims to its Let’s Go Lithium (“LGL”) project, bringing the total project size to approximately 8,300 acres.
LGL Project Expansion
Management of the Company, working with McGinley and Associates, dba UES (“UES”), identified additional prospective ground contiguous to the existing claim block this summer. Further to the Company’s news release of September 7, 2023, Culter, and Ingraffia prospected and sampled the new claim area as part of this summer’s expanded Phase 1 Exploration Program. Multiple hectorite-like clay outcrops and high-grade lithium surface samples were encountered in the staking area. The Company believes that the project expansion will take advantage of a deeper hydrologic water flow system in the area. Management will be including the new claims into its Plan of Operations submission to the Bureau of Land Management (“BLM”) which it plans to file in short order.
Judson Culter, CEO at Rover Metals, states, “The addition of 2,400 acres to the LGL project gives us the flexibility of abandoning certain existing mining claims that border the ACEC boundary of Ash Meadows. We never intended to mine or develop near to Ash Meadows, and moving the core of the LGL project further away from Ash Meadows sends a clear message that Rover is committed to developing the project in a manner that is sustainable for the surrounding area. UES, are helping Rover to ensure that there will be no impact to the critical water tables in the Amargosa basin. Rover and UES have obtained a copy of the environmental assessment study that the neighbouring mine, operated by Lhoist North America, is operating under. Management at Rover feels confident that sustainable lithium mining can be supported in the Amargosa Valley.”
A Call for Battery Recycling Partnerships and Joint Ventures
The eastern Amargosa Valley has been slated for solar farm energy development by the BLM. Solar energy, in addition to the existing hydro energy infrastructure in the area, allows for new development opportunities like EV raw materials battery recycling. Rover is seeking inbound requests to partner with recycling technology companies. Please contact info@rovermetals.com with inquiries. The LGL project is a one and half hour drive from the city of Las Vegas, one of the fastest growing cities in the U.S.
Rover is a publicly traded junior mining company that trades on the TSXV under symbol ROVR, on the OTCQB under symbol ROVMF, and on the FSE under symbol 4XO. The Company has a diverse portfolio of mining resource development projects with varying exploration timelines. Its critical mineral projects include lithium, zinc, and copper. Its precious metals projects include gold and silver. The Company is exclusive to the mining jurisdictions of the U.S. and Canada.
You can follow Rover on its social media channels:
This news release contains statements that constitute “forward-looking statements.” Such forward-looking statements involve known and unknown risks, uncertainties, and other factors that may cause Rover’s actual results, performance, achievements, or developments in the industry to differ materially from the anticipated results, performance, or achievements expressed or implied by such forward-looking statements. Forward-looking statements are statements that are not historical facts and are generally, but not always, identified by the words “expects,” “plans,” “anticipates,” “believes,” “intends,” “estimates,” “projects,” “potential” and similar expressions, or that events or conditions “will,” “would,” “may,” “could” or “should” occur. There can be no assurance that such statements prove to be accurate. Actual results and future events could differ materially from those anticipated in such statements, and readers are cautioned not to place undue reliance on these forward-looking statements. Any factor could cause actual results to differ materially from Rover’s expectations. Rover undertakes no obligation to update these forward-looking statements in the event that management’s beliefs, estimates, opinions, or other factors, should change.
THE FORWARD-LOOKING INFORMATION CONTAINED IN THIS NEWS RELEASE REPRESENTS THE EXPECTATIONS OF THE COMPANY AS OF THE DATE OF THIS NEWS RELEASE AND, ACCORDINGLY, IS SUBJECT TO CHANGE AFTER SUCH DATE. READERS SHOULD NOT PLACE UNDUE IMPORTANCE ON FORWARD-LOOKING INFORMATION AND SHOULD NOT RELY UPON THIS INFORMATION AS OF ANY OTHER DATE. WHILE THE COMPANY MAY ELECT TO, IT DOES NOT UNDERTAKE TO UPDATE THIS INFORMATION AT ANY PARTICULAR TIME EXCEPT AS REQUIRED IN ACCORDANCE WITH APPLICABLE LAWS.
NEITHER THE TSX VENTURE EXCHANGE NOR ITS REGULATION PROVIDER (AS THAT TERM IS DEFINED IN THE POLICIES OF THE TSX VENTURE EXCHANGE) ACCEPTS RESPONSIBILITY FOR THE ADEQUACY OF THIS RELEASE.
Thirteen months ago at the first of September of 2022 silver hit a DSI (Daily Sentiment Indicator) of 9 for three days in a row. I said it was a bottom for silver. Stocks continued lower the month of September but my call on September 1st was correct. The DSI had correctly timed the bottom of silver to the day.
I’ll say it again. Dolly Varden (DV-V) is silver. Dolly Varden was $.355 at the low at the end of September last year and it went to $1.25 a tiny six months later. Dolly Varden is going to do exactly the same thing again. The crash I predicted nine weeks ago is here. It has started in a different form than I anticipated when on September 20th it was reported that the Fed Funds rate was going to stay higher for longer. This time it is shooting treasury rates and the dollar higher and forcing weak hands to dump silver and gold just like it did back in 2008. Treasury rates are going to continue to climb with the dollar index until the system blows sky high. Soon everyone is going to realize there is no soft landing coming. Investors will be looking for a safe haven and the only safe haven in town is the metals.
Dolly Varden is an interesting company in that it is 93% owned by insiders and large funds leaving a tiny float of only 7%. Fury owns 23% in exchange for Homestake. Hecla maintains a 10% interest as does Eric Sprott. Various institutions own another 50%. The shares are down 50% from a high in April without anything bad happening to the company. I make a point in my books that if nothing else changes and the price goes down of a stock you really like, that’s a good thing.
The company has a resource today of 140 million Ag EQ ounces based on the 43-101 released in 2019. It’s half gold and half silver. Since that now ancient resource, Dolly has drilled another 100,000 meters. Results from 40,000 meters of drilling will be released soon from over 100 holes. Dolly is in both the SIL and SILJ indexes which is why institutions are so heavily invested in the company. If they want to show a silver side, they pretty much have to own Dolly.
The silver intercepts continue to be world class. The last press release showing results from the Wolf Vein show 381 g/t Ag over 29.0 meters. At the surface the Wolf Vein was only 9 meters but 75 meters down it widened to 29 meters. That will add a lot of ounces.
Dolly Varden is an advertiser and I participated in the last private placement. Do your own due diligence, of course I am biased.
VANCOUVER, British Columbia, Oct. 03, 2023 (GLOBE NEWSWIRE) — West Red Lake Gold Mines Ltd.(“West Red Lake Gold” or “WRLG” or the “Company”) (TSXV:WRLG) is pleased to provide a project update and an outlook on project advancement in the near to medium term for the Madsen Mine and Rowan Mine projects located in the prolific Red Lake Gold District of Northwestern, Ontario, Canada.
PATH FORWARD
Additional 35,000 metre (“m”) drill program planned for Rowan Property to commence in early 2024, adding second drill and to include systematic in-fill drilling and expansion drilling of high-grade zones and begin testing high priority drill targets at Mt. Jamie, Red Summit and the NT Zone.
Complete initial Preliminary Economic Assessment (the “PEA”) on entire portfolio of Properties by Q2 2024 (based on drilling cutoff date of Oct 1, 2023)
Complete updated Mineral Resource Estimate (“MRE”) at Rowan by Q4 2024 (to include all anticipated drilling up to Q3 2024)
Complete 3,000 m drill program at Wedge, aimed to expand deposit and complete MRE by Q4 2024
Complete 38,000 m underground drill program at Madsen Mine by Q4 2024
Complete 3,200 m of underground development by Q4 2024 for access and required infrastructure to support underground drilling.
Develop a connecting ramp between the East and West declines at Madsen to increase waste hauling capacity from the West ramp which previously crossed two public roads, further reducing operating costs.
Put the Madsen Mine back into production in 2025.
Shane Williams, President, and CEO commented: “The team has done a fantastic job since the beginning of 2023, achieving many major milestones in the relatively short life of the re-vamped West Red Lake Gold Mines. In a difficult market we have managed to complete key acquisitions, raise a considerable amount of capital to fund our growing ambitions and assembled a team of noteworthy professionals with a track record of success at both the management and board levels. We have enjoyed a tremendous amount of exploration success via the drill-bit at our Rowan project which we hope to replicate at some very exciting targets in and around our newly acquired Madsen Mine. The coming year will be a very active time for the Company as we lay the groundwork to execute on our vision to put the Madsen Mine back into production and continue to unlock significant value for our shareholders.”
ROWAN PROPERTY
The 2023 drilling program at Rowan has been incredibly successful thus far. As such, the originally planned 17,000 m of drilling at the Rowan Mine target was expanded to 25,000 m and the team is on track to complete all planned drilling at Rowan.
Our understanding of the mineralization at Rowan has been greatly enhanced and results continue to confirm internal models and our exploration strategy continues to be validated by the results achieved. The mineralized set of veins at Rowan continues to deliver high-grade gold assays over significant widths that are in-line with or exceed those modelled in the December 2022 resource estimate. A few notable highlights from 2023 drilling at Rowan include:
Hole RLG-23-163B Intersected 8.3 m @ 70.80 grams per tonne (“g/t”) gold (“Au”) from 387 m to 395.3 m. This interval also included 0.5 m @ 1,120.19 g/t Au and represents the highest-grade intercept ever drilled at the Rowan project.
Hole RLG-23-149B Intersected 4.0 m @ 50.52 g/t Au, from 299 m to 303 m.
Hole RLG-23-153 Intersected 2.0 m @ 66.66 g/t Au, from 235 m to 237 m
Hole RLG-23-134 Intersected 8.0 m @ 10.34 g/t Au, from 71 m to 79 m
Hole RLG-23-156B Intersected 3.11 m @ 21.84 g/t Au, from 275 m to 278.11 m
Hole RLG-23-150 Intersected 4.2 m @ 15.40 g/t Au, from 384 m to 388.2 m
Hole RLG-23-154 Intersected 10.1 m @ 6.27 g/t Au, from 214.9 m to 225 m
Our strategy at Rowan for the remainder of 2023 will be to continue increasing confidence in the 827,462 ounces (“oz”) Inferred resource through systematic in-fill drilling. We will also look to step out and expand the Rowan resource by targeting mineralization outside of the current model and testing the down-dip and down-plunge extensions of the high-grade zones.
We plan on staying aggressive with the exploration strategy at Rowan in 2024, which will include the addition of a second drill early in the year to continue advancing the Rowan Mine target, and to begin testing high priority drill targets at Mt. Jamie, Red Summit, and the NT Zone. An additional 35,000 m of exploration drilling is planned for the Rowan Property in 2024. An updated mineral resource estimate for Rowan is anticipated to be completed in Q4 2024 and will include all drilling through Q3 2024.
It is the Company’s belief that potential synergies could exist between the high-grade Rowan deposit and our flagship Madsen Mine. Early indications suggest that the gold mineralization at Rowan could be amenable to gravity separation. As such, the Company has initiated a metallurgical study at Rowan to begin evaluating this opportunity, as well as a geotechnical study to better characterize the rock mass properties within the mineralized vein zones at Rowan.
Management maintains a high degree of confidence in the merits of the Rowan deposit and has initiated necessary baseline environmental and archaeological assessments to begin moving the Rowan project towards an Advanced Exploration Permit status – this permit will be required prior to collection of a bulk sample at Rowan.
MADSEN SATELLITE TARGETS AND REGIONAL EXPLORATION
After successfully completing the acquisition of the Madsen Mine the exploration team undertook a detailed review of the property. Several promising targets were identified and prioritized with the Wedge target emerging as our highest priority target.
Previous drilling highlights from the Wedge target include.
Hole PG17-486 Intersected 10.33 m @ 24.94 g/t Au, from 16.67 m to 27 m
Hole PG17-467 Intersected 16.6 m @ 17.49 g/t Au, from 11.45 m to 28 m
Hole PG17-482 Intersected 14.4 m @ 8.35 g/t Au, from 28 m to 42.4 m
Hole PG19-643 Intersected 1 m @ 108.5 g/t Au, from 103 m to 104 m
Surface exploration and drilling began in early September and the initial 3,000 m program is almost complete. Drilling is primarily focused on extending the high-grade zones defined at the Wedge Target. This new drilling will be used to support an updated Mineral Resource Estimate at Wedge to be completed by Q4 2024. Wedge currently hosts an Indicated resource of 56,100 oz of gold grading 5.6 g/t Au and an Inferred resource of 78,700 oz of gold grading 5.7 g/t Au1. The target is 2 km southwest of the Madsen Mine and is adjacent to the past-producing Starratt-Olsen Mine which historically processed 823,554 tonnes grading 6.16 g/t Au for ~163 koz of gold2. Drilling conducted at the Wedge target and other satellite targets near mine will be incorporated into an updated mineral resource estimate. We anticipate the update to be completed by Q4 2024.
A detailed and systematic review of all available exploration and geologic data for the Madsen property has also been initiated. This information will be digitized and compiled into working GIS and 3D modeling project files to allow for target ranking and prioritization ahead of the 2024 season. Most of the ground at Madsen remains underexplored and our geology team is already seeing a lot of opportunity for new discoveries across the district.
MADSEN PROJECT
Underground diamond drilling at Madsen has recommenced. A 38,000 m program has been designed for the first 12 months and will be focused on infill and expansion of the high-grade portions of the Austin and South Austin zones. We anticipate this drilling to define an inventory of high-confidence ore-grade (6-7 g/t Au) resource to serve as a starting point for a future restart plan. Additionally, underground development work is taking place at Madsen which will provide our team with the necessary access and infrastructure required to support the underground drilling program.
Mine design and scheduling for the first 12 months have been completed with subsequent phases to be determined based on the findings of the initial underground drilling and exploration program. The first development cuts have been taken at Madsen to provide access to the areas where infill drilling has already been planned. Mine design and scheduling consider the requirements of the operations and geology teams to ensure a full collaborative approach to advancing the project in a safe, efficient, and timely manner. Over the next 12 months the Company will complete approximately 3,200 m of underground development to support engineering and geological programs. We do not intend to conduct any stoping or commercial extraction for the next 12-15 months until the re-start strategy is significantly de-risked both technically and financially.
The Company will also develop a connecting ramp between the East and West declines. The current waste hauling at Madsen from the West ramp crosses two public roads (into Madsen town). This haul route is only allowed to be used during daylight hours. A connecting ramp would increase the number of hours the team can haul waste as well as eliminate double handling, thus reducing operating costs. It will also provide for increased safety for the surrounding community due to reduced traffic.
Additional and ongoing activities at the Madsen Mine will include, but are not limited to, shaft dewatering, water treatment and environmental monitoring.
MINERAL RESOURCE UPDATE AND PEA
The West Red Lake team is committed to a timely and successful restart that will maximize value for all our stakeholders. As such the team has engaged SRK Consulting and put in place the necessary programs required to complete a Preliminary Economic Assessment. The PEA will look to unlock and deliver robust economics by incorporating the Company’s entire portfolio of Red Lake assets which is made up of our Rowan Project and Madsen Mine with its accompanying satellite deposits.
Management firmly believes this approach is in-line with its vision for the Red Lake district and a potential Hub and Spoke model utilizing the Madsen processing facilities provides plenty of optionality and opportunity to greatly bolster the project economics.
West Red Lake intends to deliver this initial PEA by the end of Q2 2024. To achieve that milestone by the anticipated deadline the decision was made to establish an Oct 1, 2023, cut-off date for 2023 Rowan drilling data to be incorporated into this PEA. As such, the updated Rowan mineral resource estimate included in the upcoming PEA will be focused primarily on the high-grade East Zone, which has been the focus of drilling at Rowan so far in 2023 and is envisioned as the first area to be mined when production from Rowan commences. The PEA will then be followed up by a more comprehensive MRE update for Rowan by Q4 2024, which will include all drilling at Rowan through Q3 2024.
RECAP OF FIRST THREE QUARTERS OF 2023
Completed the successful acquisition of 100% of the Rowan Gold Project from Evolution Mining
Appointment of new CEO, Shane Williams, to lead the Company.
Strengthened Senior Management Team with addition of a new CFO and new VPs of Exploration, Technical Services, Corporate Development, and Community Relations.
Increased board strength with key appointees including Tony Makuch, Duncan Middlemiss, and Hugh Agro.
Successfully completed the acquisition of our flagship Madsen Mine asset while concurrently raising C$ 25M.
Completed Phase 1 Exploration Program at Rowan project and initiated expanded Phase 2 drilling campaign. Results from drilling in 2023 have exceeded expectations and as a result the program was expanded from the originally announced 17,000 meters to 25,000 meters. That expanded program is well underway.
Initiated surface drilling campaign at Wedge target – 2km southwest of Madsen Mine. The program consists of 3,000 meters of drilling to upgrade and expand the existing resource at Wedge.
Successfully completed flow-through financing of C$7 million, to further strengthen treasury position.
Underground development activities and shaft dewatering are underway at Madsen Mine.
SRK was awarded the contract to conduct Preliminary Economic Assessment and work program has been initiated.
ABOUT WEST RED LAKE GOLD MINES
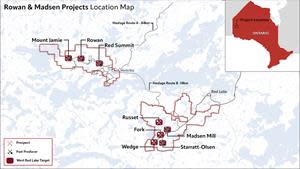
West Red Lake Gold Mines Ltd. is a mineral exploration company that is publicly traded and focused on advancing and developing its flagship Madsen Gold Mine and the associated 47 km2 highly prospective land package in the Red Lake district of Ontario. The highly productive Red Lake Gold District of Northwest Ontario, Canada has yielded over 30 million ounces of gold from high-grade zones and hosts some of the world’s richest gold deposits. WRLG also holds the wholly owned Rowan Property in Red Lake, with an expansive property position covering 31 km2 including three past producing gold mines – Rowan, Mount Jamie, and Red Summit.
image1
ON BEHALF OF WEST RED LAKE GOLD MINES LTD.
“Shane Williams”
Shane Williams President & Chief Executive Officer
Neither the TSX Venture Exchange nor its Regulation Services Provider (as that term is defined in the policies of the TSX Venture Exchange) accepts responsibility for the adequacy or accuracy of this release.
Certain statements contained in this news release constitute “forward-looking statements”. When used in this document, the words “anticipated”, “expect”, “estimated”, “forecast”, “planned”, and similar expressions are intended to identify forward-looking statements or information. These statements are based on current expectations of management, however, they are subject to known and unknown risks, uncertainties and other factors that may cause actual results to differ materially from the forward-looking statements in this news release. Readers are cautioned not to place undue reliance on these statements. West Red Lake Gold Mines Ltd. does not undertake any obligation to revise or update any forward- looking statements as a result of new information, future events or otherwise after the date hereof, except as required by securities laws.
The forward-looking statements contained in this press release are based on certain key expectations and assumptions made by the Company, including expectations and assumptions concerning: receipt of the necessary approvals, permits and access to and sufficiency of capital. Readers are cautioned that the foregoing list is not exhaustive of all factors and assumptions which have been used.
Although the Company believes that the expectations and assumptions on which the forward-looking statements are based are reasonable, undue reliance should not be placed on the forward-looking statements because the Company can give no assurance that they will prove to be correct. Since forward-looking statements address future events and conditions, by their very nature they involve inherent risks and uncertainties. Actual results could differ materially from those currently anticipated due to a number of factors and risks. These include, but are not limited to constraint in the availability of services, commodity price and exchange rate fluctuations, changes in legislation impacting the mining industry, adverse weather conditions and uncertainties resulting from potential delays or changes in plans with respect to projects or capital expenditures. These and other risks are set out in more detail in the Company’s Management’s Discussion and Analysis for the quarter ended May 31, 2023.
1 Mineral resources are estimated at a cut-off grade of 3.38 g/t Au and a gold price of US$1,800/oz. Please refer to the technical report entitled “Independent NI 43-101 Technical Report and Updated Mineral Resource Estimate for the PureGold Mine, Canada”, prepared by SRK Consulting (Canada) Inc. and dated June 16, 2023. A full copy of the SRK report is available on the Company’s website and on SEDAR.
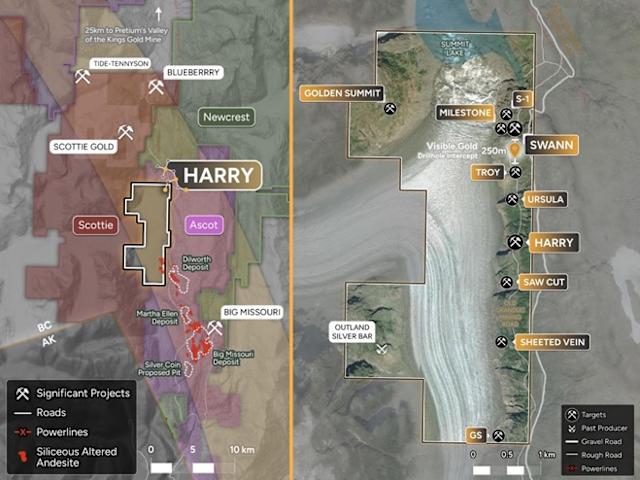
VANCOUVER, BC / ACCESSWIRE / October 3, 2023 / Blackwolf Copper and Gold Ltd. (“Blackwolf“, or the “Company“) (TSXV:BWCG),(OTC PINK:BWCGF) is pleased to announce that it has completed its initial drilling program targeting the Swann Zone on the Harry Property, recently acquired as part of the Optimum Ventures transaction. Seven drill holes were completed from two drill pads for a total of 1,740 meters of drilling, with each hole encountering significant mineralization. The sixth drill hole encountered coarse visible gold, including an approximately 10cm long streak at roughly 140 meters depth. This drill hole was approximately 250 meters from a 2021 diamond drill hole completed by Optimum Ventures at the Swann Zone which encountered 15.64 meters of 1437 g/t Silver Equivalent* (3.1 g/t Au, 433.4 g/t Ag, 0.60% Cu, 7.17% pb and 8.74% Zn) beginning at 8.75 meters depth. The Harry Property is located in the Golden Triangle, northwest of Stewart BC; it has road access and is situated between the past-producing Scottie Gold Mine and the historic Premier Gold Project, currently in re-development. Assays are pending and initial results are expected in the coming weeks.
The Swann Zone is a northwest trending structural corridor, typified by multiple, overlapping phases of quartz and sulphide veins. The sixth drill hole encountered coarse, visible gold in one of these vein phases. Based on previous surface sampling and limited drilling by Optimum Ventures, these different vein phases can host significant gold, silver and/or base metal-rich mineralization that can include pyrite, galena, sphalerite, tetrahedrite and other sulphosalt minerals. These multiphase, structurally complex and evolved metallogenic systems have similarities toother high-grade gold-silver deposits in the Golden Triangle such as Brucejack and Premier.
Figure 1. Harry Property, Regional Geology and significant deposits/mines.
Blackwolf’s CEO Morgan Lekstrom states, “The presence and quantity of visible gold in the drill core at the Swann Zone is promising. We eagerly await assay results from the Swann Zone, where drilling has expanded the strike length by an impressive 250 meters and remains open for expansion in all directions.”
*Silver Equivalent values were calculated by Optimum using Au USD/oz $1,977.40, Ag USD/oz $25.82, Cu USD/lb $4.72, Pb USD/lb $1.12, Zn USD/lb $2.05. All values are reported in USD and do not consider metal recoveries (see Optimum press release of April 20, 2022).
QA/QC and Qualified Person Analytical work for the Harry Project drill core samples will be completed by two analytical laboratories: MSA Labs of Langley, BC, and Bureau Veritas of Vancouver, BC, both of whom are certified analytical service providers.
At MSA Labs, samples will be prepared using procedure PRP-910 (dry, crush to 70% passing 2mm, riffle split off 250g, pulverize split to better than 85% passing 75 microns) and analyzed by method FAS-111 (30g fire assay with AAS finish) for gold and IMS-230 (1.0g, 4-acid digestion and ICP-MS analysis, 48 elements). Any samples containing >10g/t Au will be reanalyzed using method FAS-415 (30g Fire Assay with gravimetric finish). Samples containing >100 ppm Ag and/or >1% Cu, Pb, & Zn will be reanalyzed using method ICF-6 (0.2g, 4-acid digest and ore grade ICP-AES analysis). Samples containing >1000 g/t Ag will be reanalyzed using method FAS-418 (30g fire assay with AAS finish) and samples containing >20% Pb will be reanalyzed using method STI-8Pb (volumetric titration).
At Bureau Veritas, samples will be prepared using PRP70-250 (dry, crush to 70% passing 2mm, riffle split off 250g, pulverize split to better than 85% passing 75 microns) and analyzed by method FA-430 (30g fire assay with AAS finish) for gold and MA-200 (0.25, multi-acid digestion and ICP-ES/MS analysis, 45 elements). Any samples containing >10g/t Au will be reanalyzed using method FA530 (30g Fire Assay with gravimetric finish). Samples containing >100 ppm Ag and/or >1% Cu, Pb, & Zn will be reanalyzed using method MA-370 (1.0g, 4-acid digestion and ore grade ICP-AES analysis). Samples containing >1000 g/t Ag will be reanalyzed using method FA-530 (30g fire assay with AAS finish) and samples containing >20% Pb will be reanalyzed using method GC817. Samples with visible gold will be subject to method FS-632, a screen metallics analysis with duplicate minus fractions analyzed, and 30g fire assay for gold.
The 2023 Drilling Program at the Harry Property was completed using industry standard procedures, including a quality assurance/quality control (“QA/QC”) program consisting of the insertion of certified standard, blanks and duplicates into the sample stream. The Qualified Person has reviewed the data and detected no significant QA/QC issues.
Andrew Hamilton, P.Geo., Consultant to the Company, a Qualified Person under NI 43-101, has reviewed and approved the scientific and technical content of this release.
Investor Awareness and Marketing Agreement Blackwolf has retained i2i Marketing Group LLC (“i2i”) to provide ongoing marketing services including online content distribution and advertising. i2i will work to facilitate investor awareness about the Company and its exploration assets. i2i has been paid USD $250,000 to develop required content and for advertising for the two months or until such funds last. After exhaustion of the initial funds the budget may be adjusted monthly based on market conditions and Company requirements. The Company will not issue any securities to i2i in consideration for the marketing services. i2i does not have any prior relationship with the Company and the Company and i2i deal at arm’s length. i2i is based out of Odessa, Florida.
About Blackwolf Copper & Gold Ltd. Blackwolf’s founding vision is to be an industry leader in transparency, inclusion and innovation. Guided by our Vision and through collaboration with local and Indigenous communities and stakeholders, Blackwolf builds shareholder value through our technical expertise in mineral exploration, engineering and permitting. The Company holds a 100% interest in the high-grade Niblack copper-gold-zinc-silver VMS project, located adjacent to tidewater in southeast Alaska as well as six Hyder Area gold-silver and base metal properties in southeast Alaska and northwest British Columbia in the Golden Triangle, including the Cantoo and Harry properties. For more information on Blackwolf, please visit the Company’s website at www.blackwolfcopperandgold.com.
On behalf of the Board of Directors of Blackwolf Copper & Gold Ltd.
“Morgan Lekstrom” CEO and Director
For more information, contact:
Morgan Lekstrom 250-574-7350 (Mobile) 604-343-2997 (Office) MLL@bwcg.ca
Neither the TSX Venture Exchange nor its Regulation Services Provider (as that term is defined in the policies of the TSX Venture Exchange) accepts responsibility for the adequacy or accuracy of this release.
Cautionary Statement Regarding Forward-Looking Information This release includes certain statements and information that may constitute forward-looking information within the meaning of applicable Canadian securities laws. Forward-looking statements relate to future events or future performance and reflect the expectations or beliefs of management of the Company regarding future events. Generally, forward-looking statements and information can be identified by the use of forward-looking terminology such as “intends” or “anticipates”, or variations of such words and phrases or statements that certain actions, events or results “may”, “could”, “should”, “would” or “occur”. This information and these statements, referred to herein as “forward‐looking statements”, are not historical facts, are made as of the date of this news release and include without limitation, statements relating to the properties located in the Golden Triangle area and the Company’s future objectives and plans.Forward‐looking statements involve numerous risks and uncertainties and actual results might differ materially from results suggested in any forward-looking statements. These risks and uncertainties include, among other things, market volatility; the state of the financial markets for the Company’s securities; fluctuations in commodity prices and changes in the Company’s business plans.In making the forward-looking statements in this news release, the Company has applied several material assumptions that the Company believes are reasonable, including without limitation, that the Company will continue with its stated business objectives and its ability to raise additional capital to proceed. Although management of the Company has attempted to identify important factors that could cause actual results to differ materially from those contained in forward-looking statements or forward-looking information, there may be other factors that cause results not to be as anticipated, estimated or intended. There can be no assurance that such statements will prove to be accurate, as actual results and future events could differ materially from those anticipated in such statements. Accordingly, readers should not place undue reliance on forward-looking statements and forward-looking information. Readers are cautioned that reliance on such information may not be appropriate for other purposes. The Company does not undertake to update any forward-looking statement, forward-looking information or financial outlook that are incorporated by reference herein, except in accordance with applicable securities laws. The Company seeks safe harbor.
For more information on the Company, investors should review the Company’s continuous disclosure filings that are available at www.sedarplus.ca.
Vancouver, British Columbia–(Newsfile Corp. – October 2, 2023) – EMX Royalty Corporation (NYSE American: EMX) (TSXV: EMX) (FSE: 6E9) (the “Company” or “EMX”) is pleased to provide an update for EMX’s Hardshell royalty property, which is part of South32 Limited’s (“South32”) Hermosa Project in southeast Arizona. Recent drill results from the Peake prospect, which is partially covered by the Hardshell royalty, include the best intercept to date in hole HDS-813 reported as 139 meters (1302.7-1441.7 m) averaging 1.88% copper, 0.51% lead, 0.34% zinc, and 52 g/t silver, with a subinterval of 58.2 meters averaging 3.1% copper, 0.6% lead, 0.24% zinc, 74g/t silver and 0.015% molybdenum (true width not reported)1. EMX retains a 2% net smelter return (“NSR”) royalty on Hardshell that is not capped nor subject to buy down.
South32’s Hermosa Project is comprised of the a) Taylor polymetallic (Zn-Pb-Ag) development project adjacent to the north of Hardshell with carbonate replacement deposit (“CRD”) mineralization that projects towards EMX’s royalty footprint, b) the Peake Cu-Pb-Zn-Ag skarn prospect, which as currently outlined is mostly covered by EMX’s royalty ground, and c) the Clark manganese manto deposit to the east of the royalty footprint.
In addition to the encouraging drill results at Peake, other recent advances reported by South32 include the designation of Hermosa as the first mining project given FAST-41 status by the US Federal Permitting Improvement Steering Council to facilitate the potential to supply designated critical minerals (i.e., zinc and manganese), and an updated JORC mineral resource estimate for Taylor to support ongoing feasibility work. Although Taylor (and Clark) occur outside of EMX’s royalty property boundary, the Hermosa Project’s overall prospectivity is attracting capitalized exploration of US$23 million to test priority targets, including further drilling at Peake and other prospects2.
EMX’s Hardshell royalty was organically generated by the Company’s wholly-owned subsidiary Bronco Creek Exploration Inc. (“BCE”). BCE recognized the alteration and mineralization zoning patterns within the district, and staked prospective open ground. Hardshell was optioned in 2015 for a 2% NSR retained royalty interest. The Hermosa Project, including Hardshell, was acquired by South32 in 2018. Since then, South32 has steadily advanced Hermosa, which includes the step-out exploration drilling that continues to delineate mineralization at Peake. The recognition of mineralization at Peake highlights the discovery optionality of EMX’s Hardshell royalty property.
Discussion of Drill Results. South32’s drilling at Peake is delineating a series of stacked horizons that have a general north-westerly dip of 30 degrees and host disseminated to semi-massive sulphide mineralization. According to South32 “the upper and lower extents of the horizons tend to have polymetallic mineralisation with the central component dominated by copper sulphides, predominantly chalcopyrite. Mineralisation within the stacked profile is approximately 130 m thick, for an approximate 450 m strike and 300 m width.”
The Peake prospect is currently characterized by 17 diamond drill holes, with intercepts from the most recent four holes summarized in Table 1, and the previous 13 holes reported in EMX’s news release dated June 21, 2022. The recent intercepts in Table 1 have been reported at a 0.2% copper cutoff by South32, reflecting the early-stage nature of exploration and evaluation of the Peake prospect.
Intercepts reported by South32 at a 0.2% Cu cutoff, as summarized by EMX. True widths not reported. CuEq (%) = Cu% + 0.3965*Zn% + 0.2331*Pb% + 0.0068*Ag g/t. Average payable metallurgical recovery assumptions are 90% for Zn, 91% for Pb, 81% for Ag and 80% for Cu. Metals pricing assumptions are South32’s long-term consensus prices as at the April 2023 quarter. See South32 news release dated July 24, 2023.
Figure 1. Peake drilling and mineralized domain with EMX Hardshell royalty boundary as well as Taylor & Clark mineralized domains. Figure modified from figure 5 of South32 news release dated July 24, 2023.
Figure 2. Cross section looking east (2000 m wide) showing South32’s Peake drilling and mineralized domains as well as Taylor and Clark mineralized domains (see Figure 1 for A-A’ cross section line). Figure modified from figure 6 of South32 news release dated July 24, 2023.
Hermosa Project and Hardshell Royalty Property Overview. South32’s Hermosa Project, located in the Patagonia mining district of southeastern Arizona, includes CRD sulfide (i.e., Taylor) and oxide manto (i.e., Clark) deposits (which are not covered by EMX’s Hardshell royalty), as well as the Peake skarn prospect (partially covered by EMX’s Hardshell royalty). EMX’s Hardshell 2% NSR royalty property consists of 16 unpatented federal lode mining claims. South32 has stated that it (refer to FY 2023 Financial Results and Outlook and July 24, 2023 news release) is continuing to follow up on Peake’s exploration potential, which is open in several directions.
The ongoing delineation of the Peake prospect by South32 represents the potential to create significant value for the Company’s Hardshell royalty property. EMX looks forward to South32’s continued exploration success at Hardshell, as well as from the greater Hermosa Project.
Comments on Adjacent and Nearby Projects. The adjacent and nearby projects, which include the Taylor and Clark deposits, provide geological context for the Peake prospect, which is partially covered by EMX’s Hardshell royalty claim block. However, this is not necessarily indicative that the Hardshell royalty claim block represents similar styles or tonnages of mineralization as the Taylor deposit, nor a similar style of mineralization as the Clark deposit.
Qualified Person. Michael P. Sheehan, CPG, a Qualified Person as defined by National Instrument 43-101 and employee of the Company, has reviewed, verified and approved the disclosure of the technical information contained in this news release.
About EMX. EMX is a precious, base and battery metals royalty company. EMX’s investors are provided with discovery, development, and commodity price optionality, while limiting exposure to risks inherent to operating companies. The Company’s common shares are listed on the NYSE American Exchange and TSX Venture Exchange under the symbol “EMX”, and also trade on the Frankfurt exchange under the symbol “6E9”. Please see www.EMXroyalty.com for more information.
Neither the TSX Venture Exchange nor its Regulation Services Provider (as that term is defined in policies of the TSX Venture Exchange) accepts responsibility for the adequacy or accuracy of this release
Forward-Looking Statements
This news release may contain “forward-looking statements” that reflect the Company’s current expectations and projections about its future results. These forward-looking statements may include statements regarding perceived merit of properties, exploration results and budgets, mineral reserves and resource estimates, work programs, capital expenditures, timelines, strategic plans, market prices for precious and base metal, or other statements that are not statements of fact. When used in this news release, words such as “estimate,” “intend,” “expect,” “anticipate,” “will”, “believe”, “potential” and similar expressions are intended to identify forward-looking statements, which, by their very nature, are not guarantees of the Company’s future operational or financial performance, and are subject to risks and uncertainties and other factors that could cause the Company’s actual results, performance, prospects or opportunities to differ materially from those expressed in, or implied by, these forward-looking statements. These risks, uncertainties and factors may include, but are not limited to unavailability of financing, failure to identify commercially viable mineral reserves, fluctuations in the market valuation for commodities, difficulties in obtaining required approvals for the development of a mineral project, increased regulatory compliance costs, expectations of project funding by joint venture partners and other factors.
Readers are cautioned not to place undue reliance on these forward-looking statements, which speak only as of the date of this news release or as of the date otherwise specifically indicated herein. Due to risks and uncertainties, including the risks and uncertainties identified in this news release, and other risk factors and forward-looking statements listed in the Company’s MD&A for the quarter ended June 30, 2023 (the “MD&A”), and themost recently filed Annual Information Form (“AIF”) for the year ended December 31, 2022, actual events may differ materially from current expectations. More information about the Company, including the MD&A, the AIF and financial statements of the Company, is available on SEDAR at www.sedarplus.ca and on the SEC’s EDGAR website at www.sec.gov.
1 See South32 news release dated July 24, 2023. 2 See South32 “Financial Results and Outlook Year Ended 30 June 2023” dated August 24, 2023.
Vancouver, British Columbia–(Newsfile Corp. – September 28, 2023) – Goldshore Resources Inc. (TSXV: GSHR) (OTCQB: GSHRF) (FSE: 8X00) (“Goldshore” or the “Company“), is pleased to update the market with respect to results from the Company’s summer exploration program at the Moss Gold Project in Northwest Ontario, Canada (the “Moss Gold Project“).
Highlights:
Goldshore field crews have identified five unique gold mineralization trends including two polymetallic Au-Cu trends across the Moss Gold Project through a combination of ionic leach soil sampling and property wide field mapping with a combined strike of over 35 kilometers. Recent rock sample results include:
Moss Trend – 9.59 g/t Au and 60.6 g/t Ag plus 5.0 g/t Au, 96.2 g/t Ag, and 0.98% Cu from samples in diorite-hosted shears along strike from the current Mineral Resource
24.9 g/t Au and 9.99g/t Ag from samples of strongly altered dacite 200m south of the Moss Main zone, representing a new parallel zone.
Kawa Trend – 33.7 g/t Au, 0.64% Zn and 75.3ppm Mo from sheared diorite/volcanic contacts within a new 6.5 kilometer long belt.
Hamlin Trend – has been expanded to become an 8 kilometer long polymetallic Au-Ag-Cu-Mo belt with values including 0.73g/t Au, 0.14% Cu, 7.6 ppm Biand 7.1 ppm Te.
Coldstream Trend – has been widened to 800 meters through the discovery of parallel structures assaying 1.07 g/t Au and 0.98% Zn.
9.79 g/t Au from mafic-hosted carbonate shear veins at the “Benton” prospect, east of the East Coldstream deposit.
Vanguard Trend – 3.97% Cu, 1.73g/t Au and 19.1 g/t Ag plus 2.94 g/t Au in a 9 kilometer long belt of polymetallic VMS Cu-Zn-Au-Ag mineralization that is now found to be 120 meters wide through discovery of additional lenses.
President and CEO Brett Richards stated: “We have previously stated our confidence to the market that the Moss Project of c.183Mt containing an inferred resource of 6M oz Au at 1.02g/t (with 55% of the deposit hosting a shear domain at 1.84 g/t)1 could be the start to uncovering multiple deposits of gold mineralization, and polymetallic mineralization on our land package. The targets that we have identified and now sampled need to be drill tested to prove their voracity, and to provide a clearer picture on how best to prioritize the many targets we have previously highlighted to the market. The 30km trend of mineralization at Moss confirms the exciting potential of identifying and growing a large, multi-generational mining camp in the Shebandowan Greenstone belt.”
Field Program Update
Goldshore embarked on a property wide field reconnaissance program in June 2022 – in the background to drilling – exploring the numerous unexplained geophysical anomalies and under explored gold and base metal showings. This program accelerated over the last several months. The field crews have compiled a systematic interpretation of the project geology, structure, alteration, and mineralization across the Project. Through this investigation and in combination with a substantial ionic soil leach program, the historic gold showings and newly discovered mineralization have resolved to be part of five distinct mineralized trends, including two polymetallic trends.
Figure 1: Selective results from the ongoing Moss Gold Project field program
The Moss Trend has been confirmed over an 8-kilometer strike containing the existing resource. The mineralization is dominantly hosted in anastomosing shears through an extensive altered diorite package. This zone is consistent with a belt of magnetic low bodies (altered intrusions) adjacent to folded magnetic highs (magnetic-bearing wall rocks) that present a belt with a high competency and redox contrast. Recent work has discovered elevated copper and silver mineralization towards the southwestern extents with recent rock samples returning values including 9.59 g/t Au and 60.6 g/t Ag,5.0 g/t Au plus 96.2 g/t Ag, and 0.98% Cu. Samples of strongly altered dacite 200m south of the Moss Main zone returned assays of 24.9 g/t Au and 9.99g/t Ag, representing a new parallel zone. The field results confirm the interpretation from the step out and deep drilling at the Moss Gold Project that the mineralized corridor is at least 1,000 meters wide.
The Kawa Trend lies approximately 2 kilometers south of, and parallel to, the Moss Trend over a 6.5-kilometer strike length with a confirmed width of 550m. It has a similar magnetic character as the Moss Trend and mapping has shown that mineralization is hosted within and along a sheared diorite/volcanic contact. We therefore expect the Kawa Trend to have the same potential as the Moss Trend. Partial assays results have been received for this area with values including 33.7g/t Au.
The known Hamlin Trend has been extended by 4 kilometers to the east to form an 8-kilometer-long belt of polymetallic Au-Ag-Cu-Mo mineralization with a confirmed width from 400 to 700 meters. Recent expanded ICP analysis indicate additional Bi and Te potential. Partial assays results have been received for this area with values including 0.73g/t Au, 0.14% Cu, 7.6 ppm Biand 7.1 ppm Te.
The Coldstream Trend containing the East Coldstream deposit has a confirmed strike of 3.5 kilometers hosted by late shearing within altered mafic volcanics and includes the historic North Coldstream Cu-Co mine. Recent exploration has discovered parallel mineralized shears within the northern intermediate volcanics expanding the width potential of the mineralization with rock sample assays returning values including 1.07 g/t Au and 0.98% Zn.
The Vanguard Trend has an established 9-kilometer strike length of polymetallic VMS Cu-Zn-Au-Ag mineralization linking with the Iris Lake Au prospect through a series of untested geophysical conductors. Results from the recent exploration have discovered additional parallel gold bearing shears north of the main Vanguard showing and ignored by much of the historical exploration giving it width of 120 meters. Partial assays results have been received for this area with values including 3.97% Cu, 1.73g/t Au and 19.1 g/t Ag and 2.94 g/t Au.
Additional poorly understood prospects defined by historical prospecting and known to host Cu-Au mineralization have been confirmed toward the east, west, and south of the East Coldstream deposit with assay results including 9.79 g/t Au. Future exploration programs will focus on better understanding this mineralization and its potential.
Pete Flindell, VP Exploration for Goldshore, said “Goldshore’s geologists have done an excellent job of mapping and sampling through challenging terrain to uncover the additional mineralized potential of the Moss Gold Project. This includes ionic leach soil sampling across muskeg to understand the character of concealed structural targets. These results speak to district-scale potential of the Moss Gold Project.”
Corporate Announcement
Heather Laxton has resigned from the Goldshore board of directors with immediate effect. Heather was a nominee of Wesdome Gold Mines Ltd. and served on the Board since the listing of the Company.
Qualified Persons
Peter Flindell, P.Geo., MAusIMM, MAIG, Vice President – Exploration of the Company, a qualified person under NI 43-101 has approved the scientific and technical information contained in this news release.
About Goldshore
Goldshore is an emerging junior gold development company, and owns 100% of the Moss Gold Project located in Ontario. Wesdome is currently a large shareholder of Goldshore with an approximate 19% equity position in the Company. Well-financed and supported by an industry-leading management group, board of directors and advisory board, Goldshore is positioned to advance the Moss Gold Project through the next stages of exploration and development.
Peter Flindell, P.Geo., MAusIMM, MAIG, Vice President – Exploration of the Company, a qualified person under NI 43-101 has approved the scientific and technical information contained in this news release.
Neither the TSXV nor its Regulation Services Provider (as that term is defined in the policies of the TSXV) accepts responsibility for the adequacy or accuracy of this release.
For More Information – Please Contact:
Brett A. Richards President, Chief Executive Officer and Director Goldshore Resources Inc.
This news release contains statements that constitute “forward-looking statements.” Such forward looking statements involve known and unknown risks, uncertainties and other factors that may cause the Company’s actual results, performance or achievements, or developments to differ materially from the anticipated results, performance or achievements expressed or implied by such forward-looking statements. Forward looking statements are statements that are not historical facts and are generally, but not always, identified by the words “expects,” “plans,” “anticipates,” “believes,” “intends,” “estimates,” “projects,” “potential” and similar expressions, or that events or conditions “will,” “would,” “may,” “could” or “should” occur.
Forward-looking statements in this news release include, among others, statements relating to expectations regarding the exploration and development of the Moss Gold Project, the release of an updated mineral resource estimate and preliminary economic assessment, and other statements that are not historical facts. By their nature, forward-looking statements involve known and unknown risks, uncertainties and other factors which may cause our actual results, performance or achievements, or other future events, to be materially different from any future results, performance or achievements expressed or implied by such forward-looking statements. Such factors and risks include, among others: the Company may require additional financing from time to time in order to continue its operations which may not be available when needed or on acceptable terms and conditions acceptable; compliance with extensive government regulation; domestic and foreign laws and regulations could adversely affect the Company’s business and results of operations; the stock markets have experienced volatility that often has been unrelated to the performance of companies and these fluctuations may adversely affect the price of the Company’s securities, regardless of its operating performance; and the impact of COVID-19.
The forward-looking information contained in this news release represents the expectations of the Company as of the date of this news release and, accordingly, is subject to change after such date. Readers should not place undue importance on forward-looking information and should not rely upon this information as of any other date. The Company undertakes no obligation to update these forward-looking statements in the event that management’s beliefs, estimates or opinions, or other factors, should change.
1 NI 43-101 Technical Report – Mineral Resource Estimate for the Moss Lake Project, Ontario, Canada, dated effective May 5, 2023.
Longtime readers of 321Gold know I am a giant fan of the Daily Sentiment Indicator put out by Jake Bernstein. The DSI is sending out important signals such as bonds, the dollar, gold, silver, the Euro, the Swiss Franc, British Pound, Yen and the Aussie Dollar. Basically when readings go below 10 you are near a major bottom. When they go above 90 you are near a major top.
As of September 27th close of trading the DSI for treasuries is 10, 93 for the dollar, 8 for gold, 8 for silver, 5 for the Swiss Franc, 7 for the Euro, 10 for the Yen, 9 for the Aussie dollar and 12 for the British pound. To show that it really doesn’t matter what commodity the DSI tracks, the turns it projects says that even boring Orange Juice at 93 is about to tumble.
So in short, the dollar is getting close to a top, gold, silver, bonds and most currencies are near a bottom and about to turn higher. When these moves take place, it will happen all at the same time. Including OJ taking a swan dive.
These numbers are not as extreme as they have been in the past and don’t suggest a turn will happen tomorrow but it will happen soon. That could be as much as a month from now.
There are two kinds of investment information, signal and noise. For some reason many gold bugs are fixated on manipulation and price suppression as being important. I cannot agree. All financial markets are manipulated by everyone involved all of the time. So a sincere belief in manipulation of gold and silver provides no information that would lead to a profitable trade. In other words, if everything is manipulated, and that is true, who cares? You can’t profit. It generates neither a buy signal nor a sell signal. It’s noise, not signal. The DSI on the other hand is the most valuable and consistent signal I know of. In simple terms, you can take it to the bank.
The markets I have identified above are going to reverse direction in the next month. You can write that down on a piece of paper and take it to your local bank and cash it.
For those who are not subscribers to the DSI it seems expensive. Because it is. It is aimed at serious commodity traders who can make all of the cost up in one trade. But if you contact Jake and whine that you can’t afford it, he might give you a break. That’s what I did.
NOT FOR DISTRIBUTION TO THE U.S. NEWSWIRE OR FOR DISSEMINATION IN THE UNITED STATES
Vancouver, British Columbia, Sept. 25, 2023 (GLOBE NEWSWIRE) — Terra Balcanica Resources Corp. (“Terra” or the “Company”) (CSE:TERA; FRA:UB1) is pleased to announce closing of the final tranche of its non-brokered private placement financing (the “Offering”) of units (the ”Units”) for total gross proceeds of $1,212,778. The Company further announces that it has completed the 2,000 m, Phase II drill program at the flagship, 216 km2 Viogor-Zanik project (the “Project”) in eastern Bosnia and Herzegovina.
Highlights
In total, 17 diamond drill holes were completed during the 2023 Phase II campaign totalling approximately2,000m with a significant number of them macroscopically exhibiting sulphide mineralization. Twelve drill holes were completed at the polymetallic silver-lead-zinc Cumavici target while 5 holes were drilled at the Au-Cu, skarn-porphyry Brezani target (see Figures 1 and 2). All drillholes are at the ALS laboratory in Serbia with assays expected by the beginning of October;
Terra has raised $1,212,778 pursuant to the Offering announced on April 4th, 2023.
Terra Balcanica CEO, Dr. Aleksandar Mišković, commented: “The conclusion of exploration drillingperfectly coincided with the closing of the private placement financing. I am proud of the field efforts made by the entire team Terra Balcanica but equally thankful to all those who helped raise the funds needed to advance our key assets in Bosnia and Serbia. Having finalized an oversubscribed financing of over $1.2M in such a challenging macroeconomic environment is a positive signal and has allowed us to complete a robust, 17-hole 2,000-meterPhase II drill program and materially advance the flagship Viogor-Zanik project. The composite drill core samplesare now awaiting laboratory completionand an internal QA/QC check before being released as a part ofTerra’s steady news flow for months to come.”
Drilling Brezani Target Completed The 2023 diamond drilling at the Brezani target focussed on testing the coincident magnetic-conductivity anomaly at depth below the Au-skarn mineralisation observed on surface. Further shallow drillholes BRE23001-004 aimed to add scale to the initial 88 m at 0.61 g/t AuEq intercepted in drillhole BREDD002 (See Company’s news release dated 24th January 2023), all within a > 800 m NW/SE trending Au in soil anomaly.
Drillhole BREDD002: Continued from a depth of 215 m to 674 m in 2023 commencing in the same chlorite-sericite altered diorite which returned 0.26 g/t Au (214 – 215 m) in 2022 drilling. At a depth of 482.1 m a 9.8 m continuous zone of banded vein and sulphide cemented breccias with characteristics of both low and intermediate sulphidation epithermal deposits was intersected. The margins of the vein host repeating bands of chalcedonic quartz-rhodochrosite-calcite and sulphides/sulphosalts stibnite-pyrite-arsenopyrite-sphalerite-galena-jamesonite. The centre of the structure is dominated by hydrothermal breccia with a sulphide-quartz-carbonate cement. Clasts are banded vein fragments and wall rock hornfels. In the vein footwall the lithology changed to 118.4 m of chlorite-sericite altered diorite porphyry intrusive. Sinuous quartz-pyrite-molybdenite veins, quartz-magnetite, anhydrite-carbonate, pyrite-chlorite, and pyrrhotite-carbonate veining is present alongside disseminated pyrite-pyrrhotite.
Drillhole BRE23001: Located 102 m SW of the initial discovery hole at Brezani, which returned 0.61 g/t AuEq over 88 m from surface BRE23001 intercepted a similar package of calc-silicate mineralisation with a strong chlorite retrograde overprint. Intervals of coarse garnet-pyroxene skarn were also intercepted in contact with dioritic intrusives.
Figure 1. Geological map illustrating the 2022 and 2023 drillholes at the silver-dominated, polymetallic Cumavici Ridge target 12 km northwest from the Brezani target(click here to view image).
Drillhole BRE23002: Located 91 m west of BREDD002 intersected a new style of mineralization for the Brezani target. Commencing at 98 m depth a sulphide-calcite cemented contact breccia between altered diorite and silicic hornfels was encountered. The sulphide matrix was composed of pyrite-sphalerite-galena-pyrrhotite-chalcopyrite with individual sphalerite crystals up to 3 cm. The breccia was semi-continuous until 105.2m where it graded into patchy brecciation and intermediate sulphidation veining to 117.6 m. Detailed observations of BRE23001-004 will be completed and updates released in due course.
Figure 2. Geological map illustrating the 2022 and 2023 drillholes into the Brezani skarn-porphyry target. Note that the 2022 drillhole, BREDD002 was redrilled from 215 – 674 m during the 2023 drilling campaign.(click here to view image).
Final Tranche of Private Placement Financing Closed The Company issued an aggregate of 1,826,470 Units at a price of $0.085 per Unit for gross proceeds of $155,250 pursuant to the Offering announced on April 4th, 2023. Each Unit consists of one common share in the capital of the Company (each, a “Common Share”) and one Common Share purchase warrant (each whole warrant, a “Warrant”). Each Warrant entitles the holder to purchase one Common Share at an exercise price of $0.13 until September 22nd, 2026. Finders’ fees in the amount of $3,570 were paid in the final tranche of the Offering.
In total, the Company has issued 14,267,967 units at a price of $0.085 for gross proceeds of $1,212,778. Terra used the net proceeds of the Offering for working capital and to finance the Phase II drilling of the two target zones in Bosnia and Herzegovina.
Pursuant to applicable Canadian securities laws, all securities issued and issuable in connection with the closing of the fifth tranche of the Private Placement will be subject to a four (4) month hold period ending January 23rd, 2024.
This news release does not constitute an offer to sell or a solicitation of an offer to sell any of the securities in the United States. The securities have not been and will not be registered under the United States Securities Act of 1933, as amended (the “U.S. Securities Act”) or any state securities laws, and may not be offered or sold within the United States, or to or for the account or benefit of any U.S. person or any person in the United States, unless registered under the U.S. Securities Act and applicable state securities laws or an exemption from such registration is available. “United States” and “U.S. Person” are as defined in Regulation S under the U.S. Securities Act.
About the Company Terra Balcanica is a polymetallic exploration company targeting large-scale mineral systems in the Balkans of southeastern Europe. The Company has 90% interest in the Viogor-Zanik Project in eastern Bosnia and Herzegovina, 100% of the Kaludra and Ceovishte mineral exploration licences in southern Serbia. The Company emphasizes responsible engagement with local communities and stakeholders. It is committed to proactively implementing Good International Industry Practice (GIIP) and sustainable health, safety, and environmental management.
ON BEHALF OF THE BOARD OF DIRECTORS
Terra Balcanica Resources Corp. “Aleksandar Mišković”
This news release contains certain forward-looking information and forward-looking statements within the meaning of applicable securities legislation (collectively “forward-looking statements”). The use of any of the words“will”, “intends” and similar expressions are intended to identify forward-looking statements. These statements involve known and unknown risks, uncertainties and other factors that may cause actual results or events to differ materially from those anticipated in such forward-looking statements. Such forward-looking statements should not be unduly relied upon. Actual results achieved may vary from the information provided herein as a result of numerous known and unknown risks and uncertainties and other factors. The Company believes the expectations reflected in those forward-looking statements are reasonable, but no assurance can be given that these expectations will prove to be correct. The Company does not undertake to update these forward-looking statements, except as required by law.
VANCOUVER, British Columbia, Sept. 25, 2023 (GLOBE NEWSWIRE) — West Red Lake Gold Mines Ltd.(“West Red Lake Gold” or “WRLG” or the “Company”) (TSXV:WRLG) (OTCQB: WRLGF) is pleased to announce the appointment of Harpreet Dhaliwal to the position of Chief Financial Officer effective November 15, 2023.
Shane Williams, President & Chief Executive Officer, commented, “On behalf of entire West Red Lake Gold team, I would like to welcome Harpreet to the organization, and we are delighted to have someone of Harpreet’s caliber join the team. Harpreet’s experience in the mining industry in the CFO role is well established, and she joins West Red Lake Gold at an exciting time in the Company’s stage of development.”
Harpreet Dhaliwal, CPA, CA, is a highly regarded and accomplished financial executive with 16 years of extensive experience in the resource sector. A graduate of The University of British Columbia, Ms. Dhaliwal commenced her career in the public accounting field before transitioning to the resource sector working with Uranium One Inc., American Bonanza Gold Corp., Endeavour Mining Corp., Fiore Management & Advisory Corp and Leagold Mining Corp.
Most recently, Ms. Dhaliwal served as the Chief Financial Officer at NexGen Energy Ltd. Ms. Dhaliwal was responsible for implementing controls across the organization which led to NexGen’s successful inaugural SOX compliance reporting. She successfully led the filing of the $500M Base Shelf Prospectus and the $250M At-the-Market Equity Program and ensured compliance on all listed exchanges including Toronto Stock Exchange, New York Stock Exchange and Australian Securities Exchange. She was also responsible for the implementation of an ERP system, maintaining the Company’s IT infrastructure, and working with the project teams on delivering effective budgeting, forecasting and management reporting.
At her previous role at Leagold Mining Corp as CFO, she was responsible for the design and implementation of financial and management reporting, treasury, and working with the operations and project teams on developing budgets and forecasts for multiple producing multi-jurisdictional mines. She was a valuable member of a team that successfully completed numerous mergers and acquisitions supported by debt and equity financings and led integrated lean and efficient finance teams.
The Company would like to thank current CFO & Corporate Secretary, Jasvir Kaloti for her continued dedication and contributions. Jasvir Kaloti will remain as the Corporate Secretary following the appointment of Harpreet Dhaliwal as CFO on November 15, 2023.
The Company further announces that it has entered into an agreement dated September 14, 2023 to issue 50,000 common shares (the “Debt Shares”) of the Company at a deemed price of $0.60 per Debt Share in settlement of $30,000 of amounts owing to an arm’s length creditor. The issuance of the Debt Shares is subject to the prior approval of the TSX Venture Exchange.
ABOUT WEST RED LAKE GOLD MINES LTD.
West Red Lake Gold Mines Ltd. is a mineral exploration company that is publicly traded and focused on advancing and developing its flagship Madsen Gold Mine and the associated 47 km2 highly prospective land package in the Red Lake district of Ontario. The highly productive Red Lake Gold District of Northwest Ontario, Canada has yielded over 30 million ounces of gold from high-grade zones and hosts some of the world’s richest gold deposits. WRLG also holds the wholly owned Rowan Property in Red Lake, with an expansive property position covering 31 km2 including three past producing gold mines – Rowan, Mount Jamie, and Red Summit.
2023-09-12-NR_WRLG_Project_Location_Map
ON BEHALF OF WEST RED LAKE GOLD MINES LTD.
“Shane Williams”
Shane Williams President & Chief Executive Officer
Neither the TSX Venture Exchange nor its Regulation Services Provider (as that term is defined in the policies of the TSX Venture Exchange) accepts responsibility for the adequacy or accuracy of this release.
Certain statements contained in this news release constitute “forward-looking statements”, including, among others, statements relating to expectations regarding the appointment of Harpreet Dhaliwal, and the issuance of the Debt Shares in settlement of certain accounts payable. When used in this document, the words “anticipated”, “expect”, “estimated”, “forecast”, “planned”, and similar expressions are intended to identify forward-looking statements or information. These statements are based on current expectations of management, however, they are subject to known and unknown risks, uncertainties and other factors that may cause actual results to differ materially from the forward-looking statements in this news release. Readers are cautioned not to place undue reliance on these statements. West Red Lake Gold Mines Ltd. does not undertake any obligation to revise or update any forward- looking statements as a result of new information, future events or otherwise after the date hereof, except as required by securities laws.