 Proven Probable
Vancouver, British Columbia–(Newsfile Corp. – November 10, 2025) – EMX Royalty Corporation (NYSE American: EMX) (TSXV: EMX) (FSE: 6E9) (the “Company” or “EMX”) is pleased to announce that the Supreme Court of British Columbia has granted the final order in connection with the Company’s plan of arrangement (the “Arrangement“) with Elemental Altus Royalties Corp. (TSXV: ELE) (OTCQX: ELEMF) (“Elemental Altus“) and 1554829 B.C. Ltd. (“Acquireco“), pursuant to which Elemental Altus will, among other things, indirectly through an amalgamation of EMX with Acquireco, acquire all of the issued and outstanding common shares of EMX.
Elemental Altus has filed an application to list its common shares on the Nasdaq Capital Market (“Nasdaq“) under the ticker symbol “ELE”. Due to the ongoing United States federal government shutdown, which presently includes the U.S. Securities and Exchange Commission (“SEC“), the Nasdaq has advised that it cannot further advance the listing application until such time as the SEC reopens to complete its review. EMX and Elemental Altus currently expect that the Nasdaq approval of Elemental Altus’s listing application should be forthcoming following the end of the government shutdown and reopening of the SEC and completion of its review process. Until trading commences on the Nasdaq, Elemental Altus’s common shares will continue to trade on the TSX Venture Exchange under the ticker symbol “ELE” and on the OTCQX Best Market under the ticker symbol “ELEMF”.
Subject to obtaining all required approvals and the satisfaction or waiver of all required conditions, the Arrangement is expected to close by mid-November 2025. Following closing of the Arrangement, the EMX shares are expected to be de-listed from the TSX Venture Exchange, NYSE American Exchange and Frankfurt Stock Exchange (the “De-Listing“). Following the De-Listing, it is anticipated that EMX will apply to cease to be a reporting issuer under applicable Canadian securities laws.
For a more detailed description of the Arrangement, please refer to EMX’s management information circular dated September 29, 2025, available under the Company’s profile on SEDAR+ at www.sedarplus.ca and on EDGAR at www.sec.gov, and on the Company’s website at https://emxroyalty.com/investors/special-meeting/.
On Behalf of EMX
David Cole
CEO
For further information, contact:
| David M. Cole President and CEO Phone: (303) 973-8585 Dave@EMXroyalty.com | Stefan Wenger Chief Financial Officer Phone: (303) 973-8585 SWenger@EMXroyalty.com | Isabel Belger Investor Relations Phone: +49 178 4909039 IBelger@EMXroyalty.com |
About EMX
EMX is a precious and base metals royalty company. EMX’s investors are provided with discovery, development, and commodity price optionality, while limiting exposure to risks inherent to operating companies. The EMX shares are listed on the NYSE American Exchange and TSX-V under the symbol “EMX”. Please see www.EMXroyalty.com for more information.
Cautionary Note Regarding Forward-Looking Information
This press release may contain “forward-looking information” within the meaning of applicable Canadian securities laws and “forward-looking statements” within the meaning of the United States Private Securities Litigation Reform Act of 1995, (collectively, “forward-looking statements“) that reflect the Company’s current expectations and projections about its future results. These forward-looking statements may include statements regarding EMX and the combined company’s plans and expectations with respect to the proposed Arrangement and the anticipated impact of the Arrangement on the combined company’s results of operations, financial position, growth opportunities and competitive position. Any statements that express or involve discussions with respect to predictions, expectations, beliefs, plans, projections, objectives, assumptions or future events or performance (often, but not always, identified by words or phrases such as “expects,” “anticipates,” “believes,” “plans,” “projects,” “targets,” “schedules,” “forecasts,” “budget,” “estimates,” “assumes,” “intends,” “strategy,” “goals,” “objectives,” “potential,” “possible” or variations thereof or stating that certain actions, events, conditions or results “may,” “could,” “would,” “should,” “might” or “will” be taken, occur or be achieved, or the negative of any of these terms and similar expressions) are not statements of historical fact and may be forward-looking statements.
Forward-looking statements are subject to known and unknown risks, uncertainties and other important factors that may cause the actual results, level of activity, performance or achievements of the Company to be materially different from those expressed or implied by such forward-looking statements, including but not limited to: the risk that any other condition to closing may not be satisfied or waived; the risk that the closing of the Arrangement might be delayed or not occur at all; the risk that either EMX or Elemental Altus may terminate the definitive arrangement agreement and either EMX or Elemental Altus is required to pay a termination fee to the other party; potential adverse reactions or changes to business or employee relationships of EMX or Elemental Altus, including those resulting from the completion of the Arrangement; the diversion of management time on Arrangement-related issues; the risk of tax consequences for Securityholders and Elemental Altus securityholders if the Arrangement does not qualify as a tax-deferred reorganization; the ultimate timing, outcome and results of integrating the operations of EMX and Elemental Altus; the effects of the business combination of EMX and Elemental Altus, including the combined company’s future financial condition, results, operations, strategy and plans; the ability of the combined company to realize anticipated synergies in the timeframe expected or at all; changes in capital markets and the ability of the combined company to finance its activities in the manner expected; the inability to satisfy the listing requirements to be listed on a U.S. stock exchange; the possibility that EMX or Elemental Altus fail to comply with applicable laws prior to the Arrangement which could subject the combined company to penalties; the risk that EMX or Elemental Altus may not receive the required stock exchange and regulatory approvals to effect the Arrangement; the risk of any litigation relating to the Arrangement; the fact that business disruption may be greater than expected following the public announcement or consummation of the Arrangement; the risk that the combined company does not result in a larger, well capitalized entity with a lower cost of capital which could prevent the combined company from pursuing further accretive royalty opportunities in the market; the absence of control over mining operations from which the Company will receive royalties or stream interests from; and risks related to those mining operations and royalty and stream interests, including risks related to international operations, government and environmental regulation, actual results of current exploration activities, conclusions of economic evaluations and changes in project parameters as plans continue to be refined, risks in the marketability of minerals, fluctuations in the price of gold and other commodities, fluctuation in foreign exchange rates and interest rates, stock market volatility, as well as those factors discussed in the EMX risk factors listed in EMX’s Management’s Discussion and Analysis for the six months ended June 30, 2025 and its Annual Information Form dated March 12, 2025 filed under EMX’s profile on SEDAR+ at www.sedarplus.ca and on EDGAR at www.sec.gov.
EMX’s forward-looking statements are based on the applicable assumptions and factors management considers reasonable as of the date hereof, based on the information available to management at such time. Although the Company has attempted to identify important factors that could cause actual results to differ materially from the Company in forward-looking statements, there may be other factors that cause results not to be as anticipated, estimated or intended. There can be no assurance that such statements will prove to be accurate, as actual results and future events could differ materially from those anticipated in such statements. Accordingly, readers should not place undue reliance on forward-looking statements. The Company does not undertake to update any forward-looking statements that are contained or incorporated by reference, except in accordance with applicable securities laws.
Neither the TSX-V nor its Regulation Service Provider (as that term is defined in the policies of the TSX-V.) accepts responsibility for the adequacy or accuracy of this press release.

To view the source version of this press release, please visit https://www.newsfilecorp.com/release/273715
Apollo Silver is Advancing the Second Largest Primary Silver Asset in the US
VANCOUVER, British Columbia, Nov. 06, 2025 (GLOBE NEWSWIRE) — Apollo Silver Corp. (“Apollo Silver” or the “Company”) (TSX.V:APGO, OTCQB:APGOF, Frankfurt:6ZF) is pleased to announce that the US Department of the Interior has added 10 minerals, including silver, to the US Geological Survey (“USGS”) 2025 List of Critical Minerals. For the first time, silver is recognized as having growing importance to US economic and national security. This inclusion signals enhanced government focus on securing domestic supply chains through enhanced permitting, subsidies, and strategic stockpiling initiatives.
“Apollo Silver welcomes the US government’s efforts to strengthen domestic silver mining by placing silver on the USGS List of Critical Minerals,” stated Ross McElroy, President and CEO of Apollo Silver. “This development will not only bring increased investor attention to the sector but will also help boost Apollo’s profile of its Calico Silver Project, which hosts the country’s 2nd largest primary silver deposit in the US. The inclusion of silver on the Critical Minerals List strengthens the project’s case for consideration under the Fast-41 program, a US government initiative aimed at streamlining permitting processes for critical and resource projects. With the US importing 64% of its silver consumption in 2024, this designation emphasizes silver’s strategic value and irreplaceable role across both industrial and defense industries.”
Apollo Silver’s Calico Project, located in San Bernardino County, California, recently announced its updated Mineral Resource Estimate (“MRE”), with a combined Measured and Indicated total of 55 million tonnes (“Mt”) at a grade of 71 grams per tonne (“g/t”) for a total of 125 million ounces (“Moz”) of silver (“Ag”), and an Inferred total of 17.6 Mt at a grade of 71g/t Ag for a total of 58 Moz Ag (see Apollo’s news release dated September 4, 2025, and October 16, 2025).
About Critical Minerals
The Energy Act of 2020 defined critical minerals as those commodities that are essential to the economic or national security of the US; have a supply chain that is vulnerable to disruption; and serve an essential function in the manufacturing of a product, the absence of which would have significant consequences for the economic or national security of the US.1
Qualified Person
The scientific and technical data contained in this news release was reviewed and approved by Isabelle Lépine, M.Sc., P.Geo., Apollo Silver’s Director, Mineral Resources. Ms. Lépine is a registered professional geologist in British Columbia and a QP as defined by NI 43-101 and is not independent of the Company.
ABOUT APOLLO SILVER CORP.
Apollo Silver is advancing the second largest undeveloped primary silver projects in the US. The Calico Project hosts a large, bulk minable silver deposit with significant barite and zinc credits – recognized as critical minerals essential to the U.S. energy, industrial and medical sectors. The Company also holds an option on the Cinco de Mayo Project in Chihuahua, Mexico, which is host to a major carbonate replacement (CRD) deposit that is both high-grade and large tonnage. Led by an experienced and award-winning management team, Apollo Silver is well positioned to advance the assets and deliver value through exploration and development.
Please visit www.apollosilver.com for further information.
ON BEHALF OF THE BOARD OF DIRECTORS
Ross McElroy
President and CEO
For further information, please contact:
Email: info@apollosilver.com
Telephone: +1 (604) 428-6128
Neither the TSX Venture Exchange nor its Regulation Services Provider (as that term is defined in the policies of the TSX Venture Exchange) accepts responsibility for the adequacy or accuracy of this release.
1 https://www.usgs.gov/programs/mineral-resources-program/science/about-2025-list-critical-minerals
Vancouver, British Columbia–(Newsfile Corp. – November 6, 2025) – EMX Royalty Corporation (NYSE American: EMX) (TSXV: EMX) (the “Company” or “EMX”) is pleased to announce that Kennecott Exploration Company (“KEX”), a subsidiary of the Rio Tinto Group, has exercised its option to purchase EMX’s Superior West Project, located in central Arizona, and in connection therewith EMX is in receipt of the final option payment of $3,407,383 and has been granted a 2.5% NSR royalty over the project.
EMX acquired the Superior West Project by staking open ground after target generation activities in the greater Superior and Globe-Miami porphyry districts, which ultimately resulted in the acquisition of multiple key property positions within these prolific districts. The project was optioned to KEX in 2015 and advanced through various field programs. KEX’s exercise of the option to purchase highlights the strength of EMX’s royalty generation model, in which targets and related mineral rights are acquired at minimal cost to shareholders, then advanced through partnerships with leading exploration and mining companies. EMX receives cash payments and retains royalty interests, expanding its growing global portfolio.
About EMX. EMX is a precious and base metals royalty company. EMX’s investors are provided with discovery, development, and commodity price optionality, while limiting exposure to risks inherent to operating companies. The Company’s common shares are listed on the NYSE American Exchange and TSX Venture Exchange under the symbol “EMX”. Please see www.EMXroyalty.com for more information.
For further information, contact:
| David M. Cole President and CEO Phone: (303) 973-8585 Dave@EMXroyalty.com | Stefan Wenger Chief Financial Officer Phone: (303) 973-8585 SWenger@EMXroyalty.com | Isabel Belger Investor Relations Phone: +49 178 4909039 IBelger@EMXroyalty.com |
Neither the TSX Venture Exchange nor its Regulation Services Provider (as that term is defined in policies of the TSX Venture Exchange) accepts responsibility for the adequacy or accuracy of this release
Forward-Looking Statements
This news release may contain “forward-looking statements” that reflect the Company’s current expectations and projections about its future results. These forward-looking statements may include statements regarding perceived merit of properties, exploration results and budgets, mineral reserves and resource estimates, work programs, capital expenditures, timelines, strategic plans, market prices for precious and base metal, or other statements that are not statements of fact. When used in this news release, words such as “estimate,” “intend,” “expect,” “anticipate,” “will”, “believe”, “potential” and similar expressions are intended to identify forward-looking statements, which, by their very nature, are not guarantees of the Company’s future operational or financial performance, and are subject to risks and uncertainties and other factors that could cause the Company’s actual results, performance, prospects or opportunities to differ materially from those expressed in, or implied by, these forward-looking statements. These risks, uncertainties and factors may include, but are not limited to unavailability of financing, failure to identify commercially viable mineral reserves, fluctuations in the market valuation for commodities, difficulties in obtaining required approvals for the development of a mineral project, increased regulatory compliance costs, expectations of project funding by joint venture partners and other factors.
Vancouver, British Columbia–(Newsfile Corp. – November 4, 2025) – EMX Royalty Corporation (NYSE American: EMX) (TSXV: EMX) (FSE: 6E9) (the “Company” or “EMX”) is pleased to announce that shareholders of EMX (“Shareholders“) and optionholders of EMX who have been issued stock options under EMX’s existing stock option plan (“Optionholders“, and together with Shareholders, the “Securityholders“) have approved the plan of arrangement (the “Arrangement“) under the provisions of Division 5 of Part 9 of the Business Corporations Act (British Columbia) (“BCBCA“) involving EMX, Elemental Altus Royalties Corp. (TSXV: ELE) (OTCQX: ELEMF) (“Elemental Altus“) and 1554829 B.C. Ltd. (“Acquireco“), pursuant to which Elemental Altus will, among other things, indirectly through an amalgamation of EMX with Acquireco, acquire all of the issued and outstanding common shares of EMX. The vote was passed at EMX’s special meeting of Securityholders (the “Meeting“) held earlier today.
The Arrangement was approved by (i) 98.83% of the votes cast by Shareholders present in person or represented by proxy and entitled to vote at the Meeting, (ii) 98.95% of the votes cast by Shareholders and Optionholders, voting together as a single class, present in person or represented by proxy and entitled to vote at the Meeting, and (iii) 98.66% of the votes cast by Shareholders present in person or represented by proxy and entitled to vote at the Meeting, excluding the votes cast by such Shareholders that were required to be excluded pursuant to Multilateral Instrument 61-101 – Protection of Minority Security Holders in Special Transactions. The report of voting results will be available under the Company’s profile on SEDAR+ at www.sedarplus.ca and on EDGAR at www.sec.gov.
With the approval by the Securityholders, EMX will now seek a final order from the Supreme Court of British Columbia (“Court“) to approve the Arrangement at a hearing expected to be held on November 7, 2025. In addition to approval of the Court, completion of the Arrangement is subject to the Elemental Altus shareholders approving the Tether Concurrent Financing (received, as described below), applicable regulatory and exchange approval, and the satisfaction of certain other closing conditions customary for a transaction of this nature. Further, the completion of the Arrangement is subject to the conditional approval of the listing of the Elemental Altus Shares on a US stock exchange and the completion of the Tether Concurrent Financing. If all conditions are satisfied or waived, the Arrangement is expected to close by mid-November 2025.
As announced in Elemental Altus’ news release dated November 4, 2025, shareholders of Elemental Altus approved, among other things, an ordinary resolution in accordance with the ‘majority of the minority’ shareholder approval requirements set forth in Part 8 of Multilateral Instrument 61-101 – Protection of Minority Security Holders in Special Transactions and TSX Venture Exchange (“TSX-V”) Policy 5.9, approving a “related party” private placement of 7,502,502 common shares of Elemental Altus at a price of $18.38 (or US$13.33) per common share to Tether Investments S.A. de C.V. (“Tether“) for aggregate gross proceeds of approximately $137,896,000 (or approximately US$100 million) (the “Tether Concurrent Financing“). Completion of the Tether Concurrent Financing is subject to final approval of the TSX-V.
On Behalf of EMX
David Cole
CEO
For further information, contact:
| David M. Cole President and CEO Phone: (303) 973-8585 Dave@EMXroyalty.com | Stefan Wenger Chief Financial Officer Phone: (303) 973-8585 SWenger@EMXroyalty.com | Isabel Belger Investor Relations Phone: +49 178 4909039 IBelger@EMXroyalty.com |
About EMX
EMX is a precious and base metals royalty company. EMX’s investors are provided with discovery, development, and commodity price optionality, while limiting exposure to risks inherent to operating companies. The EMX shares are listed on the NYSE American Exchange and TSX-V under the symbol “EMX”. Please see www.EMXroyalty.com for more information.
Cautionary Note Regarding Forward-Looking Information
This press release may contain “forward-looking information” within the meaning of applicable Canadian securities laws and “forward-looking statements” within the meaning of the United States Private Securities Litigation Reform Act of 1995, (collectively, “forward-looking statements“) that reflect the Company’s current expectations and projections about its future results. These forward-looking statements may include statements regarding EMX and the combined company’s plans and expectations with respect to the proposed Arrangement, the hearing and receipt of a final order from the Court to approve the Arrangement, expectations regarding the satisfaction or waiver of certain closing conditions, including the receipt of conditional approval of the listing of Elemental Altus Shares on a US stock exchange and completion of the Tether Concurrent Financing, the expected closing date of the Arrangement, and receipt of final approval of the TSX-V for the Tether Concurrent Financing. Any statements that express or involve discussions with respect to predictions, expectations, beliefs, plans, projections, objectives, assumptions or future events or performance (often, but not always, identified by words or phrases such as “expects,” “anticipates,” “believes,” “plans,” “projects,” “targets,” “schedules,” “forecasts,” “budget,” “estimates,” “assumes,” “intends,” “strategy,” “goals,” “objectives,” “potential,” “possible” or variations thereof or stating that certain actions, events, conditions or results “may,” “could,” “would,” “should,” “might” or “will” be taken, occur or be achieved, or the negative of any of these terms and similar expressions) are not statements of historical fact and may be forward-looking statements.
Forward-looking statements are subject to known and unknown risks, uncertainties and other important factors that may cause the actual results, level of activity, performance or achievements of the Company to be materially different from those expressed or implied by such forward-looking statements, including but not limited to: the risk that any other condition to closing may not be satisfied or waived; the risk that the closing of the Arrangement might be delayed or not occur at all; the risk that the Court does not issue a final order approving the Arrangement; the risk that either EMX or Elemental Altus may terminate the definitive arrangement agreement and either EMX or Elemental Altus is required to pay a termination fee to the other party; potential adverse reactions or changes to business or employee relationships of EMX or Elemental Altus, including those resulting from the completion of the Arrangement; the diversion of management time on Arrangement-related issues; the risk of tax consequences for Securityholders and Elemental Altus securityholders if the Arrangement does not qualify as a tax-deferred reorganization; the ultimate timing, outcome and results of integrating the operations of EMX and Elemental Altus; the effects of the business combination of EMX and Elemental Altus, including the combined company’s future financial condition, results, operations, strategy and plans; the ability of the combined company to realize anticipated synergies in the timeframe expected or at all; changes in capital markets and the ability of the combined company to finance its activities in the manner expected; the inability to satisfy the listing requirements to be listed on a U.S. stock exchange; the possibility that EMX or Elemental Altus fail to comply with applicable laws prior to the Arrangement which could subject the combined company to penalties; the risk that EMX or Elemental Altus may not receive the required Court, stock exchange and regulatory approvals to effect the Arrangement; the risk of any litigation relating to the Arrangement; the fact that business disruption may be greater than expected following the public announcement or consummation of the Arrangement; the risk that the combined company does not result in a larger, well capitalized entity with a lower cost of capital which could prevent the combined company from pursuing further accretive royalty opportunities in the market; the absence of control over mining operations from which the Company will receive royalties or stream interests from; and risks related to those mining operations and royalty and stream interests, including risks related to international operations, government and environmental regulation, actual results of current exploration activities, conclusions of economic evaluations and changes in project parameters as plans continue to be refined, risks in the marketability of minerals, fluctuations in the price of gold and other commodities, fluctuation in foreign exchange rates and interest rates, stock market volatility, as well as those factors discussed in the EMX risk factors listed in EMX’s Management’s Discussion and Analysis for the six months ended June 30, 2025 and its Annual Information Form dated March 12, 2025 filed under EMX’s profile on SEDAR+ at www.sedarplus.ca and on EDGAR at www.sec.gov.
EMX’s forward-looking statements are based on the applicable assumptions and factors management considers reasonable as of the date hereof, based on the information available to management at such time. Although the Company has attempted to identify important factors that could cause actual results to differ materially from the Company in forward-looking statements, there may be other factors that cause results not to be as anticipated, estimated or intended. There can be no assurance that such statements will prove to be accurate, as actual results and future events could differ materially from those anticipated in such statements. Accordingly, readers should not place undue reliance on forward-looking statements. The Company does not undertake to update any forward-looking statements that are contained or incorporated by reference, except in accordance with applicable securities laws.
Neither the TSX-V nor its Regulation Service Provider (as that term is defined in the policies of the TSX-V.) accepts responsibility for the adequacy or accuracy of this press release.

To view the source version of this press release, please visit https://www.newsfilecorp.com/release/273218
As one of the lesser known but vital precious metals, Platinum has a long history of being used for jewelry and ornamentation, reaching back to the ancient Egyptian empire, having been discovered on a coffin unearthed in Thebes, estimated to be from the 7th century BC.
Platinum is a metal that represents power, prestige and a sense of great accomplishment. It has come to symbolize a high level of status in society, as evidenced by top-tier credit cards and membership programs using its name.
But Platinum has value beyond just being a status symbol. Modern-day uses of Platinum include being a key element in catalytic converters for vehicles, as it converts car exhaust gasses into less harmful substances, as a catalyst in the chemical industry and even in the creation of life-saving anti-cancer drugs.
Platinum was dubbed ‘platina’ or ‘little silver’ by the Spanish Conquistadors, and the truth is, it’s so much more than meets the eye.
But that’s just scratching the surface. On today’s episode, we explore this exclusive metal that befuddled miners and scientists alike when it was first discovered. Dubbed “platina” or “little silver” by the Spanish Conquistadors, the truth is, it’s so much more than meets the eye. Time to dig into Platinum on Commodity Culture.

Platinum is a gray-white precious metal and one of a group of six elements known as the Platinum Group Metals (PGM). The other metals in the group are iridium, osmium, palladium, rhodium and ruthenium. Platinum is the most common of the group and sees the most use.
Platinum’s atomic number is 78; it has an atomic mass of 195 units, a melting point of 1768 Degrees Celsius, and is resistant to corrosion, stable at high temperatures and has stable electrical properties.
The name Platinum comes from the Spanish word “platina,” basically translating to “little silver.” This somewhat derogatory word was coined by Spanish Conquistadors in the 16th century, as they had no idea of Platinum’s uses or true value and considered it an annoyance that interfered with their attempts to mine gold.
In those times, it was widely believed that “platina” was young gold and that, given time, it would turn yellow as it matured, but until then, better to toss it aside and get back to mining for the real thing.
Platinum is rarely found on its own; it is often deposited alongside gold, copper, iron, nickel, and the other Platinum Group Metals. When discovered, Platinum can be quite inconspicuous at first glance, with nuggets having a dull gray or black hue. One thing that can help identify platinum is its incredible heft when held and if iron is also present in the alloy, it will be slightly magnetic.
Some of the first known Platinum jewelry was crafted by the ancient indigenous peoples of Ecuador, with estimates placing their culture several centuries before the Spanish conquest of South America in 1492. It was particularly in the province of Esmeraldas where some of the most striking pieces were found, leading anthropologist William Farabee to declare:
“The native Indian workers of Esmeraldas were metallurgists of marked ability; they were the only people who manufactured Platinum jewelry.”
Considering Platinum is far more difficult to forge and manipulate than gold or silver, the method these ancient peoples used to work such a problematic metal was incredible and a testament to their dedication to their craft.
Platinum fragments were coated with gold dust, then heated by blowpipe on pieces of wood charcoal. The molten gold then caused the platinum to sinter, meaning it coalesced into a porous mass through heating, which allowed it to be forged.
Being the rarest of all the precious metals, along with its incredible strength as the hardest among them, has led Platinum to be one of the preferred forms of jewelry throughout the ages. In addition, it is highly resistant to scratches and other blemishes and does not wear away easily.
Platinum, along with the other Platinum Group Metals, has strong catalytic properties – meaning it can accelerate or trigger a chemical process without becoming permanently changed or consumed.
For this reason, Platinum is employed widely in the manufacturing of catalytic converters for use in exhaust systems in internal combustion vehicles. Platinum in exhaust systems helps curb vehicle pollution and contributes to enhanced air quality. Catalytic converters represent a whopping 50% of Platinum demand each year.
Due to its high melting point, Platinum is indispensable in chemical laboratories for electrodes and for crucibles and dishes in which materials can be heated to high temperatures.
In addition, Platinum is used in the chemicals industry as a catalyst to produce nitric acid, benzene and silicone. It is also used as a catalyst to improve the efficiency of fuel cells and for electrical contacts and sparking points, as it resists both the high temperatures and the chemical attack of electric arcs.
Platinum finds use in the electronics sector in the manufacturing of computer hard disks and thermocouples and is used to make optical fibers and LCD screens, turbine blades, spark plugs, pacemakers and, like other precious metals, is used widely in dentistry. Crowns, bridges, pins and other dental equipment, and fillings all employ Platinum as a key component.
Platinum is used as a catalyst in creating nitric acid, an essential ingredient in fertilizers, connecting Platinum to the creation of our food supply. But one of its more impactful uses to humanity is in the creation of chemotherapy drugs used to treat cancer, of which Platinum compounds are an important building block.
I’m willing to bet you didn’t think Platinum was such an essential element in our day-to-day lives, but the truth is, it’s a metal that is as practical as it is prestigious.
Next up, let’s explore the mining methods used to extract Platinum from the earth.
Being one of the rarest metals on earth, Platinum is rarely found on its own but is generally found alongside Platinum Group Metals, nickel, iron, gold and other metals. Although pure Platinum deposits have been discovered, they are the exception rather than the rule.
One of the earliest Platinum mining methods is placer mining. Like gold, Platinum particles can accumulate in alluvial sands in rivers and streams. Placer deposits are minerals concentrated in streams and riverbeds from rock eroded from its source and further ground into pieces as it is washed away by the water.
Most of the world’s placer Platinum is found in Russia and back in the 19th century, alluvial deposits located in the Ural Mountains were heavily mined by both small-scale family operations and more official mining operations.
Placer mining for Platinum was also common in South America, especially in the Río de la Plata, or the River of Silver, located between Argentina and Uruguay.
Placer mining involves using dredges to scoop Platinum-bearing sand or gravel from riverbeds and washing it until Platinum grains or nuggets are captured and separated from the surrounding material.
In today’s world, most Platinum deposits are located underground and are mined very similarly to gold, silver and other underground metal deposits, namely with strategically placed explosives.
Miners drill holes into the mine walls and pack explosives into them before detonating the rock, blasting it into small pieces and hauling it up to the surface to be loaded onto trucks, which then take it to a facility to be processed.
Most platinum mining in the modern era is done in South Africa, which accounts for a whopping 80% of world platinum production.
The story of the man who first identified Platinum and began to make it known to the greater world is no less fantastic than the element itself, involving an adventure across continents, a capture and daring escape on the high seas, and a scientific discovery that would begin Platinum’s journey to becoming the dynamic metal we know it as today.
Antonio de Ulloa of Spain was only 19 years of age when he was promoted to the rank of frigate lieutenant and sent on what would be a life-altering expedition to Quito in Ecuador, led by French geographers Charles Marie de la Condamine and Pierre Bouguer.
Antonio departed Spain in May of 1735, not knowing he wouldn’t see his motherland again for more than a decade. The mission was a monumental one: To help determine whether the earth was flat, as was popularly believed throughout most of human history up until that point, or whether it was a sphere, as suggested by Sir Isaac Newton.
To this end, it was necessary to measure the length of a degree of latitude at the equator, of which Quito was the closest city, and again at somewhere as near as possible to one of the poles. An expedition to the far north of Sweden was also dispatched for this purpose, but our story shall leave that journey to the pages of history.
As Antonio accompanied the geographers in Ecuador, their task proved epic indeed and with great struggle, they finally completed their work around 1745. Over the course of this decade, Antonio had plenty of time to explore the territory and the people there, recording his more interesting observations in various papers he carried with him.
As the expedition finally departed back to Spain, their mission accomplished, Antonio must have been filled with strong emotions as he was, at long last, headed home. Fate, however, had other plans in store for him.
As they made their way, sailing around Cape Horn, they were chased down north of the Azores by an English privateer and their ship was captured. However, they managed an escape and as luck seemed to be on their side, they evaded their captors and seemed to leave danger behind.
However, higher powers seemed intent on testing their wills and as they reached Louisbourg in Nova Scotia, their vessel was once again captured, this time by a British naval vessel and escape was out of the question. Antonio and his companions were taken to London and imprisoned, while the Admiralty confiscated nearly a decade’s worth of notes from Antonio’s time spent in Ecuador. Things looked grim for our frigate lieutenant as he sat in a cell awaiting his fate.
But this opened a window and good fortune came in the form of the President of the Royal Society, Martin Folkes, who came to know Antonio and his story and befriended him. The Royal Society was a group of natural philosophers and physicians, and not only did Martin free Antonio from his chains, but he also got all his papers returned to him and even made him a Fellow of the Royal Society in 1746. He was then allowed to return to Spain.
Finally, after his long mission, Antonio set to work compiling an account of his adventures, which he published in 1748, first in Spanish and then translated into several other languages.
For our subject today, one passage, in particular, stands out:
“In the district of Choco are many mines of lavadero or wash gold. Several of the mines have been abandoned on account of the Platina, a substance of such resistance, that when struck on an anvil of steel, it is not easy to be separated; nor is it calcinable, so that the metal enclosed within this obdurate body could only be extracted with infinite labor and charge.”
Shortly after releasing his book, Antonio was tasked with a new mission by the King of Spain, King Ferdinand VI, to travel throughout Europe and study scientific developments across the continent.
Antonio’s travels brought him to Sweden in the autumn of 1751 and he was welcomed with open arms by Swedish scientists. Shortly after his arrival, he was duly elected to the Royal Swedish Academy of Sciences in October of the same year. During his time there, he met with mathematician and chemist H.T. Scheffer. Scheffer was a former mine and metal works manager and an assayer at the mint and so had a vested interest in metals.
There is no official record of what exactly was said in that meeting, but shortly after that in November of 1751, Scheffer produced a paper titled, “The White Gold, or 7th Metal, called in Spain’ Platina del pinto’ Little Silver of Pinto, its Nature Described,” and submitted it to the Academy.
Scheffer was already familiar with Platinum before encountering Antonio, as he had received samples of it just a year earlier in 1750 from the West Indies, but his time with Antonio undoubtedly influenced his writing. In his paper, he came to the following conclusions about Platinum:
“That this is a metal hard but malleable, but of the hardness of malleable iron.
“That it is a precious metal of durability, like gold and silver.
“That it is not any of the six old metals, since first it is wholly and entirely a precious metal, containing nothing of copper, tin, lead, or iron, because it allows nothing to be taken from it. It is not silver, nor is it gold; but it is a seventh metal among those which are known up till now in all lands.”
In addition, he recommended a potential practical application for Platinum when he wrote:
“This metal is the most suitable of all to make telescope mirrors because it resists as well as gold the vapors of the air, it is very heavy, very dense, colorless and much heavier than ordinary gold, which is rendered unsuitable for this particular use by lacking these two latter properties.”
Although attempts were made in the years that followed, Platinum never found its place in the telescopes of the era, although Scheffer would be delighted to know the metal did eventually find use in the construction of x-ray telescopes centuries later. Nonetheless, Scheffer’s paper sparked the imaginations of scientists around the world, and a flurry of research into Platinum began, leading it to establish itself as the multifaceted metal that we know in the modern era.
Although the recent trend toward electrifying vehicles seemingly puts Platinum’s use in traditional gasoline-powered catalytic converters at risk, we need to step back and look at the bigger picture.
In the coming years, autocatalyst demand for Platinum is likely to rise as recent legislation to curb pollution from gasoline and diesel engines is boosting the demand for cleaner emissions, which is Platinum’s forte.
Either way, Platinum will have a role to play in a carbon-neutral future, as it is needed for hydrogen-powered fuel cell electric vehicles. These use a propulsion system similar to that of electric vehicles, where energy stored as hydrogen is converted to electricity by the fuel cell, and these vehicles are already becoming available in California and a few other places.
Platinum is also playing a role in the greater energy economy, as Platinum-based fuel cells are a cost-effective, clean and reliable off-grid power source that is currently seeing use in some remote areas, such as rural South Africa.
These fuel cells can help provide greater energy access to communities that might not normally be able to get a steady source of electricity. This includes electricity for schools, improving the quality of education and providing the ability to pump water for irrigation, facilitating agriculture.
Platinum’s other myriad uses also aren’t going away, and for this reason, Platinum will remain an essential metal to our modern civilization for as long as we can extract it from the earth.
Jesse Day is not an employee or an affiliate of Sprott Asset Management LP. The opinions, estimates and projections (“information”) contained within this content are solely those of the presenter and are subject to change without notice. Sprott Asset Management LP makes every effort to ensure that the information has been derived from sources believed to be reliable and accurate. However, Sprott Asset Management LP assumes no responsibility for any losses or damages, whether direct or indirect, which arise out of the use of this information. Sprott Asset Management LP is not under any obligation to update or keep current the information contained herein. The information should not be regarded by recipients as a substitute for the exercise of their own judgment. Please contact your own personal advisor on your particular circumstances. Views expressed regarding a particular company, security, industry or market sector should not be considered an indication of trading intent of any investment funds managed by Sprott Asset Management LP. These views are not to be considered as investment advice nor should they be considered a recommendation to buy or sell.
Sprott Physical Platinum and Palladium Trust (the “Trust”) is a closed-end fund established under the laws of the Province of Ontario in Canada. The Trust is available to U.S. investors by way of a listing on the NYSE Arca pursuant to the U.S. Securities Exchange Act of 1934. The Trust is not registered as an investment company under the U.S. Investment Company Act of 1940.
The Trust is generally exposed to the multiple risks that have been identified and described in the prospectus. Please refer to the prospectus for a description of these risks. Relative to other sectors, precious metals and natural resources investments have higher headline risk and are more sensitive to changes in economic data, political or regulatory events, and underlying commodity price fluctuations. Risks related to extraction, storage and liquidity should also be considered.
Gold and precious metals are referred to with terms of art like store of value, safe haven, and safe asset. These terms should not be construed to guarantee any form of investment safety. While “safe” assets like gold, Treasuries, money market funds, and cash generally do not carry a high risk of loss relative to other asset classes, any asset may lose value, which may involve the complete loss of invested principal.
All data is in U.S. dollars unless otherwise noted.
Past performance is not an indication of future results. The information provided is general in nature and is provided with the understanding that it may not be relied upon as, nor considered to be tax, legal, accounting or professional advice. Readers should consult with their own accountants and/or lawyers for advice on their specific circumstances before taking any action. Sprott Asset Management LP is the investment manager to the Trust. Important information about the Trust, including the investment objectives and strategies, applicable management fees, and expenses, is contained in the prospectus. Please read the prospectus carefully before investing. The indicated rates of return are the historical annual compounded total returns including changes in unit value and reinvestment of all distributions and do not take into account sales, redemption, distribution or operational charges or income taxes payable by any unitholder that would have reduced returns. You will usually pay brokerage fees to your dealer if you purchase or sell units of the Trusts on the Toronto Stock Exchange (“TSX”) or the New York Stock Exchange (“NYSE”). If the units are purchased or sold on the TSX or the NYSE, investors may pay more than the current net asset value when buying units or shares of the Trusts and may receive less than the current net asset value when selling them. Investment funds are not guaranteed, their values change frequently and past performance may not be repeated. The information contained herein does not constitute an offer or solicitation to anyone in the United States or in any other jurisdiction in which such an offer or solicitation is not authorized or to any person to whom it is unlawful to make such an offer or solicitation. Views expressed regarding a particular company, security, industry or market sector should not be considered an indication of trading intent of any investment funds managed by Sprott Asset Management LP. These views are not to be considered as investment advice nor should they be considered a recommendation to buy or sell.
Platinum, one of the rarest precious metals, has been overshadowed by its more glamorous cousin, gold, for more than a decade (see Figure 4). Yet beneath platinum’s tepid price action lies a compelling story of supply constraints, surging demand and an unsustainable structural deficit that could propel platinum prices to new heights. According to the World Platinum Investment Council’s (WPIC) Platinum Quarterly Q1 2025 report,1 the platinum market is grappling with a third consecutive year of significant deficits, projected at 966,000 ounces for 2025 — a shortfall representing a staggering 12% of global demand. This deficit, coupled with a lack of new supply and robust demand growth across multiple sectors, sets the stage for a potentially sustained price surge. We posit that the tipping point for platinum may be nigh.
At the heart of platinum’s bullish case is the persistent and deepening structural deficit in the market. The WPIC reports that the platinum market recorded a 992,000-ounce deficit in 2024, following an 896,000-ounce shortfall in 2023, and now forecasts a 966,000-ounce deficit for 2025 (see Figure 1).
If the platinum deficit persists, inventories may be depleted in three years.
If the deficit forecast proves accurate, this will be the third consecutive year of significant undersupply. The WPIC describes this deficit as “embedded” and “unsustainable,” signaling that the market cannot continue to operate under such strain without a significant price response.
Structural deficits occur when supply consistently fails to meet demand, depleting above-ground stocks and creating upward pressure on prices. In platinum’s case, above-ground stocks are projected to dwindle to just 2.5 million ounces in 2025 — a critically low level. To put this in perspective, if deficits persist at this rate, global platinum inventories could be effectively exhausted within three years, a scenario that would force prices to rise dramatically to balance the market. Unlike temporary imbalances, this structural deficit is driven by fundamental supply and demand dynamics that show no immediate signs of resolution, making it a potentially powerful catalyst for price appreciation.
Figure 1. Platinum Supply-Demand Gap (koz2) (2014-2025F)
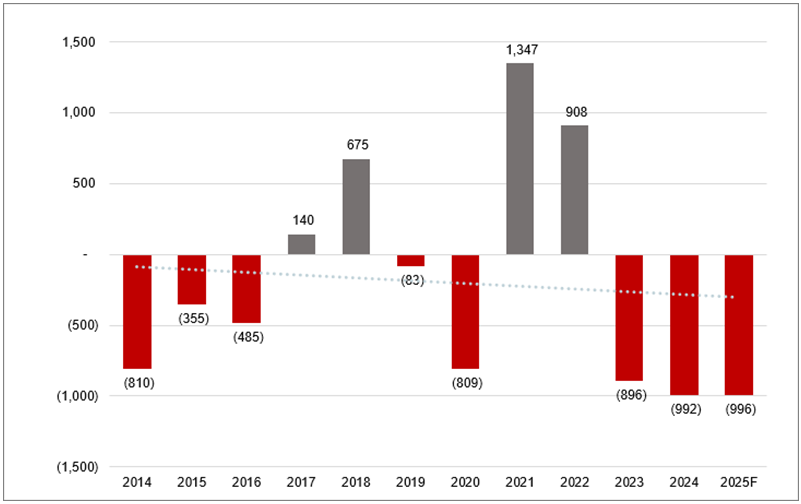
Source: SFA Oxford (2014-2018), Metals Focus (2019-2025f).
One of the most critical factors underpinning the platinum deficit is the severe constraint on new supply. According to the WPIC, mine supply is projected to decline by 6% for 2025, with global production in Q1 2025 falling 13% to its lowest level since 2020, largely due to power outages and disruptions in South Africa. South Africa is the single most dominant mining jurisdiction for platinum, accounting for nearly 80% of global mined platinum output.
We believe platinum’s supply ceiling is likely to support higher prices.
Depending on the year in question, for every 17-18 ounces of gold that is mined, we extract a single ounce of platinum. Platinum is significantly rarer than gold, occurring at very low concentrations in the earth’s crust (see Figure 2). All the platinum ever produced (approximately 8,000 tonnes) would fill just one Olympic-sized swimming pool to ankle depth. This rarity makes scaling up platinum production a formidable challenge.
Figure 2. The Amount of Platinum That Has Been Mined
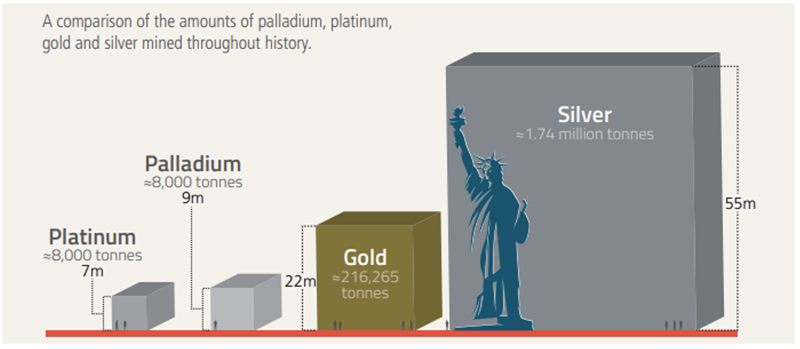
Sources: Best available data as of 12/31/2024. USGS, How much silver has been found in the world?. The World Gold Council, Gold Above-Ground Stock. Note: “m” refers to meters. For instance, approximately 216,265 tonnes of gold would fit inside a cube 22 meters in length, width and height.
Bringing new platinum mines online is a capital-intensive and time-consuming process, often taking over a decade. Platinum’s supply is slow to react to price signals, unlike other commodities with shorter production cycles. South African producers face additional hurdles, including seasonal weaknesses and infrastructure challenges, as seen in Q1 2025. Recycling, another key supply source, is also underperforming, with only a modest 2% increase in 2024 and 1% in 2025, far below what is needed to offset mining declines. Even with a sharp rise in platinum prices, the supply side will take considerable time to deliver the metal.
Exchange-traded funds (ETFs) are often cited as a potential supply source to alleviate deficits, but we believe this assumption is flawed. The WPIC notes that ETF holders are not price-agnostic; they seek returns and are unlikely to sell unless prices rise significantly above their acquisition costs. Thus, ETFs are not a viable long-term solution to the supply crunch.
With no major new mines on the horizon and recycling growth stunted, the platinum market faces a supply ceiling that amplifies the impact of growing demand.
With supply stagnant, demand for platinum is experiencing a resurgence across multiple sectors, further tightening the market. According to the WPIC, robust growth in automotive, jewelry, industrial and investment demand is contributing to the structural deficit.
Figure 3. Platinum Uses
The primary driver of demand for platinum is the automotive industry. Platinum is a key element in manufacturing catalytic converters, which help reduce toxic emissions from automotive exhaust. Rising car production (especially in emerging economies) and tightening emissions standards worldwide have fueled steady growth in the use of catalytic converters.
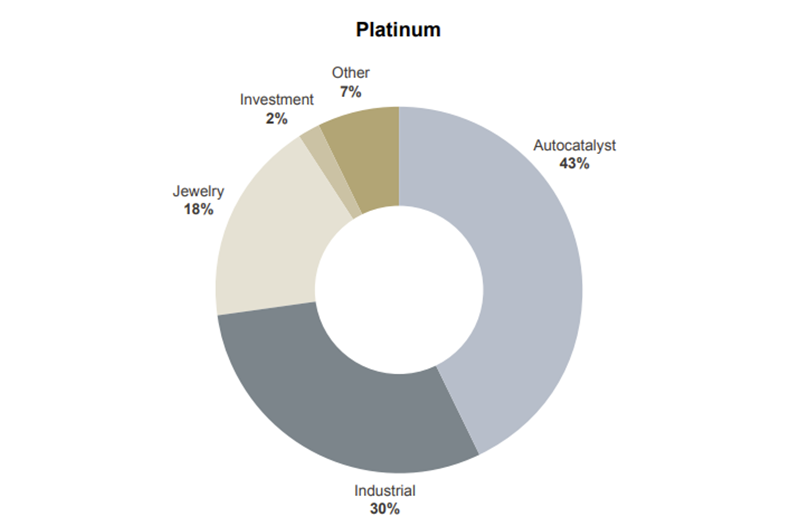
Source: PGM Market Report May 2024. May not add up to 100% due to rounding.
From 2016 to 2021, palladium enjoyed a strong run from just under $600 per ounce to over $3,100, catalyzed by factors we highlighted above. While we are not sticking our necks out for a similar move in platinum over a similar time frame, we would like to point out that recent market activity is reflecting optimism and momentum for platinum, with prices reaching $1,100 in May 2025, which we see as a significant climb from recent lows.
Platinum is showing fresh signs of strength and momentum.
Platinum has been overlooked for far too long. Amidst widespread inflation, finding something priced similarly to two decades ago is remarkably rare. Yet this is the current situation with platinum. What has shifted over time is the cost of mining the metal, which ties into the challenges of initiating new production. Although we are bullish in our outlook on the platinum market in 2025, we expect markets to be volatile given the fluctuating tariffs and trade policies in the U.S. and the consequent impact this may have on the global economy.
Finally, above-ground stocks are near historic lows, and deficits continue to erode inventories. The confluence of structural deficits, constrained supply and robust demand has created a perfect storm for platinum prices. We believe the platinum market is approaching a tipping point where supply scarcity could trigger a sharp repricing.
Figure 4. Platinum Prices vs. Gold and Palladium (2006-2025)
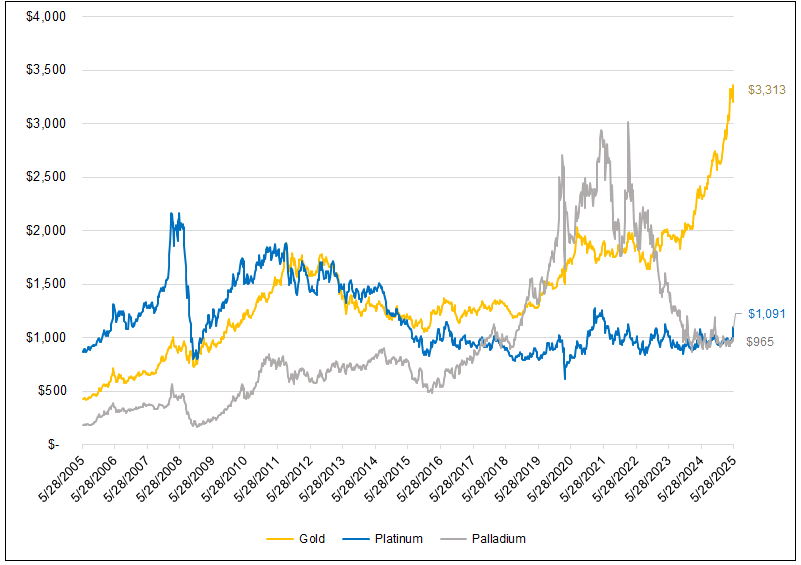
Source: Bloomberg. Data as of 5/28/2025. Platinum is measured by the XPT Curncy (USD) index. Palladium is measured by the XPD Curncy (USD) index. Gold is measured by the GOLDS Comdty (USD) Index. Past performance is no guarantee of future results.
| 1 | World Platinum Investment Council’s (WPIC) Platinum Quarterly Q1 2025 Report. |
| 2 | “Koz” refers to 1,000 troy ounces. |
Source: https://sprott.com/insights/platinum-is-on-track-for-a-status-upgrade/
As one of the key platinum group metals, Palladium is a highly prized commodity. It commands more monetary value than gold and is 30 times as rare, with industrial demand outstripping supply for the last decade.

Being a fairly young element discovered in the early 1800s, palladium nonetheless plays a vital role in civilization as a means of reducing harmful emissions from vehicle exhaust systems. Although platinum is also used for this purpose, palladium is by far the more effective metal at emissions reduction, with the vast majority of worldwide production being employed in catalytic converters for this very purpose.
Because of these characteristics, palladium is also the premier choice for hybrid electric vehicle exhaust systems, making it an essential component of the new green economy.
Palladium is named after a massive asteroid called Pallas, also the Greek goddess of wisdom, which was discovered just before palladium.
In the world of jewelry, palladium’s unique properties make it ideal in the creation of white gold and its ability to absorb 900 times its volume in hydrogen makes it invaluable in the field of chemistry.
Originally put to use as a marketing gimmick to make a quick buck by a brilliant but somewhat unscrupulous British chemist, palladium’s journey since its humble beginning has been nothing short of extraordinary.
On today’s episode, we seek to clear the air and provide the facts on one of the most vital platinum group metals. It’s palladium, on Commodity Culture.
Palladium’s atomic number is 46, it has an atomic mass of 106.42, a melting point of 1554 degrees Celsius, and a boiling point of 2963 degrees Celsius. It is the least dense and has the lowest melting point of all the platinum group metals. It is named after a massive asteroid called Pallas, also the Greek goddess of wisdom, which was discovered just before palladium.
Palladium is a shiny, silvery-white metal that is resistant to corrosion, extremely ductile and easily worked. It remains untarnished by the atmosphere at ordinary temperatures and so can serve as a substitute for platinum in jewelry and electrical contacts.
Palladium is also a key ingredient in the creation of white gold jewelry. 24 karat gold, the purest form of the metal, is too soft and malleable to form into jewelry and so other metals must be added to it, which allows it to become solid. Traditional yellow gold is typically mixed with copper, brass, or zinc, at a ratio of 75% gold and 25% of the other metals.
The purest form of white gold, however, is 75% gold and 25% palladium and is generally finished off with a coating of rhodium, another platinum group metal, to give it a beautiful sheen, although some prefer their white gold natural and uncoated.
The main use of palladium, much like its sibling platinum, is in the construction of catalytic converters in internal combustion vehicles. Palladium serves as a catalyst that converts polluting carbon monoxide, nitrogen oxide and hydrocarbons in the exhaust into water, carbon dioxide and nitrogen.
Palladium is also used to manufacture springs for watches, surgical instruments, and dental fillings and crowns.
Because palladium can absorb up to 900 times its volume of hydrogen, it is very effective in hydrogenation and dehydrogenation processes. As the name implies, this involves adding or removing hydrogen from a substance and is a widely used reaction in synthetic chemistry.
Palladium finds additional use in Multilayer Ceramic Capacitors, which act as a ‘dam’ that temporarily charges and discharges electricity by regulating a current’s flow in a circuit and preventing electromagnetic interference between components.
Ceramic capacitors are used in various circuits for noise removal, supply voltage smoothing, and filters and are essential components for realizing advanced functions in mobile phones and televisions.
In terms of its value as a precious metal, palladium has historically maintained a price per ounce higher than gold. However, unlike gold, this has nothing to do with monetary value and everything to do with industrial demand. At the moment, palladium is preferred to platinum for catalytic converters in petrol-driven vehicles and mandates are being implemented around the world that force manufacturers to ensure a certain level of emissions reductions before their vehicles can go to market. To put into perspective just how important palladium is in this role, in 2019, 84% of supply was used in automotive emissions control.
This has pushed the price of palladium up massively, to where it now sits at around $2,300 US per ounce. Although platinum is much cheaper and could technically be used for the same purpose, it is generally preferred for diesel-powered vehicles and changing the design of current catalytic converters would entail a massive investment of both money and time that wouldn’t be economically feasible when all is said and done.
Let’s now take a look at the mining methods employed to extract it from the earth.
Palladium is generally mined alongside the other platinum group metals. Platinum group metals occur mainly as a byproduct of nickel sulfide mines, often with some copper and cobalt which can also be economically extracted, along with some precious metals as well.
Russia is the world’s largest producer of palladium, followed by South Africa, Canada, and the United States. A vast amount of the palladium used commercially is extracted from copper-nickel deposits in South Africa and Canada.
Palladium is mined using both surface and underground mining methods, depending on the nature of the deposit.
Near surface deposits of platinum group metals are mined using the open-pit method. Firstly, the overburden, a layer of soil above the deposit, is detonated with explosives to break it up into smaller chunks of rock. Special quarry machinery then collects and moves the rocks into trucks, which then transport them to be processed.
For deposits that lie deeper beneath the earth, mechanical extraction methods to get down to the lower levels of the earth’s surface and haul it out are employed. This will depend on the primary metal being extracted, but generally involves the classic underground mining technique of using timed explosives to detonate the rock beneath the surface, before bringing it above ground to be taken to a processing facility.
The process of separating palladium from the other metals is a key factor in producing pure palladium and is an extraordinarily complex multi-step process.
First, the extracted rocks need to be ground into a fine powder, to try and liberate the individual minerals. This reduces the rock into talcum powder-sized grains.
Next, the minerals are concentrated via floatation, which pushes the rocks into a concentrate.
The concentrate is then dried and smelted through a process called “pyrometallurgy” which means melting and heating. This is done in a large furnace of which there are several types, depending on the minerals in the ore and which minerals you want to focus on extracting. This process produces either something called a “matte” for the copper and nickel or, after more cooking, an anode.
Next is refining which increases the purity of the metals and looks to separate the anode into individual elements.
This commonly involves electroextraction first to separate nickel into cathodes and make a platinum group metals rich anode slime.
From here, the work to separate this slime into individual metals is a mostly chemical process. The bullion is leached with acids, then extracted into salts, which can then be turned into pure palladium in the form of ingots.
Only the biggest mines are able to complete all these steps on site, as the capital to build smelters and refineries is very high. In most cases, the extracted ore will be concentrated and sold to special smelters and refiners, equipped to carry out the remaining steps to produce pure palladium.
The origins and uses of palladium don’t go back nearly as far as many of the other commodities we’ve covered in this series. In fact, palladium’s very first use after its discovery was purely commercial as it was simply sold as a curiosity by the man who discovered it, William Hyde Wollaston.
Wollaston discovered palladium around 1802 in crude platinum ore from South America. He dissolved the ore in aqua regia, neutralized the solution with sodium hydroxide, and precipitated platinum as ammonium chloroplatinate with ammonium chloride before adding mercuric cyanide to form the compound palladium cyanide. This compound was then heated to extract the very first palladium metal known in the world.
Instead of rushing out and publishing this incredible discovery to make it known to the scientific community, he instead kept his find a closely guarded secret and decided he could better profit off his work by marketing and selling it before others would be able to replicate the process of producing palladium themselves.
He cut a deal with a Mr. Forster, who owned a small curiosity shop in Soho in London’s West End, to sell the metal exclusively. The marketing angle was simple, palladium was dubbed the new silver and leaflets were posted and distributed naming its characteristics. These included descriptions such as:
“The greatest heat of a blacksmith’s fire would hardly melt it.” and “If you touch it while hot with a small bit of sulfur, it runs as easily as zinc.”
The palladium was sold in small quantities and priced at 5 shillings, a half guinea, and a full guinea.
This truly unprecedented decision to market and sell a newly discovered element without reporting it to the scientific community caused a wave of skepticism and speculation. Keep in mind, in advertising and selling palladium, Wollaston never revealed himself and so most scientists assumed it was some kind of trickery to turn a quick profit. Had Wollaston attached his name to it, some may have taken it more seriously, as he was a known chemist at the time.
One of the main skeptics of the scheme was an Irish analytical chemist named Richard Chenevix. To investigate further, he bought up all the palladium remaining in the shop and set about conducting a series of experiments to prove the fraud he assumed he saw in plain sight.
Despite Chenevix’s discovery that the metal did indeed possess all the properties advertised, he simply couldn’t accept that a new metal could be revealed in such a crass commercial manner, and so announced to the local scientific community that the metal was most likely an amalgam of platinum and mercury.
The other scientists didn’t attempt their own experiments and took Chenevix at his word, after all, to them it was already obvious that the whole thing was a scam.
To counteract this false conclusion, Wollaston anonymously published an advert in a chemistry journal offering anyone who could recreate the palladium he was selling a reward of 20 pounds, not an insignificant sum in the early 1800s. No one was able to rise to the challenge and in the meantime, Wollaston went ahead and also discovered another new platinum group metal, rhodium.
Deciding that this time he’d actually like to be recognized for his accomplishment, he wrote a paper on rhodium and published it in 1804. He waited a little longer to reveal that he was the one who discovered palladium, perhaps feeling a little ashamed to have broken with the status quo of the scientific community, but in 1805 he explained himself in a publication, leaving no more doubt amongst his fellow scientists and the world at large.
Despite the cries for a new green economy and the electrification of all the vehicles in the world, the reality is that this idealized future is very far away if it ever even fully comes to pass. In the meantime, palladium will continue to remain a vital component of catalytic converters in internal combustion vehicles and with automobile tailpipe emissions standards tightening around the globe, including in developing nations like China and India, palladium’s demand will only continue to rise in the years ahead.
We are also seeing an increase in hybrid vehicle production, including hybrid vehicle fleets in the transportation industry, and that means more palladium will be required. In fact, hybrid vehicles are expected to account for roughly 23 percent of the market by 2025 and will likely continue to rise in popularity, giving palladium a great deal of longevity as an industrial commodity.
The sale of new automobiles, hampered by supply chain issues due to the pandemic, particularly related to chip shortages, is expected to come roaring back and along with it, increased demand for palladium, which has already been in a supply deficit for nearly a decade.
Add to all this the fact that the majority of the world’s palladium is produced in Russia, which now faces strict sanctions from around the world due to its invasion of Ukraine, and you have the perfect storm for reduced supplies and increased prices.
Until now, platinum has often eclipsed its lesser-known sibling in the eyes of the general public and even the investment community, but with peak demand for palladium estimated to be sometime between 2027 and 2030, this noble metal has a long way to go as it claims its rightful place in the global commodity hierarchy.
Jesse Day is not an employee or an affiliate of Sprott Asset Management LP. The opinions, estimates and projections (“information”) contained within this content are solely those of the presenter and are subject to change without notice. Sprott Asset Management LP makes every effort to ensure that the information has been derived from sources believed to be reliable and accurate. However, Sprott Asset Management LP assumes no responsibility for any losses or damages, whether direct or indirect, which arise out of the use of this information. Sprott Asset Management LP is not under any obligation to update or keep current the information contained herein. The information should not be regarded by recipients as a substitute for the exercise of their own judgment. Please contact your own personal advisor on your particular circumstances. Views expressed regarding a particular company, security, industry or market sector should not be considered an indication of trading intent of any investment funds managed by Sprott Asset Management LP. These views are not to be considered as investment advice nor should they be considered a recommendation to buy or sell.
Sprott Physical Platinum and Palladium Trust (the “Trust”) is a closed-end fund established under the laws of the Province of Ontario in Canada. The Trust is available to U.S. investors by way of a listing on the NYSE Arca pursuant to the U.S. Securities Exchange Act of 1934. The Trust is not registered as an investment company under the U.S. Investment Company Act of 1940.
The Trust is generally exposed to the multiple risks that have been identified and described in the prospectus. Please refer to the prospectus for a description of these risks. Relative to other sectors, precious metals and natural resources investments have higher headline risk and are more sensitive to changes in economic data, political or regulatory events, and underlying commodity price fluctuations. Risks related to extraction, storage and liquidity should also be considered.
Gold and precious metals are referred to with terms of art like store of value, safe haven, and safe asset. These terms should not be construed to guarantee any form of investment safety. While “safe” assets like gold, Treasuries, money market funds, and cash generally do not carry a high risk of loss relative to other asset classes, any asset may lose value, which may involve the complete loss of invested principal.
All data is in U.S. dollars unless otherwise noted.
Past performance is not an indication of future results. The information provided is general in nature and is provided with the understanding that it may not be relied upon as, nor considered to be tax, legal, accounting or professional advice. Readers should consult with their own accountants and/or lawyers for advice on their specific circumstances before taking any action. Sprott Asset Management LP is the investment manager to the Trust. Important information about the Trust, including the investment objectives and strategies, applicable management fees, and expenses, is contained in the prospectus. Please read the prospectus carefully before investing. The indicated rates of return are the historical annual compounded total returns including changes in unit value and reinvestment of all distributions and do not take into account sales, redemption, distribution or operational charges or income taxes payable by any unitholder that would have reduced returns. You will usually pay brokerage fees to your dealer if you purchase or sell units of the Trusts on the Toronto Stock Exchange (“TSX”) or the New York Stock Exchange (“NYSE”). If the units are purchased or sold on the TSX or the NYSE, investors may pay more than the current net asset value when buying units or shares of the Trusts and may receive less than the current net asset value when selling them. Investment funds are not guaranteed, their values change frequently and past performance may not be repeated. The information contained herein does not constitute an offer or solicitation to anyone in the United States or in any other jurisdiction in which such an offer or solicitation is not authorized or to any person to whom it is unlawful to make such an offer or solicitation. Views expressed regarding a particular company, security, industry or market sector should not be considered an indication of trading intent of any investment funds managed by Sprott Asset Management LP. These views are not to be considered as investment advice nor should they be considered a recommendation to buy or sell.
Edmonton, Alberta–(Newsfile Corp. – October 23, 2025) – Grizzly Discoveries Inc. (TSXV: GZD) (FSE: G6H) (OTCQB: GZDIF) (“Grizzly” or the “Company”) is pleased to announce that is has recently received assay results for a reconnaissance sampling program at the Beaverdell Target part of the Greenwood, BC Precious and Battery Metals Project (Figure 1).
Beaverdell Sampling Highlights
Brian Testo, President and CEO of Grizzly Discoveries, stated “The assays announced today demonstrate that we continue to receive very exciting and encouraging exploration results. Grizzly has numerous high-grade gold – silver – copper – lead -zinc showings and historical mines. We have work permits in place for four of our targets and look forward to drilling in the fall of 2025 along with additional exploration for significant battery metal prospects in our 170,000+ acre land holdings in the prolific Greenwood Mining District.“
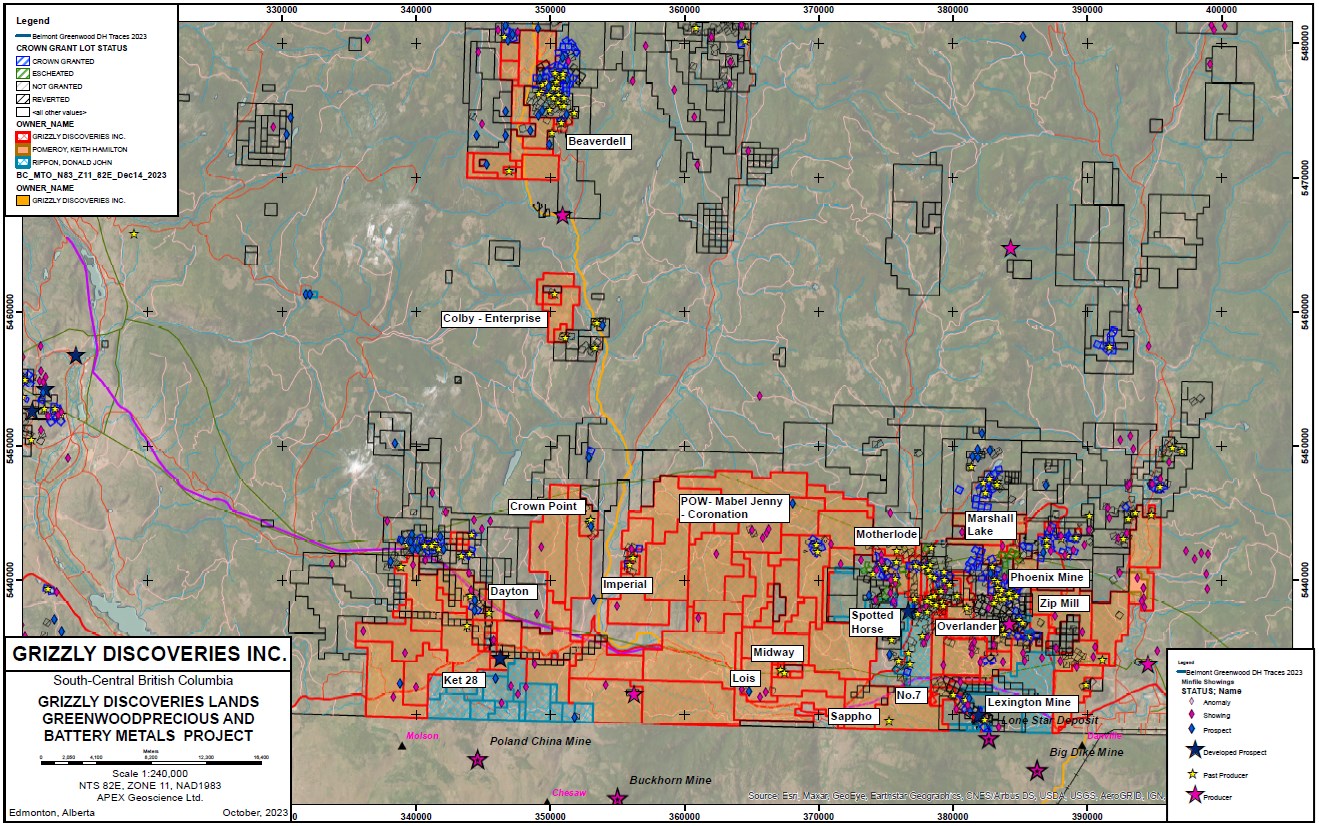
Figure 1: Land position and targets of interest for future exploration, Greenwood Project.
To view an enhanced version of this graphic, please visit:
https://images.newsfilecorp.com/files/4488/271551_2e21b65504d1f9ff_002full.jpg
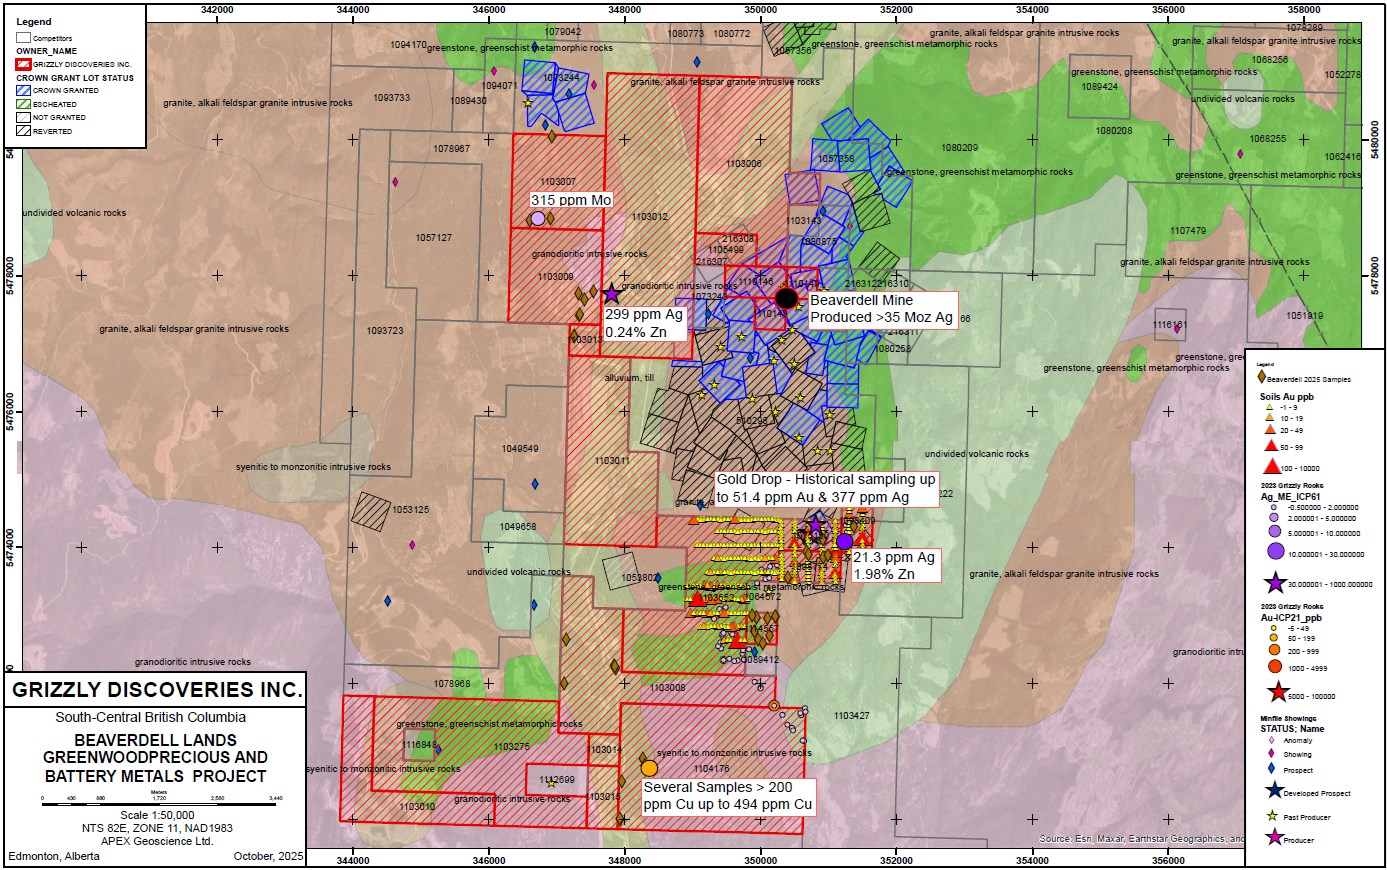
Figure 2. Beaverdell geology and showings with gold in soils and rocks.
To view an enhanced version of this graphic, please visit:
https://images.newsfilecorp.com/files/4488/271551_2e21b65504d1f9ff_003full.jpg
Plans for Fall 2025 Exploration at Greenwood:
Trenching, rock and soil sampling along with drilling at the Midway Target area is being planned for fall 2025. The amount of drilling will depend upon the current financing that has been announced.
Additional results should be forthcoming over the next coming months as work progresses and will be presented in additional news releases.
Private Placement
Grizzly has recently announced a private placement offering for gross proceeds of up to $1 million (See Company News Releases dated September 11 and October 10, 2025) in order to support planned exploration this fall.
The main focus of the private placement will be to conduct drilling and trenching at the Midway Exploration Target, targeting the historical Midway Mine and conduct additional reconnaissance sampling across the project area.
Quality Assurance and Control
Rock and soil samples are being analyzed at ALS Global Laboratories (Geochemistry Division) in Vancouver, Canada (an ISO/IEC 17025:2017 accredited facility). Gold was assayed using a fire assay with atomic emission spectrometry and gravimetric finish when required (+10 g/t Au). Rock grab and rock chip samples from outcrop/bedrock are selective by nature and may not be representative of the mineralization hosted on the project.
The sampling program was undertaken by Company personnel under the direction of Michael B. Dufresne, M.Sc., P.Geol., P.Geo.. A secure chain of custody is maintained in transporting and storing of all samples.
The technical content of this news release and the Company’s technical disclosure has been reviewed and approved by Michael B. Dufresne, M. Sc., P. Geol., P.Geo., who is a non-independent Consultant and Qualified Person as defined by National Instrument 43-101 Standards of Disclosure for Mineral Projects.
ABOUT GRIZZLY DISCOVERIES INC.
Grizzly is a diversified Canadian mineral exploration company with its primary listing on the TSX Venture Exchange focused on developing its approximately 72,700 ha (approximately 180,000 acres) of precious and base metals properties in southeastern British Columbia. Grizzly is run by highly experienced junior resource sector management team, who have a track record of advancing exploration projects from early exploration stage through to feasibility stage.
On behalf of the Board,
GRIZZLY DISCOVERIES INC.
Brian Testo, CEO, President
Suite 363-9768 170 Street NW
Edmonton, Alberta T5T 5L4
For further information, please visit our website at www.grizzlydiscoveries.com or contact:
Nancy Massicotte
Corporate Development
Tel: 604-315-1455
Email: nancy@grizzlydiscoveries.com
Neither the TSX Venture Exchange nor its Regulation Services Provider (as that term is defined in the policies of the TSX Venture Exchange) accepts responsibility for the adequacy or accuracy of this release.
Caution concerning forward-looking information
This press release contains “forward-looking information” and “forward-looking statements” within the meaning of applicable securities laws. This information and statements address future activities, events, plans, developments and projections. All statements, other than statements of historical fact, constitute forward-looking statements or forward-looking information. Such forward-looking information and statements are frequently identified by words such as “may,” “will,” “should,” “anticipate,” “plan,” “expect,” “believe,” “estimate,” “intend” and similar terminology, and reflect assumptions, estimates, opinions and analysis made by management of Grizzly in light of its experience, current conditions, expectations of future developments and other factors which it believes to be reasonable and relevant. Forward-looking information and statements involve known and unknown risks and uncertainties that may cause Grizzly’s actual results, performance and achievements to differ materially from those expressed or implied by the forward-looking information and statements and accordingly, undue reliance should not be placed thereon.
Risks and uncertainties that may cause actual results to vary include but are not limited to the availability of financing; fluctuations in commodity prices; changes to and compliance with applicable laws and regulations, including environmental laws and obtaining requisite permits; political, economic and other risks; as well as other risks and uncertainties which are more fully described in our annual and quarterly Management’s Discussion and Analysis and in other filings made by us with Canadian securities regulatory authorities and available at www.sedarplus.ca. Grizzly disclaims any obligation to update or revise any forward-looking information or statements except as may be required by law.
SOURCE: Grizzly Discoveries Inc.
VANCOUVER, British Columbia, Oct. 16, 2025 (GLOBE NEWSWIRE) — Apollo Silver Corp. (“Apollo” or the “Company”) (TSX.V:APGO, OTCQB:APGOF, Frankfurt:6ZF) is pleased to announce that it has filed the independent technical report for the updated Mineral Resource Estimate (“MRE”) for the Calico Silver Project (“Calico” or the “Calico Project”).
The report titled “NI 43-101 Technical Report and Mineral Resource Estimate for the Calico Silver Project, San Bernardino County, California, USA”, is dated October 16, 2025 (with an effective date of June 30, 2025) (the “Technical Report”). The Technical Report is available under the Company’s issuer profile on SEDAR+ (www.sedarplus.ca) and on the Company’s website (www.apollosilver.com).
The Technical Report was prepared in accordance with National Instrument 43-101 (“NI 43-101”) Standards of Disclosure for Mineral Projects by Stantec Consulting Ltd. (“Stantec”) of Denver, Colorado. There are no material differences in the Technical Report from those results disclosed in the Company’s press release dated September 4, 2025.
Highlights of the MRE announced on September 4, 2025, include:
The 2025 MRE for the Waterloo Property comprises 125 Moz Ag in 55 Mt at an average grade of 71 g/t Ag (M&I categories), 0.51 Moz Ag in 0.60 Mt at an average grade of 26 g/t Ag (Inferred category), 130,000 oz gold in 17 Mt at an average grade of 0.25 g/t gold (Inferred category), 2.7 Mt BaSO4 and 354 Mlbs Zn in 36 Mt at an average grade of 7.4 % BaSO4 and 0.45 % Zn (Indicated category), and 0.65 Mt BaSO4 and 258 Mlbs Zn in 17 Mt at an average grade of 3.9 % BaSO4 and 0.71 % Zn (Inferred category). The 2025 MRE for the Langtry Property comprises 57 Moz Ag in 24 Mt at an average grade of 73 g/t Ag (Inferred category).
ABOUT THE CALICO PROJECT
Location
The Calico Project is located in San Bernardino County, California, and comprises the adjacent Waterloo, Langtry and Mule properties, which total 8,283 acres. The Calico Project is 15 km (9 miles) east from the city of Barstow, 5 km (3 miles) from commercial electric power and has an extensive private gravel road network spanning the property.
Geology and Mineralization
The Calico Project is situated in the southern Calico Mountains of the Mojave Desert, in the south-western region of the Basin and Range tectonic province. This 15 km (9 mile) long northwest-southeast trending mountain range is dominantly composed of Tertiary (Miocene) volcanics, volcaniclastics, sedimentary rocks and dacitic intrusions. Mineralization at Calico comprises high-level low-sulfidation silver-dominant epithermal vein-type, stockwork-type and disseminated-style associated with northwest-trending faults and fracture zones and mid-Tertiary (~19-17 Ma) volcanic activity. Calico represents a district-scale mineral system endowment with approximately 6,000 m (19,685 ft) in mineralized strike length controlled by the Company. Silver and gold mineralization are oxidized and hosted within the sedimentary Barstow Formation and the upper volcaniclastic units of the Pickhandle formation along the contact between these units.
Qualified Person
The scientific and technical data contained in this news release was reviewed, and approved by Derek Loveday, P.Geo., Johnny Marke P.G. and Mariea Kartick, P.Geo., from Stantec and are Qualified Persons independent of the Company. Mr. Loveday is a registered Professional Geoscientist in Alberta, Canada, and Mr. Marke is a registered Professional Geologist in Oregon, USA and both are responsible for the mineral resource estimation. Ms. Kartick is a registered Professional Geoscientist in Ontario, Canada, and is responsible for data QA/QC.
This news release has also been reviewed and approved by Isabelle Lépine, M.Sc., P.Geo., Apollo’s Director of Mineral Resources. Ms. Lépine is a registered Professional Geoscientist in British Columbia, Canada, and is not independent of the Company.
About Apollo Silver Corp.
Apollo Silver is advancing one of the largest undeveloped primary silver projects in the US. The Calico Project hosts a large, bulk minable silver deposit with significant barite and zinc credits – recognized as critical minerals essential to the US energy and medical sectors. The Company also holds an option on the Cinco de Mayo Project in Chihuahua, Mexico, which is host to a major carbonate replacement (CRD) deposit that is both high-grade and large tonnage. Led by an experienced and award-winning management team, Apollo is well positioned to advance the assets and deliver value through exploration and development.
Please visit www.apollosilver.com for further information.
ON BEHALF OF THE BOARD OF DIRECTORS
Ross McElroy
President and CEO
For further information, please contact:
Email: info@apollosilver.com
Telephone: +1 (604) 428-6128
Neither TSX Venture Exchange nor its Regulation Services Provider (as that term is defined in policies of the TSX Venture Exchange) accepts responsibility for the adequacy or accuracy of this release.
This news release includes “forward-looking statements” and “forward-looking information” within the meaning of Canadian securities legislation. All statements included in this news release, other than statements of historical fact, are forward-looking statements including, without limitation, statements with respect to the potential of the Calico Project and its overall investment attractiveness; the expectation that the Calico Project will continue to increase in value, scale and optionality; the potential economic significance of the updated mineral resource estimate, including the newly defined barite and zinc resources in addition to silver and gold; the potential recovery rates; the potential to further expand the resource estimate and upgrade its confidence level, including prospective silver, gold, barite and zinc mineralization on strike and at depth; the potential impact of barite and zinc being designated as critical minerals in the United States; assumptions regarding mineralization at shallow depths and strip ratios; timing and execution of future planned drilling, exploration, preliminary engineering and additional metallurgical activities; timing of commencement and completion of a preliminary economic assessment or other technical studies; the potential for additional discoveries, overall project development and other growth opportunities; and the Company’s ability to advance, develop, and permit the Calico Project. Forward-looking statements include predictions, projections and forecasts and are often, but not always, identified by the use of words such as “anticipate”, “believe”, “plan”, “estimate”, “expect”, “potential”, “target”, “budget” and “intend” and statements that an event or result “may”, “will”, “should”, “could” or “might” occur or be achieved and other similar expressions and includes the negatives thereof.
Forward-looking statements are based on the reasonable assumptions, estimates, analysis, and opinions of the management of the Company made in light of its experience and its perception of trends, current conditions and expected developments, as well as other factors that management of the Company believes to be relevant and reasonable in the circumstances at the date that such statements are made. Forward-looking information is based on reasonable assumptions that have been made by the Company as at the date of such information and is subject to known and unknown risks, uncertainties and other factors that may have caused actual results, level of activity, performance or achievements of the Company to be materially different from those expressed or implied by such forward-looking information, including but not limited to: risks associated with mineral exploration and development; metal and mineral prices; availability of capital; accuracy of the Company’s projections and estimates; realization of mineral resource estimates, interest and exchange rates; competition; stock price fluctuations; availability of drilling equipment and access; actual results of current exploration activities; government regulation; political or economic developments; environmental risks; insurance risks; capital expenditures; operating or technical difficulties in connection with development activities; personnel relations; and changes in Calico Project parameters as plans continue to be refined. Forward-looking statements are based on assumptions management believes to be reasonable, including but not limited to the price of silver, gold zinc and barite; the demand for silver, gold, zinc and barite; the ability to carry on exploration and development activities; the timely receipt of any required approvals; the ability to obtain qualified personnel, equipment and services in a timely and cost-efficient manner; the ability to operate in a safe, efficient and effective matter; and the regulatory framework regarding environmental matters, and such other assumptions and factors as set out herein. Although the Company has attempted to identify important factors that could cause actual results to differ materially from those contained in forward-looking information, there may be other factors that cause results not to be as anticipated, estimated or intended. There can be no assurance that forward-looking statements will prove to be accurate and actual results, and future events could differ materially from those anticipated in such statements. Accordingly, readers should not place undue reliance on forward looking information contained herein, except in accordance with applicable securities laws. The forward-looking information contained herein is presented for the purpose of assisting investors in understanding the Company’s expected financial and operational performance and the Company’s plans and objectives and may not be appropriate for other purposes. The Company does not undertake to update any forward-looking information, except in accordance with applicable securities laws.