TORONTO, Feb. 8, 2023 /CNW/ – Collective Mining Ltd. (TSXV: CNL) (OTCQX: CNLMF) (“Collective” or the “Company”) will be presenting at the OTC Markets Group Precious Metals Virtual Investor Conference on Wednesday, February 15, 2023, at 11:00am ET.
Using the link below, investors can register and listen to the presentation, and take part in a question and answer session at the end. The presentation is expected to last 30 minutes.
DATE: Wednesday, February 15, 2023 TIME: 11:00am ET – 11:30am ET LINK:https://bit.ly/3JCTs89
Please log in 5-10 minutes early to register. An archived webcast will also be made available after the event.
Ari Sussman, Executive Chairman of Collective Mining will be providing an overview and will discuss the Company’s “Main Breccia” discovery at the Apollo target. The Main Breccia discovery is a high-grade and bulk tonnage, copper-silver-gold porphyry-related breccia system characterized by two main, yet distinct pulses of mineralized fluids flooding the breccia with metals.
The Company’s Guayabales project is located in the mining-friendly department of Caldas, Colombia, in the heart of a long-established mining camp with ten fully permitted and operating mines located within three kilometres of the project. As a result, the Guayabales project is blessed with excellent infrastructure with roads and hydroelectric powerlines traversing the project and an abundant labour force located nearby in the townships of Supia and Marmato.
The phase II drilling program is underway with three rigs currently operating focused on testing near surface mineralization and expanding the dimensions of the Main Breccia system. Assay results are expected in the near term for the final three holes of the 2022 program, including westwards step-out hole APC-28, which cut more than 600 metres of continuous mineralization. Additionally, the first hole of the Phase II program is now complete, and core has been dispatched to the lab for assaying.
About Collective Mining Ltd.
To see our latest corporate presentation and related information, please visit www.collectivemining.com
Founded by the team that developed and sold Continental Gold Inc. to Zijin Mining for approximately $2 billion in enterprise value, Collective Mining is a copper, silver and gold exploration company based in Canada, with projects in Caldas, Colombia. The Company has options to acquire 100% interests in two projects located directly within an established mining camp with ten fully permitted and operating mines.
The Company’s flagship project, Guayabales, is anchored by the Apollo target, which hosts the large-scale, bulk-tonnage and high-grade copper, silver and gold Main Breccia discovery. The Company’s near-term objective is to continue with expansion drilling of the Main Breccia discovery while increasing confidence in the highest-grade portions of the system.
Management, insiders and close family and friends own approximately 52% of the outstanding shares of the Company and as a result, are fully aligned with shareholders. The Company is listed on the TSXV under the trading symbol “CNL” and on the OTCQX under the trading symbol “CNLMF”.
Information Contact:
Follow Executive Chairman Ari Sussman (@Ariski) and Collective Mining (@CollectiveMini1) on Twitter
FORWARD-LOOKING STATEMENTS
This news release contains certain forward-looking statements, including, but not limited to, statements about the drill programs, including timing of results, and Collective’s future and intentions. Wherever possible, words such as “may”, “will”, “should”, “could”, “expect”, “plan”, “intend”, “anticipate”, “believe”, “estimate”, “predict” or “potential” or the negative or other variations of these words, or similar words or phrases, have been used to identify these forward-looking statements. These statements reflect management’s current beliefs and are based on information currently available to management as at the date hereof.
Forward-looking statements involve significant risk, uncertainties, and assumptions. Many factors could cause actual results, performance, or achievements to differ materially from the results discussed or implied in the forward-looking statements. These factors should be considered carefully, and readers should not place undue reliance on the forward-looking statements. Although the forward-looking statements contained in this news release are based upon what management believes to be reasonable assumptions, Collective cannot assure readers that actual results will be consistent with these forward-looking statements. These forward-looking statements are made as of the date of this news release, and Collective assumes no obligation to update or revise them to reflect new events or circumstances, except as required by law.
Neither the TSXV nor its Regulation Services Provider (as that term is defined in the policies of the TSXV) accepts responsibility for the adequacy or accuracy of this news release.
Silver ETFs** (Total Known Holdings ETSITOTL Index Bloomberg)
760.17
749.00
11.18
1.49%
1.49%
First real uptick since summer selling
Gold ETFs** (Total Known Holdings ETFGTOTL Index Bloomberg)
93.17
93.75
(0.58)
(0.62)%
(0.62)%
Last positive month was April 2022
Source: Bloomberg and Sprott Asset Management LP. Data as of January 31, 2023. *Mo % Chg and YTD % Chg for this Index are calculated as the difference between the month end’s yield and the previous period end’s yield, instead of the percentage change. BPS stands for basis points. **ETF holdings are measured by Bloomberg Indices; the ETFGTOTL is the Bloomberg Total Known ETF Holdings of Gold Index; the ETSITOTL is the Bloomberg Total Known ETF Holdings of Silver Index.
January Review
Gold had another strong month and the best start to a year since 2015 as spot gold rose $104.34 (or 5.72%) to close January at $1,928.36. While the gold price was supported by the decline in the U.S. dollar (USD) and real yields in January, the magnitude and persistence of the bid for gold were high. Gold bullion trading desks have confirmed this strong interest is a continuation of flow demand from China since early November 2022, and the estimated tonnages bought would align with the most significant numbers since 2017. Price action and trading desk anecdotes denote large buying from China’s “official sector” (possibly any combination of People’s Bank of China, central bank-related entities or state banks) for undisclosed reasons.
January was a solid month for risk assets as investment funds were underexposed for a positive, right-tail8 outcome. The significant left-tail risks of 2022 quickly faded or reversed as we headed toward the new year. In the U.S., fears of hyperinflation and additional Federal Reserve (“Fed”) rate hikes ended abruptly as the Fed signaled it would slow its rate hikes just as inflation data finally moderated. In Europe, a far warmer-than-expected winter prevailed, allowing the EU to dodge the worst of an energy-spiking-induced hard landing and associated stress events. After years of a strict zero-COVID policy, China quickly reversed to a full re-opening, instantly giving the world an unexpected growth shock. With all three major economic regions experiencing a sudden reversal from left-tail (negative) to right-tail (positive) outcomes, massive forced buying was triggered.Gold has outperformed U.S. Treasuries over the past two decades despite the bond market having the advantages of a dovish accommodative Fed.
Furthermore, with the pause in Fed rate hikes in sight, both the USD and interest rates declined sharply, easing financial conditions and paving the way for a rebound in many financial assets. Whether this rally is the beginning of the consensus-desired soft landing or yet another bear market rally remains to be seen. We expect that macro volatility will likely remain high in the months ahead.
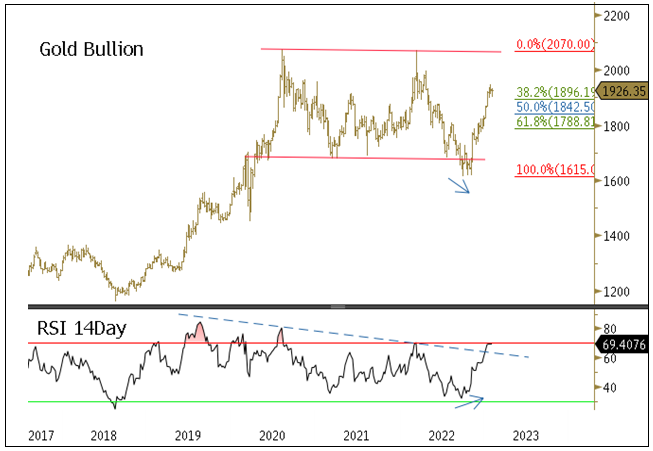
Gold Bullion Update
Gold bullion since the autumn lows, based on a three-month rate of change, had the most significant increase since 2011. Since the lows, the gold price has broken through technical resistance levels and Fibonacci retracement levels9 with remarkable ease, reinforcing the evidence that the buyer(s) are not likely financial market types. From gold’s early November lows of approximately $1,625 to $1,775, the price action has the look and feel of short covering in the face of an aggressive buyer. But since gold has reached the $1,775 level, the narrow up-channel and low bid-ask dispersion indicate a persistent large bid in gold that is not concerned with market-related overbought conditions. Lastly, the weekly Relative Strength Index (RSI)10 put in a positive divergence during the autumn lows and has broken above the RSI downtrend line (lower panel of Figure 1).
Figure 1. Gold Bullion Rally with Technical Strength
Source: Bloomberg. Data as of 1/31/2023. Included for illustrative purposes only. Past performance is no guarantee of future results.
Gold Investment Positioning Remains Low
Despite the rise in gold, the long gold CFTC(Commodity Futures Trading Commission) net non-commercial positions and ETF holdings remain muted, like a deer caught in a headlight (Figure 2). Gold held in ETFs (mainly retail and smaller funds) remain near +2.5-year lows and has not shown any buying indication yet. CFTC non-commercial long gold positioning, too, remains near the low end of its 10-year range. Neither of these two sources of investment “longs” is likely to sell off further as they are more trend-following than leading. The last source of investment flows, short positions, are even less likely to add to selling flows. Firstly, there is no overriding primary bearish macro driver (interest rate hikes are near the end, and the USD is weakening); secondly, shorting into massive buying is outright dangerous. The combined CFTC gold longs plus ETF gold holdings are now at their -2 standard deviation lows (lower panel, Figure 2) with macro drivers positive and massive buying from China and central banks. The risk from long positioning remains skewed to increasing longs, not divestment.
Figure 2. Gold Investment Demand Remains Muted
Source: Bloomberg. Data as of 1/31/2023. Included for illustrative purposes only. Past performance is no guarantee of future results.
U.S. Dollar Strength and U.S. Treasury Liquidity Functioning
The US Dollar Index (DXY) reached the upper end of its 16-year-long uptrend and has now fallen at a remarkable pace last seen in the volatile years of 2008 to 2010. The 3-month rate of change of DXY has recorded its second sharpest decline in the past 20 years. This dramatic fall in the USD has also eased financial conditions, creating a powerful tailwind for gold and other risk assets. Typically, policy coordination comes to mind when currencies sharply reverse from levels detrimental to market functioning quickly, with such high correlations. Unfortunately, if policymakers have decided on a coordinated USD strength reduction policy, we won’t know until much later when it becomes evident in hindsight.
The Bloomberg US Government Securities Liquidity Index (a measure of liquidity condition for U.S. Treasuries) surpassed the crisis levels of March 2020, the last time the Fed was forced to intervene to restore market functioning with interest rate cuts, liquidity injections, swap facilities, etc. Generally, a strong USD reduces systematic market liquidity, and Figure 3 highlights this relationship. The U.S. Treasury Market is the world’s largest and most liquid market. If it were to cease functioning properly, the spillover effects could be catastrophic in an overleveraged financial system under the wrong conditions. We would expect the days of runaway USD strength will not be allowed due to liquidity functioning alone.
Figure 3. U.S. Dollar Index and U.S. Treasury Liquidity Index
Source: Bloomberg. Data as of 1/31/2023. Included for illustrative purposes only. Past performance is no guarantee of future results.
Foreign Selling of U.S. Treasuries is Accelerating
Foreign holdings of U.S. Treasuries as a percentage of total holdings peaked in 2013, a decade ago. Most of this time, the Fed provided QE (quantitative easing) programs, negating the need for foreign funding of Treasuries. In Figure 4, we highlight foreign ownership of U.S. Treasuries and the rapidly decreasing percentage of foreign ownership of U.S. Treasuries. In March 2022, foreign holders saw notable selling (~$516 billion). There were several reasons, including 1) the Fed ending its latest QE program; 2) geopolitics (the Russia-Ukraine war and intensifying de-globalization; 3) the start of an aggressive string of Fed rate hikes along with tightening by other central banks; 4) USD weaponization had been occurring for several years, but the seizure of Russia’s foreign exchange (FX) reserves was likely the final straw. After these events, U.S. Treasury Liquidity began to deteriorate, even worse than in March 2020. Without liquidity support for U.S. Treasuries, the probability of another QE program (or a variation built around YCC, i.e., yield curve control) within the next few years is no longer remote, even in the face of high inflation.
Figure 4. Foreign Buyers are Dumping U.S. Debt
Source: Bloomberg. Data as of 1/31/2023. Included for illustrative purposes only. Past performance is no guarantee of future results.
China Replacing U.S. Treasuries with Gold?
Since 2008, China has been the largest foreign holder of U.S. Treasuries. Though the peak has been in place since 2013, China has recently accelerated its selling of Treasuries. The reason for China selling U.S. Treasury securities are varied and not disclosed. Still, since the U.S. sanctioned Russia’s FX reserves, China has a tremendous incentive to diversify its foreign exchange reserves. Figure 5 highlights the cumulative change in China’s gold imports and U.S. Treasures since 2018, measured in USD. 2018 was the first year of the U.S.-China trade war. The recent accelerated selling in U.S. Treasuries occurred at the start of the Russia-Ukraine war and in response to sanctions on Russia’s FX reserves. We expect China to continue reducing its U.S. Treasuries holdings as the economic war extends and intensifies, and the risk of future U.S. sanctions on China’s FX reserves remains present.
Since 2018, we estimate that China has sold $310 billion of U.S. Treasuries ($199 billion in 2022 alone) and has imported $230 billion of gold. China is estimated to have the seventh-largest global bond market, with the top six positions held by the U.S. and its allies. The list of the most liquid tradeable currencies has the same size ranking. In terms of market liquidity, safety as outside money and convertibility (sanctions resistant), gold remains a highly desirable asset for China.
Figure 5. China Buys Gold and Sells U.S. Bonds
Source: Bloomberg. Data as of 11/30/2022. Included for illustrative purposes only. Past performance is no guarantee of future results.
Japan Yield Curve Control (YCC) and Selling U.S. Treasuries
The Bank of Japan (BoJ) began yield curve control in 2016 (0.25% cap on its 10-year yield) to achieve an inflation target of 2% and stimulate economic growth by controlling long-term interest rates. By late 2022, the BoJ did “technically” achieve its goals, although not the hoped-for “virtuous growth cycle” outcome. However, the costs were enormous as global yields soared while Japanese government bond (JGB) yields were capped at 0.25% by the BoJ. The yen had fallen in value by 22.5%, driving import cost inflation so high that the Ministry of Finance had to intervene in the currency market to defend the yen, while at the same time, the BoJ continued with YCC weakening the yen. If this makes no sense, then you have read this correctly.
In December 2022, in a surprise move, the BoJ lifted the YCC cap to 0.50% from 0.25%, signaling to the market that the BoJ YCC had likely reached its best-before date. Since then, the yen has strengthened by ~15%, contributing to USD weakness. Capping JGB yields in the second half of 2022 as global yields soared required massive purchases of JGBs via quantitative easing. This 2H 2022 QE event was a monetary stimulus of 76 trillion yen or $550 billion (~14% of GDP, i.e., gross domestic profit). The end of this stimulus is likely to act as a defacto global tightening. Raising the yield cap also removed a global “low-yield anchor” on global rates. Not only is this yield anchor fading, but Japanese institutional investors, one of the world’s largest foreign bond buyers, are returning to JGBs. Year to date as of this writing, U.S. Treasury holdings in Japan have declined ~$220 billion since the start of 2022. For various reasons, the two largest holders of U.S. Treasuries have sold $420 billion, or 17.5% of their combined holdings, in 2022.
Foreign selling of U.S. Treasuries is increasing, and the Fed in quantitative tightening (QT )mode leaves U.S. domestic investors as the primary buyers for U.S. Treasuries. Maintaining U.S. Treasury liquidity is now more critical than ever, and the looming debt ceiling standoff will be the next challenge. For gold, the immediate bullish catalyst is a weaker USD and lower real yields. Rising JGB yields will lead to higher U.S. nominal yields but lower breakeven yields (removal of stimulus weakens growth), resulting in lower real yields.
Figure 6. U.S. Treasuries Held by Japan and China, $Billions
Source: Bloomberg. Data as of 1/31/2023. Included for illustrative purposes only. Past performance is no guarantee of future results.
Gold vs. Bonds, Heresy Anyone?
Thus far in 2023, there have been near-record capital inflows into the bond market after 2022 recorded the worst year for bond returns in 48 years of available data. In Figure 7a, we update the gold bullion to the U.S. Treasury Index ratio, highlighting that gold has outperformed over the past several years since 2016 and even over the past 20 years. The gold-Treasury ratio is testing the upper resistance level, and we expect an eventual break higher. Figure 7b highlights the performance of gold versus U.S. equities and U.S. bonds over the past five and 20 years, with performance and portfolio metrics highlighting how well gold has performed and behaved.
Despite these positive metrics, gold is still not widespread in investment portfolios. In the past five years, gold compared to both equities and bonds, has a better Sharpe ratio (risk-adjusted return), a better Sortino ratio (lower downside volatility) and the lowest market correlation (increased diversification).
Gold has outperformed U.S. Treasuries over the past two decades despite the bond market having the advantages of a dovish accommodative Fed (QE, ZIRP, NIRP)11 with volatility-destroying practices (forward guidance, Fed put). Furthermore, most of the past 20 years were dominated by low inflation, low macro volatility, negative stock-bond correlations, etc., all favoring bond performance. In our 2023 Top 10 Watch List, we highlighted several significant macro changes underway, all pointing to higher inflationary pressures and increasing volatility. If gold outperformed U.S. Treasuries in the past decades, we believe the chances are excellent that it is likely to do so in the next several years.
Figure 7a. Gold to U.S. Treasury Index Ratio: Gold Significantly Outperforming U.S. Treasuries
Source: Bloomberg. Data as of 1/31/2023. Included for illustrative purposes only. Past performance is no guarantee of future results.
Figure 7b. Gold vs. Equities and Bonds: 5 & 20-Year Returns and Metrics
Dec. 2017 to Dec. 2022
5 YR CAGR*
Standard Deviation
Max Drawdown
Sharpe Ratio
Sortino Ratio
Market Correlation
U.S. Stock Market
8.67%
19.06%
-24.94%
0.46
0.68
1.00
Total U.S. Bond Market
0.02%
5.09%
-17.57%
-0.23
-0.29
0.34
Gold
6.86%
13.45%
-18.06%
0.47
0.85
0.16
Dec. 2002 to Dec. 2022
20 YR CAGR*
Standard Deviation
Max Drawdown
Sharpe Ratio
Sortino Ratio
Market Correlation
U.S. Stock Market
9.52%
15.29%
-50.89%
0.59
0.87
1.00
Total U.S. Bond Market
3.06%
3.95%
-17.57%
0.48
0.7
0.12
Gold
8.65%
16.87%
-42.91%
0.51
0.83
0.08
*CAGR refers to compound annual growth rate.
1
Gold bullion is measured by the Bloomberg GOLDS Comdty Spot Price.
2
Silver bullion is measured by Bloomberg Silver (XAG Curncy) U.S. dollar spot rate.
3
The NYSE Arca Gold Miners Index (GDM) is a rules-based index designed to measure the performance of highly capitalized companies in the Gold Mining industry.
4
The Bloomberg Commodity Index (BCOM) is a broadly diversified commodity price index distributed by Bloomberg Indices.
5
The U.S. Dollar Index (USDX, DXY, DX) is an index (or measure) of the value of the United States dollar relative to a basket of foreign currencies, often referred to as a basket of U.S. trade partners’ currencies.
6
The S&P 500 or Standard & Poor’s 500 Index is a market-capitalization-weighted index of the 500 largest U.S. publicly traded companies.
7
Any event that is extremely rare, beyond the sixth standard deviation in a normal distribution, is known as a six sigma event.
8
Source: Investopedia. Tail risk is the chance of a gain/loss occurring due to a rare event, as predicted by a probability distribution. Right-tail risks are associated with substantial investment gains, while left-tail risks are associated with unexpected losses.
9
Source: Investopedia. Fibonacci retracement levels are horizontal lines that indicate where support and resistance are likely to occur. They are based on Fibonacci numbers. Each level is associated with a percentage. The percentage is how much of a prior move the price has retraced. The Fibonacci retracement levels are 23.6%, 38.2%, 61.8% and 78.6%. While not officially a Fibonacci ratio, 50% is also used. The indicator is useful because it can be drawn between any two significant price points.
10
Source: Investopedia. The Relative Strength Index (RSI) is a momentum indicator that measures the magnitude of recent price changes to analyze overbought or oversold conditions.
11
QE-ZIRP-NIRP is Fed speak and refers to “quantitative easing”, “zero interest rate policy” and “negative interest rate policy”.
Paul Wong, CFA, Market Strategist Paul has held several roles at Sprott, including Senior Portfolio Manager. He has more than 30 years of investment experience, specializing in investment analysis for natural resources investments. He is a trained geologist and CFA holder. Read Bio
Country* United States Canada Argentina Australia Austria Belgium Brazil China Denmark Finland France Germany India Ireland Italy Japan Netherlands New Zealand Norway South Africa Spain Sweden Switzerland United Kingdom Other
Past performance is no guarantee of future results. You cannot invest directly in an index. Investments, commentary and statements are that of the author and may not be reflective of investments and commentary in other strategies managed by Sprott Asset Management USA, Inc., Sprott Asset Management LP, Sprott Inc., or any other Sprott entity or affiliate. Opinions expressed in this commentary are those of the author and may vary widely from opinions of other Sprott affiliated Portfolio Managers or investment professionals.
This content may not be reproduced in any form, or referred to in any other publication, without acknowledgment that it was produced by Sprott Asset Management LP and a reference to sprott.com. The opinions, estimates and projections (“information”) contained within this content are solely those of Sprott Asset Management and are subject to change without notice. SAM LP makes every effort to ensure that the information has been derived from sources believed to be reliable and accurate. However, SAM LP assumes no responsibility for any losses or damages, whether direct or indirect, which arise out of the use of this information. SAM LP is not under any obligation to update or keep current the information contained herein. The information should not be regarded by recipients as a substitute for the exercise of their own judgment. Please contact your own personal advisor on your particular circumstances. Views expressed regarding a particular company, security, industry or market sector should not be considered an indication of trading intent of any investment funds managed by Sprott Asset Management LP. These views are not to be considered as investment advice nor should they be considered a recommendation to buy or sell.
The information provided is general in nature and is provided with the understanding that it may not be relied upon as, nor considered to be, the rendering or tax, legal, accounting or professional advice. Readers should consult with their own accountants and/or lawyers for advice on their specific circumstances before taking any action.
Burlington, Ontario–(Newsfile Corp. – January 31, 2023) – Silver Bullet Mines Corp. (TSXV: SBMI) (OTCQB: SBMCF) (‘SBMI’ or ‘the Company’) is pleased to update the assay results from its Black Copper occurrence, reported earlier on January 31, 2023.
In SBMI’s January 17, 2023 press release, SBMI advised third part geologic consultants including the QP had visited the Black Copper occurrence in late November and early December, 2022. Black Copper is situated on SBMI’s Black Diamond property roughly one point five kilometres south of the Buckeye Mine and is referred to in the January, 2021 Geologic Report. Samples from Black Copper were taken and reported the following results:
Sample number
Au (ppb)
Cu ppm
342151
615
>1000
342152
192
>1000
342153
941
>1000
342154
654
>1000
The over-detection limit for copper on these samples was 1000 parts per million. These four samples were sent for further analysis which returned:
Sample number
Cu ppm
Cu %
342151
22400
2.24
342152
37400
3.740
342153
34000
3.400
342154
54900
5.490
The press release from earlier today incorrectly stated the values in parts per million as a result of manual data entry into the press release. A copy of the Actlabs certificates for these samples is attached.
QAQC For SBMI
All the samples above were collected by Robert Komarechka and John Corkery. Samples were collected and placed in sample bags with their appropriate tag and personally taken to the courier and shipped to Actlabs in Thunder Bay, Ontario for assaying. Certified standards and blanks were used both by the Company and Actlabs.
All samples analyzed by Actlabs were by Fire Assay ICPOES (Induced coupled plasma arc with optical emission spectroscopy).
The multi-element analysis was by digestion with a combination of hydrochloric, nitric, perchloric and hydrofluoric acids.
Mr. Robert G. Komarechka, P.Geo., an independent consultant, has reviewed and verified SBMI’s work referred to herein, and is the Qualified Person for this release.
With respect to the Company’s press release concerning seeking an extension of the Warrants (as that term is defined in that release), SBMI advises it is seeking an extension on a total of 8,528,081 Warrants with new expiry dates ranging from February 6, 2024 to July 8, 2024.
For further information, please contact:
John Carter Silver Bullet Mines Corp., CEO cartera@sympatico.ca +1 (905) 302-3843
Peter M. Clausi Silver Bullet Mines Corp., VP Capital Markets pclausi@brantcapital.ca +1 (416) 890-1232
Cautionary and Forward-Looking Statements
This news release contains certain statements that constitute forward-looking statements as they relate to SBMI and its subsidiaries. Forward-looking statements are not historical facts but represent management’s current expectation of future events, and can be identified by words such as “believe”, “expects”, “will”, “intends”, “plans”, “projects”, “anticipates”, “estimates”, “continues” and similar expressions. Although management believes that the expectations represented in such forward-looking statements are reasonable, there can be no assurance that they will prove to be correct.
By their nature, forward-looking statements include assumptions, and are subject to inherent risks and uncertainties that could cause actual future results, conditions, actions or events to differ materially from those in the forward-looking statements. If and when forward-looking statements are set out in this new release, SBMI will also set out the material risk factors or assumptions used to develop the forward-looking statements. Except as expressly required by applicable securities laws, SBMI assumes no obligation to update or revise any forward-looking statements. The future outcomes that relate to forward-looking statements may be influenced by many factors, including but not limited to: the impact of SARS CoV-2 or any other global virus; reliance on key personnel; the thoroughness of its QA/QA procedures; the continuity of the global supply chain for materials for SBMI to use in the production and processing of ore; shareholder and regulatory approvals; activities and attitudes of communities local to the location of the SBMI’s properties; risks of future legal proceedings; income tax matters; fires, floods and other natural phenomena; the rate of inflation; availability and terms of financing; distribution of securities; commodities pricing; currency movements, especially as between the USD and CDN; effect of market interest rates on price of securities; and, potential dilution. SARS CoV-2 and other potential global pathogens create risks that at this time are immeasurable and impossible to define.
Burlington, Ontario–(Newsfile Corp. – January 31, 2023) – Silver Bullet Mines Corp. (TSXV: SBMI) (OTCQB: SBMCF) (‘SBMI’ or ‘the Company’) is pleased to report results from its Buckeye Mine development, ongoing PGM (platinum group metals) study, assay results from its Black Copper occurrence and the discovery of a new gold occurrence on its Black Diamond Property.
Development drift intersecting a wall of sulphides at the Buckeye Mine, Jan. 28, 2023
As of this date, the development drift at the Buckeye Mine has advanced about 116 metres from the adit alongside the main vein with ongoing bolting and screening.
In its January 17, 2023 press release, the Company advised it “…next intends to drift along the vein to an area believed to contain higher grade mineralization (see page 8 of the Geologic Report dated January 8, 2021).” However, the Company believes it may have intercepted that area of higher grade mineralization sooner than expected.
Approximately 1 metre before turning into the anticipated intersection with the main vertical vein, a 0.6 metre thick horizontal fracture zone was encountered that contained bands of massive sulphides. Horizontal sulphide bands were also noted by the QP for this press release in the Treasure Room along with paper thin layers of high purity native silver, similar to the bands in the newly discovered fracture zone. While the Company expected to locate the area of higher grade mineralization, the placement of this 0.6 metre wide area of sulphide mineralization was a positive surprise to the Company.
A blast in the drift on January 27, 2023 exposed another wall of sulphides at the end of the drift. These sulphides were also encountered sooner than the Company expected. Samples of the sulphide material are being prepared to be sent for assaying and further petrographic examination.
Regarding the earlier reported PGM assays and as previously reported, check assay samples have been sent to three independent certified labs. SBMI is awaiting complete reporting of the assays from the three labs. In addition to these check assays, the Company has contracted Dr. Andy McDonald, Mineralogist, of the Harquail School of Earth Sciences, at Laurentian University in Sudbury, Ontario, Canada, to undertake sample preparation, petrographic and scanning electron microscope examination of two samples derived from the Buckeye Mine.
The first sample being analyzed by Dr. McDonald was taken by the QP in November, 2022. It was diabase from the floor of the Treasure Room of the Buckeye Mine containing a silvery ductile mineral, subsequently confirmed by Dr. McDonald to be high purity native silver. When this sample was examined with an uncalibrated handheld X-ray fluorescent unit, the presence of palladium at 29 and 21 parts per million was noted. The second sample provided to Dr. McDonald was a malformed dore bar poured by SBMI in September, 2022 derived from the Buckeye Mine, containing highly refractory “unknown material.”
Native silver in diabase rock sample collected from the floor of the Treasure Room, Buckeye Mine
Also in SBMI’s January 17, 2023 press release, SBMI advised third part geologic consultants including the QP had visited the Black Copper occurrence in late November and early December, 2022. Black Copper is situated on SBMI’s Black Diamond property roughly one point five kilometres south of the Buckeye Mine and is referred to in the January, 2021 Geologic Report. Samples from Black Copper were taken and reported the following results:
Sample number
Au (ppb)
Cu ppm
342151
615
>1000
342152
192
>1000
342153
941
>1000
342154
654
>1000
The over-detection limit for copper on these samples was 1000 parts per million. These four samples were sent for further analysis which returned:
Sample number
Cu ppm
Cu %
342151
2240
2.24
342152
3740
3.740
342153
3400
3.400
342154
5490
5.490
In addition, during this geological study, an area of broken rusty quartz float was observed by the QP near the trail to the Richmond Basin to the west of the McMorris and Buckeye Mines. This is the Company’s first testing of this area. These quartz fragments appeared to be segments of narrow quartz veins containing sulphides. Due to a soil cover of a few inches to a foot in this area, limited time prevented exposure of the underlying bedrock. Four samples were collected from surface and yielded the following gold assays:
Sample number
Au (ppb)
Bi (ppm)
342109
17
2
342110
4450
412
342111
64
1600
342112
7
16
A bismuth assay of 1600 ppm and a silver assay over 100 ppm was recorded in sample 342111. The QP of this press release highly recommends further evaluation of this new gold occurrence.
Sample 342110 assayed 4.45 g/t Au. from the new gold occurrence.
All the samples above were collected by Robert Komarechka and John Corkery. Samples were collected and placed in sample bags with their appropriate tag and personally taken to the courier and shipped to Actlabs in Thunder Bay, Ontario for assaying. Certified standards and blanks were used both by the Company and Actlabs.
All samples analyzed by Actlabs were by Fire Assay ICPOES (Induced coupled plasma arc with optical emission spectroscopy).
The multi-element analysis was by digestion with a combination of hydrochloric, nitric, perchloric and hydrofluoric acids.
Mr. Robert G. Komarechka, P.Geo., an independent consultant, has reviewed and verified SBMI’s work referred to herein, and is the Qualified Person for this release.
With respect to the Company’s press release concerning seeking an extension of the Warrants (as that term is defined in that release), SBMI advises it is seeking an extension on a total of 8,528,081 Warrants with new expiry dates ranging from February 6, 2024 to July 8, 2024.
For further information, please contact:
John Carter Silver Bullet Mines Corp., CEO cartera@sympatico.ca +1 (905) 302-3843
Peter M. Clausi Silver Bullet Mines Corp., VP Capital Markets pclausi@brantcapital.ca +1 (416) 890-1232
Cautionary and Forward-Looking Statements
This news release contains certain statements that constitute forward-looking statements as they relate to SBMI and its subsidiaries. Forward-looking statements are not historical facts but represent management’s current expectation of future events, and can be identified by words such as “believe”, “expects”, “will”, “intends”, “plans”, “projects”, “anticipates”, “estimates”, “continues” and similar expressions. Although management believes that the expectations represented in such forward-looking statements are reasonable, there can be no assurance that they will prove to be correct.
By their nature, forward-looking statements include assumptions, and are subject to inherent risks and uncertainties that could cause actual future results, conditions, actions or events to differ materially from those in the forward-looking statements. If and when forward-looking statements are set out in this new release, SBMI will also set out the material risk factors or assumptions used to develop the forward-looking statements. Except as expressly required by applicable securities laws, SBMI assumes no obligation to update or revise any forward-looking statements. The future outcomes that relate to forward-looking statements may be influenced by many factors, including but not limited to: the impact of SARS CoV-2 or any other global virus; reliance on key personnel; the thoroughness of its QA/QA procedures; the continuity of the global supply chain for materials for SBMI to use in the production and processing of ore; shareholder and regulatory approvals; activities and attitudes of communities local to the location of the SBMI’s properties; risks of future legal proceedings; income tax matters; fires, floods and other natural phenomena; the rate of inflation; availability and terms of financing; distribution of securities; commodities pricing; currency movements, especially as between the USD and CDN; effect of market interest rates on price of securities; and, potential dilution. SARS CoV-2 and other potential global pathogens create risks that at this time are immeasurable and impossible to define.
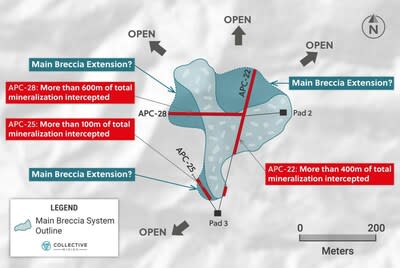
Visual observations from two more step-out diamond drill holes, APC-25 and APC-28, within the Company’s Main Breccia discovery at the Apollo target (“Apollo”) have expanded the mineralized footprint of the system to the west and at depth. These holes are in addition to previously announced visual observations for step-out hole APC-22, which was drilled from Pad 3 to the northeast and cut more than 400 metres of continuous mineralization.
APC-28, which was drilled westwards from Pad 2, is the longest and deepest hole drilled to date into the Main Breccia discovery at Apollo. The hole intersected over 600 metres of continuous breccia mineralization which represents the longest continuously mineralized intercept drilled to date. Visual inspection of the mineralized intercept includes an upper copper rich zone followed by multiple zones enriched by sheeted carbonate base metal (“CBM”) vein overprinting. The hole terminated at approximately 956 metres while still in mineralization.
Hole APC-25, which was drilled to the northwest from Pad 3 and designed as a short step-out hole, cut more than 100 metres of favourable mineralization beginning at 65 metres below surface. Visual inspection of mineralization indicates that the intercept will be enriched in copper with 1.5% to 2.5% chalcopyrite being recorded in the logs. This is the westernmost hole drilled to date within the Main Breccia discovery at Apollo and opens the potential for further shallow mineralization expansion to the west.
Assay results for the remaining nine holes from the 2022 program are outstanding and expected in the near term.
Ari Sussman, Executive Chairman commented:“To date, every time that we have undertaken step-out drilling at the Main Breccia system of Apollo, we have expanded the size of the discovery. The exceptional continuity encountered in drilling highlights the potential for a very large, bulk tonnage deposit with robust grades due to the copper-silver-gold mineralization within the breccia matrix being deposited from both a porphyry source as well as low and intermediate sulphidation vein systems. We will remain aggressive in 2023 with drilling set to resume in the coming days.”
TORONTO, Jan. 5, 2023 /CNW/ – Collective Mining Ltd. (TSXV: CNL) (OTCQX: CNLMF) (“Collective” or the “Company”) is pleased to announce visual observations from two additional step-out holes drilled into the Main Breccia discovery at Apollo (“Apollo”), which is located within the Guayabales project in Caldas, Colombia. The Main Breccia discovery is a high-grade, bulk tonnage copper-silver-gold porphyry-related system, which owes its excellent metal endowment to multiple phases of mineralization which include older copper-silver-gold porphyry mineralization and younger, overprinting, sheeted carbonate base metal vein systems.
Details
Twenty-two diamond drill holes with accompanying assay results have now been announced at Apollo and a further nine holes await assay results in the near term. The Company recently completed two westerly directed step out diamond drill holes, APC-25 and APC-28, drilled from its southernmost drill pad (Pad 3) and from its easternmost drill pad (Pad 2). The holes were designed to test for western and depth extensions to the Main Breccia discovery. The following visual observations are highlighted from the two step out holes:
Hole APC-25 was drilled approximately northwest from Pad 3 to a maximum depth of 215.80 metres and was designed to test for potential westerly extensions to shallow and outcropping breccia mineralization. The hole intersected more than one hundred metres of continuous mineralization beginning at 73 metres down hole (65 metres vertical) and continued until approximately 180 metres downhole (160 metres vertical). The mineralized angular breccia contains a sulphide matrix which includes 1.5% to 2.5% chalcopyrite and between 1% and 3% pyrite plus pyrrhotite. The breccia has been overprinted by a zone of carbonate and base metal (sphalerite and galena) veins which based on previously announced results, host higher gold grades. APC-25 is the westernmost hole drilled into the main breccia discovery and opens the potential for further shallow mineralization in the west.
Hole APC-28 was drilled steeply to the west from Pad 2 to a maximum depth of 956.35 metres and was designed to test for western and depth extensions to the Main Breccia system. The hole intersected a hanging wall zone followed by the main zone of mineralized breccia material. The hanging wall zone was 19 metres thick beginning at 286 metres downhole and then the main zone of mineralization began at 354 metres downhole and continued to the end of the hole at 956.35 metres. The main zone of mineralized breccia hosts an upper portion where the sulphide matrix is rich in copper (chalcopyrite 0.7% to 1.5%), pyrite and pyrrhotite, and a lower portion where multiple zones of overprinting CBM veins were observed. APC-28 is the deepest and longest hole drilled to date and hosts the widest zone of continuous breccia mineralization intercepted to date. The hole was terminated while still in mineralization due to the limitations of the drill rig.
In 2022, a total of 14,975 metres (31 holes) were drilled at the Apollo target. To date assay results have been released for 22 holes with results for the holes that remain outstanding expected in early 2023.
The Company’s 2023 drill program will begin in the coming days and will focus on targeting the high-grade subzones within the Main Breccia system while simultaneously expanding the potential size of the system. Additionally, the Company will remain aggressive in testing new targets at Apollo including the newly generated copper and molybdenum porphyry target located 150 metres south of the Main Breccia system.
Figure 1: Plan View Outline of the Main Breccia Discovery at Apollo Highlighting Step-Out Drill Holes APC-25 and APC-28 (CNW Group/Collective Mining Ltd.)
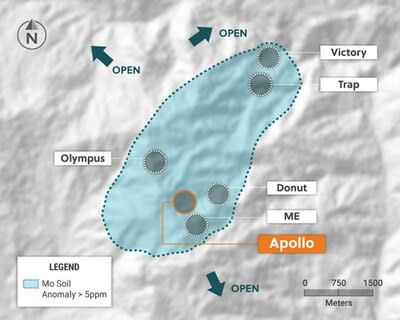
Figure 2: Plan View of the Guayabales Project Highlighting the Apollo Target (CNW Group/Collective Mining Ltd.)
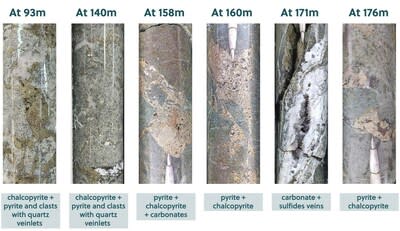
Figure 3: Selection of Core from Drill Hole APC-25 (CNW Group/Collective Mining Ltd.)
Figure 4: Selection of Core from Drill Hole APC-28 (CNW Group/Collective Mining Ltd.)
About Collective Mining Ltd.
To see our latest corporate presentation and related information, please visit www.collectivemining.com
Founded by the team that developed and sold Continental Gold Inc. to Zijin Mining for approximately $2 billion in enterprise value, Collective Mining is a copper, silver and gold exploration company based in Canada, with projects in Caldas, Colombia. The Company has options to acquire 100% interests in two projects located directly within an established mining camp with ten fully permitted and operating mines.
The Company’s flagship project, Guayabales, is anchored by the Apollo target, which hosts the large-scale, bulk-tonnage and high-grade copper, silver and gold Main Breccia discovery. The Company’s near-term objective is to continue with expansion drilling of the Main Breccia discovery while increasing confidence in the highest-grade portions of the system.
Management, insiders and close family and friends own nearly 35% of the outstanding shares of the Company and as a result, are fully aligned with shareholders. The Company is listed on the TSXV under the trading symbol “CNL” and on the OTCQX under the trading symbol “CNLMF”.
Qualified Person (QP) and NI43-101 Disclosure
David J Reading is the designated Qualified Person for this news release within the meaning of National Instrument 43-101 (“NI 43-101”) and has reviewed and verified that the technical information contained herein is accurate and approves of the written disclosure of same. Mr. Reading has an MSc in Economic Geology and is a Fellow of the Institute of Materials, Minerals and Mining and of the Society of Economic Geology (SEG).
Technical Information
Rock and core samples have been prepared and analyzed at SGS laboratory facilities in Medellin, Colombia and Lima, Peru. Blanks, duplicates, and certified reference standards are inserted into the sample stream to monitor laboratory performance. Crush rejects and pulps are kept and stored in a secured storage facility for future assay verification. No capping has been applied to sample composites. The Company utilizes a rigorous, industry-standard QA/QC program.
FORWARD-LOOKING STATEMENTS
This news release contains certain forward-looking statements, including, but not limited to, statements about the drill programs, including timing of results, and Collective’s future and intentions. Wherever possible, words such as “may”, “will”, “should”, “could”, “expect”, “plan”, “intend”, “anticipate”, “believe”, “estimate”, “predict” or “potential” or the negative or other variations of these words, or similar words or phrases, have been used to identify these forward-looking statements. These statements reflect management’s current beliefs and are based on information currently available to management as at the date hereof.
Forward-looking statements involve significant risk, uncertainties, and assumptions. Many factors could cause actual results, performance, or achievements to differ materially from the results discussed or implied in the forward-looking statements. These factors should be considered carefully, and readers should not place undue reliance on the forward-looking statements. Although the forward-looking statements contained in this news release are based upon what management believes to be reasonable assumptions, Collective cannot assure readers that actual results will be consistent with these forward-looking statements. These forward-looking statements are made as of the date of this news release, and Collective assumes no obligation to update or revise them to reflect new events or circumstances, except as required by law.
Neither the TSXV nor its Regulation Services Provider (as that term is defined in the policies of the TSXV) accepts responsibility for the adequacy or accuracy of this news release.
Percentage of Portfolio: Minimum 10%, but we hold approximately 35% in our portfolio.
GREAT FOUNDATIONAL READINGS:
Methodology: Using the Ratio’s.
Dow:Gold Ratio is indicating that Gold is on sale relative to the Dow. When the ratio is between 4-5, it is more favorable to be in general equities and real estate. At present the ratio is 1 share of the Dow = 18 oz of Gold.
Looking further, Silver and Platinum are on sale relative to Gold.
Gold:Silver Ratio At present 1 oz of Gold = 76.5 oz of Silver. When the ratio is between 45-54 trade your Silver in for Gold. Note: Silver Eagles have demanded a significant premium the past 8 months. Which actually reduced the Gold:Silver Ratio inside the 45-54 range.
Platinum:Gold Ratio: At present .59 oz of Platinum is = 1 oz of Gold. When the ratio is equal to and or greater than 1, trade your Platinum in for Gold.
A great resource on the power of Ratio’s and when to buy and sell is: Bob Moriarty’s:Nobody Knows Anything(Must Read)!
#2 ROYALTY AND PROJECT GENERATORS
Royalty and Project Generators use a unique business model relative to their mining industry peers.
Why: They tend to outperform mining exploration companies accretively (Highlighted Below):
These companies are most speculative and offer tremendous upside and conversely a lot of downside. We are biased and are active buyers of our partner/advertisers found (Here). For a deeper dive into the mining/exploration industry: (Must Reads):
Commit your future to paper. Not having a plan, is a plan. A foolish one, but is a plan. If you don’t have a plan for your savings and investments someone else does. SCHEDULE YOUR PATH.
Be willing to study each of the aforementioned. Don’t believe the hype! Don’t get mislead by fancy thumbnails, price predictions, and narratives on manipulation. Is there manipulation? Yes, in every market! Don’t complain about manipulation, learn to leverage manipulation in your favor by realizing you are being offered a discounted price!
Be pragmatic, and be patient. Your competition is never patient. They want to price to rise on their schedule, which was yesterday. They will be your best friends, because they have have fast hands and love to sell at the wrong time. If the price goes down, and nothing fundamental has changed with management, the project/s, and or results, there is your buying opportunity!!!
Very few investors/speculators are in this space, you don’t have much competition. The best way to beat your competition in this space, is not to follow the herd. Remember, no one get’s it right all the time, you just need to be better than your competition.
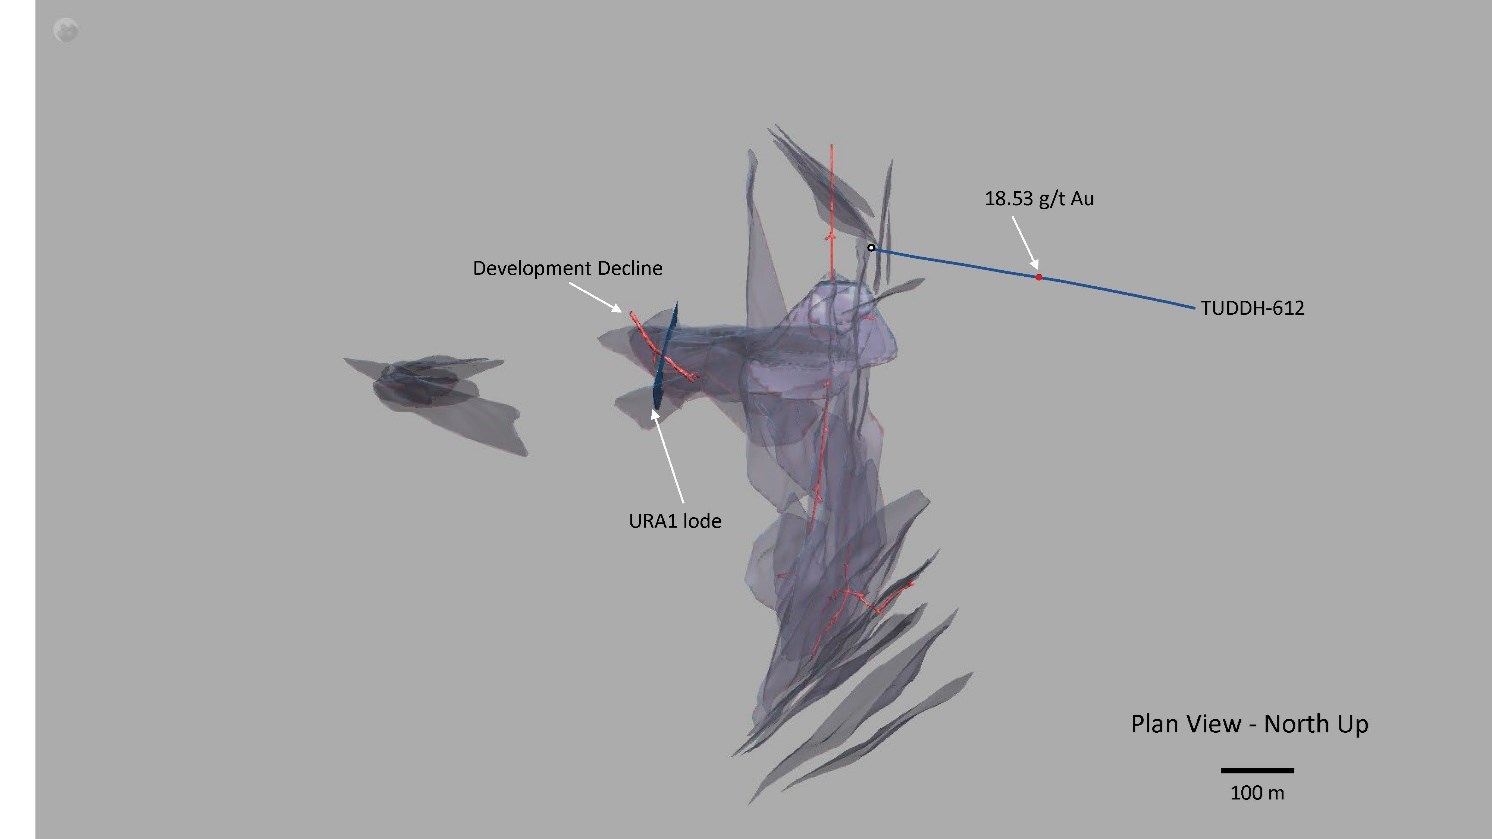
North Vancouver, British Columbia–(Newsfile Corp. – December 8, 2022) – Lion One Metals Limited (TSXV: LIO) (OTCQX: LOMLF) (ASX: LLO) (“Lion One” or the “Company”) provides results from near-mine exploration, identifying two new zones of significant mineralization within the footprint of the deposit. A new lode, named URA1 has been discovered during construction of the development decline; its location corresponds to Tuvatu’s near-surface and earliest scheduled production area: Zone 2. The lode has been further defined through underground channel sampling and subsequent diamond drilling. The URA1 lode will be included in the updated Mineral Resource Estimate (MRE) that the Company aims to release in early 2023. Additionally, several hundred meters to the east of Tuvatu, drillhole TUDDH-612 has intersected mineralization corresponding to a distinct CSAMT gradient anomaly. This release presents significant new results from two separate areas within the general Tuvatu deposit footprint (Figure 1).
Highlights URA1
Discovery of near-surface, high-grade URA1 lode from intersection with the development decline, defined through channel sampling (up to 29 g/t Au over 1m in MD-CH-002) and diamond drilling of holes TUDDH-617, 619, and 621 (up to 167.42g/t Au over 0.3m in TUDDH-617, and 27.99 g/t Au over 1.2m in TUDDH-621).
Provides increase in volume of mineralized material within the portion of the deposit scheduled for earliest production.
A general N-S orientation of the lode corresponds to other major lodes (e.g., URW1) and may indicate the presence of an additional series of undiscovered lodes further to the West of Tuvatu.
Underscores the substantial near-mine exploration upside.
Highlights TUDDH-612
New ore-grade mineralization of 18.53 g/t Au over 0.6m from 492m corresponding to a sharp CSAMT geophysical gradient anomaly.
May represent the possible strike extension of the UR4 lode at Tuvatu, that may also include the deep high-grade intercept in TUDDH-494 at >1100m depth.
Tuvatu itself is coincident with a CSAMT gradient of similar magnitude; the recurring correspondence of mineralization with such gradients provides strong validation for the viability of this method for discovery of additional mineralized centers in the caldera. Once completed, this data will provide robust drill targets and substantial projected upside for new discovery.
URA1 lode, Zone 2 During advancement of the 2022 development decline, approximately 75m from the portal entrance, a sharp, clearly defined quartz-sulfide lode was intersected striking NNE-SSW and dipping 84°SE (Figure 2a). This newly identified structure is defined through underground mapping and has control points in space from chip-channel sampling, (results: Table 1) and a three-hole DDH program (TUDDH-617, 619 and 621; Figure 2b) to test the extent of this new lode (results: Table 2). The lode is named URA1, and represents a completely new, previously unmapped structure occurring within the northwestern, near-surface portion of the Tuvatu deposit (Zone 2). The new occurrence discovered near-surface, in a portion of the Tuvatu orebody that is within the current resource estimation extents, illustrates the extraordinary upside potential of the Tuvatu orebody in general. Table 2 lists the interpreted lode for each of the mineralized intercepts in boreholes TUDDH-617, 619, and 621. It is notable that the high-grade intercepts near the bottom of hole TUDDH-617 between 140.1 and 144.6m remain undefined, potentially representing yet another new lode. Moreover, this illustrates the discovery potential of additional mineralization, especially toward the West Zone where relatively sparse drilling has been completed. Notably, this area is defined by historic drilling carried out at a N-S orientation, which would have limited the exposure of the drilling to mineralized lodes trending in the same orientation.
As the discovery and definition of new features continues to add upside, intersection with known lodes, like the Murau 8 lode, intersected with TUDDH-621 at 105.3m returning 4.8m at 30.75 g/t gold continues to provide confidence in the grade continuity of known lodes.
TUDDH-612 and CSAMT profile 6 As part of the Company’s ongoing near-mine exploration program, drillhole TUDDH-612 was completed to test the sharply defined CSAMT1 gradient anomaly on profile 6 (Figure 3). Drill hole TUDDH-612 intersected 18.53 g/t Au over 0.6m at 491.8m depth along the borehole.
As shown in Figure 1, this area is located several hundred meters from the current Tuvatu mineral resource outline. As such, the mineralization intersected at this location represents a new target zone of potential high-grade mineralization that warrants follow-up. Furthermore, the mineralized intercept in hole TUDDH-612 corresponds closely to the strike projection of the UR4 lode, along with the previously reported, deep intercept in TUDDH-494 of 12.2 g/t Au at a depth along the hole of 1106.3m (see April 8, 2022 news release). As such, these intercepts may indicate the extension of the UR4 lode toward the northeast and at depth, increasing LIO’s confidence that the mineralized structure has continuity over space for several hundred meters both to the east and at depth. This structure remains open along strike and up and down dip.
The mineralization observed (Figure 3) corresponds directly with a sharply defined CSAMT gradient anomaly, thus lending significant credence to the application of CSAMT for targeting new zones of potential mineralization. The infill CSAMT survey lines completed in 2022 to complement the previous 2019 survey, are currently in final phase of interpretation. The interpreted survey results will be the subject of a future release. It is expected that once finalized, the combined CSAMT geophysical data from previous and recent surveys will play a significant role in outlining new zones of mineralization near Tuvatu, as well as regionally throughout the Navilawa caldera. A third program of CSAMT geophysics will commence in 2023 and is expected to contribute to coverage of the Navilawa caldera within LIO’s most prospective areas of interest.
Table 1. Chip-channel results from sampling of the URA1 lode, development decline.
Channel ID
From m
To m
Width m
Composited Grade g/t Au
Cumulative g*m
MD-CH-001
0.0
2.5
2.5
9.94
24.86
MD-CH-002
0.0
1.0
1.0
29.02
29.02
MD-CH-003
1.0
3.0
2.0
8.91
17.83
MD-CH-004
1.5
3.0
1.5
11.93
17.89
MD-CH-005
1.0
2.5
1.5
15.17
22.75
MD-CH-006
0.0
3.0
3.0
5.62
16.87
MD-CH-011
0.0
2.5
2.5
10.46
26.15
Figure 1. Plan view of the Tuvatu deposit lodes (gray) showing the locations of the exploration and development declines (red), the new URA1 lode (blue) to the west, and TUDDH-612 borehole to the east. The dotted arrow indicates the possible strike extension of the UR4 lode.
Figure 2b. Oblique view (looking NE) of the URA1 lode (blue) showing the locations of the exploration and development declines (red), and the follow-up boreholes TUDDH-617, 619, and 621.
Figure 3. Oblique view showing the locations of borehole TUDDH-612 relative to the CSAMT profile 6, and the exploration and development declines. The location of the high-grade intercept in TUDDH-612 at 18.53 g/t Au is indicated by the red dot. Green dots represent values between 0.5 and 3.0 g/t Au.
Table 2. Results from URA1 drilling. The interpreted lode for each intercept is indicated.
Hole ID
From (m)
To (m)
Interval (m)
Au g/t
Lode
TUDDH-617
51.9
53.1
1.2
0.99
Murau 4
56.1
58.2
2.1
1.76
URA 1
including
57.9
58.2
0.3
6.30
URA 1
59.7
63.3
3.6
2.93
URA 1
including
59.7
60.0
0.3
17.01
URA 1
81.9
82.8
0.9
1.20
undefined
140.1
141.0
0.9
56.22
undefined
including
140.7
141.0
0.3
167.42
undefined
143.4
144.6
1.2
19.27
undefined
TUDDH-619
29.3
32.6
3.3
1.82
Murau 4
41.3
42.5
1.2
0.52
undefined
47.6
48.8
1.2
2.79
Murau 5
50.6
51.2
0.6
5.03
Murau 5
including
50.9
51.2
0.3
8.26
Murau 5
52.4
52.7
0.3
0.66
Murau 5
65.0
65.3
0.3
3.48
URA 1
72.2
73.7
1.5
2.78
Murau 7
including
73.4
73.7
0.3
9.66
Murau 7
148.1
148.7
0.6
0.59
Murau 12
TUDDH-621
77.7
80.1
2.4
6.03
Murau 6
including
78.3
78.6
0.3
43.13
Murau 6
81.3
83.4
2.1
2.68
Murau 7
including
82.8
83.4
0.6
5.26
Murau 7
84.6
87.6
3.0
2.24
Murau 7
including
86.7
87.3
0.6
7.37
Murau 7
105.3
110.1
4.8
30.75
Murau 8
including
105.3
105.9
0.6
54.31
Murau 8
and
105.9
106.5
0.6
8.10
Murau 8
and
106.5
107.4
0.9
56.17
Murau 8
and
107.4
108.3
0.9
46.55
Murau 8
and
108.3
108.6
0.3
11.39
Murau 8
and
108.6
108.9
0.3
13.49
Murau 8
and
108.9
110.1
1.2
8.56
Murau 8
123.6
124.2
0.6
2.62
Murau 10
156.0
157.2
1.2
0.81
Murau 11
159.3
160.5
1.2
27.99
URA 1
168.0
170.4
2.4
17.06
Murau 12
including
168.0
169.2
1.2
8.62
Murau 12
and
169.2
170.4
1.2
25.51
Murau 12
Table 3. Survey details of diamond drill holes referenced in this release.
Hole No
Coordinates (Fiji map grid)
RL
final depth
dip
azimuth
N
E
m
m
Deg.
(TN)
TUDDH-612
3920929.1
1876512.6
236.3
905.8
-60
097
TUDDH-617
3920800.6
1876257.3
203.1
149.9
-60
266
TUDDH-619
3920801.2
1876257.7
203.2
161.1
-60
297
TUDDH-621
3920799.9
1876257.7
203.0
200.7
-69
225
About Tuvatu The Tuvatu Alkaline Gold Project is located on the island of Viti Levu in Fiji. The January 2018 mineral resource for Tuvatu as disclosed in the technical report “Technical Report and Preliminary Economic Assessment for the Tuvatu Gold Project, Republic of Fiji”, dated September 25, 2020, and prepared by Mining Associates Pty Ltd of Brisbane Qld, comprises 1,007,000 tonnes indicated at 8.50 g/t Au (274,600 oz. Au) and 1,325,000 tonnes inferred at 9.0 g/t Au (384,000 oz. Au) at a cut-off grade of 3.0 g/t Au. The technical report is available on the Lion One website at www.liononemetals.com and on the SEDAR website at www.sedar.com.
Qualified Person In accordance with National Instrument 43-101 – Standards of Disclosure for Mineral Projects (“NI 43- 101”), Sergio Cattalani, P.Geo, Senior Vice President Exploration, is the Qualified Person for the Company and has reviewed and is responsible for the technical and scientific content of this news release.
QAQC Procedures Lion One adheres to rigorous QAQC procedures above and beyond basic regulatory guidelines in conducting its sampling, drilling, testing, and analyses. The Company utilizes its own fleet of diamond drill rigs, using PQ, HQ and NQ sized drill core rods. Drill core is logged and split by Lion One personnel on site. Samples are delivered to and analyzed at the Company’s geochemical and metallurgical laboratory in Fiji. Duplicates of all samples with grades above 0.5 g/t Au are both re-assayed at Lion One’s lab and delivered to ALS Global Laboratories in Australia (ALS) for check assay determinations. All samples for all high-grade intercepts are sent to ALS for check assays. All samples are pulverized to 80% passing through 75 microns. Gold analysis is carried out using fire assay with an AA finish. Samples that have returned grades greater than 10.00 g/t Au are then re-analyzed by gravimetric method. For samples that return greater than 0.50 g/t Au, repeat fire assay runs are carried out and repeated until a result is obtained that is within 10% of the original fire assay run. Lion One’s laboratory can also assay for a range of 71 other elements through Inductively Coupled Plasma Optical Emission Spectrometry (ICP-OES), but currently focuses on a suite of 9 important pathfinder elements. All duplicate anomalous samples are sent to ALS labs in Townsville QLD and are analyzed by the same methods (Au-AA26, and Au-GRA22 where applicable). ALS also analyses 33 pathfinder elements by HF-HNO3-HClO4 acid digestion, HCl leach and ICP-AES (method ME-ICP61).
About Lion One Metals Limited Lion One’s flagship asset is 100% owned, fully permitted high grade Tuvatu Alkaline Gold Project, located on the island of Viti Levu in Fiji. Lion One envisions a low-cost high-grade underground gold mining operation at Tuvatu coupled with exciting exploration upside inside its tenements covering the entire Navilawa Caldera, an underexplored yet highly prospective 7km diameter alkaline gold system. Lion One’s CEO Walter Berukoff leads an experienced team of explorers and mine builders and has owned or operated over 20 mines in 7 countries. As the founder and former CEO of Miramar Mines, Northern Orion, and La Mancha Resources, Walter is credited with building over $3 billion of value for shareholders.
On behalf of the Board of Directors of Lion One Metals Limited “Walter Berukoff“, Chairman and CEO
Neither the TSX Venture Exchange nor its Regulation Service Provider accepts responsibility for the adequacy or accuracy of this release
This press release may contain statements that may be deemed to be “forward-looking statements” within the meaning of applicable Canadian securities legislation. All statements, other than statements of historical fact, included herein are forward-looking information. Generally, forward-looking information may be identified by the use of forward-looking terminology such as “plans”, “expects” or “does not expect”, “proposed”, “is expected”, “budget”, “scheduled”, “estimates”, “forecasts”, “intends”, “anticipates” or “does not anticipate”, or “believes”, or variations of such words and phrases, or by the use of words or phrases which state that certain actions, events or results may, could, would, or might occur or be achieved. This forward-looking information reflects Lion One Metals Limited’s current beliefs and is based on information currently available to Lion One Metals Limited and on assumptions Lion One Metals Limited believes are reasonable. These assumptions include, but are not limited to, the actual results of exploration projects being equivalent to or better than estimated results in technical reports, assessment reports, and other geological reports or prior exploration results. Forward-looking information is subject to known and unknown risks, uncertainties and other factors that may cause the actual results, level of activity, performance or achievements of Lion One Metals Limited or its subsidiaries to be materially different from those expressed or implied by such forward-looking information. Such risks and other factors may include, but are not limited to: the stage development of Lion One Metals Limited, general business, economic, competitive, political and social uncertainties; the actual results of current research and development or operational activities; competition; uncertainty as to patent applications and intellectual property rights; product liability and lack of insurance; delay or failure to receive board or regulatory approvals; changes in legislation, including environmental legislation, affecting mining, timing and availability of external financing on acceptable terms; not realizing on the potential benefits of technology; conclusions of economic evaluations; and lack of qualified, skilled labour or loss of key individuals. Although Lion One Metals Limited has attempted to identify important factors that could cause actual results to differ materially from those contained in forward-looking information, there may be other factors that cause results not to be as anticipated, estimated or intended. Accordingly, readers should not place undue reliance on forward-looking information. Lion One Metals Limited does not undertake to update any forward-looking information, except in accordance with applicable securities laws.
1 CSAMT = Controlled Source Audio Magneto-Tellurics – a ground based geophysical technique that maps 3D electrical resistivity contrasts, inferred to be structural, lithological or hydrothermal-alteration related.
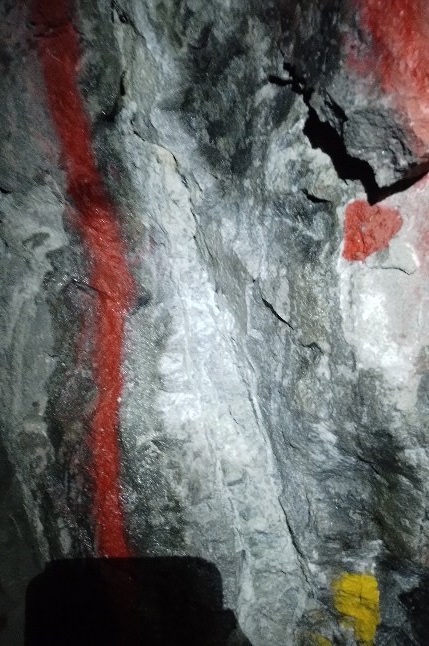
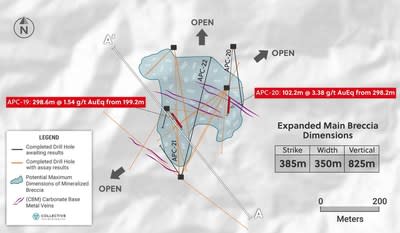
Drill hole APC-20 was drilled on the north-eastern side of the Main Breccia discovery at the Apollo target into an open area without any prior drilling and intersected a broad zone of mineralization with an abundance of gold-rich, carbonate base metal veins overprinting angular, gold-silver-copper bearing breccia. This intercept represents the highest-grade intersection over 100 metres drilled to date at Apollo with results as follows:
Drill hole APC-19 was drilled in the centre of the system in order to expand the vertical dimension in this location. The hole intercepted a broad and continuous zone of copper-silver-gold mineralization and includes a copper-rich subzone with results including:
Based on a newly revised model of the Main Breccia system, the Company has identified two high-grade subzones of mineralization and as a result, will be drill tested in 2023 and are outlined as follows:
Three rigs continue to drill at Apollo with holes APC-22 through APC-27 completed and holes APC-28 through APC-30 underway. Additional assay results are anticipated in the near term.
TORONTO, Dec. 7, 2022 /CNW/ – Collective Mining Ltd. (TSXV: CNL) (OTCQX: CNLMF) (“Collective” or the “Company”) is pleased to announce assay results from three additional holes drilled at the Apollo target (“Apollo”) within the Company’s Guayabales project located in Caldas, Colombia. The Main Breccia discovery at Apollo is a high-grade, bulk tonnage copper-gold-silver porphyry-related breccia system. As part of its fully funded 23,000 metre drill program for 2022, there are currently three diamond drill rigs operating at the Apollo target.
Executive Chairman, Ari Sussman stated: “Drilling into the Main Breccia system at the Apollo target continues to expand the total volume while delivering long and high-grade intercepts. The discovery of the two new high-grade subzones through detailed geological modelling is exciting as both the copper rich zone and the gold rich zone appear to be open for expansion in multiple directions. Additionally, we believe that the two subzones will coalesce within the system, thereby enhancing the potential for the discovery of even higher grades than we have discovered to date. These areas will be a key target for drilling in early 2023. Without question there is a lot more metal to be found at the Apollo target and we will remain aggressive in unlocking the potential of this remarkable discovery.”
To watch a short video of David Reading, Special Advisor to Collective Mining, speak about the assay results announced today, please click here
Details (See Table 1 and Figures 1–4)
Twenty-two diamond drill holes with accompanying assay results have now been announced at Apollo and a further nine holes are outstanding. Results of three drill holes are announced below:
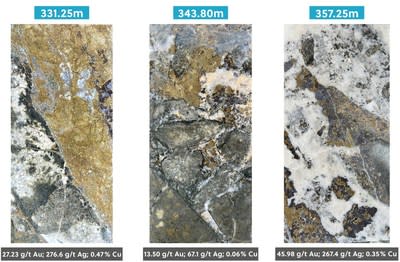
Drill hole APC-20 was drilled south from pad 5 to a maximum depth of 445.4 metres and successfully expanded the eastern area of the Main Breccia system at depth. The hole intersected 102.2 metres of continuous gold-silver-copper mineralization beginning at 298.2 metres down hole and ending at 400.40 metres. The hole is characterized by mineralized angular porphyry related breccia with a matrix infill of pyrite, some chalcopyrite and carbonate which is overprinted by zones of sheeted carbonate base metal veins (“CBM”) and veinlets which are associated with disseminated sphalerite and carry higher gold grades. These higher grade CBM zones can now be traced and mapped in multiple drill holes and three have been identified with drilling to date; within the lower, upper and central portions of the main breccia body The following results are highlighted:
102.20 metres @ 3.38 g/t AuEq consisting of 2.72 g/t Au, 28 g/t Ag, 0.08% Cu and includes a higher-grade zone of 33.60 metres @ 7.30 g/t AuEq.
Drill hole APC-19 was drilled in a southeast direction from pad 4 to a maximum depth of 582.3 metres. The hole intersected continuous copper-silver-gold mineralization from 199.20 metres (178m vertical) to 497.80 metres (470 metres vertical). The mineralized breccia contains a matrix of abundant chalcopyrite and some pyrite particularly from the beginning of the hole down to 323.50 metres which is associated with higher silver values and averaged 0.63% copper and 64 g/t silver over this interval. This newly identified shallow plunging high-grade copper zone has been intersected in six of the holes drilled to date and future drilling will target extensions of this zone within the main breccia body. Assay results for APC-19 are as follows:
298.60 metres @ 1.54 g/t AuEq consisting of 0.48 g/t Au, 34 g/t Ag and 0.31% Cu and includes 124.30 metres 2.72 g/t AuEq consisting of 0.62 g/t Au, 64 g/t Ag and 0.63% Cu.
Hole APC-21 was drilled at a steep angle towards the north from pad 3 but unfortunately undercut the northerly dipping main breccia body.
With the recently announced assay results for APC-17 and previously announced visuals from APC-22, the potential total volume of rock hosting the Main Breccia discovery within it has approximately tripled in size with the dimensions now measuring 385 metres along strike by 350 metres width by 825 metres. The discovery remains wide open for expansion and further step-out holes are currently being designed.
Three rigs continue to drill at Apollo with additional assay results from holes APC-22 through APC-30 anticipated in the near term.
The Apollo target area, as defined to date by surface mapping, rock sampling and copper and molybdenum soil geochemistry, covers an 800 metres X 700 metres area. The Apollo target area hosts the Company’s new Main Breccia discovery plus a vein system located above and on the eastern flank of the Main Breccia discovery and the Northern Breccia discovery located 250 metres to the north of the Main Breccia. Multiple additional untested breccia, porphyry and vein targets have been generated and will be drilled in due course. The overall Apollo target area also remains open for further expansion.
Table 1: Apollo Target Assays Results
Hole #
From (m)
To (m)
Intercept (m)
Au (g/t)
Ag (g/t)
Cu %
Mo %
Zn %
Pb %
AuEq (g/t) *
CuEq (%) *
APC-19
199.20
497.80
298.60
0.48
34
0.31
0.002
–
–
1.54
0.79
Incl.
199.20
323.50
124.30
0.62
64
0.63
0.002
–
–
2.72
1.39
APC-20**
298.20
400.40
102.20
2.72
28
0.08
0.001
0.21
0.15
3.38
–
Incl.
324.25
357.85
33.60
6.30
45
0.08
0.001
0.42
0.33
7.30
–
APC-21
No Significant Values
*AuEq (g/t) is calculated as follows: (Au (g/t) x 0.95) + (Ag g/t x 0.016 x 0.95) + (Cu (%) x 1.96 x 0.95)+ (Mo (%)*7.35 x 0.95) and CuEq (%) is calculated as follows: (Cu (%) x 0.95) + (Au (g/t) x 0.51 x 0.95) + (Ag (g/t) x 0.01 x 0.95)+ (Mo(%)x 3.75 x 0.95) utilizing metal prices of Cu – US$4.00/lb, Ag – $22/oz Mo US$15.00/lb and Au – US$1,400/oz and recovery rates of 95% for Au, Ag, Mo and Cu. Recovery rate assumptions are speculative as no metallurgical work has been completed to date.
** In APC-20, Zn and Pb were including for the AuEq calculation using metal prices of Zn – US$1.75/lb, Pb – $0.95/lb and recovery rates of 95%.
*** A 0.2 g/t AuEq cut-off grade was employed with no more than 15% internal dilution. True widths are unknown, and grades are uncut.
Figure 1: Plan View of the Main Breccia discovery at Apollo Highlighting New Drill Holes APC19 & APC-20 and the Dimensions of the Discovery (CNW Group/Collective Mining Ltd.)
Figure 2: Plan View of the Guayabales Project Highlighting the Apollo Target (CNW Group/Collective Mining Ltd.)
Figure 3: Apollo Target: Main Breccia Cross Section with Core Photo Highlights from APC-19 (CNW Group/Collective Mining Ltd.)
Figure 4: Apollo Target: Core Photo Highlights from APC-20 (CNW Group/Collective Mining Ltd.)
About Collective Mining Ltd.
To see our latest corporate presentation and related information, please visit www.collectivemining.com
Founded by the team that developed and sold Continental Gold Inc. to Zijin Mining for approximately $2 billion in enterprise value, Collective Mining is a copper, silver and gold exploration company based in Canada, with projects in Caldas, Colombia. The Company has options to acquire 100% interests in two projects located directly within an established mining camp with ten fully permitted and operating mines.
The Company’s flagship project, Guayabales, is anchored by the Apollo target, which hosts the large-scale, bulk-tonnage and high-grade copper, silver and gold Main Breccia discovery. The Company’s near-term objective is to continue with expansion drilling of the Main Breccia discovery while increasing confidence in the highest-grade portions of the system.
Management, insiders and close family and friends own nearly 35% of the outstanding shares of the Company and as a result, are fully aligned with shareholders. The Company is listed on the TSXV under the trading symbol “CNL” and on the OTCQX under the trading symbol “CNLMF”.
Qualified Person (QP) and NI43-101 Disclosure
David J Reading is the designated Qualified Person for this news release within the meaning of National Instrument 43-101 (“NI 43-101”) and has reviewed and verified that the technical information contained herein is accurate and approves of the written disclosure of same. Mr. Reading has an MSc in Economic Geology and is a Fellow of the Institute of Materials, Minerals and Mining and of the Society of Economic Geology (SEG).
Technical Information
Rock and core samples have been prepared and analyzed at SGS laboratory facilities in Medellin, Colombia and Lima, Peru. Blanks, duplicates, and certified reference standards are inserted into the sample stream to monitor laboratory performance. Crush rejects and pulps are kept and stored in a secured storage facility for future assay verification. No capping has been applied to sample composites. The Company utilizes a rigorous, industry-standard QA/QC program.
FORWARD-LOOKING STATEMENTS
This news release contains certain forward-looking statements, including, but not limited to, statements about the drill programs, including timing of results, and Collective’s future and intentions. Wherever possible, words such as “may”, “will”, “should”, “could”, “expect”, “plan”, “intend”, “anticipate”, “believe”, “estimate”, “predict” or “potential” or the negative or other variations of these words, or similar words or phrases, have been used to identify these forward-looking statements. These statements reflect management’s current beliefs and are based on information currently available to management as at the date hereof.
Forward-looking statements involve significant risk, uncertainties, and assumptions. Many factors could cause actual results, performance, or achievements to differ materially from the results discussed or implied in the forward-looking statements. These factors should be considered carefully, and readers should not place undue reliance on the forward-looking statements. Although the forward-looking statements contained in this news release are based upon what management believes to be reasonable assumptions, Collective cannot assure readers that actual results will be consistent with these forward-looking statements. These forward-looking statements are made as of the date of this news release, and Collective assumes no obligation to update or revise them to reflect new events or circumstances, except as required by law.
Neither the TSXV nor its Regulation Services Provider (as that term is defined in the policies of the TSXV) accepts responsibility for the adequacy or accuracy of this news release.
VANCOUVER, British Columbia, Dec. 05, 2022 (GLOBE NEWSWIRE) — Rover Metals Corp. (TSXV: ROVR) (OTCQB: ROVMF) (FSE:4XO) (“Rover” or the “Company”) is pleased to provide a corporate update to shareholders and to share its most recent analyst report from Fundamental Research.
Corporate Update Click here for a pre-recorded corporate update between Judson Culter, CEO at Rover, and U.S. stock-commodity TV journalist personality, Maurice Jackson, of Proven and Probable.
Analyst Report Fundamental Research Corp. (“FRC”) has published their updated analyst report on Rover, including a positive rating, dated December 1, 2022. The report can be accessed here.
FRC is one of the largest issuer-paid independent stock market research firms in the world, with a 19-year track record of covering 650+ companies. As of November 28, 2022, FRC’s top picks were up 41% on average since the initiation of coverage*. FRC provides fee-based coverage. Their analysts are sought after by the media and at conferences to give their opinions on the market, current topics of interest such as the direction of commodity prices, and top stock picks.
*Past performance is not indicative of future performance.
Judson Culter, CEO at Rover Metals, states “we are developing a lithium mining project in Nevada that has the potential to help fill-in the major supply shortage coming for lithium beginning in H2-2026*. Development of critical mineral projects here in North America is a matter of national security. Mining stocks and the mining sector need to get a second look from domestic investors right now given the global geopolitical climate we’re living in. We welcome due diligence calls on our mining resource development projects. Companies like Rover are subject to naked-short selling and potential malicious trading practises that can be orchestrated by hostile foreign regimes. Rover relies on the support of domestic investors to help sustain uninterrupted development of its resource projects. China’s battery companies are targeting Europe and are forecasted to account for approximately 30% of Europe’s battery production by 2030*.”
*Source: Benchmark Mineral Intelligence, U.K.
New Office Phone Number Our main office number has recently changed to +1-778-754-2855.
U.S. Trading Ticker The Company now trades under the ticker ROVMF on the OTCQB.
About Rover Metals Rover is a publicly traded junior mining company that trades on the TSXV under symbol ROVR, on the OTCQB under symbol ROVMF, and on the FSE under symbol 4XO. Rover is currently focussed on the development of a claystone lithium project in southwest Nevada, USA. Plans for 2023 include a 1,200-meter reverse circulation drill program at the Let’s Go Lithium project.
The Company has a diverse portfolio of mining resource development projects with varying exploration timelines. Its critical mineral projects include lithium, zinc, and copper. Its precious metals projects include gold and silver. The Company is exclusive to the mining jurisdictions of Canada and the U.S.
ON BEHALF OF THE BOARD OF DIRECTORS “Judson Culter” Chief Executive Officer and Director
For further information, please contact: Email: info@rovermetals.com Phone: +1 (778) 754-2855
Statement Regarding Forward-Looking Information This news release contains statements that constitute “forward-looking statements.” Such forward-looking statements involve known and unknown risks, uncertainties and other factors that may cause Rover’s actual results, performance or achievements, or developments in the industry to differ materially from the anticipated results, performance or achievements expressed or implied by such forward-looking statements. Forward-looking statements are statements that are not historical facts and are generally, but not always, identified by the words “expects,” “plans,” “anticipates,” “believes,” “intends,” “estimates,” “projects,” “potential” and similar expressions, or that events or conditions “will,” “would,” “may,” “could” or “should” occur. There can be no assurance that such statements prove to be accurate. Actual results and future events could differ materially from those anticipated in such statements, and readers are cautioned not to place undue reliance on these forward-looking statements. Any factor could cause actual results to differ materially from Rover’s expectations. Rover undertakes no obligation to update these forward-looking statements in the event that management’s beliefs, estimates or opinions, or other factors, should change.
THE FORWARD-LOOKING INFORMATION CONTAINED IN THIS NEWS RELEASE REPRESENTS THE EXPECTATIONS OF THE COMPANY AS OF THE DATE OF THIS NEWS RELEASE AND, ACCORDINGLY, IS SUBJECT TO CHANGE AFTER SUCH DATE. READERS SHOULD NOT PLACE UNDUE IMPORTANCE ON FORWARD-LOOKING INFORMATION AND SHOULD NOT RELY UPON THIS INFORMATION AS OF ANY OTHER DATE. WHILE THE COMPANY MAY ELECT TO, IT DOES NOT UNDERTAKE TO UPDATE THIS INFORMATION AT ANY PARTICULAR TIME EXCEPT AS REQUIRED IN ACCORDANCE WITH APPLICABLE LAWS.
NEITHER THE TSX VENTURE EXCHANGE NOR ITS REGULATION PROVIDER (AS THAT TERM IS DEFINED IN THE POLICIES OF THE TSX VENTURE EXCHANGE) ACCEPTS RESPONSIBILITY FOR THE ADEQUACY OF THIS RELEASE.
Vancouver, British Columbia–(Newsfile Corp. – November 30, 2022) – Riverside Resources Inc. (TSXV: RRI) (OTCQB: RVSDF) (FSE: 5YY) (“Riverside” or the “Company”), is pleased to report it has signed a definitive sale and royalty agreement with Minera Fresnillo, S.A. de C.V. (“Fresnillo”) a wholly owned subsidiary of Fresnillo PLC for the sale of Riverside’s Tajitos Gold Project (“Tajitos”) located in Sonora, Mexico. Riverside will receive a US$2,500,000 cash payment and retain a 2.0% NSR (“Royalty”).
The Tajitos Gold Project is located less than 30 kilometers from Fresnillo’s Noche Buena mining operations. Riverside’s Tajitos Gold Project includes the Tejo and Tajitos mineral concessions covering 45 km² of prospective ground next to Fresnillo’s property (also named Tajitos).
Riverside’s President and CEO, John-Mark Staude, stated: “This transaction adds another quality NSR to our growing royalty portfolio and brings our cash position to more than C$8,000,000, which puts us in a great position to grow our business during 2023-2024. We are pleased to deliver another deal with a high caliber international mining company, which is a testament to the quality of projects our team has generated and Riverside maintains in our property portfolio.”
Transaction Details:
Riverside will receive a payment of US$2,500,000 from Fresnillo and retain a 2.0% NSR. Fresnillo will have, for a four-year term, the option to buy back half of the 2.0% NSR for a payment of US$1.5M. If enacted, then Fresnillo would have an additional three years to buy back the remining 1% NSR for another US$1.5M. If Fresnillo does not exercise its first buy back option during the first four-year term, the Royalty will no longer be subject to any buy back provisions. The NSR covers the entire Riverside land package and a full NSR Agreement has been agreed upon and included in the signed contract between the companies. If Fresnillo wishes to reduce mineral claims, then the Company has the first right to retain those mineral tenures before they are dropped.
Riverside remains focused on its 100% owned projects, within its portfolio in Canada and Mexico, and its alliance with BHP. The Company is also always working towards potential incoming additional alliances and partnerships.
About Riverside Resources Inc.:
Riverside is a well-funded exploration company driven by value generation and discovery. The Company has over $8M in cash, no debt and less than 80M shares outstanding with a strong portfolio of gold-silver and copper assets and royalties in North America. Riverside has extensive experience and knowledge operating in Mexico and Canada and leverages its large database to generate a portfolio of prospective mineral properties. In addition to Riverside’s own exploration spending, the Company also strives to diversify risk by securing joint-venture and spin-out partnerships to advance multiple assets simultaneously and create more chances for discovery. Riverside has properties available for option, with information available on the Company’s website at www.rivres.com.
ON BEHALF OF RIVERSIDE RESOURCES INC.
“John-Mark Staude”
Dr. John-Mark Staude, President & CEO
For additional information contact:
John-Mark Staude President, CEO Riverside Resources Inc. info@rivres.com Phone: (778) 327-6671 Fax: (778) 327-6675 Web: www.rivres.com
Certain statements in this press release may be considered forward-looking information. These statements can be identified by the use of forward-looking terminology (e.g., “expect”,” estimates”, “intends”, “anticipates”, “believes”, “plans”). Such information involves known and unknown risks — including the availability of funds, the results of financing and exploration activities, the interpretation of exploration results and other geological data, or unanticipated costs and expenses and other risks identified by Riverside in its public securities filings that may cause actual events to differ materially from current expectations. Readers are cautioned not to place undue reliance on these forward-looking statements, which speak only as of the date of this press release.
Neither the TSX Venture Exchange nor its Regulation Services Provider (as that term is defined in the policies of the TSX Venture Exchange) accepts responsibility for the adequacy or accuracy of this release.