Portion of Sample 853601 showing visible gold grains in quartz and country rock.
Figure 2.
Location map of Kingsway gold occurrences showing recent results at Golden Glove.
TORONTO, Aug. 23, 2022 (GLOBE NEWSWIRE) — Labrador Gold Corp. (TSX.V:LAB | OTCQX:NKOSF | FNR: 2N6) (“LabGold” or the “Company”) is pleased to announce assays from six samples containing visible gold recently collected during prospecting in the Golden Glove area at its 100% owned Kingsway Project. The samples were collected as part of the Company’s continuous efforts to generate and upgrade targets for drilling along the 12km strike length of the Appleton Fault Zone covered by the Kingsway Property.
The samples were taken from quartz veins believed to be splays off the original Golden Glove vein. Assays of the six samples ranged from 7.51 g/t to 479.51 g/t Au. The quartz veins are hosted by grey and black shales and are typically vuggy and locally stylolitic with iron carbonate alteration. The four highest grade samples contain visible gold, and all samples contain between 2 and 5% pyrite and arsenopyrite both in the vein and along the contact with the shale wallrock. These results are comparable to assays from the initial samples taken at Golden Glove that ranged from 2.99 to 338.08g/t Au (see news release dated September 21, 2021).
“The discovery of more veins containing high-grade gold at surface is encouraging as it gives us additional information on the structural context of the mineralization at Golden Glove and will allow more efficient drill targeting.” said Roger Moss, President and CEO. “Drilling to date has been following up recent high-grade intersections of 20.07 g/t Au over 1m in Hole K-22-154 and 6.22 g/t Au over 4m in hole K-22-150 located approximately 160m south of the discovery outcrop. Given the high-grade nature of these veins we will certainly look to specifically target them in our ongoing drilling at Golden Glove.”
Sample ID
Sample type
Rock Type
Au (g/t)
853601*
Grab
Quartz Vein
479.51
853602*
Grab
Quartz Vein
81.49
853603*
Grab
Quartz Vein
114.72
853604*
Grab
Quartz Vein
34.90
853605
Grab
Quartz Vein
7.51
853606
Grab
Quartz Vein
12.25
* Sample contains visible gold. Note that grab samples are select samples and are not necessarily representative of gold mineralization found on the property.
All samples are securely stored prior to shipping to Eastern Analytical Laboratory in Springdale, Newfoundland for assay. Eastern Analytical is an ISO/IEC17025 accredited laboratory. Samples were assayed by metallic screen/fire assay. The whole sample is crushed to -10mesh and pulverized to 95% -150mesh. The total sample is then weighed and screened through 150mesh. Both the +150mesh fraction and a 30g subsample of the -150mesh fraction are fire assayed for Au and a calculated weighted average of total Au in the sample is reported. The company routinely submits blanks and certified reference standards at a rate of approximately 5% of the total samples in each batch.
Qualified Person
Roger Moss, PhD., P.Geo., President and CEO of LabGold, a Qualified Person in accordance with Canadian regulatory requirements as set out in NI 43-101, has read and approved the scientific and technical information that forms the basis for the disclosure contained in this release.
The Company gratefully acknowledges the Newfoundland and Labrador Ministry of Natural Resources’ Junior Exploration Assistance (JEA) Program for its financial support for exploration of the Kingsway property.
About Labrador Gold Labrador Gold is a Canadian based mineral exploration company focused on the acquisition and exploration of prospective gold projects in Eastern Canada.
Labrador Gold’s flagship property is the 100% owned Kingsway project in the Gander area of Newfoundland. The three licenses comprising the Kingsway project cover approximately 12km of the Appleton Fault Zone which is associated with gold occurrences in the region, including those of New Found Gold immediately to the south of Kingsway. Infrastructure in the area is excellent located just 18km from the town of Gander with road access to the project, nearby electricity and abundant local water. LabGold is drilling a projected 100,000 metres targeting high-grade epizonal gold mineralization along the Appleton Fault Zone with encouraging results. The Company has approximately $25 million in working capital and is well funded to carry out the planned program.
The Hopedale property covers much of the Florence Lake greenstone belt that stretches over 60 km. The belt is typical of greenstone belts around the world but has been underexplored by comparison. Work to date by Labrador Gold show gold anomalies in rocks, soils and lake sediments over a 3 kilometre section of the northern portion of the Florence Lake greenstone belt in the vicinity of the known Thurber Dog gold showing where grab samples assayed up to 7.8g/t gold. In addition, anomalous gold in soil and lake sediment samples occur over approximately 40 km along the southern section of the greenstone belt (see news release dated January 25th 2018 for more details). Labrador Gold now controls approximately 40km strike length of the Florence Lake Greenstone Belt.
The Company has 169,189,979 common shares issued and outstanding and trades on the TSX Venture Exchange under the symbol LAB and on the OTCQX under the symbol NKOSF.
Neither TSX Venture Exchange nor its Regulation Services Provider (as that term is defined in policies of the TSX Venture Exchange) accepts responsibility for the adequacy or accuracy of this release.
Forward-Looking Statements: This news release contains forward-looking statements that involve risks and uncertainties, which may cause actual results to differ materially from the statements made. When used in this document, the words “may”, “would”, “could”, “will”, “intend”, “plan”, “anticipate”, “believe”, “estimate”, “expect” and similar expressions are intended to identify forward-looking statements. Such statements reflect our current views with respect to future events and are subject to risks and uncertainties. Many factors could cause our actual results to differ materially from the statements made, including those factors discussed in filings made by us with the Canadian securities regulatory authorities. Should one or more of these risks and uncertainties, such as actual results of current exploration programs, the general risks associated with the mining industry, the price of gold and other metals, currency and interest rate fluctuations, increased competition and general economic and market factors, occur or should assumptions underlying the forward looking statements prove incorrect, actual results may vary materially from those described herein as intended, planned, anticipated, or expected. We do not intend and do not assume any obligation to update these forward-looking statements, except as required by law. Shareholders are cautioned not to put undue reliance on such forward-looking statements.
Vancouver, British Columbia–(Newsfile Corp. – August 23, 2022) – Goldshore Resources Inc. (TSXV: GSHR) (OTCQB: GSHRF) (FSE: 8X00) (“Goldshore” or the “Company“), is pleased to announce assay results from previously unsampled historic drill core at the Moss Lake Project in Northwest Ontario, Canada (the “Moss Lake Gold Project”).
Goldshore’s team has retrieved historical core that remains on the Moss Lake Gold Project where the drill collars have been recovered and accurately surveyed. Prior operators selectively sampled core that fit with the model used at the time. This core is now being relogged and sampled by Goldshore. This presents an excellent, cost-effective opportunity for Goldshore to generate significant results without new drilling, particularly in those holes that coincide with Goldshore’s identified targets. This news release presents results from six such historical holes where sampling by prior operators was incomplete.
Highlights:
Sampling of unsampled sections of two historic drill holes at the QES Zone have increased the width and grade of gold mineralization over that previously reported. The expanded intercepts include:
104.2m @ 1.04 g/t Au from 422.0m in NS247, including
19.40m @ 2.66 g/t Au from 458.6m
This section includes the visible gold reported on April 19, 2022
The hole ended in mineralization
56.1m @ 0.42 g/t Au from 493.5m in NS248
Sampling has also identified a new southern parallel zone that was previously unrecognized, including:
9.30m @ 1.28 g/t Au from 244.6m depth, including
0.9m @ 10.95 g/t from 253.0m
0.9m @ 35.7 g/t Au from 271.65m and
78.45m @ 0.35 g/t Au from 331.55m in NS247
69.10m @ 0.49 g/t Au from 413.0m in NS248
Additional sampling of four drillholes assessing regional prospects confirmed initial results.
President and CEO Brett Richards stated: “All of the work we have conducted at Moss Lake, whether new drilling results or sampling and analysis of the historic drilling, all indicates that the extent of mineralization is far greater than the footprint of the historical resource. These results indicate yet another parallel zone of mineralization not previously identified and will provide new high quality drill targets in the future; as well as meaningful data when conducting the resource estimation.”
Technical Overview
Table 1 shows the significant intercepts. Table 2 and Figure 1 show the drill hole locations.
Figure 1: Drill plan showing the drill holes relative to the 2013 resource model and the new parallel zones
Intersections calculated above a 0.3 g/t Au cut off with a top cut of 30 g/t Au and a maximum internal waste interval of 10 metres. Shaded intervals are intersections calculated above a 1.0 g/t Au cut off. Intervals in bold are those with a grade thickness factor exceeding 20 gram x metres / tonne gold. True widths are approximate and assume a subvertical body. The fact that cut and uncut assays are the same, shows that all samples assayed less than the 30 g/t Au top cut.
Table 2: Location of drill holes in this press release
HOLE
EAST
NORTH
RL
AZIMUTH
DIP
EOH
ML-02-006
670011
5379164
429
155
-45°
318.91m
ML-04-016
671016
5378230
429
156°
-45°
300m
ML-04-017
671039
5377982
429
336
-45°
132m
ML-04-018
671050
5377959
429
336
-45°
171m
NS247
670352
5379453
434
336°
-69°
550m
NS248
669958
5379129
429
336°
-65°
647m
Approximate collar coordinates in NAD 83, Zone 15N
Results have been received for six historical holes that were incompletely sampled in the past and have now been more completely sampled to fully assess the intersected mineralized zones. Two holes (NS247 and NS248) targeted the QES Zone and four holes (ML-02-006, ML-04-016, ML-04-017, and ML-04-018) tested regional prospects south of the Moss Lake Project.
Assays from new sampling at NS247 and NS248 have expanded the widths of the known mineralized intercepts and identified a new parallel zone to the south of QES. They show that gold mineralization at Moss Lake is wider than previously believed and contains additional higher-grade structures beyond that defined by historic drilling. Step back drilling of the QES Zone has begun to determine the extent of the new parallel zones south of the QES Zone.
The broad zone of 104.2m @ 1.04 g/t Au from 422.0m in NS247 compares to an historic interval of 104.2m @ 0.88 g/t Au if the unsampled intervals are assigned zero grade, which seems to be what previous geologists thought. Similarly, the interval 56.1m @ 0.42 g/t Au from 493.5m in NS248 compares to an historic interval of 56.1m @ 0.31 g/t Au.
The high-grade section of NS247(19.40m @ 2.66 g/t Au from 458.6m) includes a narrow quartz-pyrite-chalcopyrite vein zone with visible gold that was reported on April 19, 2022. Surprisingly, this interval returned only 0.3m @ 1.01 g/t Au from 546.8m highlighting the nuggetty nature of gold mineralization. The drill hole ended in gold mineralization suggesting that the mineralized zone is wider.
Infill sampling of ML-04-016 and ML-04-018 yielded minor increases to the width of historic intercepts. No additional mineralized zones were identified in any of the four holes.
Several additional holes have been identified as having unsampled intervals within mineralized drill core. Historical core archives are being reexamined to locate, identify, and recover drill core for further infill sampling.
Pete Flindell, VP Exploration for Goldshore, said “These drill results confirm our contention that previous explorers did not assess the full scale of gold mineralization at Moss Lake. As such, Moss Lake holds significant potential to be a larger gold system. Our assessment of historic drill core will continue in parallel with our 100,000-meter drill program.”
Analytical and QA/QC Procedures
All samples were sent to ALS Geochemistry in Thunder Bay for preparation and analysis was performed in the ALS Vancouver analytical facility. ALS is accredited by the Standards Council of Canada (SCC) for the Accreditation of Mineral Analysis Testing Laboratories and CAN-P-4E ISO/IEC 17025. Samples were analyzed for gold via fire assay with an AA finish (“Au-AA23”) and 48 pathfinder elements via ICP-MS after four-acid digestion (“ME-MS61”). Samples that assayed over 10 ppm Au were re-run via fire assay with a gravimetric finish (“Au-GRA21”).
In addition to ALS quality assurance / quality control (“QA/QC”) protocols, Goldshore has implemented a quality control program for all samples collected through the drilling program. The quality control program was designed by a qualified and independent third party, with a focus on the quality of analytical results for gold. Analytical results are received, imported to our secure on-line database and evaluated to meet our established guidelines to ensure that all sample batches pass industry best practice for analytical quality control. Certified reference materials are considered acceptable if values returned are within three standard deviations of the certified value reported by the manufacture of the material. In addition to the certified reference material, certified blank material is included in the sample stream to monitor contamination during sample preparation. Blank material results are assessed based on the returned gold result being less than ten times the quoted lower detection limit of the analytical method. The results of the on-going analytical quality control program are evaluated and reported to Goldshore by Orix Geoscience Inc.
About Goldshore
Goldshore is an emerging junior gold development company, and owns the Moss Lake Gold Project located in Ontario. Wesdome is currently a large shareholder of Goldshore with an approximate 27% equity position in the Company. Well-financed and supported by an industry-leading management group, board of directors and advisory board, Goldshore is positioned to advance the Moss Lake Gold Project through the next stages of exploration and development.
About the Moss Lake Gold Project
The Moss Lake Gold Project is located approximately 100 km west of the city of Thunder Bay, Ontario. It is accessed via Highway 11 which passes within 1 km of the property boundary to the north. The Moss Lake Gold Project covers 14,292 hectares and consists of 282 unpatented and patented mining claims.
The Moss Lake Gold Project hosts a number of gold and base metal rich deposits including the Moss Lake Deposit, the East Coldstream Deposit (Table 3), the historically producing North Coldstream Mine (Table 4), and the Hamlin Zone, all of which occur over a mineralized trend exceeding 20 km in length. A historical preliminary economic assessment (the “Moss Lake Historical Estimate“) was completed on the Moss Lake Gold Project in 2013 and published by Moss Lake Gold Mines Ltd. (“Moss Lake Gold Mines“)1,3. A historical mineral resource estimate (the “East Coldstream Historical Estimate“) was completed on the East Coldstream Deposit in 2011 by Foundation Resources Inc.2,3 In addition to these zones, the Moss Lake Gold Project also hosts a number of under-explored mineral occurrences which are reported to exist both at surface and in historically drilled holes. The Moss Lake Deposit is a shear-hosted disseminated-style gold deposit which outcrops at surface. It has been drilled over a 2.5 km length and to depths of 300 m with 376 holes completed between 1983 and 2017. The last drilling program conducted in 2016 and 2017 by Wesdome Gold Mines Ltd. (“Wesdome“), which consisted of widely spaced holes along the strike extension of the deposit was successful in expanding the mineralized footprint and hydrothermal system 1.6 km to the northeast. Additionally, the deposit remains largely open to depth. In 2017, Wesdome completed an induced polarization survey which traced the potential extensions of pyrite mineralization associated with the Moss Lake Deposit over a total strike length of 8 km and spanning the entire extent of the survey grids.
The East Coldstream Deposit is a shear-hosted disseminated-style gold deposit which locally outcrops at surface. It has been drilled over a 1.3 km length and to depths of 200 m with 138 holes completed between 1988 and 2017. The deposit remains largely open at depth and may have the potential for expansion along strike. Historic drill hole highlights from the East Coldstream Deposit include 4.86 g/t Au over 27.3 m in C-10-15.
The historically producing North Coldstream Mine is reported to have produced significant amounts of copper, gold and silver4 from mineralization with potential iron-oxide-copper-gold deposit style affinity. The exploration potential immediately surrounding the historic mining area is not currently well understood and historic data compilation is required.
The Hamlin Zone is a significant occurrence of copper and gold mineralization, and also of potential iron-oxide-copper-gold deposit style affinity. Between 2008 and 2011, Glencore tested Hamlin with 24 drill holes which successfully outlined a broad and intermittently mineralized zone over a strike length of 900 m. Historic drill hole highlights from the Hamlin Zone include 0.9 g/t Au and 0.35% Cu over 150.7 m in HAM-11-75.
The Moss Lake, East Coldstream and North Coldstream deposits sit on a mineral trend marked by a regionally significant deformation zone locally referred to as the Wawiag Fault Zone in the area of the Moss Lake Deposit. This deformation zone occurs over a length of approximately 20 km on the Moss Lake Gold Project and there is an area spanning approximately 7 km between the Moss Lake and East Coldstream deposits that is significantly underexplored.
Table 3: Historical Mineral Resources1,2,3
INDICATED
INFERRED
Deposit
Tonnes
Au g/t
Au oz
Tonnes
Au g/t
Au oz
Moss Lake Historical Estimate
Open Pit Potential
39,795,000
1.1
1,377,300
48,904,000
1.0
1,616,300
Underground Potential
–
–
–
1,461,100
2.9
135,400
Moss Lake Total
39,795,000
1.1
1,377,300
50,364,000
1.1
1,751,600
East Coldstream Historical Estimate
East Coldstream Total
3,516,700
0.85
96,400
30,533,000
0.78
763,276
Combined Total
43,311,700
1.08
1,473,700
80,897,000
0.98
2,514,876
Notes:
(1) Source: Poirier, S., Patrick, G.A., Richard, P.L., and Palich, J. “Technical Report and Preliminary Economic Assessment for the Moss Lake Project”, prepared for Moss Lake Gold Mines Ltd. The qualified persons for the Moss Lake Historical Estimate are Pierre-Luc Richard, MSc, PGeo (InnovExplo Inc), and Carl Pelletier, BSc, PGeo (InnovExplo Inc), and the effective date of the Moss Lake Historical Estimate is February 8, 2013. In-Pit results are presented undiluted and in situ, within Whittle-optimized pit shells. Underground results are presented undiluted and in situ, outside Whittle-optimized pit shells. The Moss Lake Historical Estimate includes 18 gold-bearing zones and 1 envelope containing isolated gold intercepts. Whittle parameters: mining cost = C$2.28; pit slope angle = 50.0 degrees; production cost = C$9.55; mining Dilution = 5%; mining recovery = 95%; processing recovery = 80% to 85%; gold price = C$1,500. In-Pit and Underground resources were compiled at cut-off grades from 0.3 to 5.0 g/t Au (for sensitivity characterization). A cut-off grade of 0.5 g/t Au was selected as the official in-pit cut-off grade and a cut-off grade of 2.0 g/t Au was selected as the official underground cut-off grade. The Moss Lake Historical Estimate is based on 352 diamond drill holes (90,978 m) drilled from 1983 and 2008. A fixed density of 2.78 g/cm3 was used. A minimum true thickness of 5.0 m was applied, using the grade of the adjacent material when assayed or a value of zero when not assayed. Capping was established at 35 g/t Au, supported by statistical analysis and the high grade distribution within the deposit. Compositing was done on drill hole sections falling within the mineralized zone solids (composite = 1 m). Resources were evaluated from drill hole samples using the ID2 interpolation method in a multi-folder percent block model using Gems version 6.4. Based on geostatistics, the ellipse range for interpolation was 75m x 67.5m x 40m. The Indicated category is defined by combining the blocks within the two main zones and various statistical criteria, such as average distance to composites, distance to closest composite, quantity of drill holes within the search area. Ounce (troy) = metric tons x grade / 31.10348. Calculations used metric units (metres, tonnes and g/t). The number of metric tonnes was rounded to the nearest thousand. Any discrepancies in the totals are due to rounding effects; rounding followed the recommendations in NI 43-101.
(2) Source: McCracken, T. “Technical Report and Resource Estimate on the Osmani Gold Deposit, Coldstream Property, Northwestern Ontario”, prepared for Foundation Resources Inc. and Alto Ventures Ltd. The East Coldstream Historical Estimate is based on a 0.4 g/t Au cut-off grade. The qualified persons for the East Coldstream Historical Estimate are Todd McCracken, P.Geo. (Tetratech Wardrop), and Jeff Wilson, Ph.D., P.Geo. (Tetratech Wardrop), and the effective date of the East Coldstream Historical Estimate is December 12, 2011. Resources are presented unconstrained, undiluted and in situ. The East Coldstream Historical Estimate includes 2 gold-bearing zones. A cut-off grade of 0.4 g/t Au was selected as the official resource cut-off grade. The East Coldstream Historical Estimate is based on 116 diamond drill holes drilled from 1986 to 2011. A fixed density of 2.78 g/cm3 was used. Capping was established at 5.89 g/t Au and 5.70 g/t Au for domains EC-1 and EC-2, respectively. This is supported by statistical analysis and the high grade distribution within the deposit. Compositing was done on drill hole sections falling within the mineralized zone solids (composite = 1 m). Resources were evaluated from drill hole samples using the ID2 interpolation method in a multi-folder percent block model using Datamine Studio 3 version 3.20.5321.0. Recource categorization is based on spatial continuity based from the variography of the assays within the drillholes. Ounce (troy) = metric tons x grade / 31.10348. Calculations used metric units (metres, tonnes and g/t). The number of metric tonnes was rounded to the nearest thousand. Any discrepancies in the totals are due to rounding effects; rounding followed the recommendations in NI 43-101.
(3) The reader is cautioned that the Moss Lake Historical Estimate East and the East Coldstream Historical Estimate (the “Historical Estimates“) are considered historical in nature and as such is based on prior data and reports prepared by previous property owners. The reader is cautioned not to treat them, or any part of them, as current mineral resources or reserves. The Company has determined these historical resources are reliable, and relevant to be included here in that they demonstrate simply the mineral potential of the Moss Lake Gold Project. A qualified person has not done sufficient work to classify the Historical Estimates as current resources and Goldshore is not treating the Historical Estimates as current resources. Significant data compilation, re-drilling, re-sampling and data verification may be required by a qualified person before the Historical Estimates can be classified as a current resource. There can be no assurance that any of the historical mineral resources, in whole or in part, will ever become economically viable. In addition, mineral resources are not mineral reserves and do not have demonstrated economic viability. Even if classified as a current resource, there is no certainty as to whether further exploration will result in any inferred mineral resources being upgraded to an indicated or measured mineral resource category. The Historical Estimates relating to inferred mineral resources were calculated using prior mining industry standard definitions and practices for estimating mineral resource and mineral reserves. Such prior definitions and practices were utilized prior to the implementation of the current standards of the Canadian Institute of Mining for mineral resource estimation, and have a lower level of confidence.
Table 4: Reported Historical Production from the North Coldstream Deposit4
Deposit
Tonnes
Cu %
Au g/t
Ag
Cu lbs
Au oz
Ag oz
Historical Production
2,700,0000
1.89
0.56
5.59
102,000,000
44,000
440,000
Note::
(4) Source: Schlanka, R., 1969. Copper, Nickel, Lead and Zinc Deposits of Ontario, Mineral Resources Circular No. 12, Ontario Geological Survey, pp. 314-316.
Peter Flindell, P.Geo., MAusIMM, MAIG, Vice President – Exploration of the Company, a qualified person under NI 43-101 has approved the scientific and technical information contained in this news release.
Neither the TSXV nor its Regulation Services Provider (as that term is defined in the policies of the TSXV) accepts responsibility for the adequacy or accuracy of this release.
For More Information – Please Contact:
Brett A. Richards President, Chief Executive Officer and Director Goldshore Resources Inc.
This news release contains statements that constitute “forward-looking statements.” Such forward looking statements involve known and unknown risks, uncertainties and other factors that may cause the Company’s actual results, performance or achievements, or developments to differ materially from the anticipated results, performance or achievements expressed or implied by such forward-looking statements. Forward looking statements are statements that are not historical facts and are generally, but not always, identified by the words “expects,” “plans,” “anticipates,” “believes,” “intends,” “estimates,” “projects,” “potential” and similar expressions, or that events or conditions “will,” “would,” “may,” “could” or “should” occur.
Forward-looking statements in this news release include, among others, statements relating to expectations regarding the exploration and development of the Moss Lake Gold Project, and other statements that are not historical facts. By their nature, forward-looking statements involve known and unknown risks, uncertainties and other factors which may cause our actual results, performance or achievements, or other future events, to be materially different from any future results, performance or achievements expressed or implied by such forward-looking statements. Such factors and risks include, among others: the Company may require additional financing from time to time in order to continue its operations which may not be available when needed or on acceptable terms and conditions acceptable; compliance with extensive government regulation; domestic and foreign laws and regulations could adversely affect the Company’s business and results of operations; the stock markets have experienced volatility that often has been unrelated to the performance of companies and these fluctuations may adversely affect the price of the Company’s securities, regardless of its operating performance; and the impact of COVID-19.
The forward-looking information contained in this news release represents the expectations of the Company as of the date of this news release and, accordingly, is subject to change after such date. Readers should not place undue importance on forward-looking information and should not rely upon this information as of any other date. The Company undertakes no obligation to update these forward-looking statements in the event that management’s beliefs, estimates or opinions, or other factors, should change.
This news release does not constitute an offer to sell, or a solicitation of an offer to buy, any securities in the United States. The securities have not been and will not be registered under the United States Securities Act of 1933, as amended (the “U.S. Securities Act”) or any state securities laws and may not be offered or sold within the United States or to U.S. Persons unless registered under the U.S. Securities Act and applicable state securities laws or an exemption from such registration is available.
The current inflation of the United States is a concern to the whole world’s economy, and many believe that the scenario will only get worse. In order to contain the situation, the Fed is constantly raising interest rates. James Rickards, an economist and investment banker, believes that the interest rate could get as high as 5% in the near future. Also, the EUR/USD=x is currently at a five-year low and every time this ratio goes down, the interest rate goes up.
In opposition to a common belief that printing a lot of money equals high inflation, the government has been printing trillions of dollars in recent years even though the inflation never went further than 3%. The current inflationary type is the cost inflation. It occurs when prices rise due to increases in production costs such as wages and raw materials. In addition to this scenario, the employment rate went down to 59%.
One of the factors that have contributed to this crisis are the war sanctions against Russia. The biggest country in the world has negotiated more oil and natural gas at higher prices than before the Ukraine war, causing a slowdown in global production. Also, the BRICS is expecting Egypt, Saudi Arabia and Turkey to join their organization soon. They are working on an alternative reserve currency that would rival the IMF’s SD, the contingent Reserves Arrangement. Moreover, China is developing a new way to buy gold using the digital yuan, the Shanghai gold exchange.
Turkey also wants to ditch the dollar and start buying energy from Russia using other currencies. The same goes for India, which is now accepting rupees for payments and is activating a new shorter corridor to Russia, making it far easier to import and export.
All countries mentioned in the last two paragraphs, together with other 139 countries, are participating in the Belt and Road initiative. It is a strategy that seeks to connect Asia with Africa and Europe via land and maritime networks, looking forward to improving regional integration, increasing trade and stimulating economic growth.
If all this comes to fruition, 75% of the world’s population and 45% of the world’s GDP would be using another reserve currency, Saudi Arabia would open oil sales and all these countries would decrease their use of American dollars. With all these dollars coming back to the United States’ economy, hyperinflation would be a sure thing.
All these issues have contributed to the current recession and confirm that the world is creeping towards de-dollarisation.
As we have seen during other periods of high inflation in history, like the 1970s when it averaged 7% a year, assets with value, virtue, safety, and scarcity such as gold outperformed the stock market by a lot. The reason this metal is an excellent asset to protect your money from depreciation is because it has a positive correlation with inflation rates. In other words, the price of gold increases with inflation.
For example, from 1970 to 1974 inflation went as high as 12% a year. During that span of time, The Dow Industrial Average depreciated about 40% while gold went from $35/ounce to $180/ounce. As you can see gold is so valued that it joined the U.S. as the only tier #1 assets in the world.
Given all these facts, it is safe to say that the American dollar and the United States are losing their dominance over the world’s economy and gold is one of the best assets to protect your money from this scenario.
Text citations
● Kenton, W. (2022, March 27). Cost-push inflation. Investopedia. Retrieved July 27, 2022, from
● EBRD, E. B. for R. and D. (n.d.). Belt and road initiative (BRI). European Bank for Reconstruction and Development (EBRD). Retrieved July 29, 2022, from
● WANG, C. N. E. D. O. P. I. L. (n.d.). Countries of the belt and road initiative (BRI). Green Finance & Development Center. Retrieved July 29, 2022, from
KELOWNA, BC / ACCESSWIRE / July 29, 2022 / Diamcor Mining Inc. (TSXV.DMI / OTCQB-DMIFF / FRA-DC3A), (the “Company“) announces that due to ongoing delays in South Africa noted below, the Company will be unable to file its audited financial statements and corresponding management’s discussion and analysis for the year ended March 31, 2022 (collectively, the “Financial Disclosure“) on or before the prescribed filing deadline of July 29, 2022 as required by National Instrument 51-102 – Continuous Disclosure Obligations.
The Company’s mining operations are located in South Africa, which has been experiencing Stage 6 load-shedding (also known as rolling blackouts) this month by the state-owned electricity utility, Eskom. The reasons for the delay in filing include the inability to complete the South African portion of the Company’s annual audit in normal time frames as a result of ongoing delays relating to the power load-shedding implemented by Eskom, and the Canadian auditors’ inability to complete their audit due to reliance on the finalization of audit work in South Africa.
The Company is working with its auditors on the remaining items to allow for the audit of the financial statements for the year ended March 31, 2022 to be completed. The Company anticipates that it will be in a position to file its Financial Disclosure before August 31, 2022. The Company confirms that it will comply with the alternative information guidelines included in National Policy 12-203 – Management Cease Trade Orders, for so long as it remains in default of a specified requirement.
The Company has filed an application with the British Columbia Securities Commission and the Alberta Securities Commission requesting that they issue a management cease trade order against the Company’s Directors, Officers and Insiders instead of a cease trade order against the Company and all of its securityholders.
As has been widely reported, South Africa’s state-owned power supplier Eskom was forced to implement significant load-shedding measures over a period of several weeks. The load-shedding measures were varied depending on power reduction requirements, but resulted in power blackouts several times per day over a period of weeks. The frequency of these power blackouts limited the ability of the majority of businesses in South Africa to operate as normal, and resulted in various operational and administrative delays for the Company.https://embed.fireplace.yahoo.com/embed?ctrl=Monalixa&m_id=monalixa&m_mode=document&site=sports&os=android&pageContext=%257B%2522ctopid%2522%253A%25221542500%253B1577000%2522%252C%2522hashtag%2522%253A%25221542500%253B1577000%2522%252C%2522wiki_topics%2522%253A%2522South_Africa%253BTiffany_%2526_Co.%253BCompany%253BFinancial_statement%253BTSX_Venture_Exchange%253BFinancial_disclosure_of_public_servants%253BEskom%253BAlberta_Securities_Commission%2522%252C%2522lmsid%2522%253A%2522a077000000LnOyOAAV%2522%252C%2522revsp%2522%253A%2522accesswire.ca%2522%252C%2522lpstaid%2522%253A%25227fe2adb3-eb6e-3a3b-b496-4fe5d107cf3c%2522%252C%2522pageContentType%2522%253A%2522story%2522%257D
About Diamcor Mining Inc.
Diamcor Mining Inc. is a fully reporting publicly traded junior diamond mining company which is listed on the TSX Venture Exchange under the symbol V.DMI, and on the OTC QB International under the symbol DMIFF. The Company has a well-established operational and production history in South Africa and extensive prior experience supplying rough diamonds to the world market.
About the Tiffany & Co. Alliance
The Company has established a long-term strategic alliance and first right of refusal with Tiffany & Co. Canada, a subsidiary of world famous New York based Tiffany & Co., to purchase up to 100% of the future production of rough diamonds from the Krone-Endora at Venetia Project at then current prices to be determined by the parties on an ongoing basis. In conjunction with this first right of refusal, Tiffany & Co. Canada also provided the Company with financing to advance the Project. Tiffany & Co. is owned by Moet Hennessy Louis Vuitton SE (LVMH), a publicly traded company which is listed on the Paris Stock Exchange (Euronext) under the symbol LVMH and on the OTC under the symbol LVMHF. For additional information on Tiffany & Co., please visit their website at www.tiffany.com.
About Krone-Endora at Venetia
In February 2011, Diamcor acquired the Krone-Endora at Venetia Project from De Beers Consolidated Mines Limited, consisting of the prospecting rights over the farms Krone 104 and Endora 66, which represent a combined surface area of approximately 5,888 hectares directly adjacent to De Beers’ flagship Venetia Diamond Mine in South Africa. On September 11, 2014, the Company announced that the South African Department of Mineral Resources had granted a Mining Right for the Krone-Endora at Venetia Project encompassing 657.71 hectares of the Project’s total area of 5,888 hectares. The Company has also submitted an application for a mining right over the remaining areas of the Project. The deposits which occur on the properties of Krone and Endora have been identified as a higher-grade “Alluvial” basal deposit which is covered by a lower-grade upper “Eluvial” deposit. The deposits are proposed to be the result of the direct-shift (in respect to the “Eluvial” deposit) and erosion (in respect to the “Alluvial” deposit) of material from the higher grounds of the adjacent Venetia Kimberlite areas. The deposits on Krone-Endora occur in two layers with a maximum total depth of approximately 15.0 metres from surface to bedrock, allowing for a very low-cost mining operation to be employed with the potential for near-term diamond production from a known high-quality source. Krone-Endora also benefits from the significant development of infrastructure and services already in place due to its location directly adjacent to the Venetia Mine.
Qualified Person Statement:
Mr. James P. Hawkins (B.Sc., P.Geo.), is Manager of Exploration & Special Projects for Diamcor Mining Inc., and the Qualified Person in accordance with National Instrument 43-101 responsible for overseeing the execution of Diamcor’s exploration programmes and a Member of the Association of Professional Engineers and Geoscientists of Alberta (“APEGA”). Mr. Hawkins has reviewed this press release and approved of its contents.
This news release contains statements that constitute “forward-looking statements.” Such forward looking statements involve known and unknown risks, uncertainties and other factors that may cause the Company’s actual results, performance or achievements, or developments in the industry to differ materially from the anticipated results, performance or achievements expressed or implied by such forward-looking statements. Forward looking statements are statements that are not historical facts and are generally, but not always, identified by the words “expects,” “plans,” “anticipates,” “believes,” “intends,” “estimates,” “projects,” “potential” and similar expressions, or that events or conditions “will,” “would,” “may,” “could” or “should” occur.
Forward-looking statements in this document include statements concerning the Company’s intent to file the Financial Disclosure before August 31, 2022 and all other statements that are not statements of historical fact.
Although the Company believes the forward-looking information contained in this news release is reasonable based on information available on the date hereof, by their nature forward-looking statements involve known and unknown risks, uncertainties and other factors which may cause our actual results, performance or achievements, or other future events, to be materially different from any future results, performance or achievements expressed or implied by such forward-looking statements. By their nature, these statements involve a variety of assumptions, known and unknown risks and uncertainties and other factors, which may cause actual results, levels of activity and achievements to differ materially from those expressed or implied by such statements.
Examples of such assumptions, risks and uncertainties include, without limitation, assumptions, risks and uncertainties associated with adverse industry events; future legislative and regulatory developments; COVID-19 and other assumptions, risks and uncertainties.
THE FORWARD-LOOKING INFORMATION CONTAINED IN THIS NEWS RELEASE REPRESENTS THE EXPECTATIONS OF THE COMPANY AS OF THE DATE OF THIS NEWS RELEASE AND, ACCORDINGLY, IS SUBJECT TO CHANGE AFTER SUCH DATE. READERS SHOULD NOT PLACE UNDUE IMPORTANCE ON FORWARD-LOOKING INFORMATION AND SHOULD NOT RELY UPON THIS INFORMATION AS OF ANY OTHER DATE. WHILE THE COMPANY MAY ELECT TO, IT DOES NOT UNDERTAKE TO UPDATE THIS INFORMATION AT ANY PARTICULAR TIME EXCEPT AS REQUIRED IN ACCORDANCE WITH APPLICABLE LAWS.
The Canadian Securities Exchange has not approved nor disapproved the contents of this news release.
WE SEEK SAFE HARBOUR
Neither TSX Venture Exchange nor its Regulation Services Provider (as that term is defined in policies of the TSX Venture Exchange) accepts responsibility for the adequacy or accuracy of this release.
Burlington, Ontario–(Newsfile Corp. – July 13, 2022) – Silver Bullet Mines Corp. (TSXV: SBMI) (OTCQB: SBMCF) (“SBMI” or “the Company”) is both pleased and proud to announce it has successfully produced silver and copper at its wholly owned 125 metric ton per day mill near Globe, Arizona.
“This production is the result of years of hard work, planning and dedication, and the incredible talents of the Arizona team,” said A. John Carter, SBMI’s CEO. “Over the past ten months, despite COVID-19 and global supply chain issues, we have spent less than three million dollars building this fully functional mill, a staggering feat. This is to my mind a one-of-a-kind experience.”
The mill produced its first silver concentrate from lower grade ore on July 12, 2022 and plans to soon pour its first dore bars. The Company intends to continue to use lower grade ore to optimize recovery efficiency and fine tune the various mill components. Higher grade ore will be introduced into the system once the mill is operating at higher rates of recovery. To date there have been no major setbacks and all components are operating within expected parameters.
Below is a photo of the first band of silver coming off the shaker table. The silver is visible on the left side of the photo. The secondary concentrate line is a silver/copper blend which will be bagged and sold. The initial concentrate and dore should be sold to various refineries, whose apparent demand should account for SBMI’s entire silver and copper production over the coming weeks.
A video of the shaker table operating can be found at the Company’s website, www.silverbulletmines.com.
The Buckeye Silver Mine is the source of the bulk sample ore for the mill. Both the mill and the Buckeye Mine are 100% controlled by SBMI. At the Buckeye, the field team is currently extracting ore from a vein at a location where it is approximately 12 feet wide. SBMI’s target is to have at least one month (5,000 tonnes) of raw ore available to the mill at all times, meaning management expects ore to be continually shipped from the Buckeye to the mill on a regular schedule.
Over the coming weeks management expects a steady stream of announcements as material milestones are met.
Please check the Company’s website www.silverbulletmines.com, or follow on Twitter @bulletmines or at YouTube “Silver Bullet Mines”.
For further information, please contact:
John Carter Silver Bullet Mines Corp., CEO cartera@sympatico.ca +1 (905) 302-3843
Peter M. Clausi Silver Bullet Mines Corp., VP Capital Markets pclausi@brantcapital.ca +1 (416) 890-1232
Cautionary and Forward-Looking Statements
Silver Bullet Mines Corp. trades on the TSX Venture Exchange under the symbol SBMI and on the OTCQB Venture Market under the symbol SBMCF. The OTCQB Venture Market is for early stage and developing U.S. and international companies. Companies listed there are current in their reporting and undergo an annual verification and management certification process. Investors can find current financial disclosure for the Company on www.otcmarkets.com and at https://money.tmx.com/en/quote/SBMI.
This news release contains certain statements that constitute forward-looking statements as they relate to SBMI and its subsidiaries. Forward-looking statements are not historical facts but represent management’s current expectation of future events, and can be identified by words such as “believe”, “expects”, “will”, “intends”, “plans”, “projects”, “anticipates”, “estimates”, “continues” and similar expressions. Although management believes that the expectations represented in such forward-looking statements are reasonable, there can be no assurance that they will prove to be correct.
By their nature, forward-looking statements include assumptions, and are subject to inherent risks and uncertainties that could cause actual future results, conditions, actions or events to differ materially from those in the forward-looking statements. If and when forward-looking statements are set out in this new release, SBMI will also set out the material risk factors or assumptions used to develop the forward-looking statements. Except as expressly required by applicable securities laws, SBMI assumes no obligation to update or revise any forward-looking statements. The future outcomes that relate to forward-looking statements may be influenced by many factors, including but not limited to: the impact of SARS CoV-2 or any other global virus; reliance on key personnel; the availability of skilled and unskilled labour; the presence and recoverability of mineralization; ongoing availability of infrastructure such as electrical, diesel and road access; the thoroughness of its QA/QA procedures; the continuity of the global supply chain for materials for SBMI to use in the production and processing of ore; shareholder, permitting and regulatory approvals; activities and attitudes of communities local to the location of SBMI’s properties; price increases related to supply chain issues; risks of future legal proceedings; income tax matters; fires, floods and other natural phenomena; the rate of inflation; availability and terms of financing; distribution of securities; commodities pricing; currency movements, especially as between the USD and CDN; effect of market interest rates on price of securities; and, potential dilution. SARS CoV-2 and other potential global viruses create risks that at this time are immeasurable and impossible to define.
Vancouver, British Columbia–(Newsfile Corp. – July 13, 2022) – Dolly Varden Silver Corporation (TSXV: DV) (OTCQX: DOLLF) (the “Company” or “Dolly Varden“) is pleased to announce that Rob van Egmond, P.Geo has been appointed Vice President of Exploration and to give an update on ongoing drilling work at the Kitsault Valley Project, located near tidewater in northwestern British Columbia.
To-date, three drills have cored over 7,700 meters in 27 holes of the planned 30,000 meter program in 99 holes. Initial work has focussed on stepping out from wide, high grade silver intercepts, particularly at the Kitsol Vein and Wolf Mine. Based on visual indicators of mineralization and veining, drills have continued to step-out in these areas, with the deepest hole at Wolf extended to 720 meters long and 400 meters at Kitsol at the Torbrit Deposit. Assays are pending for this drilling, however lab turnaround times are expected to be much improved during the 2022 season.
“First, we are excited to promote Rob Van Egmond to Vice-President Exploration as an officer and leader of the Company, as we accelerate our new phase of growth for Dolly Varden Silver,” says Shawn Khunkhun, President and CEO. “Second, we are very encouraged with our initial drilling in multiple areas on the Property. Our focus is primarily resource expansion and discovery at our silver-rich targets at the south end of the Kitsault Valley trend and are now commencing resource upgrade drilling and regional exploration at our recently acquired gold and silver-rich Homestake Ridge targets in the north.”
Rob Van Egmond, VP Exploration
Over the past two years, Dolly Varden Silver has expanded its technical team to support exploration and potential future development its Kitsault Valley Project as well as ongoing Corporate Development work. As a leader in these efforts, Rob van Egmond has been appointed Vice President of Exploration. Rob brings extensive exploration experience from generative, grass-roots to advanced Project development, mine site exploration and production. He was part of the Team with Platinum Group Metals that discovered and defined the massive Waterburg Platinum-Palladium deposit within the previously unknown northern extension of the Bushveld complex in South Africa. As Candente Copper’s Country Manager for Peru, he led the exploration and resource definition work that defined the multi-billion tonne Canariaco copper porphyry deposit, from initial drilling to the Pre-Feasibility Studies. Additionally, he has extensive experience in Canada’s north, including diamond exploration and resource development for BHP at the Ekati Mine and for Kennecott/Aber JV at the Diavik Mine. While with BHP, Rob also worked as an open-pit mine geologist at the Island Copper Operation in B.C. and as an Exploration Geologist in the Hope Bay greenstone gold belt in Nunavut.
Rob started his exploration career in the Golden Triangle for Cominco and returned as Chief Geologist for the Dolly Varden Project in 2017.
Exploration Update
The 2022 exploration program is balanced between Mineral Resource expansion and upgrading at five of the deposits that comprise the Kitsault Valley Project and exploration work focusing on the discovery of new silver and gold deposits. The objective of infill drilling is to convert Inferred mineral resource to the Measured and Indicated category with infill, with an emphasis on Inferred Resources at the recently acquired Homestake Ridge Area. Step out drilling is being performed at most resource areas, with an early emphasis during the 2022 season at the Torbrit/Kitsol/North Star deposits and Mineral Resources at the historic Wolf Mine. Stepout drilling is also planned later in the Season at Homestake Ridge and Homestake Silver deposits. Late winter snowpacks have delayed the start of drilling at the latter, with initial drilling expected this week. Drill productivity and core recovery have been excellent during the first five weeks of exploration on the Property.
Over half of this season’s exploration work is allocated to discover of new deposits, primarily silver-rich systems but also gold and copper targets. The Kitsault Valley Project currently contains 34.7 million ounces of silver and 166 thousand ounces of gold in the Indicated category and 29.3 million ounces of silver and 817 thousand ounces of gold in the Inferred category within a 163 square km consolidated land package. There are numerous new exploration targets located in the 5.4 kilometer long corridor between the Homestake Ridge and Dolly Varden deposits that are currently being explored, with one drill currently targeting these areas. Ongoing surface geology by the Company’s strong technical team and geophysical exploration will be used to generate and vector into drill targets. Currently, 20 exploration targets have been identified, eight of which are considered highest priority. Ground Induced-Polarity (“IP”) geophysical surveys will be commencing shortly on the Kitsault Valley Project.
In addition to drilling and surface exploration, Camp expansion and infrastructure upgrades have been completed in Alice Arm, BC as well as upgrades and repairs to the road bed and right of way that extends north to from tidewater to the Torbrit Mine.
About Dolly Varden Silver Corporation
Dolly Varden Silver Corporation is a mineral exploration company focused on advancing its 100% held Kitsault Valley Project (which combines the Dolly Varden Project and the Homestake Ridge Project) located in the Golden Triangle of British Columbia, Canada, 25kms by road to the Pacific ocean. The 163 sq. km. project hosts the high-grade silver and gold resources of Dolly Varden and Homestake Ridge along with the past producing Dolly Varden and Torbrit silver mines. It is considered to be prospective for hosting further precious metal deposits, being on the same structural and stratigraphic belts that host numerous other, on-trend, high-grade deposits, such as Eskay Creek and Brucejack. The Kitsault Valley Project also contains the Big Bulk property which is prospective for porphyry and skarn style copper and gold mineralization, similar to other such deposits in the region (Red Mountain, KSM, Red Chris).
QP Statement
Rob Van Egmond, P.Geo., Vice President Exploration for the Company and a Qualified Person, as defined by NI 43-101, has reviewed and approved the scientific and technical content of this release.
Forward-Looking Statements
This release may contain forward-looking statements or forward-looking information under applicable Canadian securities legislation that may not be based on historical fact, including, without limitation, statements containing the words “believe”, “may”, “plan”, “will”, “estimate”, “continue”, “anticipate”, “intend”, “expect”, “potential”, and similar expressions. Forward-looking statements involve known and unknown risks, uncertainties, and other factors which may cause the actual results, performance, or achievements of Dolly Varden to be materially different from any future results, performance, or achievements expressed or implied by the forward-looking statements. Forward-looking statements or information in this release relates to, among other things, completion of the Offering, TSX Venture Exchange approval of the Offering, the use of proceeds with respect to the Offerings, the results of previous field work and programs and the continued operations of the current exploration program, interpretation of the nature of the mineralization at the project and that that the mineralization on the project is similar to Eskay and Brucejack, results of the mineral resource estimate on the project, the potential to grow the project, the potential to expand the mineralization and our beliefs about the unexplored portion of the property.
These forward-looking statements are based on management’s current expectations and beliefs and assume, among other things, the ability of the Company to successfully pursue its current development plans, that future sources of funding will be available to the company, that relevant commodity prices will remain at levels that are economically viable for the Company and that the Company will receive relevant permits in a timely manner in order to enable its operations, but given the uncertainties, assumptions and risks, readers are cautioned not to place undue reliance on such forward-looking statements or information. The Company disclaims any obligation to update, or to publicly announce, any such statements, events or developments except as required by law.
For additional information on risks and uncertainties, see the Company’s most recently filed annual management discussion & analysis (“MD&A“) and management information circular dated January 21, 2022 (the “Circular“), both of which are available on SEDAR at www.sedar.com. The risk factors identified in the MD&A and the Circular are not intended to represent a complete list of factors that could affect the Company.
Neither the TSX Venture Exchange nor its Regulation Services Provider (as that term is defined in the policies of the TSX-V) accepts responsibility for the adequacy or accuracy of this news release.
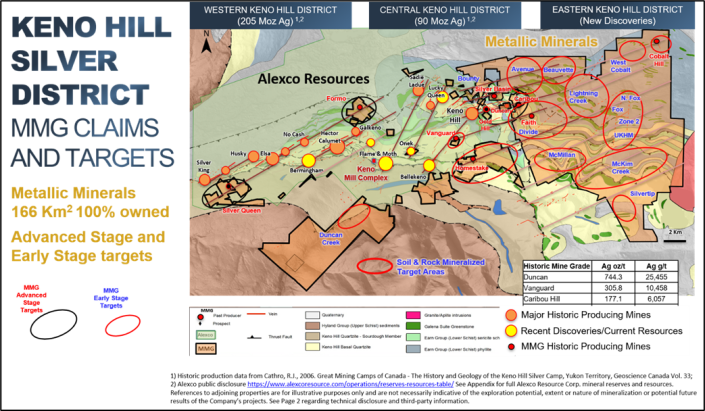
VANCOUVER, BC / ACCESSWIRE / July 13, 2022 / Metallic Minerals (TSXV:MMG | US OTCQB:MMNGF) (“Metallic Minerals“, or the “Company“) announces the commencement of field activities at the Company’s 100% owned, 166 square kilometer Keno Silver project, located in the historic Keno Hill silver district of Canada’s Yukon Territory. In July 2022, Hecla Mining Company (“Hecla”), the largest silver producer in the United States and third largest in the world1, announced the acquisition of neighboring Alexco Resource Corp.(“Alexco”), which holds the western portion of the district and mining and milling operations. Metallic Minerals owns the second largest land position in the prolific district covering the east, and parts of central and western Keno Hill, including eight high-grade, shallow past-producing deposits.
The 2022 exploration program is expected to consist of at least 3,000 meters of diamond core drilling, focused on resource definition drilling at multiple advanced-stage targets including Formo and Caribou deposits in the West Keno and Central Keno areas and the recently discovered Fox target area in East Keno, as well as step out drilling at several new discoveries. Detailed geophysical and soil surveys will also be conducted to aid in refinement and prioritization of reconnaissance drill targets in several untested target areas. Additionally, for the first time, the district will be flown for a LIDAR survey, which will provide greater precision in survey and topographic control while aiding in lineament detection in the search for new Keno-style high-grade silver discoveries.
Metallic Minerals President, Scott Petsel, commented: “We are excited to be initiating our 2022 field campaign at the Keno Silver project, particularly in the wake of the recently announced acquisition of our neighbors at Alexco by Hecla. This is a re-energizing catalyst for the Keno Hill silver district and highlights the quality of the existing reserves and resources and the exploration potential in one of the world’s highest grade silver producing regions that has produced over 200 million ounces of ultra-high-grade silver. We have enjoyed a close and productive working relationship with the team at Alexco and are excited to see the mining operation reach its full potential.”
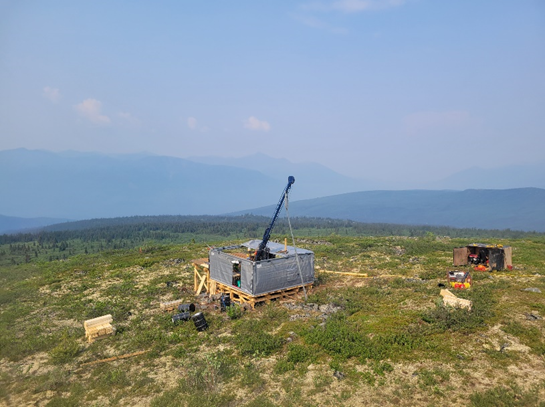
Metallic Minerals Corp., Tuesday, July 12, 2022, Press release picture
“Metallic Minerals is on the cusp of transforming our own story in the Keno silver district as this year’s drill program is focused on advancing existing mineral inventories to formal NI 43-101 resources at our most advanced targets. In addition, we expect to announce commencement of field activity at our La Plata silver-gold-copper project in Colorado shortly, as well as updates with regard to planned activities on our Klondike alluvial gold royalty portfolio.”
Private Placement
Metallic has completed and closed its second non-brokered private placement financing for total proceeds raised of $4,649,820. Proceeds from the two private placements will be used toward eligible Canadian exploration expenses, within the meaning of the Income Tax Act (Canada) and for general working capital.
The second private placement consisted of the issuance of 1,471,000 units at a price of $0.42 per unit for aggregate proceeds of $617,820. Each unit consisted of one common share and one-half purchase warrant where each whole warrant is exercisable into a common share for 30 months at a price of $0.50. A total of 846,000 units were sold on a flow-through basis with the common share comprising the units being issued as a flow-through common share.
The common shares comprising the units are subject to a hold period of four months and one day from their date of issuance under applicable Canadian securities law. The flow-through shares have not been, and will not be, registered under the U.S. Securities Act or any U.S. state securities laws, and may not be offered or sold in the United States or to, or for the account or benefit of, U.S. persons absent registration or any applicable exemption from the registration requirements of the U.S. Securities Act and applicable U.S. state securities laws.
An officer of the company participated in the private placement for a total of 25,000 units. The participation by the insider in the private placement is considered to be a related party transaction as defined under Multilateral Instrument 61-101. The transaction is exempt from the formal valuation and minority shareholder approval requirements of MI 61-101, as neither the fair market value of the securities being issued, nor the consideration being paid exceeds 25% of the Company’s market capitalization.
About the Keno Silver Project
Keno Hill is one of the world’s highest-grade silver districts, with nearly 300 million ounces (“Moz”) of silver in past production and current M&I resources1,2 and featuring excellent existing infrastructure, including grid power, road access and nearby community services. In July 2022, Hecla announced the acquisition of Alexco Resource Corp, which holds the western portion of the district and mining and milling operations. Metallic Minerals’ Keno Silver project is adjacent and contiguous, covering the east, and parts of the central and western Keno silver district and includes eight high-grade, shallow past-producing mines. Prior to the Company’s consolidation of the land package, very little modern exploration had been completed in these parts of the district due to fragmented, private land ownership. Metallic Minerals has advanced three targets in the district from discovery to expansion drilling with several additional targets at drill-ready status along the known historically productive trends. In addition, recent exploration has defined and expanded 12 new priority multi-kilometer-scale early-stage targets for reconnaissance drilling in the under-explored parts of the district where highly elevated silver, lead and zinc in soils and high-grade rock samples have been identified.
Metallic Minerals Corp., Tuesday, July 12, 2022, Press release picture
2022 Drilling at Fox Target at East Keno
About Metallic Minerals
Metallic Minerals Corp. is an exploration and development stage company, focused on silver, gold and copper in the high-grade Keno Hill and La Plata mining districts of North America. Our objective is to create shareholder value through a systematic, entrepreneurial approach to making exploration discoveries, growing resources and advancing projects toward development. Metallic Minerals has consolidated the second-largest land position in the historic Keno Hill silver district of Canada’s Yukon Territory, directly adjacent to Alexco Resource Corp’s operations, with more than 300 million ounces of high-grade silver in past production and current M&I resources. Hecla Mining Company, the largest primary silver producer in the USA and fourth largest in the world, announced the acquisition of Alexco in July 2022. Metallic recently announced the inaugural NI 43-101 mineral resource estimate for its La Plata silver-gold-copper project in southwestern Colorado. The Company also continues to add new production royalty leases on its holdings in the Klondike gold district in the Yukon. All three districts have seen significant mineral production and have existing infrastructure, including power and road access. Metallic Minerals is led by a team with a track record of discovery and exploration success on several major precious and base metal deposits, as well as having large-scale development, permitting and project financing expertise.
About the Metallic Group of Companies
The Metallic Group is a collaboration of leading precious and base metals exploration and development companies, with a portfolio of large, brownfields assets in established mining districts adjacent to some of the industry’s highest-grade producers of silver and gold, platinum and palladium, and copper. Member companies include Metallic Minerals in the Yukon’s high-grade Keno Hill silver district and La Plata silver-gold-copper district of Colorado, Granite Creek Copper in the Yukon’s Minto copper district, and Stillwater Critical Minerals in the Stillwater PGE-nickel-copper district of Montana and Kluane district in the Yukon. The founders and team members of the Metallic Group include highly successful explorationists formerly with some of the industry’s leading explorer/developers and major producers. With this expertise, the companies are undertaking a systematic approach to exploration and development using new models and technologies to facilitate discoveries in these proven, but under-explored, mining districts. Members of the Metallic Group have been recognized as recipients of awards for excellence in environmental stewardship demonstrating commitment to responsible resource development and appropriate ESG practices. The Metallic Group is headquartered in Vancouver, BC, Canada, and its member companies are listed on the Toronto Venture, US OTCQB and Frankfurt stock exchanges.
Forward Looking Statements: This news release includes certain statements that may be deemed “forward-looking statements”. All statements in this release, other than statements of historical facts including, without limitation, statements regarding potential mineralization, historic production, estimation of mineral resources, the realization of mineral resource estimates, interpretation of prior exploration and potential exploration results, the timing and success of exploration activities generally, the timing and results of future resource estimates, permitting time lines, metal prices and currency exchange rates, availability of capital, government regulation of exploration operations, environmental risks, reclamation, title, and future plans and objectives of the company are forward-looking statements that involve various risks and uncertainties. Although Metallic Minerals believes the expectations expressed in such forward-looking statements are based on reasonable assumptions, such statements are not guarantees of future performance and actual results or developments may differ materially from those in the forward-looking statements. Forward-looking statements are based on a number of material factors and assumptions. Factors that could cause actual results to differ materially from those in forward-looking statements include failure to obtain necessary approvals, unsuccessful exploration results, changes in project parameters as plans continue to be refined, results of future resource estimates, future metal prices, availability of capital and financing on acceptable terms, general economic, market or business conditions, risks associated with regulatory changes, defects in title, availability of personnel, materials and equipment on a timely basis, accidents or equipment breakdowns, uninsured risks, delays in receiving government approvals, unanticipated environmental impacts on operations and costs to remedy same, and other exploration or other risks detailed herein and from time to time in the filings made by the companies with securities regulators. Readers are cautioned that mineral resources that are not mineral reserves do not have demonstrated economic viability. Mineral exploration and development of mines is an inherently risky business. Accordingly, the actual events may differ materially from those projected in the forward-looking statements. For more information on Group Ten and the risks and challenges of their businesses, investors should review their annual filings that are available at www.sedar.com
Neither the TSX Venture Exchange nor its Regulation Services Provider (as that term is defined in the policies of the TSX Venture Exchange) accepts responsibility for the adequacy or accuracy of this release.
Joining us for a conversation is Dr. Roger Moss the CEO as Labrador Gold has just announced its highest-grade mineralization coming from the Big Vein along with updates on the Golden Glove and Midway Targets on the 100% owned Kingsway Project.
Labrador Gold is a Canadian-based mineral exploration (junior mining) company focused on the acquisition and exploration of prospective gold projects in Eastern Canada. The Company is advancing the Kingsway Gold Project, located in the Gander Gold District of Newfoundland. The project is strategically located contiguous to New Found Gold’s Queensway Project and lies along strike to the northeast of their recent discovery of 92.86g/t Au over 19.0 meters.
Key Shareholders: Eric Sprott, Quinton Hennigh, Crescat Capital, Palisaides Goldcorp, & New Found Gold.
In the recent Wall Street Journal article “Inflation Surge Earns Monetarism Another Look,” Greg Ip writes that a recent surge in inflation is not likely to bring authorities to reembrace monetarism. According to Ip, money supply had a poor record of predicting US inflation because of conceptual and definitional problems that haven’t gone away.
The head of the monetarist school, the late Milton Friedman, held that inflation is always and everywhere a monetary phenomenon. Friedman and other monetarists believed that the key driving factor for general increases in prices is increases in money supply.
This viewpoint has come under scrutiny since the early 1980s because the correlation between inflation and money supply disappeared. According to Ip in 2020, Alan Detmeister, an economist at UBS Group AG and formerly of the Fed, found inflation’s correlation to M2 since the early 1980s was weak and its correlation to both the monetary base and M1 was negative. Most economists have stopped using money supply as an indicator for inflation since the early 1980s.
Many mainstream economists have attributed the breakdown in the correlation between the money supply and inflation on the unstable velocity of money. What is it? According to the famous equation of exchange, MV = PT, where:
M stands for money,
V stands for the velocity of money,
P stands for the price level, and
T for the volume of transactions.
This equation states that money multiplied by velocity equals the value of transactions. Many economists employ GDP (gross domestic product) instead of PT, thereby concluding that
MV = GDP = P (real GDP).
The equation of exchange appears to offer a wealth of information regarding the state of an economy. For instance, if one were to assume stable velocity, then for a given stock of money one can establish the value of GDP. Furthermore, a given real output and a given stock of money enables us to establish the price level.
For most economists the equation of exchange is regarded as a very useful analytical tool. The debates that economists have are predominantly with respect to the stability of velocity. If velocity is stable, then money is seen as a very powerful tool in tracking the economy. The importance of money as an economic indicator however diminishes once velocity becomes less stable and hence less predictable.
However, an unstable velocity could occur because of an unstable demand for money. Most experts believe that since the early 1980s, innovations in financial markets made money velocity unstable. This in turn made money an unreliable indicator of inflation.
We believe the alleged failure of money as an indicator of inflation emanates from an erroneous definition of inflation and money supply. This failure has nothing to do with an unstable demand for money, and just because people change their demand for money does not imply instability. Because an individual’s goals may change, he might decide that it benefits him to hold less money. Sometime in the future, he might increase his demand for money. What could possibly be wrong with this? The same goes for any other goods and services—demand for them changes all the time.
Defining Inflation
According to Murray Rothbard and Ludwig von Mises, inflation is defined as the increase of the money supply out of “thin air.” Following this definition, one can ascertain that increases in money supply set economic impoverishment in motion by creating an exchange of nothing for something, the so-called counterfeit effect.
General increases in prices are likely to be symptoms of inflation—but not always, however. Note that prices are determined by both real and monetary factors. Consequently, it can occur that if the real factors are “pulling things” in an opposite direction to monetary factors, no visible change in prices is going to take place. If the growth rate of money is 5 percent and the growth rate of goods supply is 1 percent then prices are likely to increase by 4 percent. If, however, the growth rate in goods supply is also 5 percent then no general increase in prices is likely to take place.
If one were to hold that inflation is about increases in prices, then one would conclude that, despite the increase in money supply by 5 percent, inflation is 0 percent. However, if we were to follow the definition that inflation is about increases in the money supply, then we would conclude that inflation is 5 percent, regardless of any movement in prices.
Defining Money Supply
Prior to 1980, it was popular to employ various money supply definitions in the assessment of the changes in the prices of goods and services. The criterion for the selection of a particular definition was its correlation with national income. However, since the early 1980s, correlations between various definitions of money and national income have broken down. Some analysts believe that this breakdown is because of changes in financial markets, making past definitions of money irrelevant.
A definition presents the essence of a particular entity, something no statistical correlation could ever provide. To establish the definition of money we have to explain the origins of the money economy. Money has emerged because barter cannot support the market economy. Money is the general medium of exchange and has evolved from the most marketable commodity. Mises wrote:
There would be an inevitable tendency for the less marketable of the series of goods used as media of exchange to be one by one rejected until at last only a single commodity remained, which was universally employed as a medium of exchange; in a word, money.
Since the general medium of exchange was selected out of a wide range of commodities, the emerged money must be a commodity. Rothbard wrote:
In contrast to directly used consumers’ or producers’ goods, money must have pre-existing prices on which to ground a demand. But the only way this can happen is by beginning with a useful commodity under barter, and then adding demand for a medium to the previous demand for direct use (e.g., for ornaments, in the case of gold).
Through an ongoing selection process, individuals settled on gold as standard money. In today’s monetary system, the core of the money supply is no longer gold, but rather coins and notes issued by the government and central bank that are employed in transactions as goods and services are exchanged for cash. Hence, one trades all other goods and services for money.
Part of the stock of cash is stored through bank deposits. Once someone places money in a bank’s warehouse, he is engaging in a claim transaction, never relinquishing his ownership of the money. Consequently, these deposits, which are labelled demand deposits, are part of money.
This is contrasted with a credit transaction, where the lender relinquishes his claim over the money for the duration of the loan. In a credit transaction, money is transferred from a lender to a borrower, but the overall amount of money in the economy does not change because of the credit transaction.
The introduction of electronic money seems to cast doubt on the definition of money. It would appear that deregulated financial markets generate various forms of new money. Notwithstanding, various forms of electronic money or e-money, like digital currency, do not have a “life of their own.”
Various financial innovations do not generate new forms of money but rather new ways of employing existing money in transactions. Irrespective of these financial innovations, the nature of money does not change. Money is the thing that all other goods and services are traded for. Once the essence of money is established by excluding various credit transactions, one can identify the status of inflation. Changes in prices are not going to be relevant here.
Conclusion
Contrary to popular thinking, inflation is not about increases in the prices of goods and services but about increases in money supply. Following this definition, we can establish that the key damage caused by inflation is economic impoverishment through the exchange of nothing for something. What matters as far as inflation is concerned is not the correlation between money supply and the prices of goods and service but increases in money supply.
Contrary to popular thinking, the essence of money did not change because of various financial innovations. Money is a thing that is employed as a medium of exchange. Furthermore, according to Mises’s regression theorem, the historical link between paper currency and gold is what holds the present monetary system together.
Frank Shostak‘s consulting firm, Applied Austrian School Economics, provides in-depth assessments of financial markets and global economies. Contact: email.
Burlington, Ontario–(Newsfile Corp. – July 5, 2022) – Silver Bullet Mines Corp. (TSXV: SBMI) (OTCQB: SBMCF) (“SBMI” or “the Company”) announces it has successfully completed commissioning of its wholly owned 125 MTPD state of the art mill near Globe, Arizona. This is the latest major achievement in progressing towards bulk sampling and silver production.
Despite minor delays caused by COVID-19, the commissioning was successfully completed on July 3, 2022. Over the past few weeks all equipment at the mill was test run and synchronized for continuity. No material defects or deficiencies were detected.
“In September of 2021 this was an empty field,” said A. John Carter, SBMI’s CEO. “Now this field hosts a fully functional silver processing facility, ready to start processing a bulk sample of ore from our Buckeye Silver Mine. This could not have been achieved without the incredible skill and dedication of the technical team in Arizona.”
SBMI has commenced crushing ore through the crushing circuit (see video at https://youtu.be/KvhAhqABV74) and is filling the fine ore bin. The photo on the left below shows coarse ore from the Company’s local Buckeye Silver Mine and the photo on the right shows crushed ore in the fine ore bin. The cone crusher and jaw crusher successfully crushed the ore to less than ½ inch in diameter, which is ideal feed for the ball mill.
The next step on the path to producing concentrate and dore bars is to start running the fine ore through the grinding and gravity circuit. This will require a ramp-up period until all equipment is running at maximum efficiency.
Samples are being sent to multiple companies which have expressed an interest in buying SBMI’s concentrate and dore.
This is yet another giant leap forward for the Company. SBMI is on the cusp of producing both silver and copper and generating cash flow which will enable it to continue to execute on its business plan.
John Carter Silver Bullet Mines Corp., CEO cartera@sympatico.ca +1 (905) 302-3843
Peter M. Clausi Silver Bullet Mines Corp., VP Capital Markets pclausi@brantcapital.ca +1 (416) 890-1232
Cautionary and Forward-Looking Statements
Silver Bullet Mines Corp. trades on the TSX Venture Exchange under the symbol SBMI and on the OTCQB Venture Market under the symbol SBMCF. The OTCQB Venture Market is for early stage and developing U.S. and international companies. Companies listed there are current in their reporting and undergo an annual verification and management certification process. Investors can find current financial disclosure for the Company on www.otcmarkets.com and at https://money.tmx.com/en/quote/SBMI.
This news release contains certain statements that constitute forward-looking statements as they relate to SBMI and its subsidiaries. Forward-looking statements are not historical facts but represent management’s current expectation of future events, and can be identified by words such as “believe”, “expects”, “will”, “intends”, “plans”, “projects”, “anticipates”, “estimates”, “continues” and similar expressions. Although management believes that the expectations represented in such forward-looking statements are reasonable, there can be no assurance that they will prove to be correct.
By their nature, forward-looking statements include assumptions, and are subject to inherent risks and uncertainties that could cause actual future results, conditions, actions or events to differ materially from those in the forward-looking statements. If and when forward-looking statements are set out in this new release, SBMI will also set out the material risk factors or assumptions used to develop the forward-looking statements. Except as expressly required by applicable securities laws, SBMI assumes no obligation to update or revise any forward-looking statements. The future outcomes that relate to forward-looking statements may be influenced by many factors, including but not limited to: the impact of SARS CoV-2 or any other global virus; reliance on key personnel; the availability of skilled and unskilled labour; the presence and recoverability of mineralization; ongoing availability of infrastructure such as electrical, diesel and road access; the thoroughness of its QA/QA procedures; the continuity of the global supply chain for materials for SBMI to use in the production and processing of ore; shareholder, permitting and regulatory approvals; activities and attitudes of communities local to the location of SBMI’s properties; price increases related to supply chain issues; risks of future legal proceedings; income tax matters; fires, floods and other natural phenomena; the rate of inflation; availability and terms of financing; distribution of securities; commodities pricing; currency movements, especially as between the USD and CDN; effect of market interest rates on price of securities; and, potential dilution. SARS CoV-2 and other potential global viruses create risks that at this time are immeasurable and impossible to define.