 Proven Probable
Category: Energy
Vancouver, British Columbia–(Newsfile Corp. – June 30, 2022) – EMX Royalty Corporation (NYSE American: EMX) (TSXV: EMX) (FSE: 6E9) (the “Company” or “EMX”) is pleased to report that all proposed resolutions were approved at the Company’s Annual General Meeting of shareholders held on June 30, 2022, in Vancouver, British Columbia (the “Meeting“). The number of directors was set at 6 and all director nominees, as listed in the Management Information Circular dated May 19, 2022 (the “Information Circular”), were elected as directors of the Company at the Meeting to serve for a one-year term and hold office until the next annual meeting of shareholders. According to the proxy votes received from shareholders, the results were as follows:
| Director | Votes FOR | Votes WITHHELD |
| Brian E. Bayley | 96.68% | 3.32% |
| David M. Cole | 99.25% | 0.75% |
| Sunny Lowe | 98.98% | 1.02% |
| Henrik Lundin | 99.31% | 0.69% |
| Larry M. Okada | 96.45% | 3.55% |
| Michael D. Winn | 99.26% | 0.74% |
Shareholders voted 99.11% in favour of setting the number of directors at six, 99.29% in favour of appointing Davidson & Company LLP, Chartered Accountants as auditors, and 92.09% in favour of approving and ratifying the Company’s Stock Option Plan.
Voting results for all resolutions noted above are reported in the Report on Voting Results as filed under the Company’s SEDAR profile on June 30, 2022.
About EMX. EMX is a precious, base and battery metals royalty company. EMX’s investors are provided with discovery, development, and commodity price optionality, while limiting exposure to risks inherent to operating companies. The Company’s common shares are listed on the NYSE American Exchange and TSX Venture Exchange under the symbol “EMX”, and also trade on the Frankfurt exchange under the symbol “6E9”. Please see www.EMXroyalty.com for more information.https://embed.fireplace.yahoo.com/embed?ctrl=Monalixa&m_id=monalixa&m_mode=document&site=sports&os=android&pageContext=%257B%2522ctopid%2522%253A%25221542500%253B1577000%2522%252C%2522hashtag%2522%253A%25221542500%253B1577000%2522%252C%2522wiki_topics%2522%253A%2522Annual_general_meeting%253BCompany%253BVancouver%253BNYSE_American%253BTSX_Venture_Exchange%253BChartered_accountant%2522%252C%2522lmsid%2522%253A%2522a0V0W00000HOPDcUAP%2522%252C%2522revsp%2522%253A%2522newsfile_64%2522%252C%2522lpstaid%2522%253A%2522f7514462-52d7-3a71-aedf-024feb72969f%2522%252C%2522pageContentType%2522%253A%2522story%2522%257D
For further information contact:
David M. Cole
President and CEO
Phone: (303) 973-8585
Dave@EMXroyalty.com
Scott Close
Director of Investor Relations
Phone: (303) 973-8585
SClose@EMXroyalty.com
Isabel Belger
Investor Relations (Europe)
Phone: +49 178 4909039
IBelger@EMXroyalty.com

To view the source version of this press release, please visit https://www.newsfilecorp.com/release/129683

NEW YORK, June 28, 2022 (GLOBE NEWSWIRE) — OTC Markets Group Inc. (OTCQX: OTCM), operator of regulated markets for trading 12,000 U.S. and international securities, today announced Collective Mining Ltd (TSX-V: CNL; OTCQX: CNLMF), an exploration and development company focused on identifying and exploring prospective mineral projects in South America, has qualified to trade on the OTCQX® Best Market. Collective Mining Ltd upgraded to OTCQX from the Pink® market.
Collective Mining Ltd begins trading today on OTCQX under the symbol “CNLMF.” U.S. investors can find current financial disclosure and Real-Time Level 2 quotes for the company on www.otcmarkets.com.
Upgrading to the OTCQX Market is an important step for companies seeking to provide transparent trading for their U.S. investors. For companies listed on a qualified international exchange, streamlined market standards enable them to utilize their home market reporting to make their information available in the U.S. To qualify for OTCQX, companies must meet high financial standards, follow best practice corporate governance and demonstrate compliance with applicable securities laws.
“We are pleased to reach the milestone of trading on OTCQX, as this will make it easier for our U.S. employees and investors to invest in Collective Mining by reducing the requirement of having a Canadian trading account,” said Ari Sussman, Executive Chairman of Collective.
Nauth LPC acted as the company’s OTCQX sponsor.https://embed.fireplace.yahoo.com/embed?ctrl=Monalixa&m_id=monalixa&m_mode=document&site=sports&os=android&pageContext=%257B%2522ctopid%2522%253A%25221542500%253B1577000%253B1580500%253B1480989%2522%252C%2522hashtag%2522%253A%25221542500%253B1577000%253B1580500%253B1480989%2522%252C%2522wiki_topics%2522%253A%2522OTC_Markets_Group%253BRegulated_market%253BZijin_Mining%253BUnited_States%253BSouth_America%2522%252C%2522lmsid%2522%253A%2522a0770000002m0AbAAI%2522%252C%2522revsp%2522%253A%2522globenewswire.com%2522%252C%2522lpstaid%2522%253A%2522701730ec-86cd-3dbe-9f98-d54d4e55d5c7%2522%252C%2522pageContentType%2522%253A%2522story%2522%257D
About Collective Mining Ltd
Collective Mining is an exploration and development company focused on identifying and exploring prospective mineral projects in South America. Founded by the team that developed and sold Continental Gold Inc. to Zijin Mining for approximately $2 billion in enterprise value, the mission of the Company is to repeat its past success in Colombia by making significant new mineral discoveries and advance the projects to production. Management, insiders and close family and friends own nearly 45% of the outstanding shares of the Company and as a result, are fully aligned with shareholders. Collective currently holds an option to earn up to a 100% interest in two projects located in Colombia. As a result of an aggressive exploration program on both the Guayabales and San Antonio projects, a total of eight major targets have been defined. The Company is fortuitous to have made significant grassroot discoveries at both projects with near-surface discovery holes at the Guayabales project yielding 302 metres at 1.11 g/t AuEq at the Olympus target, 163 metres at 1.3 g/t AuEq at the Donut target and 87.8 metres at 2.49 g/t AuEg at the Apollo target. At the San Antonio project, the Company intersected, from surface, 710 metres at 0.53 AuEq. (See press releases dated October 27th, 2021, November 15, 2021, March 15, 2022 and June 22, 2022 for AuEq calculations)
About OTC Markets Group Inc.
OTC Markets Group Inc. (OTCQX: OTCM) operates regulated markets for trading 12,000 U.S. and international securities. Our data-driven disclosure standards form the foundation of our three public markets: OTCQX® Best Market, OTCQB® Venture Market and Pink® Open Market.
Our OTC Link® Alternative Trading Systems (ATSs) provide critical market infrastructure that broker-dealers rely on to facilitate trading. Our innovative model offers companies more efficient access to the U.S. financial markets.
OTC Link ATS, OTC Link ECN and OTC Link NQB are each an SEC regulated ATS, operated by OTC Link LLC, a FINRA and SEC registered broker-dealer, member SIPC.
To learn more about how we create better informed and more efficient markets, visit www.otcmarkets.com.
Subscribe to the OTC Markets RSS Feed
Media Contact:
OTC Markets Group Inc., +1 (212) 896-4428, media@otcmarkets.com

Vancouver, British Columbia–(Newsfile Corp. – June 22, 2022) – EMX Royalty Corporation (NYSE American: EMX) (TSXV: EMX) (FSE: 6E9) (the “Company” or “EMX”) has acquired ownership of 7,924,106 common shares (representing 7.25% of the outstanding shares) of Norra Metals Corp. (TSXV: NORA) of Vancouver, BC. The acquisition was made pursuant to a property sale agreement with Norra executed in December 2018.
Prior to the acquisition, EMX owned 5,771,000 common shares (representing 5.69% of Norra’s outstanding common shares). EMX now has ownership of and control over 13,695,106 common shares of Norra (representing 12.53% of Norra’s outstanding common shares).
The shares were acquired on June 15, 2022, under the prospectus exemption set out in section 2.13 [Petroleum, natural gas and mining properties] of National Instrument 45-106 Prospectus Exemptions of the Canadian Securities Administrators.
Presently, EMX does not have any intention of acquiring any further securities of Norra.
EMX will file an Early Warning Report with the British Columbia and Alberta Securities Commissions in respect of the acquisition. Copies of the Report may be obtained from SEDAR (www.sedar.com) or without charge from EMX’s Corporate Secretary, Rocio Echegaray (604-688-6390).
About EMX. EMX is a precious, base and battery metals royalty company. EMX’s investors are provided with discovery, development, and commodity price optionality, while limiting exposure to risks inherent to operating companies. The Company’s common shares are listed on the NYSE American Exchange and TSX Venture Exchange under the symbol “EMX”, and also trade on the Frankfurt exchange under the symbol “6E9”. Please see www.EMXroyalty.com for more information.
For further information contact:
David M. Cole
President and CEO
Phone: (303) 973-8585
Dave@EMXroyalty.com
Scott Close
Director of Investor Relations
Phone: (303) 973-8585
SClose@EMXroyalty.com
Isabel Belger
Investor Relations (Europe) Phone: +49 178 4909039
IBelger@EMXroyalty.com
Neither the TSX Venture Exchange nor its Regulation Services Provider (as that term is defined in policies of the TSX Venture Exchange) accepts responsibility for the adequacy or accuracy of this release

Figure 1:

Figure 2:
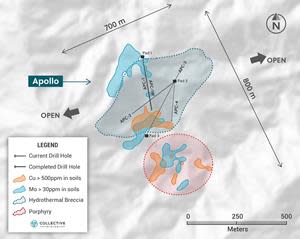
Figure 3:

Figure 4:

TORONTO, June 22, 2022 (GLOBE NEWSWIRE) — Collective Mining Ltd. (TSXV: CNL) (“Collective” or the “Company”) is excited to announce the discovery of a new high-grade copper-gold-silver porphyry-related breccia at the Guayabales project, located in Caldas, Colombia. APC-1, which is the first ever diamond drill hole to test the Apollo target (“Apollo”), was collared approximately 600 metres southeast of the previously announced Olympus discovery hole that assayed 302 metres @ 1.11 g/t gold equivalent (see release dated March 15, 2022). Apollo is one of eight porphyry-related targets situated within a three-by-four-kilometre cluster area generated by the Company through grassroots exploration. As part of its fully funded 20,000 metre drill program for 2022, there are currently three diamond drill rigs operating at Guayabales, with two turning at Apollo and one turning at the Trap target.
| Highlights (See Figures 1 – 4) | ||||
| • | APC-1, intercepted the mineralized breccia from 291.6 metres downhole (170 metres vertical) with results as follows: | |||
| • | 87.8 metres @ 2.49 g/t AuEq including: | |||
| 10.9 metres @ 4.55 g/t AuEq from 291.6 metres down hole; and | ||||
| 14.3 metres @ 3.67 g/t AuEq from 352 metres down hole | ||||
| • | Mineralization is remarkably continuous along the axis of the discovery intercept and is hosted within a breccia sulphide matrix consisting of chalcopyrite (Cu) and pyrite. Additionally, overprinting carbonate base metal porphyry veins flood the breccia matrix in various locations along the mineralized interval in APC-1 with visible sphalerite (Zn) and Galena (Pb) observed. The breccia clasts are all quartz diorite in composition and this hydrothermal system is clearly linked to a porphyry system. | |||
| • | APC-1 was drilled to the south from Pad 1 on the northern fringe of an 800 metre X 700 metre target area as defined by rock sampling, soil geochemistry and geology mapping. Apollo remains open to the east, west, south and at depth for further expansion. Due to the size of the target area at Apollo, the Company has completed the construction of two additional drill pads. Drill holes APC-1W and APC-2 have already been completed with APC-3 and APC-4 currently underway. Future assay results for Apollo will be reported in batch format once received and interpreted by the Company. | |||
| • | The Apollo target area consists of newly generated porphyry and porphyry related targets with coincidental high-grade copper and molybdenum soil anomalies in places measuring greater than 500 parts per million (“ppm”) in copper and 30 ppm in molybdenum. Additionally, surface sampling at Apollo has uncovered a series of high-grade gold outcrops with numerous rock samples assaying greater than 3 g/t gold. | |||
| • | Apollo is road accessible all year-round and is situated within an elevation range of 1,800 to 2,000 metres above sea level. Additionally, an electrical substation is located less than one kilometre from the target area. | |||
| “The discovery at Apollo opens a new and very exciting front for the Company. Firstly, it is the first time that the Company has discovered a significant amount of copper. Secondly, large mineralized systems generally have multiple styles of overprinting mineralization and in the case of Apollo, we have already observed three different mineralization types, namely two types of porphyry related CBM veins and of course the mineralized breccia. Our technical team also believes that the Apollo discovery may be the first in a series of porphyry and breccia discoveries at the Apollo target,” commented Ari Sussman, Executive Chairman. “With a second rig recently commissioned and now coring, we have made the decision to soon add a third rig to the program in order to aggressively unlock the potential value of this discovery.” |
Table 1: Assays Results
| HoleID | From (m) | To (m) | Intercept (m)** | Au (g/t) | Ag (g/t) | Cu % | Zn % | Pb % | Mo % | AuEq (g/t)* |
| APC-1 | 291.60 | 379.40 | 87.80 | 0.88 | 61 | 0.39 | 0.07 | 0.05 | 0.001 | 2.49 |
| Incl | 291.60 | 302.50 | 10.90 | 1.03 | 156 | 0.58 | 0.34 | 0.26 | 0.001 | 4.55 |
| and | 352.00 | 366.30 | 14.30 | 2.41 | 28 | 0.50 | 0.02 | 0.00 | 0.001 | 3.67 |
*AuEq (g/t) is calculated as follows: (Au (g/t) x 0.95) + (Ag g/t x 0.014 x 0.95) + (Cu (%) x 2.06 x 0.95) + (Mo (%) x 6.86 x 0.95+(Zn(%)x 0.80 x 0.95)+ (Pb(%)x 0.45 x 0.95) utilizing metal prices of Cu – US$4.50/lb, Mo – US$15.00/lb, Zn – US$1.75/lb, Pb – US$1.0/lb, Ag – $21/oz and Au – US$1,500/oz and recovery rates of 95% for Au, Ag, Cu, Mo, Zn and Mo. Recovery rate assumptions are speculative as no metallurgical work has been completed to date.
** A 0.4 g/t AuEq cut-off grade was employed with no more than 10% internal dilution. True widths are unknown, and grades are uncut.https://embed.fireplace.yahoo.com/embed?ctrl=Monalixa&m_id=monalixa&m_mode=document&site=sports&os=android&pageContext=%257B%2522ctopid%2522%253A%25221542500%253B1577000%2522%252C%2522hashtag%2522%253A%25221542500%253B1577000%2522%252C%2522wiki_topics%2522%253A%2522Target_Corporation%253BMultiview_orthographic_projection%253BPorphyry_(geology)%253BApollo%2522%252C%2522lmsid%2522%253A%2522a0770000002m0AbAAI%2522%252C%2522revsp%2522%253A%2522globenewswire.com%2522%252C%2522lpstaid%2522%253A%252217662b79-0a3d-3672-b481-a63f394d6cd3%2522%252C%2522pageContentType%2522%253A%2522story%2522%257D
Figure 1: Plan View of the Guayabales Project Highlighting the Apollo Target
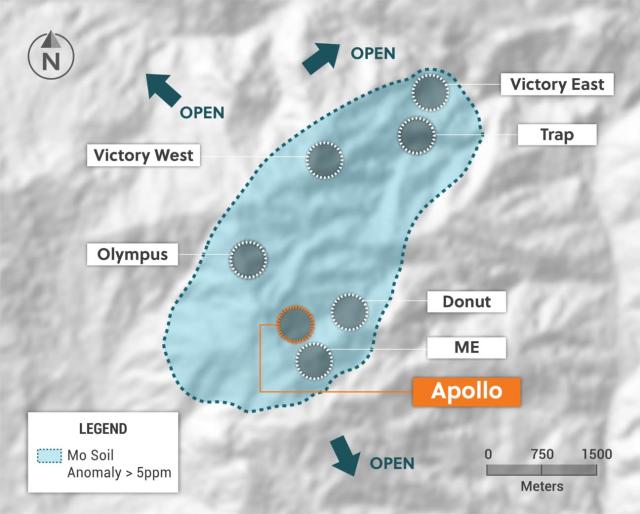
Figure 2: Plan View of the Apollo Target Area Outlining the Porphyry and Breccia Targets, their Related Soil Anomalies and Drill Holes Completed or Currently Underway

Figure 3: Plan View of the Hydrothermal Breccia Discovery Made at Apollo

Figure 4: Apollo Target Cross Section N-S With APC-1 and Related Core Photos Highlighted

About Collective Mining Ltd.
To see our latest corporate presentation, please visit www.collectivemining.com
Collective Mining is an exploration and development company focused on identifying and exploring prospective mineral projects in South America. Founded by the team that developed and sold Continental Gold Inc. to Zijin Mining for approximately $2 billion in enterprise value, the mission of the Company is to repeat its past success in Colombia by making significant new mineral discoveries and advance the projects to production. Management, insiders and close family and friends own nearly 45% of the outstanding shares of the Company and as a result, are fully aligned with shareholders. Collective currently holds an option to earn up to a 100% interest in two projects located in Colombia. As a result of an aggressive exploration program on both the Guayabales and San Antonio projects, a total of eight major targets have been defined. The Company is fortuitous to have made significant grassroot discoveries at both projects with near-surface discovery holes at the Guayabales project yielding 302 metres at 1.11 g/t AuEq at the Olympus target, 163 metres at 1.3 g/t AuEq at the Donut target and 87.8 metres at 2.49 g/t AuEg at the Apollo target. At the San Antonio project, the Company intersected, from surface, 710 metres at 0.53 AuEq. (See press releases dated October 27th, 2021, November 15, 2021, March 15, 2022 and June 28, 2022 for AuEq calculations)
Qualified Person (QP) and NI43-101 Disclosure
David J Reading is the designated Qualified Person for this news release within the meaning of National Instrument 43-101 (“NI 43-101”) and has reviewed and verified that the technical information contained herein is accurate and approves of the written disclosure of same. Mr. Reading has an MSc in Economic Geology and is a Fellow of the Institute of Materials, Minerals and Mining and of the Society of Economic Geology (SEG).
Technical Information
Rock and core samples have been prepared and analyzed at SGS laboratory facilities in Medellin, Colombia and Lima, Peru. Blanks, duplicates, and certified reference standards are inserted into the sample stream to monitor laboratory performance. Crush rejects and pulps are kept and stored in a secured storage facility for future assay verification. No capping has been applied to sample composites. The Company utilizes a rigorous, industry-standard QA/QC program.
Contact Information
Collective Mining Ltd.
Steve Gold, Vice President, Corporate Development and Investor Relations
Tel. (416) 648-4065
FORWARD-LOOKING STATEMENTS
This news release contains certain forward-looking statements, including, but not limited to, statements about the drill programs, including timing of results, and Collective’s future and intentions. Wherever possible, words such as “may”, “will”, “should”, “could”, “expect”, “plan”, “intend”, “anticipate”, “believe”, “estimate”, “predict” or “potential” or the negative or other variations of these words, or similar words or phrases, have been used to identify these forward-looking statements. These statements reflect management’s current beliefs and are based on information currently available to management as at the date hereof.
Forward-looking statements involve significant risk, uncertainties, and assumptions. Many factors could cause actual results, performance, or achievements to differ materially from the results discussed or implied in the forward-looking statements. These factors should be considered carefully, and readers should not place undue reliance on the forward-looking statements. Although the forward-looking statements contained in this news release are based upon what management believes to be reasonable assumptions, Collective cannot assure readers that actual results will be consistent with these forward-looking statements. These forward-looking statements are made as of the date of this news release, and Collective assumes no obligation to update or revise them to reflect new events or circumstances, except as required by law.
Neither the TSXV nor its Regulation Services Provider (as that term is defined in the policies of the TSXV) accepts responsibility for the adequacy or accuracy of this news release.
Photos accompanying this announcement are available at:


VANCOUVER, British Columbia, June 21, 2022 (GLOBE NEWSWIRE) — Millrock Resources Inc. (TSX-V: MRO, OTCQB: MLRKF) (“Millrock” or the “Company”) reports that it has entered into a Loan Agreement with Redplug Capital Corporation. The loan is in the amount of $500,000 and will be used for general working capital. Millrock intends to repay the loan within the coming year by 1) liquidation of shares that it holds in other companies, 2) sale of royalty interests, and/or 3) from proceeds that may be realized on sale or purchase agreements concerning Millrock mineral exploration projects. The term of the loan is one year. Interest for the first six months of the loan is 6.0% per annum and thereafter at 12.0% per annum. Additionally, Millrock will pay the Redplug Capital Corporation 2,000,000 bonus shares of the Company upon acceptance of the TSX Venture Exchange.
Millrock President & CEO, Gregory Beischer, commented: “Millrock has found itself in a tight financial position at a time when market conditions limit our ability to raise further operating funds. In any event, an equity financing at the current share price would be highly dilutive to existing shareholders. At the same time, Millrock has many catalysts that have potential to drive the Company’s share price higher. More than 18,000 metres of drilling has been planned and budgeted at several projects in which Millrock has an interest. All the funds for these drilling programs come from partner companies. Additionally, Millrock is closing in on option agreements on other projects that could bring more cash into the company treasury. Shareholders that have invested in Millrock over the past few years have looked forward to the big year of drilling underway in 2022. Millrock has determined that it is best not to incur excessive dilution by equity financing at this particular juncture. The less dilutive loan transaction will allow operations to continue in the short term. Potential asset sales will cover longer term needs while results of ongoing drilling programs unfold. We are hopeful that results of the drilling programs will make an equity financing under more favourable and less dilutive terms later in 2022 possible. We think all the drilling programs have a good chance at making gold discoveries.”
Qualified Person
The scientific and technical information disclosed within this document has been prepared, reviewed, and approved by Gregory A. Beischer, President, CEO, and a director of Millrock Resources. Mr. Beischer is a qualified person as defined in NI 43-101.
About Millrock Resources Inc.
Millrock Resources Inc. is a premier project generator to the mining industry. Millrock identifies, packages, and operates large-scale projects for joint venture, thereby exposing its shareholders to the benefits of mineral discovery without the usual financial risk taken on by most exploration companies. The company is recognized as the premier generative explorer in Alaska, holds royalty interests in British Columbia, Canada, and Sonora State, Mexico, is a significant shareholder of junior explorer ArcWest Exploration Inc., and owns a large shareholding in each of Resolution Minerals Limited and Felix Gold Limited. Funding for drilling at Millrock’s exploration projects is primarily provided by its joint venture partners. Business partners of Millrock have included some of the leading names in the mining industry: EMX Royalty, Coeur Explorations, Centerra Gold, First Quantum, Teck, Kinross, Vale, Inmet, and Altius, as well as junior explorers Resolution, Riverside, PolarX, Felix Gold and Tocvan.
ON BEHALF OF THE BOARD
“Gregory Beischer”
Gregory Beischer, President & CEO
FOR FURTHER INFORMATION, PLEASE CONTACT:
Melanee Henderson, Investor Relations
Toll-Free: 877-217-8978 | Local: 604-638-3164
Twitter | Facebook | LinkedIn
Some statements in this news release may contain forward-looking information (within the meaning of Canadian securities legislation) including without limitation the intention of partner companies to complete all the planned drilling they have indicated, the sale of Millrock assets, that Millrock has many catalysts that have potential to drive the Company’s share price higher, that Millrock is closing in on option agreements on other projects that could bring more cash into the company treasury, that potential asset sales will cover longer term needs, that all the drilling programs have a good chance at making gold discoveries, and the possibility of share price increase upon receipt of future drilling results. These statements address future events and conditions and, as such, involve known and unknown risks, uncertainties and other factors which may cause the actual results, performance or achievements to be materially different from any future results, performance or achievements expressed or implied by the statements. Such factors include, without limitation, customary risks of the resource industry and the risk factors identified in Millrock’s management’s discussion and analysis for the three-month period ended March 31, 2022, which is available under Millrock’s profile on SEDAR at www.sedar.com. Forward-looking statements speak only as of the date those statements are made. Except as required by applicable law, Millrock assumes no obligation to update or to publicly announce the results of any change to any forward-looking statement contained or incorporated by reference herein to reflect actual results, future events or developments, changes in assumptions or changes in other factors affecting the forward-looking statements. If Millrock updates any forward-looking statement(s), no inference should be drawn that it will make additional updates with respect to those or other forward-looking statements.
Vancouver, British Columbia–(Newsfile Corp. – June 21, 2022) – EMX Royalty Corporation (NYSE American: EMX) (TSXV: EMX) (FSE: 6E9) (the “Company” or “EMX”) is pleased to announce drill results from EMX’s Hardshell royalty property at a new exploration target, named the Peake prospect, which is part of South32 Limited’s Hermosa project in southeast Arizona (Figure 1). Hermosa also includes the feasibility stage Taylor lead-zinc-silver deposit situated directly north of EMX’s royalty claim block (see map in Appendix 1). EMX retains a 2% net smelter return (“NSR”) royalty on Hardshell that is not capped nor subject to buy down.
Drill results from Peake, which is partially covered by the Hardshell royalty, include copper-enriched skarn type mineralized intercepts of 76.5 meters (1,308.2-1,384.7 m) averaging 1.52% copper, 0.2% zinc, 0.4% lead, and 25 g/t silver in hole HDS-552, as well as 73.8 meters (1,386.8-1,460.6 m) averaging 1.06% copper, 0.5% zinc, 0.7% lead, and 67 g/t silver in HDS-661. In addition, intercepts more typical of Taylor carbonate replacement deposit (“CRD”) style mineralization include 9.8 meters (966.2-976.0 m) averaging 0.69% copper, 12.2% zinc, 8.2% lead, and 77 g/t silver in HDS-353. South32’s geological model indicates the potential for Peake to host a structurally and lithologically controlled mineralized skarn system that connects to the Taylor CRD mineralization.
EMX’s Hardshell royalty was organically generated by the Company’s wholly-owned subsidiary Bronco Creek Exploration Inc. (“BCE”). BCE recognized the alteration and mineralization zoning patterns within the district, and staked prospective open ground. Hardshell was optioned in 2015 for a 2% NSR retained royalty interest. The Hermosa project, including Hardshell, was subsequently acquired by South32 in 2018. South32 has steadily advanced Hermosa, which now includes the step-out exploration drilling that has delineated Peake. The Peake mineralization covered by the Hardshell royalty highlights the discovery optionality within EMX’s royalty portfolio.
Discussion of Drill Results. South32’s drilling at Hardshell has focused on the copper-rich skarn mineralization at the Peake prospect, but has also intersected potential extensions of the Taylor CRD system. Peake consists of copper-lead-zinc-silver mineralization delineated as a 1,200 meter by 550 meter, west-northwest trending zone of variable thickness at depths of 1,300 to 1,500 meters. South32 is following up on the Peake drill results as part of its Hermosa exploration programs, and has directed US$13 million to its exploration programs at Hermosa in the nine months ended March 2022.1
EMX’s royalty covers much of the currently known extents of the Peake prospect, and South32 has provided EMX a database with ~23,300 meters of angled diamond drilling from within the Hardshell royalty footprint. Select intercepts are summarized in Table 1. Copper-enriched skarn intercepts are reported at a 0.2% copper cutoff, reflecting the early-stage nature of exploration and evaluation of the Peake prospect. CRD style intercepts are reported at a 2.0% zinc equivalent (“ZnEq”) cutoff, reflecting the current feasibility stage of evaluation for the Taylor deposit.
Table 1. Select drill intercepts from EMX’s Hardshell royalty property.

To view an enhanced version of Table 1, please visit:
https://orders.newsfilecorp.com/files/1508/128370_table1.jpg
Skarn intercepts in green and CRD intercepts in light blue. ZnEq cutoff calculated using metal prices of Zn (US$2,695/t), Pb (US$1,992/t), and Ag (US$25.50/oz) and recoveries of Zn (90%), Pb (91%) and Ag (81%). Cu was NOT included in the ZnEq calculation. True widths are approximately 65-85% of the reported interval lengths. *Note: HDS-661 missing data from 1563.4 meters to EOH.

Figure 1. EMX’s Hardshell royalty property and South32 drill intercepts.
To view an enhanced version of Figure 1, please visit:
https://orders.newsfilecorp.com/files/1508/128370_figure1.jpg
Hermosa Project and Hardshell Royalty Property Overview. South32’s Hermosa project, located in the Patagonia mining district of southeastern Arizona, includes CRD sulfide (i.e., Taylor) and oxide (i.e., Clark) deposits (which are not covered by EMX’s Hardshell royalty), as well as the Peake skarn prospect (partially covered by EMX’s Hardshell royalty). In a July 21, 2021 Public Report titled “Hermosa Project – Mineral Resource Estimate Update” South32 disclosed a JORC (2012) Mineral Resource estimate for Taylor at a US$80/dmt NSR cutoff as a) 29 Mtonnes @ 4.10% Zn, 4.05% Pb, and 57 g/t Ag Measured, b) 86 Mtonnes @ 3.76% Zn, 4.44% Pb, and 86 g/t Ag Indicated, c) and 24 Mtonnes @ 3.73% Zn, 3.82% Pb, and 91 g/t Ag Inferred.2 The resource estimate was prepared by M. Hastings, MAusIMM, of SRK Consulting (US), a Competent Person in accordance with the requirements of the JORC Code. JORC is an “acceptable foreign code” under NI 43-101 for disclosure of mineral resources and mineral reserves.
In a January 17, 2022 Public Report, South32 announced an update to the Hermosa project with the completion of a pre-feasibility study on the Taylor deposit and a scoping study for the Clark deposit.3 South32 also stated that 1) Taylor had moved to the feasibility stage of evaluation with a final investment decision expected by mid-2023, and 2) shaft development is expected to commence in FY2024, subject to a final investment decision and receipt of required permits.
EMX’s Hardshell 2% NSR royalty property consists of 16 unpatented federal lode mining claims that are included as part of South32’s Hermosa project. Mineralization is primarily hosted within a sequence of dipping upper Paleozoic (i.e., Pennsylvanian-Permian) carbonate sedimentary rocks adjacent to the Sunnyside porphyry system which is being explored by Barksdale Resources. The delineation of the Peake prospect by South32 represents the potential to create significant value for the Company’s Hardshell royalty property. EMX looks forward to South32’s continued exploration success at Hardshell, as well as from the greater Hermosa project.
Comments on Adjacent Properties. The adjacent properties, which include South32’s Taylor deposit and Barksdale’s Sunnyside Project, provide geological context for the Peake prospect, which is partially covered by EMX’s Hardshell royalty claim block. However, this is not necessarily indicative that the Hardshell royalty claim block represents similar tonnages or grades of mineralization as at the Taylor deposit, nor a similar style of mineralization as the Sunnyside porphyry.
Qualified Person. Michael P. Sheehan, CPG, a Qualified Person as defined by National Instrument 43-101 and employee of the Company, has reviewed, verified and approved the disclosure of the technical information contained in this news release.
About EMX. EMX is a precious, base and battery metals royalty company. EMX’s investors are provided with discovery, development, and commodity price optionality, while limiting exposure to risks inherent to operating companies. The Company’s common shares are listed on the NYSE American Exchange and TSX Venture Exchange under the symbol “EMX”, and also trade on the Frankfurt exchange under the symbol “6E9”. Please see www.EMXroyalty.com for more information.
For further information contact:
David M. Cole
President and CEO
Phone: (303) 973-8585
Dave@EMXroyalty.com
Scott Close
Director of Investor Relations
Phone: (303) 973-8585
SClose@EMXroyalty.com
Isabel Belger
Investor Relations (Europe)
Phone: +49 178 4909039
IBelger@EMXroyalty.com
Neither the TSX Venture Exchange nor its Regulation Services Provider (as that term is defined in policies of the TSX Venture Exchange) accepts responsibility for the adequacy or accuracy of this release
Forward-Looking Statements
This news release may contain “forward-looking statements” that reflect the Company’s current expectations and projections about its future results. These forward-looking statements may include statements regarding perceived merit of properties, exploration results and budgets, mineral reserves and resource estimates, work programs, capital expenditures, timelines, strategic plans, market prices for precious and base metal, or other statements that are not statements of fact. When used in this news release, words such as “estimate,” “intend,” “expect,” “anticipate,” “will”, “believe”, “potential” and similar expressions are intended to identify forward-looking statements, which, by their very nature, are not guarantees of the Company’s future operational or financial performance, and are subject to risks and uncertainties and other factors that could cause the Company’s actual results, performance, prospects or opportunities to differ materially from those expressed in, or implied by, these forward-looking statements. These risks, uncertainties and factors may include, but are not limited to unavailability of financing, failure to identify commercially viable mineral reserves, fluctuations in the market valuation for commodities, difficulties in obtaining required approvals for the development of a mineral project, increased regulatory compliance costs, expectations of project funding by joint venture partners and other factors.
Readers are cautioned not to place undue reliance on these forward-looking statements, which speak only as of the date of this news release or as of the date otherwise specifically indicated herein. Due to risks and uncertainties, including the risks and uncertainties identified in this news release, and other risk factors and forward-looking statements listed in the Company’s MD&A for the quarter ended March 31, 2022 (the “MD&A”), and the most recently filed Annual Information Form (“AIF”) for the year ended December 31, 2021, actual events may differ materially from current expectations. More information about the Company, including the MD&A, the AIF and financial statements of the Company, is available on SEDAR at www.sedar.com and on the SEC’s EDGAR website at www.sec.gov.
Appendix 1
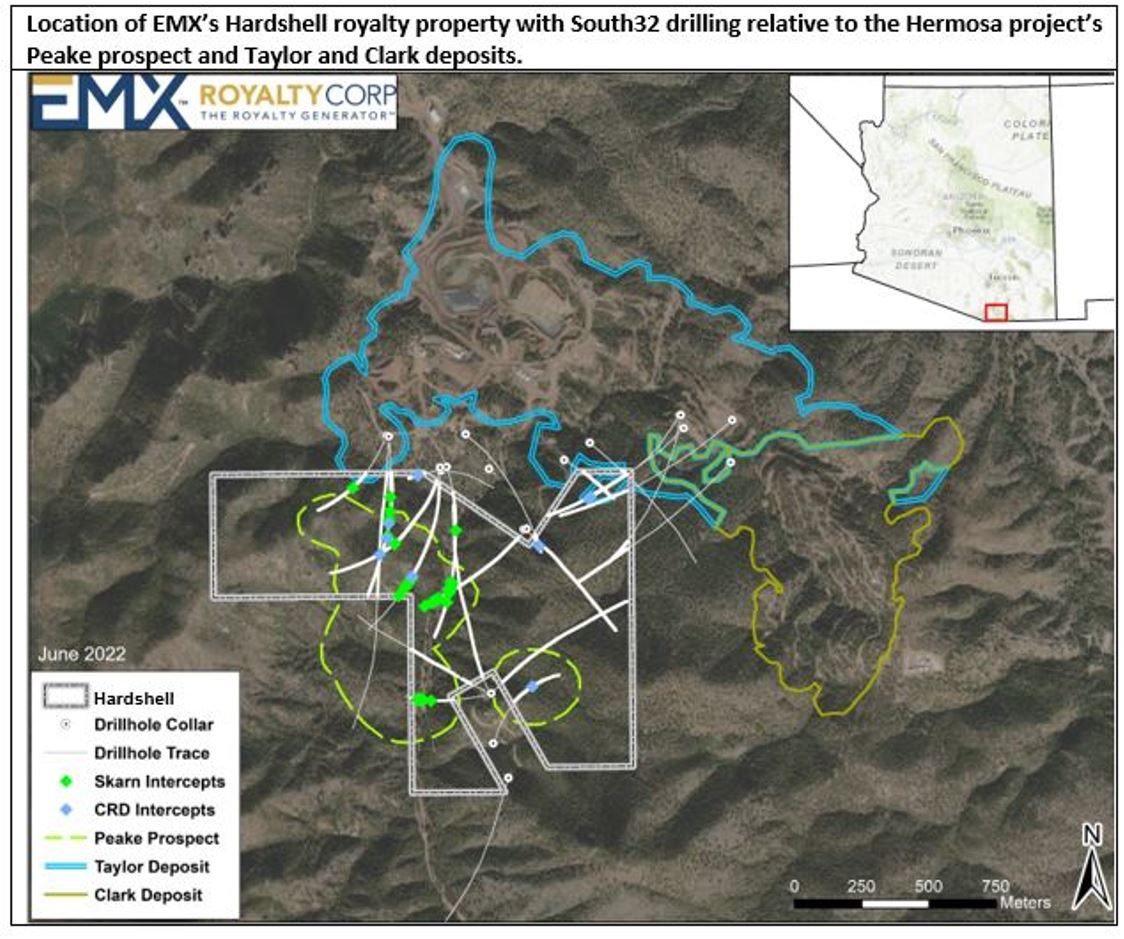
Location of EMX’s Hardshell royalty property with South32 drilling relative to the Hermosa project’s Peake prospect and Taylor and Clark deposits.
To view an enhanced version of this graphic, please visit:
https://orders.newsfilecorp.com/files/1508/128370_figure2.jpg
1 South32 Quarterly Report March 2022.
2 South32 market release dated July 21, 2021 (titled “Hermosa Project – Mineral Resource Estimate Update”) and Annual Report 2021 dated September 21, 2021.
3 South32 market release dated January 17, 2022 (titled “Hermosa Project Update”).
Figure 1

Figure 2

Figure 3
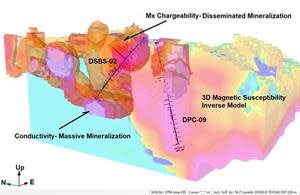
Figure 4
- Hole DSBS-02 was drilled across the interpreted Santa Barbara feeder zone to a length of 1,023.4m, corresponding to a vertical depth of 745m. Notably, 67% of the overall length of this hole yielded reportable intersections which collectively average 100.42 g Ag eq/t.
- Grade shell modelling in Leapfrog of the Santa Barbara Deposit indicates that, as of this date, drilling has defined a higher-grade zone >90 g Ag eq/t that is approximately 750m along strike, 650m wide and extends to a depth of at least 750m. This deposit remains open in all directions.
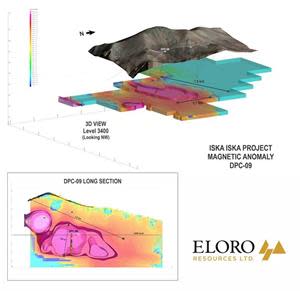
- Hole DPC-09, the first of a series of holes to test the major inverse magnetic susceptibility anomaly in the Porco area, intersected 41 reportable mineralized intersections representing 29% of this 1,124.4m long hole that collectively average 94.73 g Ag eq/t. Significantly, the last reportable intersection near the bottom of this hole is higher in Ag and Sn with very low values of Zn and Pb. This is typical of what is seen in the Santa Barbara area in the transition from the Ag-Zn-Pb-Sn polymetallic mineralization to the more tin dominant mineralization at depth.
- The coincidence of the magnetic inverse model with the chargeability/conductivity model from Bore Hole Induced Polarization (BHIP) surveys provides a powerful tool to outline very prospective drill targets. BHIP surveys to a depth of almost 1,000m show that the conductivity increases with depth at Santa Barbara, indicating that the potential feeder zone could be even more substantive.
TORONTO, June 14, 2022 (GLOBE NEWSWIRE) — Eloro Resources Ltd. (TSX-V: ELO; OTCQX: ELRRF; FSE: P2QM) (“Eloro”, or the “Company”) is pleased to announce assay results from an additional two (2) diamond drill holes from its on-going drilling program at the Iska Iska silver-tin polymetallic project in the Potosi Department, southern Bolivia. Hole DSBS-02 is a surface hole drilled due north at -300 from the south side of Santa Barbara across the higher-grade likely feeder zone. Hole DPC-09 is the first in a series of drill holes to test the extensive magnetic susceptibility anomaly in the Porco area in the southern part of the property. Four drills including three surface drills and one underground drill are focussed on completing drilling in the Santa Barbara Resource Definition Drilling Area. The underground drill is on its last hole and will be moved to surface to complete drill holes requested by Micon International Limited (“Micon”) to better define the preliminary open pit to be utilized for the maiden mineral resource estimate targeted for completion at the end of Q3.
Overall, the Company has completed 59,499m in 95 drill holes to-date, including four holes in progress, as shown in Figure 1. Tables 1 and 2 list significant assay results for the two drill holes reported. Prices used for calculating Ag equivalent grades are as outlined in Eloro’s February 1, 2022, press release. Table 3 summarizes drill holes with assays pending. Highlights are as follows:
Santa Barbara Mineral Resource Definition Target Area – Surface Drilling
Hole DSBS-02 was collared in the south part of the Santa Barbara target at an azimuth of 00 and dip of -300 to test across the likely higher grade feeder zone for the Santa Barbara Ag-Sn polymetallic mineralization. This hole was drilled to a length of 1,023.4m, corresponding to a vertical depth of 745m, with 67% of the hole containing reportable intersections which collectively average 100.42 g Ag eq/t. Significant results are as follows:
- 146.65 g Ag eq/t (10.74 g Ag/t, 1.01 g Au/t, 0.31% Zn, 0.11% Pb and 0.06% Sn) over 88.66m from 319.36m to 408.02m, including a higher-grade section of:
- 737.33 g Ag eq/t (51.11 g Ag/t, 6.82 g Au/t, 0.24% Zn, 0.31% Pb, and 0.19% Sn) over 12.06m from 355.39m to 367.45m. Notably, this is the strongest gold-bearing intercept encountered to date at Iska Iska.
- 131.86 g Ag eq/t (21.38 g Ag/t, 0.06 g Au/t, 0.25% Zn, 0.24% Pb and 0.14% Sn) over 104.38m from 531.22m to 635.60m, including higher-grade sections of:
- 224.16g Ag eq/t (50.19 g Ag/t, 0.02 g Au/t, 0.41% Zn, 0.38% Pb and 0.24%Sn) over 26.79m from 543.09 to 569.88,
- 300.90g Ag eq/t (35.33 g Ag/t, 0.20 g Au/t, 0.26 % Zn. 0.78% Pb and 0.36% Sn) over 10.38m from 590.84m to 601.22m.
- 78.94 g Ag eq/t (12.77 g Ag/t, 0.06 g Au/t, 0.66% Zn, 0.12% Pb and 0.04% Sn) over 235.43m from 670.27m to 905.70m which included higher grade sections of:
- 494.81 g Ag eq/t (170.06 g Ag/t, 0.49 g Au/t, 0.37% Zn, 0.35 %Pb, 0.40 % Sn) over 4.46m from 722.70m to 727.16m,
- 181.64 g Ag eq/t (76.79 g Ag/t, 0.19g Au/t, 0.76% Zn, 0.23 %Pb and 0.07% Sn) over 4.35m from 770.73m to 775.08m,
- 120.54 g Ag eq/t (15.50g Ag/t, 0.01 g Au/t, 1.57% Zn, 0.34% Pb and 0.03%Sn) over 10.96 m from 800.44m to 811.40m, and
- 129.54 g Ag eq/t (6.44 g Ag/t, 0.08 g Au/t, 2.03% Zn, 0.34% Pb and 0.02% Sn) over 8.94 m from 853.28m to 862.22m.
Dr. Bill Pearson, P.Geo. Eloro’s Executive Vice President, Exploration commented: “Grade shell modelling in Leapfrog of the Santa Barbara Deposit by the Iska Iska geological team indicates that drilling has defined a higher-grade zone >90 g Ag eq/t that extends approximately 750m along strike, is 650m wide and extends to a depth of at least 750m. The deposit is open in all directions. Figure 2 shows the Santa Barbara deposit model relative to the extensive 3D inverse magnetic susceptibility model, demonstrating the remarkable scale of this enormous mineralized system.”
Dr. Pearson continued: “Figure 3 is a 3D model combining the inverse magnetic susceptibility model and the bore hole induced polarization (“BHIP”) chargeability and conductivity data that clearly shows how this new hole DSBS-02 intersected significant mineralization in an area of an extensive chargeability anomaly coincident with a magnetic high. In the lower part of this hole conductivity increases substantially and indicates that this hole stopped just short of a likely area of massive sulphide mineralization. The coincidence of the magnetic inverse model with the chargeability/conductivity model provides a powerful tool to outline very prospective drill targets. BHIP surveys to a depth of almost 1,000m show that the conductivity increases with depth at Santa Barbara, indicating that the potential feeder zone could be even more substantive.”
Dr. Chris Hale, P.Geo., Chief Geophysicist for Eloro said: “Geophysical targeting is very useful at Iska Iska because the mineralization often occurs in association with pyrrhotite, a mineral that affects both the electrical and magnetic properties of the host rock. BHIP helps to correlate mineralization between the holes because it samples a much larger volume around the borehole than each assay does. BHIP provides two electrical measures of the quantity of mineralization; chargeability that measures the amount of disseminated mineralization and conductivity that shows when the strength of mineralization reaches the point of “connectivity”, resulting in a conductive deposit. This explains the strong spatial correlation between the grade of mineralization and the chargeable volume around DSBS-02. We do not yet have BHIP surveys under DPC-09 but this hole was targeted to test a peak in the magnetic susceptibility that was modelled using surface magnetic data. The excellent spatial coincidence between the mineralized intersection and the peak in magnetic susceptibility gives us confidence that we will also likely intersect mineralization when we drill the larger magnetic susceptibility zone that is modelled deeper and farther to the south.”
Porco Area – Magnetic Inverse Anomaly – Surface Drilling
Hole DPC-09 is the first of a series of holes to test the major inverse magnetic susceptibility anomaly in the Porco area, as outlined in Eloro’s March 1, 2022 press release. This hole intersected 41 reportable mineralized intersections, representing 29% of this 1,124.4m long hole that collectively averaged 94.73 g Ag eq/t. Highlights include:
- 143.47 g Ag eq/t (10.67 g Ag/t, 0.25 g Au/t, 1.90 % Zn, 0.23%Pb, 0.09% Cu and 0.01% Sn) over 11.96m from 363.57 to 375.53m
- 84.46 g Ag eq/t (6.52 g Ag/t, 0.03 g Au/t, 1.13% Zn, 0.37% Pb and 0.01% Sn) over 10.63m from 410.09 to 420.72m
- 79.46 g Ag eq/t (4.47 g Ag/t, 0.02 g Au/t, 1.12% Zn, 0.08 %Pb and 0.03 % Sn) over 42.55m from 740.63m to 783.18m.
- 82.64 g Ag eq/t (3.48 g Ag/t, 0.05 g Au/t, 0.50% Zn, 0.09% Pb, and 0.08% Sn) over 57.34m from 798.15m to 855.49m including a higher grade section of:
- 127.94 g Ag eq/t (3.37 g Ag/t, 0.05 g Au/t, 0.50% Zn,0.12% Pb and 0.16% Sn) over 12.02m from 798.15 to 810.17m,
- 96.13 g Ag eq/t (8.14 g Ag/t, 0.15 g Au/t, 0.40% Zn, 0.11% Pb and 0.09% Sn) over 14.83m from 972.51m to 987.34m,
- 69.88 g Ag eq/t (8.73 g Ag/t, 0.11 g Au/t, 0.22% Zn, 0.05% Pb and 0.06% Sn) over 40.24m from 1045.82m to 1086.06m including a higher grade section of
- 100.05 g Ag eq/t (16.71 g Ag/t, 0.08 g Au/t, 0.35% Zn, 0.06% Pb and 0.09% Sn) over 13.25m from 1068.37 to 1081.62m
- 163.35 g Ag eq/t (48.35 g Ag/t, 0.12 g Au/t, 0.05% Zn, 0.05% Pb, 0.09% Cu and 0.15% Sn) over 5.95m from 1114.63m to 1120.58m
As shown in Figure 4, this hole intersected a very extensive inverse magnetic susceptibility anomaly which, at elevation 3,400m, extends for approximately 1.6km along strike by 700m wide with a vertical extent of approximately 750m. The 3,400m elevation is approximately 100m above the valley floor. Significantly, the last reportable intersection near the bottom of the hole is higher in Ag and Sn with very low values of Zn and Pb. This is typical of what is seen in the Santa Barbara area in the transition from the Ag-Zn-Pb-Sn polymetallic mineralization to the more tin dominant mineralization at depth.
Table 1: Significant Results, Surface Diamond Drilling, Santa Barbara Resource
Definition Target Area as at June 14, 2022.
| SANTA BARBARA RESOURCE DEFINITION TARGET ZONE | ||||||||||||
| SURFACE DIAMOND DRILLING | ||||||||||||
| Hole No. | From (m) | To (m) | Length (m) | Ag | Au | Zn | Pb | Cu | Sn | Bi | Cd | Ag eq |
| g/t | g/t | % | % | % | % | % | % | g/t | ||||
| DSBS-02 | 7.84 | 24.44 | 16.60 | 1.36 | 0.01 | 0.00 | 0.01 | 0.00 | 0.07 | 0.001 | 0.001 | 44.49 |
| 116.64 | 119.75 | 3.11 | 11.60 | 0.01 | 0.04 | 0.54 | 0.03 | 0.04 | 0.001 | 0.001 | 58.37 | |
| 140.40 | 153.60 | 13.20 | 0.72 | 0.01 | 1.11 | 0.15 | 0.00 | 0.01 | 0.001 | 0.003 | 60.89 | |
| 170.99 | 174.10 | 3.11 | 0.74 | 0.01 | 0.99 | 0.07 | 0.01 | 0.01 | 0.001 | 0.004 | 53.28 | |
| 181.52 | 210.84 | 29.32 | 1.61 | 0.01 | 1.04 | 0.11 | 0.02 | 0.02 | 0.001 | 0.004 | 64.93 | |
| Incl. | 204.66 | 209.33 | 4.67 | 4.63 | 0.01 | 2.69 | 0.35 | 0.06 | 0.04 | 0.002 | 0.008 | 172.94 |
| 235.15 | 255.86 | 20.71 | 5.43 | 0.06 | 1.83 | 0.55 | 0.01 | 0.09 | 0.003 | 0.007 | 168.10 | |
| 270.96 | 281.72 | 10.76 | 7.62 | 0.04 | 0.49 | 0.22 | 0.02 | 0.06 | 0.001 | 0.002 | 78.72 | |
| 290.74 | 293.71 | 2.97 | 15.53 | 0.05 | 0.06 | 0.14 | 0.04 | 0.05 | 0.001 | 0.001 | 59.26 | |
| 298.26 | 308.78 | 10.52 | 26.84 | 0.11 | 0.05 | 0.09 | 0.08 | 0.02 | 0.001 | 0.001 | 65.08 | |
| 319.36 | 408.02 | 88.66 | 10.74 | 1.01 | 0.31 | 0.11 | 0.01 | 0.06 | 0.008 | 0.001 | 146.65 | |
| Incl. | 355.39 | 367.45 | 12.06 | 51.11 | 6.82 | 0.24 | 0.31 | 0.02 | 0.19 | 0.047 | 0.001 | 737.33 |
| 438.04 | 447.12 | 9.08 | 3.67 | 0.21 | 1.53 | 0.10 | 0.01 | 0.05 | 0.001 | 0.007 | 126.04 | |
| 469.60 | 483.12 | 13.52 | 1.17 | 0.06 | 0.59 | 0.05 | 0.01 | 0.06 | 0.001 | 0.002 | 69.05 | |
| 489.14 | 517.80 | 28.66 | 6.00 | 0.02 | 0.55 | 0.34 | 0.01 | 0.04 | 0.001 | 0.002 | 68.65 | |
| 522.20 | 525.40 | 3.20 | 6.50 | 0.04 | 0.27 | 0.12 | 0.01 | 0.07 | 0.001 | 0.001 | 66.24 | |
| 531.22 | 635.60 | 104.38 | 21.38 | 0.06 | 0.25 | 0.24 | 0.01 | 0.14 | 0.002 | 0.001 | 131.86 | |
| Incl. | 543.09 | 569.88 | 26.79 | 50.19 | 0.02 | 0.41 | 0.38 | 0.01 | 0.24 | 0.001 | 0.001 | 224.16 |
| Incl. | 590.84 | 601.22 | 10.38 | 35.33 | 0.20 | 0.26 | 0.78 | 0.01 | 0.36 | 0.006 | 0.001 | 300.90 |
| 647.53 | 658.12 | 10.59 | 10.57 | 0.01 | 0.23 | 0.28 | 0.01 | 0.14 | 0.001 | 0.001 | 116.41 | |
| 670.27 | 905.70 | 235.43 | 12.77 | 0.06 | 0.66 | 0.12 | 0.01 | 0.04 | 0.005 | 0.002 | 78.94 | |
| Incl. | 722.70 | 727.16 | 4.46 | 170.06 | 0.49 | 0.37 | 0.35 | 0.04 | 0.40 | 0.104 | 0.003 | 494.81 |
| Incl. | 770.73 | 775.08 | 4.35 | 76.79 | 0.19 | 0.76 | 0.23 | 0.01 | 0.07 | 0.013 | 0.001 | 181.64 |
| Incl. | 800.44 | 811.40 | 10.96 | 15.50 | 0.01 | 1.57 | 0.34 | 0.01 | 0.03 | 0.001 | 0.004 | 120.54 |
| Incl. | 853.28 | 862.22 | 8.94 | 6.44 | 0.08 | 2.03 | 0.34 | 0.01 | 0.02 | 0.001 | 0.006 | 129.54 |
| 917.78 | 931.28 | 13.50 | 7.05 | 0.03 | 0.78 | 0.13 | 0.01 | 0.04 | 0.002 | 0.002 | 73.10 | |
| 953.83 | 955.34 | 1.51 | 16.00 | 0.01 | 0.48 | 1.24 | 0.01 | 0.19 | 0.001 | 0.001 | 191.90 | |
| 964.38 | 971.84 | 7.46 | 5.96 | 0.01 | 0.53 | 0.14 | 0.01 | 0.04 | 0.001 | 0.001 | 62.14 | |
| 980.80 | 1022.40 | 41.60 | 38.97 | 0.08 | 0.24 | 0.34 | 0.03 | 0.10 | 0.007 | 0.001 | 132.38 |
Note: True width of the mineralization is not known at the present time, but based on the current understanding of the relationship between drill orientation/inclination and the mineralization within the breccia pipes and the host rocks such as sandstones and dacites, it is estimated that true width ranges between 70% and 90% of the down hole interval length but this will be confirmed by further drilling and geological modelling.
Chemical symbols: Ag= silver, Au = gold, Zn = zinc, Pb = lead, Cu = copper, Sn = tin, Bi = bismuth, Cd = cadmium and g Ag eq/t = grams silver equivalent per tonne. Quantities are given in percent (%) for Zn, Pb Cu, Sn, Bi and Cd and in grams per tonne (g/t) for Ag, Au and Ag eq.
Metal prices and conversion factors used for calculation of g Ag eq/t (grams Ag per grams x metal ratio) are as follows (Prices updated as of February 1, 2022, to more accurately reflect current metal prices):
| Element | Price $US (per kg) | Ratio to Ag |
| Ag | $722.56 | 1.0000 |
| Sn | $42.56 | 0.0589 |
| Zn | $3.30 | 0.0046 |
| Pb | $2.33 | 0.0032 |
| Au | $57,604.00 | 79.7221 |
| Cu | $9.68 | 0.0134 |
| Bi | $12.76 | 0.0177 |
| Cd | $5.50 | 0.0076 |
In calculating the intersections reported in this press release a sample cutoff of 30 g Ag eq/t was used with generally a maximum dilution of 3 continuous samples below cutoff included within a mineralized section unless more dilution is justified geologically.
The equivalent grade calculations are based on the stated metal prices and are provided for comparative purposes only, due to the polymetallic nature of the deposit. Metallurgical tests are in progress by Blue Coast Ltd. to establish levels of recovery for each element reported but currently the potential recovery for each element has not yet been established. While there is no assurance that all or any of the reported concentrations of metals will be recoverable, Bolivia has a long history of successfully mining and processing similar polymetallic deposits which is well documented in the landmark volume “Yacimientos Metaliferos de Bolivia” by Dr. Osvaldo R. Arce Burgoa, P.Geo.
Table 2: Significant Results, Surface Diamond Drilling, Porco Area – Magnetic Inverse
Anomaly as at June 14, 2022.
| PORCO AREA – MAGNETIC INVERSE ANOMALY | ||||||||||||
| SURFACE DIAMOND DRILLING | ||||||||||||
| Hole No. | From (m) | To (m) | Length (m) | Ag | Au | Zn | Pb | Cu | Sn | Bi | Cd | Ag eq |
| g/t | g/t | % | % | % | % | % | % | g/t | ||||
| DPC-09 | 0.00 | 5.42 | 5.42 | 1.89 | 0.01 | 0.00 | 0.01 | 0.00 | 0.15 | 0.001 | 0.001 | 94.64 |
| 104.28 | 109.27 | 4.99 | 1.67 | 0.01 | 0.97 | 0.04 | 0.03 | 0.01 | 0.002 | 0.002 | 60.29 | |
| 162.18 | 172.74 | 10.56 | 0.64 | 0.03 | 0.84 | 0.07 | 0.01 | 0.01 | 0.002 | 0.003 | 54.18 | |
| 177.18 | 178.65 | 1.47 | 2.00 | 0.01 | 1.10 | 0.32 | 0.00 | 0.02 | 0.001 | 0.004 | 72.61 | |
| 195.31 | 196.80 | 1.49 | 3.00 | 0.01 | 0.81 | 0.41 | 0.00 | 0.01 | 0.001 | 0.003 | 59.66 | |
| 207.43 | 208.91 | 1.48 | 9.00 | 0.05 | 4.04 | 0.38 | 0.01 | 0.01 | 0.001 | 0.019 | 215.09 | |
| 211.94 | 213.44 | 1.50 | 0.30 | 0.01 | 1.04 | 0.07 | 0.01 | 0.01 | 0.001 | 0.003 | 55.60 | |
| 216.47 | 217.95 | 1.48 | 2.00 | 0.05 | 1.67 | 0.22 | 0.00 | 0.01 | 0.001 | 0.006 | 93.82 | |
| 270.53 | 271.99 | 1.46 | 8.00 | 0.03 | 3.61 | 0.20 | 0.05 | 0.01 | 0.001 | 0.018 | 194.48 | |
| 363.57 | 375.53 | 11.96 | 10.67 | 0.25 | 1.90 | 0.23 | 0.09 | 0.01 | 0.004 | 0.014 | 143.47 | |
| 392.13 | 393.60 | 1.47 | 8.00 | 0.02 | 1.52 | 0.34 | 0.01 | 0.01 | 0.001 | 0.007 | 94.61 | |
| 410.09 | 420.72 | 10.63 | 6.52 | 0.03 | 1.13 | 0.37 | 0.01 | 0.01 | 0.008 | 0.005 | 84.46 | |
| 425.11 | 426.61 | 1.50 | 12.00 | 0.01 | 1.11 | 0.34 | 0.02 | 0.01 | 0.001 | 0.004 | 81.08 | |
| 468.78 | 473.31 | 4.53 | 7.01 | 0.32 | 0.95 | 0.27 | 0.04 | 0.01 | 0.004 | 0.002 | 98.88 | |
| 621.97 | 624.95 | 2.98 | 29.49 | 0.15 | 7.91 | 0.48 | 0.02 | 0.05 | 0.001 | 0.027 | 451.93 | |
| 668.49 | 674.45 | 5.96 | 16.81 | 0.11 | 3.40 | 0.38 | 0.02 | 0.02 | 0.001 | 0.018 | 211.05 | |
| 684.96 | 686.38 | 1.42 | 3.00 | 0.34 | 0.31 | 0.11 | 0.02 | 0.01 | 0.001 | 0.001 | 58.23 | |
| 704.50 | 710.58 | 6.08 | 8.75 | 0.49 | 1.56 | 0.17 | 0.03 | 0.01 | 0.005 | 0.014 | 135.68 | |
| 731.63 | 736.15 | 4.52 | 11.62 | 0.11 | 2.11 | 0.36 | 0.02 | 0.06 | 0.001 | 0.013 | 165.28 | |
| 740.63 | 783.18 | 42.55 | 4.47 | 0.02 | 1.12 | 0.08 | 0.01 | 0.03 | 0.001 | 0.007 | 79.46 | |
| 798.15 | 855.49 | 57.34 | 3.48 | 0.05 | 0.50 | 0.09 | 0.02 | 0.08 | 0.002 | 0.002 | 82.64 | |
| Incl. | 798.15 | 810.17 | 12.02 | 3.37 | 0.03 | 0.50 | 0.12 | 0.00 | 0.16 | 0.001 | 0.002 | 127.94 |
| 865.90 | 868.95 | 3.05 | 1.50 | 0.02 | 0.54 | 0.06 | 0.02 | 0.06 | 0.001 | 0.002 | 69.83 | |
| 879.52 | 881.00 | 1.48 | 11.00 | 2.81 | 1.92 | 0.06 | 0.04 | 0.09 | 0.001 | 0.010 | 382.28 | |
| 896.05 | 897.54 | 1.49 | 3.00 | 0.02 | 0.51 | 0.10 | 0.01 | 0.09 | 0.001 | 0.001 | 83.89 | |
| 902.05 | 903.54 | 1.49 | 6.00 | 0.68 | 0.97 | 0.09 | 0.03 | 0.05 | 0.001 | 0.003 | 139.62 | |
| 911.06 | 912.57 | 1.51 | 2.00 | 0.03 | 0.31 | 0.02 | 0.01 | 0.09 | 0.001 | 0.001 | 71.60 | |
| 921.60 | 923.15 | 1.55 | 2.00 | 0.02 | 0.53 | 0.02 | 0.01 | 0.06 | 0.001 | 0.002 | 66.00 | |
| 924.64 | 926.07 | 1.43 | 3.00 | 0.01 | 0.59 | 0.01 | 0.01 | 0.05 | 0.001 | 0.003 | 59.22 | |
| 933.55 | 936.56 | 3.01 | 4.03 | 0.06 | 0.73 | 0.08 | 0.01 | 0.12 | 0.001 | 0.004 | 114.76 | |
| 941.08 | 944.06 | 2.98 | 4.47 | 0.03 | 0.22 | 0.06 | 0.01 | 0.06 | 0.001 | 0.001 | 58.50 | |
| 945.53 | 946.99 | 1.46 | 10.00 | 0.04 | 0.29 | 0.33 | 0.01 | 0.16 | 0.001 | 0.001 | 133.74 | |
| 951.57 | 953.02 | 1.45 | 20.00 | 0.01 | 0.71 | 0.52 | 0.01 | 0.03 | 0.001 | 0.003 | 86.78 | |
| 957.59 | 960.51 | 2.92 | 5.00 | 0.07 | 0.46 | 0.10 | 0.01 | 0.17 | 0.001 | 0.002 | 136.71 | |
| 972.51 | 987.34 | 14.83 | 8.14 | 0.15 | 0.40 | 0.11 | 0.02 | 0.09 | 0.002 | 0.002 | 96.13 | |
| 994.96 | 997.89 | 2.93 | 4.51 | 0.06 | 0.35 | 0.03 | 0.00 | 0.04 | 0.001 | 0.001 | 53.12 | |
| 1003.85 | 1005.30 | 1.45 | 14.00 | 0.07 | 0.69 | 0.03 | 0.02 | 0.03 | 0.005 | 0.002 | 74.61 | |
| 1014.23 | 1035.30 | 21.07 | 6.83 | 0.03 | 0.24 | 0.06 | 0.01 | 0.05 | 0.002 | 0.001 | 56.12 | |
| 1045.82 | 1086.06 | 40.24 | 8.73 | 0.11 | 0.22 | 0.05 | 0.02 | 0.06 | 0.003 | 0.001 | 69.88 | |
| Incl. | 1068.37 | 1081.62 | 13.25 | 16.71 | 0.08 | 0.35 | 0.06 | 0.04 | 0.09 | 0.004 | 0.001 | 100.05 |
| 1090.64 | 1093.67 | 3.03 | 9.53 | 0.19 | 0.09 | 0.02 | 0.03 | 0.05 | 0.005 | 0.001 | 62.69 | |
| 1104.16 | 1108.73 | 4.57 | 6.67 | 0.08 | 0.13 | 0.01 | 0.03 | 0.04 | 0.003 | 0.001 | 48.93 | |
| 1114.63 | 1120.58 | 5.95 | 48.38 | 0.12 | 0.05 | 0.05 | 0.09 | 0.15 | 0.018 | 0.001 | 163.35 |
See Note Table 1.
Photos accompanying this announcement are available at https://www.globenewswire.com/NewsRoom/AttachmentNg/b00bb012-0067-4bf2-b22f-fe3d2b787bae
Table 3: Summary of Diamond Drill Holes Completed with Assays Pending and Drill
Holes in Progress at Iska Iska from June 14, 2022 press release.
| SUMMARY DIAMOND DRILLING ISKA ISKA | |||||||
| Hole No. | Type | Collar Easting | Collar Northing | Elev | Azimuth | Angle | Hole length (m) |
| Surface Drilling Santa Barbara Breccia | |||||||
| DHK-24 | S | 205529.4 | 7656222.5 | 4153.4 | 225° | -60° | 926.3 |
| DHK-25 | S | 205526.9 | 7656384.7 | 4178.1 | 225° | -55° | 1,147.3 |
| Subtotal | 2,073.6 | ||||||
| Surface Drilling Northwest Extension Santa Barbara | |||||||
| DSB-16 | S | 204973.9 | 7657053.1 | 4147.1 | 225° | -65° | 862.0 |
| DSB-17 | S | 205136.3 | 7656770.8 | 4168.1 | 225° | -40° | 841.0 |
| DSB-18 | S | 205209.3 | 7656683.3 | 4172.5 | 225° | -40° | 890.4 |
| DSB-19 | S | 205209.9 | 7656684 | 4172.5 | 225° | -65° | 803.3 |
| DSB-23 | S | 205343.3 | 7656534.4 | 4176.1 | 225° | -40° | 863.2 |
| DSB-27 | S | 205044.5 | 7656982.6 | 4150 | 225° | -65° | 800.4 |
| DSB-28 | S | 205512 | 7656112 | 4162 | 225° | -60° | 851.4 |
| Subtotal | 5,911.7 | ||||||
| DSB-29 | S | 205511 | 7655966.9 | 4134 | 225° | -60° | In progress |
| DSB-30 | S | 205440.27 | 7656179.06 | 4192 | 225° | -60° | In progress |
| DSB-31 | S | 205652.403 | 7656108.35 | 4088 | 225° | -60° | In progress |
| Underground Drilling Santa Barbara Adit | |||||||
| DSBU-09 | UG | 205284.5 | 7656080 | 4167.1 | 90° | -60° | 904 |
| DSBU-10 | UG | 205284.5 | 7656080.0 | 4167.1 | 40° | -60° | 878.9 |
| Subtotal | 1,782.9 | ||||||
| DSBU-11 | UG | 205284.502 | 7656080.03 | 4167.117 | 180° | -55° | In progress |
| Surface Drilling South Extension Santa Barbara | |||||||
| DSBS-02 | S | 205300 | 7655563 | 4195 | 0° | -45° | 1,023.4 |
| Subtotal | 1,023.4 | ||||||
| Porco Target Area – Surface Drill Program Testing Magnetic Inverse Model | |||||||
| DPC-07 | S | 205090.1 | 7655340.9 | 4310 | 235° | -60° | 791.4 |
| DPC-08 | S | 205585 | 7655423.6 | 4089 | 235° | -65° | 800.4 |
| DPC-09 | S | 205456.7 | 7655516.6 | 4125 | 180° | -75° | 1,124.4 |
| DPC-10 | S | 205396.5 | 7655701.2 | 4148 | 225° | -60° | 1,088.4 |
| DPC-11 | S | 205456.7 | 7655516.6 | 4125 | 235° | -70° | 1,065.0 |
| DPC-12 | S | 205650 | 7655200 | 4100 | 235° | -70° | 941.4 |
| Subtotal | 5,811.0 | ||||||
| Mina 2 Target Area – Surface Drill Program Testing Magnetic Inverse Model | |||||||
| DM2-01 | S | 205944 | 7654211 | 3674 | 30° | -60° | 860.3 |
| Subtotal | 860.3 | ||||||
| TOTAL | 17,463.3 |
S = Surface UG=Underground; collar coordinates in metres; azimuth and dip in degrees. Total drilling completed since the start of the program on September 13, 2020 to December 17, 2021 is 40,468 m in 73 holes (26 underground holes and 47 surface holes). From re-start of drilling on January 17, 2022, an additional 19,031m have been completed bringing the overall total to 59,499 m in 95 drill holes (31 underground drill holes and 64 surface drill holes) including 4 holes in progress.
Qualified Person
Dr. Osvaldo Arce, P. Geo., General Manager of Eloro’s Bolivian subsidiary, Minera Tupiza S.R.L., and a Qualified Person in the context of NI 43-101, has reviewed and approved the technical content of this news release. Dr. Bill Pearson, P.Geo., Executive Vice President Exploration Eloro, and who has more than 45 years of worldwide mining exploration experience, including extensive work in South America, manages the overall technical program, working closely with Dr. Osvaldo Arce, P.Geo. Dr. Quinton Hennigh, P.Geo., Senior Technical Advisor to Eloro and Independent Technical Advisor, Mr. Charley Murahwi P. Geo., FAusIMM of Micon are regularly consulted on technical aspects of the project.
The magnetic survey was carried out by MES Geophysics using a GEM Systems GSM-19W Overhauser magnetometer. Dr. Chris Hale, P.Geo. and Mr. John Gilliatt, P.Geo. of Intelligent Exploration provided the survey design, preparation of the maps and interpretation from data processed and quality reviewed by Rob McKeown, P. Geo. of MES Geophysics. Messrs. Hale, Gilliatt and McKeown are Qualified Persons as defined under NI 43-101. Mr. Joe Mihelcic, P.Eng., P.Geo., of Clearview Geophysics, a QP under NI 43-101, completed the 3D magnetic inversion model in consultation with Dr. Hale and Mr. Gilliatt. The Borehole IP surveys are being carried out by MES Geophysics under the supervision of Dr. Hale and Mr. Gilliatt.
Eloro is utilizing both ALS and AHK for drill core analysis, both of whom are major international accredited laboratories. Drill samples sent to ALS are prepared in both ALS Bolivia Ltda’s preparation facility in Oruro, Bolivia and the preparation facility operated by AHK in Tupiza with pulps sent to the main ALS Global laboratory in Lima for analysis. More recently Eloro has had ALS send pulps to their laboratory at Galway in Ireland. Eloro employs an industry standard QA/QC program with standards, blanks and duplicates inserted into each batch of samples analyzed with selected check samples sent to a separate accredited laboratory.
Drill core samples sent to AHK Laboratories are prepared in a preparation facility installed and managed by AHK in Tupiza with pulps sent to the AHK laboratory in Lima, Peru. Au and Sn analysis on these samples is done by ALS Bolivia Ltda in Lima. Check samples between ALS and AHK are regularly done as a QA/QC check. AHK is following the same analytical protocols used as with ALS and with the same QA/QC protocols. Turnaround time continues to improve, as laboratories return to more normal staffing levels.
About Iska Iska
Iska Iska silver-tin polymetallic project is a road accessible, royalty-free property, wholly controlled by the Title Holder, Empresa Minera Villegas S.R.L. and is located 48 km north of Tupiza city, in the Sud Chichas Province of the Department of Potosi in southern Bolivia. Eloro has an option to earn a 99% interest in Iska Iska.
Iska Iska is a major silver-tin polymetallic porphyry-epithermal complex associated with a Miocene possibly collapsed/resurgent caldera, emplaced on Ordovician age rocks with major breccia pipes, dacitic domes and hydrothermal breccias. The caldera is 1.6km by 1.8km in dimension with a vertical extent of at least 1km. Mineralization age is similar to Cerro Rico de Potosí and other major deposits such as San Vicente, Chorolque, Tasna and Tatasi located in the same geological trend.
Eloro began underground diamond drilling from the Huayra Kasa underground workings at Iska Iska on September 13, 2020. On November 18, 2020, Eloro announced the discovery of a significant breccia pipe with extensive silver polymetallic mineralization just east of the Huayra Kasa underground workings and a high-grade gold-bismuth zone in the underground workings. On November 24, 2020, Eloro announced the discovery of the SBBP approximately 150m southwest of the Huayra Kasa underground workings.
Subsequently, on January 26, 2021, Eloro announced significant results from the first drilling at the SBBP including the discovery hole DHK-15 which returned 129.60 g Ag eq/t over 257.5m (29.53g Ag/t, 0.078g Au/t, 1.45%Zn, 0.59%Pb, 0.080%Cu, 0.056%Sn, 0.0022%In and 0.0064% Bi from 0.0m to 257.5m. Subsequent drilling has confirmed significant values of Ag-Sn polymetallic mineralization in the SBBP and the adjacent CBP. A substantive mineralized envelope which is open along strike and down-dip extends around both major breccia pipes. Continuous channel sampling of the Santa Barbara Adit located to the east of SBBP returned 442 g Ag eq/t (164.96 g Ag/t, 0.46%Sn, 3.46% Pb and 0.14% Cu) over 166m including 1,092 g Ag eq/t (446 g Ag/t, 9.03% Pb and 1.16% Sn) over 56.19m. The west end of the adit intersects the end of the SBBP.
Since the initial discovery hole, Eloro has released a number of significant drill results in the SBBP and the surrounding mineralized envelope which along with geophysical data has defined a target zone 1400m along strike, 500m wide and that extends to a depth of 600m. This zone is open along strike to the northwest and southeast as well as to the southwest. The Company’s nearer term objective is to outline a maiden NI 43-101 compliant mineral resource within this large target area. This work is advancing well with the mineral resource targeted to be completed in Q3 2022. Exploration drilling is also planned on other major targets in the Iska Iska Caldera Complex, including the Porco and Mina 2 areas.
About Eloro Resources Ltd.
Eloro is an exploration and mine development company with a portfolio of gold and base-metal properties in Bolivia, Peru and Quebec. Eloro has an option to acquire a 99% interest in the highly prospective Iska Iska Property, which can be classified as a polymetallic epithermal-porphyry complex, a significant mineral deposit type in the Potosi Department, in southern Bolivia. A recent NI 43-101 Technical Report on Iska Iska, which was completed by Micon International Limited, is available on Eloro’s website and under its filings on SEDAR. Iska Iska is a road-accessible, royalty-free property. Eloro also owns an 82% interest in the La Victoria Gold/Silver Project, located in the North-Central Mineral Belt of Peru some 50 km south of Barrick’s Lagunas Norte Gold Mine and Pan American Silver’s La Arena Gold Mine. La Victoria consists of eight mining concessions and eight mining claims encompassing approximately 89 square kilometres. La Victoria has good infrastructure with access to road, water and electricity and is located at an altitude that ranges from 3,150 m to 4,400 m above sea level.
For further information please contact either Thomas G. Larsen, Chairman and CEO or Jorge Estepa, Vice-President at (416) 868-9168.
Information in this news release may contain forward-looking information. Statements containing forward-looking information express, as at the date of this news release, the Company’s plans, estimates, forecasts, projections, expectations, or beliefs as to future events or results and are believed to be reasonable based on information currently available to the Company. There can be no assurance that forward-looking statements will prove to be accurate. Actual results and future events could differ materially from those anticipated in such statements. Readers should not place undue reliance on forward-looking information.
Neither the TSXV nor its Regulation Services Provider (as that term is defined in the policies of the TSXV) accepts responsibility for the adequacy or accuracy of this release.

VANCOUVER, BC / ACCESSWIRE / June 13, 2022 / Metallic Minerals (TSX.V:MMG | US OTCQB:MMNGF) (“Metallic Minerals“, or the “Company“) is pleased to report that, further to its news release dated April 26, 2022, it has filed on SEDAR a National Instrument 43-101 technical report, entitled, “Technical Report on the Inaugural Mineral Resource Estimate for the Allard Cu-Ag Porphyry Deposit, La Plata Project Southwestern Colorado USA”, has an effective date of April 3rd, 2022.
Scott Petsel, President of Metallic Minerals, stated, “The inaugural resource, which defined 889 million pounds of copper and 15 million ounces of silver (Inferred) at the Allard Cu-Ag Porphyry deposit, was a major milestone for the Company. The project team is currently working to finalize the next phases of exploration to include additional ground and airborne geophysical surveys, resource expansion drilling and the testing of newly identified targets representing both potential porphyry centers and high-grade silver-gold-telluride epithermal targets. We look forward to meeting with existing and potential shareholders this week during PDAC 2022 in Toronto June 13-15, as well as during the Yukon Mining Alliance Property Tours and Conference June 20-24 in Dawson City to discuss the exciting potential we see for both our flagship projects.”
The Technical Report was authored by Allan Armitage, Ph.D., P.Geo. of SGS Geologic Services (“SGS”) an independent Qualified Person and was prepared in accordance with National Instrument 43-101 Standards of Disclosure for Mineral Projects. The report is available under the Company’s profile at www.sedar.com and will also be available on the Company’s website at www.mmgsilver.com.
About SGS Geological Services
SGS Geological Services has an experienced and respected mining team focused on the domestic and international mining industry. The team has considerable experience in estimation and modeling of deposits of all types and practical and theoretical experience having realized hundreds of assessments for clients. The SGS team consists of a multi-disciplinary group of qualified persons with a strong understanding of the disclosure requirements for Mineral Resources set out in the NI 43-101 Standards of Disclosure for Mineral Projects (2016), CIM Definition Standards – For Mineral Resources and Mineral Reserves (2014) and a strong understanding of the CIM Estimation of Mineral Resources & Mineral Reserves Best Practice Guidelines 2019.
Upcoming Events
PDAC 2022 – Metallic will join fellow Metallic Group members Stillwater Critical Minerals (formerly Group Ten Metals) and Granite Creek Copper in Booth 2851 at the Prospectors and Developers Association Convention in Toronto, ON from June 13-15.
Yukon Property Tours & Conference – Metallic will be in Dawson City June 20-24 for the 2022 Yukon Property Tours, with President, Scott Petsel, and CEO, Greg Johnson, both visiting the Keno Silver Project for exploration planning.
About Metallic Minerals
Metallic Minerals Corp. is an exploration and development stage company, focused on silver, gold and copper in the high-grade Keno Hill and La Plata mining districts of North America. Our objective is to create shareholder value through a systematic, entrepreneurial approach to making exploration discoveries, growing resources and advancing projects toward development. Metallic Minerals has consolidated the second-largest land position in the historic Keno Hill silver district of Canada’s Yukon Territory, directly adjacent to Alexco Resource Corp’s operations, with more than 300 million ounces of high-grade silver in past production and current M&I resources. In addition, the Company recently announced the inaugural resource estimate for the La Plata silver-gold-copper project in southwestern Colorado. The Company also continues to add new production royalty leases on its holdings in the Klondike gold district in the Yukon. All three districts have seen significant mineral production and have existing infrastructure, including power and road access. Metallic Minerals is led by a team with a track record of discovery and exploration success on several major precious and base metal deposits, as well as having large-scale development, permitting and project financing expertise.
About the Metallic Group of Companies
The Metallic Group is a collaboration of leading precious and base metals exploration and development companies, with a portfolio of large, brownfields assets in established mining districts adjacent to some of the industry’s highest-grade producers of silver and gold, platinum and palladium, and copper. Member companies include Metallic Minerals in the Yukon’s high-grade Keno Hill silver district and La Plata silver-gold-copper district of Colorado, Granite Creek Copper in the Yukon’s Minto copper district, and Stillwater Critical Minerals in the Stillwater PGM-nickel-copper district of Montana and Kluane district in the Yukon. The founders and team members of the Metallic Group include highly successful explorationists formerly with some of the industry’s leading explorer/developers and major producers. With this expertise, the companies are undertaking a systematic approach to exploration and development using new models and technologies to facilitate discoveries in these proven, but under-explored, mining districts. Members of the Metallic Group have been recognized as recipients of awards for excellence in environmental stewardship demonstrating commitment to responsible resource development and appropriate ESG practices. The Metallic Group is headquartered in Vancouver, BC, Canada, and its member companies are listed on the Toronto Venture, US OTCQB and Frankfurt stock exchanges.
FOR FURTHER INFORMATION, PLEASE CONTACT:
Website: mmgsilver.com Phone: 604-629-7800
Email: cackerman@mmgsilver.com Toll Free: 1-888-570-4420
Forward-Looking Statements
Forward Looking Statements: This news release includes certain statements that may be deemed “forward-looking statements”. All statements in this release, other than statements of historical facts including, without limitation, statements regarding potential mineralization, historic production, estimation of mineral resources, the realization of mineral resource estimates, interpretation of prior exploration and potential exploration results, the timing and success of exploration activities generally, the timing and results of future resource estimates, permitting time lines, metal prices and currency exchange rates, availability of capital, government regulation of exploration operations, environmental risks, reclamation, title, and future plans and objectives of the company are forward-looking statements that involve various risks and uncertainties. Although Metallic Minerals believes the expectations expressed in such forward-looking statements are based on reasonable assumptions, such statements are not guarantees of future performance and actual results or developments may differ materially from those in the forward-looking statements. Forward-looking statements are based on a number of material factors and assumptions. Factors that could cause actual results to differ materially from those in forward-looking statements include failure to obtain necessary approvals, unsuccessful exploration results, changes in project parameters as plans continue to be refined, results of future resource estimates, future metal prices, availability of capital and financing on acceptable terms, general economic, market or business conditions, risks associated with regulatory changes, defects in title, availability of personnel, materials and equipment on a timely basis, accidents or equipment breakdowns, uninsured risks, delays in receiving government approvals, unanticipated environmental impacts on operations and costs to remedy same, and other exploration or other risks detailed herein and from time to time in the filings made by the companies with securities regulators. Readers are cautioned that mineral resources that are not mineral reserves do not have demonstrated economic viability. Mineral exploration and development of mines is an inherently risky business. Accordingly, the actual events may differ materially from those projected in the forward-looking statements. For more information on Metallic Minerals and the risks and challenges of their businesses, investors should review their annual filings that are available at www.sedar.com
Neither the TSX Venture Exchange nor its Regulation Services Provider (as that term is defined in the policies of the TSX Venture Exchange) accepts responsibility for the adequacy or accuracy of this release.
SOURCE: Metallic Minerals Corp.