Hear Andy go live and talk three topics that our important to the precious metals industry with a live Q&A for the last fifteen minutes Andy’s Live Wednesday, March 23 · 8:00 – 9:00pm Google Meet joining info Video call link: https://meet.google.com/dxu-apjt-qww
From the offices of John Carter, CEO, Silver Bullet Mines
Everyone,
I know I just put an update out just last week but things are really moving fast ! I will make it quick : Mill site is going great . Last major frame material arrived late but we got it now this week we can complete the screen frame and conveyor install then work on the chutes . Last but not least we are supposed to be drilling our well this week fingers crossed and then electrical. Do not anticipate a problem with supply as all components are NA made . Oh yah one other thing we are starting to stockpile ore at the millsite this week ! At the mine check out the new video on the website and on Utube. We now have our second access to The Treasure Room opened up and our destination is in sight ! Still lots of work but we are up for it ! On the Idaho front I said news is coming and it is . We are really making headway in anticipation of being on site in April! Really exciting. On the corporate front I hope you saw the pr on the financing really phenomenal that we were able to accomplish this ! Over 80% of the funding came from existing shareholders. We have a few stragglers that will close this week but we did it ! Also I hope you saw the Metaverse PR ? We need to get people excited about SBMI and one of those ways is to think outside the box and that’s what we are doing! Always pushing the rope uphill. As always make sure you check out the website https://urldefense.proofpoint.com/v2/url?u=http-3A__www.silverbulletmines.com&d=DwIFaQ&c=euGZstcaTDllvimEN8b7jXrwqOf-v5A_CdpgnVfiiMM&r=alXGId5R9cxJuK5Z2z9UoGUtk8y1SZGhzm32O97Bmm8&m=ssPVP96Apg6XkukZTR94OnbkffjURiTeGk9VyKFC45o&s=pkmiaBI8vz5SSc6bLpj5xcc6KreLnv2VSIFUK7XkV2U&e= , follow us on Twitter @bulletmines and Utube silver bullet mines . Again thank you for your continuing support! Enjoy!!!!
Burlington, Ontario–(Newsfile Corp. – March 11, 2022) – Silver Bullet Mines Corp. (TSXV: SBMI) (‘SBMI’ or ‘the Company’) announces it today has closed on $810,075 in its previously announced financing, bringing the total raised to date to $1,574,075.
This tranche represents 2,205,188 Units, with each Unit priced at $0.40 (forty cents). Each Unit consists of one common share and one full 60-cent (sixty cent) warrant with a 24-month term, with each such warrant being exercisable into a common share (the “Financing”). There is no acceleration clause on such warrants.
This is the second tranche of Units on which SBMI has closed. The first tranche of $764,000 was announced February 18, 2022. SBMI has further subscription agreements in hand which means SBMI will close on at least one further tranche before March 26, 2022.
These proceeds from the Financing will be used to complete the process of putting the Buckeye Silver Mine into pilot production in March, 2022, to advance work at the past-producing silver and gold Washington Mine in Idaho, and for working capital.
“This financing is a success for the company and the shareholders,” said A. John Carter, SBMI’s CEO. “Our original minimum target was $500,000 and the investors blew that number away. The funds raised in this financing have been budgeted to be more than enough to put the Buckeye Mine into production, to complete our mill, and to advance the Washington Mine to where it can be ready for mineral extraction.”
Referral fees may be paid to arm’s length persons in connection with the issuance of the Units. Other than the subscription agreement, there will be no further offering material provided to Existing Security Holders or others related to Financing. The subscription agreement is available at the Company’s website https://www.silverbulletmines.com/technical-corporatedocuments.
For further information, please contact:
John Carter Silver Bullet Mines Corp., CEO cartera@sympatico.ca +1 (905) 302-3843
Peter M. Clausi Silver Bullet Mines Corp., VP Capital Markets pclausi@brantcapital.ca +1 (416) 890-1232
Cautionary and Forward-Looking Statements
This news release contains certain statements that constitute forward-looking statements as they relate to SBMI and its subsidiaries. Forward-looking statements are not historical facts but represent management’s current expectation of future events, and can be identified by words such as “believe”, “expects”, “will”, “intends”, “plans”, “projects”, “anticipates”, “estimates”, “continues” and similar expressions. Although management believes that the expectations represented in such forward-looking statements are reasonable, there can be no assurance that they will prove to be correct.
By their nature, forward-looking statements include assumptions, and are subject to inherent risks and uncertainties that could cause actual future results, conditions, actions or events to differ materially from those in the forward-looking statements. If and when forward-looking statements are set out in this new release, SBMI will also set out the material risk factors or assumptions used to develop the forward-looking statements. Except as expressly required by applicable securities laws, SBMI assumes no obligation to update or revise any forward-looking statements. The future outcomes that relate to forward-looking statements may be influenced by many factors, including but not limited to: the impact of SARS CoV-2 or any other global virus; reliance on key personnel; the thoroughness of its QA/QA procedures; the continuity of the global supply chain for materials for SBMI to use in the production and processing of ore; shareholder and regulatory approvals; activities and attitudes of communities local to the location of the SBMI’s properties; risks of future legal proceedings; income tax matters; fires, floods and other natural phenomena; the rate of inflation; availability and terms of financing; distribution of securities; commodities pricing; currency movements, especially as between the USD and CDN; effect of market interest rates on price of securities; and, potential dilution. SARS CoV-2 and other potential global viruses create risks that at this time are immeasurable and impossible to define.
VANCOUVER, BC / ACCESSWIRE / March 7, 2022 / Group Ten Metals Inc. (TSX.V:PGE; OTCQB:PGEZF; FSE:5D32) (the “Company” or “Group Ten”) today reports partial results from four drill holes in a second tranche of drill results from the 14-hole resource expansion campaign completed at the Company’s flagship Stillwater West PGE-Ni-Cu-Co + Au project in Montana, USA.
Results continue to support the Company’s priority objective of expanding the October 2021 inaugural mineral resource estimates, with multiple wide and highly mineralized intervals returned in step-out drilling at three deposit areas that span seven kilometers of the 12-kilometer core project area (see Figure 1). Mineralization remains open to expansion along trend and at depth in all deposit areas.
2021 Drill Highlights:
IM2021-04 returned 115 meters of 0.37% Nickel Equivalent (“NiEq”), or 0.98 g/t Palladium Equivalent (“PdEq”) in a step-out hole to the south of the HGR deposit area at Iron Mountain. Mineralization starts at surface and runs the entire length that has been assayed to date, returning 369 meters at 0.22% NiEq (0.60 g/t PdEq). Assays are pending from the bottom 53 meters of the 422-meter hole. As shown in Table 1, successive contained higher-grade intervals include:
9.8 meters of 1.43 g/t 3E (Pd+Pt+Au) plus Ni, Cu, and Co values for total mineralization of 0.74% NiEq, or 1.98 g/t PdEq, and;
4.8 meters of 1.35% NiEq (equal to 3.60 g/t PdEq) as 0.74% Ni, 0.65% Cu, 0.07% Co, and 0.24 g/t 3E.
CM2021-03 returned 0.24% NiEq (0.63 g/t PdEq) across its entire 428-meter length in step-out drilling in the DR and Hybrid deposit area, including contained intervals at higher grades:
30.3 meters of 0.99 g/t 3E plus Ni, Cu, and Co values for a total of 0.51% NiEq, or 1.36 g/t PdEq;
0.50% NiEq, or 1.34 g/t PdEq, over 9.2 meters, and;
0.50% NiEq, or 1.34 g/t PdEq over 7.2 meters in a separate, lower interval.
CM2021-02 returned top-to-bottom mineralization with 333 meters at 0.23% NiEq, or 0.61 g/t PdEq, and successive higher-grade intervals including 17.0 meters of 0.51% NiEq (1.35 g/t PdEq).
These results, in addition to results released December 20, 2021, demonstrate significant potential to expand the October 2021 mineral resource estimates with multiple long intervals at grades well above the 0.20% NiEq cut-off grade used in that study. Moreover, as shown in Figures 2 and 3, these results provide important intercepts in step-out drill holes located up to several hundred meters from three of the five deposits modeled in the 2021 resource estimate:
CM2021-02 and -03 are two of six holes drilled in 2021 in the DR and Hybrid deposit area to step out from high-grade nickel sulphide-PGE mineralization identified in hole CM2020-04. In addition, these holes also returned potentially significant extensions of hybrid-type mineralization. Hole CM2021-01, reported December 20, 2021, was drilled south from the same pad as CM2021-02 and returned 728 meters of continuous sulphide mineralization at 0.27% NiEq, or 0.73 g/t PdEq, with multiple contained intervals at successively higher grades;
CZ2021-02 is one of two holes drilled in 2021 to step-out to the south of the CZ deposit in the area of wide, high-grade mineralization returned in hole CZ2019-01. Hole CZ2021-01, reported December 20, 2021, returned the widest high-grade intercept to date on the project being 63.7 meters of 0.92% NiEq (2.46 g/t PdEq) in this area;
IM2021-04 is one of six holes drilled in the HGR deposit area with the objective of expanding on wide intervals of high-grade mineralization returned in hole IM2019-03 which returned 272 meters at 0.43% NiEq (1.16 g/t PdEq) including 26.8 meters at 1.24 g/t 4E, 0.34% Ni, 0.15% Cu, and 0.019% Co, for 0.96% NiEq (2.55 g/t PdEq).
Assay results remain pending from eight holes, in addition to rhodium assay results on the majority of mineralized intervals reported to date.
Michael Rowley, President and CEO, commented, “The Stillwater Igneous Complex has been a large-scale American source of critical minerals for many decades, from chromium mined in the 1940s and 1950s to palladium and platinum that became essential in the 1980s. Our “Platreef-in-Montana” model is well-timed for what we believe will be the next phase of the Stillwater district’s contribution to critical mineral supply and commodity independence in the USA; world-class nickel and copper sulphide deposits, enriched in palladium, platinum, rhodium, gold, and cobalt and hosted in the lower Stillwater complex at Stillwater West.”
“This second tranche of drill results from our resource expansion campaign builds nicely upon the first results and continues to advance us towards expanded resource estimates in three of the five deposit areas on a priority basis. We continue to see demonstrations of a large mineralized system with an impressive endowment of eight of the commodities listed as critical by the US government in numerous holes across the 12-kilometer core project area. In addition, we continue to see good optionality on possible mining methods with successively higher-grade intervals contained within wider intervals of hundreds of meters of lower grade mineralization. We look forward to reporting additional drill results, exploration plans for 2022, and other news in the near term.”
Table 1 – Highlight Results from 2021 Expansion Drill Campaigns at the DR, Hybrid, CZ, and HGR Deposit Areas
Assays pending for rhodium and certain intervals denoted by *. Highlighted significant intercepts with grade-thickness values over 20 gram-meter PdEq are presented above, except as noted. Grade thickness values cover significant mineralized intervals with total palladium and nickel equivalent grade-thickness determined by multiplying the thickness of continuous mineralization (in meters) by the palladium equivalent grade (in grams/tonne) to provide gram-meter values (g-m) or by multiplying the nickel equivalent grade (in percent) to provide percent-meter values as shown. Total nickel and palladium equivalent calculations reflect total gross metal content using metals prices as follows (all USD): $7.00/lb nickel (Ni), $3.50/lb copper (Cu), $20.00/lb cobalt (Co), $1,000/oz platinum (Pt), $1,800/oz palladium (Pd), and $1,600/oz gold (Au). Equivalent values have not been adjusted to reflect metallurgical recoveries. Total metal equivalent values include both base and precious metals. In terms of dollar value, 0.20% nickel equates to a copper value of 0.40%, or a palladium value of 0.53 g/t, using the above metal values. Intervals are reported as drilled widths and are believed to be representative of the actual width of mineralization.
Upcoming News and Events
Jeffrey Christian, Managing Director of CPM Group, will join Group Ten CEO Michael Rowley for a live webinar on March 8, 2022, at 10:00 am PT (1:00 pm ET) for a concise overview and update on the Company and the Stillwater West PGE-Ni-Cu-Co+Au project with in-depth discussion on the global macro-economic picture, trends and implications for the broader commodities sector and critical minerals, in particular.
This will be an interactive event with participants encouraged to submit questions and comments throughout.
Group Ten is rapidly advancing the Stillwater West PGE-Ni-Cu-Co + Au project towards becoming a world-class source of low-carbon, sulphide-hosted nickel, copper, and cobalt, critical to the electrification movement, as well as key catalytic metals including platinum, palladium and rhodium used in catalytic converters, fuel cells, and the production of green hydrogen. Stillwater West positions Group Ten as the second-largest landholder in the Stillwater Complex, with a 100%-owned position adjoining and adjacent to Sibanye-Stillwater’s PGE mines in south-central Montana, USA1. The Stillwater Complex is recognized as one of the top regions in the world for PGE-Ni-Cu-Co mineralization, alongside the Bushveld Complex and Great Dyke in southern Africa, which are similar layered intrusions. The J-M Reef, and other PGE-enriched sulphide horizons in the Stillwater Complex, share many similarities with the highly prolific Merensky and UG2 Reefs in the Bushveld Complex. Group Ten’s work in the lower Stillwater Complex has demonstrated the presence of large-scale disseminated and high-sulphide battery metals and PGE mineralization, similar to the Platreef in the Bushveld Complex2. Drill campaigns by the Company, complemented by a substantial historic drill database, have delineated five deposits of Platreef-style mineralization across a core 12-kilometer span of the project, all of which are open for expansion into adjacent targets. Multiple earlier-stage Platreef-style and reef-type targets are also being advanced across the remainder of the 32-kilometer length of the project based on strong correlations seen in soil and rock geochemistry, geophysical surveys, geologic mapping, and drilling.
About Group Ten Metals Inc.
Group Ten Metals Inc. is a TSX-V-listed Canadian mineral exploration company focused on the development of high-quality platinum, palladium, nickel, copper, cobalt, and gold exploration assets in top North American mining jurisdictions. The Company’s core asset is the Stillwater West PGE-Ni-Cu-Co + Au project adjacent to Sibanye-Stillwater’s high-grade PGE mines in Montana, USA. Group Ten also holds the high-grade Black Lake-Drayton Gold project adjacent to Treasury Metals’ development-stage Goliath Gold Complex in northwest Ontario, and the Kluane PGE-Ni-Cu-Co project on trend with Nickel Creek Platinum‘s Wellgreen deposit in Canada‘s Yukon Territory.
About the Metallic Group of Companies
The Metallic Group is a collaboration of leading precious and base metals exploration companies, with a portfolio of large, brownfield assets in established mining districts adjacent to some of the industry’s highest-grade producers of silver and gold, platinum and palladium, and copper. Member companies include Metallic Minerals in the Yukon’s high-grade Keno Hill silver district and La Plata silver-gold-copper district of Colorado, Group Ten Metals in the Stillwater PGM-nickel-copper district of Montana, and Granite Creek Copper in the Yukon’s Minto copper district. The founders and team members of the Metallic Group include highly successful explorationists formerly with some of the industry’s leading explorers/developers and major producers. With this expertise, the companies are undertaking a systematic approach to exploration using new models and technologies to facilitate discoveries in these proven, but under-explored, mining districts. The Metallic Group is headquartered in Vancouver, BC, Canada, and its member companies are listed on the Toronto Venture, US OTC, and Frankfurt stock exchanges.
Note 1: References to adjoining properties are for illustrative purposes only and are not necessarily indicative of the exploration potential, extent or nature of mineralization or potential future results of the Company’s projects.
Note 2: Magmatic Ore Deposits in Layered Intrusions-Descriptive Model for Reef-Type PGE and Contact-Type Cu-Ni-PGE Deposits, Michael Zientek, USGS Open-File Report 2012-1010.
2021 drill core samples were analyzed by ACT Labs in Vancouver, B.C. Sample preparation: crush (< 7 kg) up to 80% passing 2 mm, riffle split (250 g) and pulverize (mild steel) to 95% passing 105 µm included cleaner sand. Gold, platinum, and palladium were analyzed by fire assay (1C-OES) with ICP finish. Selected major and trace elements were analyzed by peroxide fusion with 8-Peroxide ICP-OES finish to insure complete dissolution of resistate minerals. Following industry QA/QC standards, blanks, duplicate samples, and certified standards were also assayed.
Mr. Mike Ostenson, P.Geo., is the qualified person for the purposes of National Instrument 43-101, and he has reviewed and approved the technical disclosure contained in this news release.
Forward-Looking Statements
Forward Looking Statements: This news release includes certain statements that may be deemed “forward-looking statements”. All statements in this release, other than statements of historical facts including, without limitation, statements regarding potential mineralization, historic production, estimation of mineral resources, the realization of mineral resource estimates, interpretation of prior exploration and potential exploration results, the timing and success of exploration activities generally, the timing and results of future resource estimates, permitting time lines, metal prices and currency exchange rates, availability of capital, government regulation of exploration operations, environmental risks, reclamation, title, and future plans and objectives of the company are forward-looking statements that involve various risks and uncertainties. Although Group Ten believes the expectations expressed in such forward-looking statements are based on reasonable assumptions, such statements are not guarantees of future performance and actual results or developments may differ materially from those in the forward-looking statements. Forward-looking statements are based on a number of material factors and assumptions. Factors that could cause actual results to differ materially from those in forward-looking statements include failure to obtain necessary approvals, unsuccessful exploration results, changes in project parameters as plans continue to be refined, results of future resource estimates, future metal prices, availability of capital and financing on acceptable terms, general economic, market or business conditions, risks associated with regulatory changes, defects in title, availability of personnel, materials and equipment on a timely basis, accidents or equipment breakdowns, uninsured risks, delays in receiving government approvals, unanticipated environmental impacts on operations and costs to remedy same, and other exploration or other risks detailed herein and from time to time in the filings made by the companies with securities regulators. Readers are cautioned that mineral resources that are not mineral reserves do not have demonstrated economic viability. Mineral exploration and development of mines is an inherently risky business. Accordingly, the actual events may differ materially from those projected in the forward-looking statements. For more information on Group Ten and the risks and challenges of their businesses, investors should review their annual filings that are available at www.sedar.com.
Neither the TSX Venture Exchange nor its Regulation Services Provider (as that term is defined in the policies of the TSX Venture Exchange) accepts responsibility for the adequacy or accuracy of this release.
Vancouver, British Columbia–(Newsfile Corp. – February 24, 2022) – Riverside Resources Inc. (TSXV: RRI) (OTCQB: RVSDF) (FSE: 5YY) (“Riverside” or the “Company”), is pleased to report it has signed an agreement with Agnico Eagle Mines Limited (TSX:AEM) for the sale of the Pima Property located in Sonora, Mexico, where Riverside will receive cash and completes the pass through royalty transfer with Millrock Resources Inc (TSV:MRO). The Pima Project is part of the Santa Teresa Gold Mining District which includes the Santa Gertrudis Gold Mine owned by Agnico Eagle.
The Pima mineral concession is located inside Agnico’s property tenure and south of the known mine operation. Acquiring the Pima project allows Agnico to consolidate another part of its property concession and provides cash to Riverside. As a reminder, this project was originally added to Riverside’s portfolio as part of the 2019 purchase of the Millrock’s set of 5 (five) assets that included the Cuarentas and La Union projects (see press release September 11, 2019). This current transaction with Agnico allows Riverside to recover the amount of the Millrock transaction with profit and pass on the royalty to Millrock who has been a positive partner with the Company in Mexico.
Riverside is now focusing on its 100% owned projects within its portfolio, including the Cuarentas Gold Project, which is located southeast of Agnico’s property and where drilling in 2021 discovered gold in intermediate sulfidation veins. Riverside plans to progress further work at the Cuarentas project in 2022.
About Riverside Resources Inc.: Riverside is a well-funded exploration company driven by value generation and discovery. The Company has over $4.5M in cash, no debt and less than 75M shares outstanding with a strong portfolio of gold-silver and copper assets and royalties in North America. Riverside has extensive experience and knowledge operating in Mexico and Canada and leverages its large database to generate a portfolio of prospective mineral properties. In addition to Riverside’s own exploration spending, the Company also strives to diversify risk by securing joint-venture and spin-out partnerships to advance multiple assets simultaneously and create more chances for discovery. Riverside has properties available for option, with information available on the Company’s website at www.rivres.com.
ON BEHALF OF RIVERSIDE RESOURCES INC.
“John-Mark Staude”
Dr. John-Mark Staude, President & CEO
For additional information contact:
John-Mark Staude President, CEO Riverside Resources Inc. info@rivres.com Phone: (778) 327-6671 Fax: (778) 327-6675 Web: www.rivres.com
Certain statements in this press release may be considered forward-looking information. These statements can be identified by the use of forward-looking terminology (e.g., “expect”,” estimates”, “intends”, “anticipates”, “believes”, “plans”). Such information involves known and unknown risks — including the availability of funds, the results of financing and exploration activities, the interpretation of exploration results and other geological data, or unanticipated costs and expenses and other risks identified by Riverside in its public securities filings that may cause actual events to differ materially from current expectations. Readers are cautioned not to place undue reliance on these forward-looking statements, which speak only as of the date of this press release.
Neither the TSX Venture Exchange nor its Regulation Services Provider (as that term is defined in the policies of the TSX Venture Exchange) accepts responsibility for the adequacy or accuracy of this release.
VANCOUVER, BC / ACCESSWIRE / February 14, 2022 / Granite Creek Copper Ltd. (TSX.V:GCX | OTCQB:GCXXF) (“Granite Creek” or the “Company“) is pleased to announce that GoldSpot Discoveries Corp. (TSX.V: SPOT) (“GoldSpot”) has completed work for Granite Creek Copper’s Carmacks project. GoldSpot was engaged to apply their proprietary machine learning technology and geoscience expertise on the Company’s Carmacks deposit and Carmacks North target area, located in the high-grade Minto copper belt of Canada ‘s Yukon Territory.
GoldSpot is a mining-focused technology company that is working with some of the leading exploration and mining names in the industry to apply cutting edge Artificial Intelligence (“AI”) algorithms to significantly increase the efficiency and success rate of mineral exploration. Recent successes by GoldSpot with leading projects in exploration, development, and production-phases have demonstrated the potential to expand resources and make new discoveries using their advanced analytical technology.
Highlights of the Granite Creek-GoldSpot collaboration include:
Re-interpretation of geophysical data, and the use of GoldSpot’s in-house image processing approach GeoFEZ™, to produce new priority exploration targets
Statistical analysis of multi-element geochemical data to develop geochemical signatures of ‘mineralized lenses (rafts)’
Development of Machine Learning products to help vector towards previously unidentified mineralized horizons (rafts)
Generation of a revamped 3D geological model on the Carmacks deposit
Preliminary analysis of historic drill-core photos using GoldSpot’s LithoLens
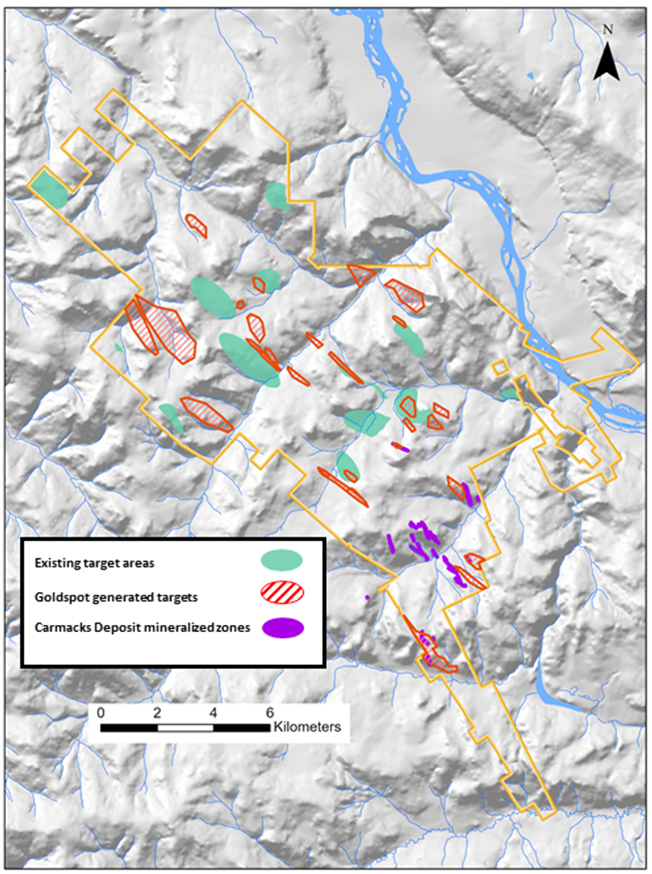
Granite Creek’s collaboration with GoldSpot produced several potential new targets (see figure 1), including sub- parallel zones adjacent to zones 147, 2000S and 13 at the Carmacks deposit identified by an analysis of the drillhole database. The spatial relationship between the geochemical signature of mineralization and associated depleted areas haloing mineralization identifies targets areas where a depletion halo occurs with no known associated mineralization. In addition to the target areas in and around the Carmacks deposit, new targets were developed in the Carmacks North area, based on a review of multiple geophysical techniques, including aeromagnetic surveys and induced polarity surveys with the interplay between the survey types generating and confirming the anomalies.
The outcome of this high-quality work provides the technical team at Granite Creek Copper with extremely valuable and necessary tools to assist in drill hole targeting for the 2022 campaign, including resource expansion, early-stage prospects, and exploratory targets on the highly prospective 176 square kilometer Carmacks copper-gold project.
Granite Creek President & CEO, Tim Johnson, stated, “The prospectively of the Carmacks project has been confirmed and expanded on by the excellent work completed by Goldspot. The number of new targets combined with the existing targets developed from historical data continues to support our assertion that there is a lot of discovery yet to be made on the property. Goldspot’s work has advanced our understanding of the property and will become an integral part in our planning for our 2022 exploration program. We look forward to discussing our plans for the upcoming field season and we are on track to deliver a significant update to the existing NI 43-101 mineral resource estimate in Q1, as expected.
Figure 1: Carmacks Project with GoldSpot defined target areas and excising targets and zones
Figure 2: Granite Creek geologist’s review core with Goldspot team at Carmacks Project
Options
Granite Creek also wises to announce that, subject to TSX Venture Exchange approval, it has granted 1,100,000 incentive stock options to directors, officers, employees, and consultants of the Company, under its long-term incentive plan. The options are exercisable for up to five years, expiring on February 14th, 2027, and each option will allow the holder to purchase one common share of the company at a price of $0.20 per share.
Shares for Debt
Further to its news release of December 23, 2021, the Company has completed the settlement of $86,162 of outstanding debt through the issuance of a total of 344,648 common shares of the Company at a deemed price of $0.25 per share. The shares issued are subject to a statutory hold period of four months and one day from the date of issuance, under applicable Canadian securities laws.
About Granite Creek Copper
Granite Creek, a member of the Metallic Group of Companies, is a Canadian exploration company focused on the 176 square kilometer Carmacks project in the Minto copper district of Canada’s Yukon Territory. The project is on trend with the high-grade Minto copper-gold mine, operated by Minto Metals Corp., to the north, and features excellent access to infrastructure with the nearby paved Yukon Highway 2, along with grid power within 12 km. More information about Granite Creek Copper can be viewed on the Company’s website at www.gcxcopper.com.
FOR FURTHER INFORMATION PLEASE CONTACT:
Timothy Johnson, President & CEO Telephone: 1 (604) 235-1982 Toll-Free: 1 (888) 361-3494 E-mail: info@gcxcopper.com
Ms. Debbie James, P.Geo., a qualified person for the purposes of National Instrument 43-101, has reviewed and approved the technical disclosure contained in this news release.
Forward-Looking Statements
This news release includes certain statements that may be deemed “forward-looking statements”. All statements in this release, other than statements of historical facts including, without limitation, statements regarding potential mineralization, historic production, estimation of mineral resources, the realization of mineral resource estimates, interpretation of prior exploration and potential exploration results, the timing and success of exploration activities generally, the timing and results of future resource estimates, permitting time lines, metal prices and currency exchange rates, availability of capital, government regulation of exploration operations, environmental risks, reclamation, title, and future plans and objectives of the company are forward-looking statements that involve various risks and uncertainties. Although Granite Creek Copper believes the expectations expressed in such forward-looking statements are based on reasonable assumptions, such statements are not guarantees of future performance and actual results or developments may differ materially from those in the forward-looking statements. Forward-looking statements are based on a number of material factors and assumptions. Factors that could cause actual results to differ materially from those in forward-looking statements include failure to obtain necessary approvals, unsuccessful exploration results, changes in project parameters as plans continue to be refined, results of future resource estimates, future metal prices, availability of capital and financing on acceptable terms, general economic, market or business conditions, risks associated with regulatory changes, defects in title, availability of personnel, materials and equipment on a timely basis, accidents or equipment breakdowns, uninsured risks, delays in receiving government approvals, unanticipated environmental impacts on operations and costs to remedy same, and other exploration or other risks detailed herein and from time to time in the filings made by the companies with securities regulators. Readers are cautioned that mineral resources that are not mineral reserves do not have demonstrated economic viability. Mineral exploration and development of mines is an inherently risky business. Accordingly, the actual events may differ materially from those projected in the forward-looking statements. For more information on Granite Creek Copper and the risks and challenges of their businesses, investors should review their annual filings that are available at www.sedar.com.
Neither the TSX Venture Exchange nor its Regulation Services Provider (as that term is defined in the policies of the TSX Venture Exchange) accepts responsibility for the adequacy or accuracy of this release.
Eureka Zone, where disseminated, magmatic sulfide minerals contain potentially economically recoverable nickel – copper – chromium – cobalt – platinum group elements over broad core lengths reported from historical drilling. The mineralization can be intermittently traced over a fifteen-kilometer-long strike length, and the historical intersections are up to 319.7 meters wide. If continuity can be proven, a very large tonnage deposit with high contained metal could result.
Canwell Zone, where very high grades of nickel, copper, and platinum group elements, including the rarer metals osmium, iridium, ruthenium, and rhodium are known from historical surface rock sampling and drilling.
VANCOUVER, British Columbia, Feb. 14, 2022 (GLOBE NEWSWIRE) — Millrock Resources Inc. (TSX-V: MRO, OTCQB: MLRKF) (“Millrock” or the “Company”) reports that it has assembled (by staking and an option agreement) an extensive land package in the Delta River Mining District in Alaska. The Nikolai Project (previously known by some as the MAN project) hosts nickel (Ni) – copper (Cu) – chromium (Cr) – cobalt (Co) – platinum group element (PGE) prospects. The claims show potential for delineation and development of a large tonnage deposit rich in Ni and other critical and strategic metals.
Millrock President and CEO Gregory Beischer commented: “Millrock is very pleased to have generated this nickel-dominant project which also has a variety of accompanying critical and strategic metals. Other companies such as Canada Nickel (current share price ~$2.33) and Group Ten Metals (current share price ~$0.36) have had strong market success by working on the development of geologically similar metal accumulations. Millrock aims to have similar success with the Nikolai project.”
One of the claim blocks covers the highly prospective and underexplored Eureka zone. At this location, a zone of disseminated Ni-Cu-Cr-Co-PGE mineralization was initially discovered by a subsidiary of Inco, and further expanded by Pure Nickel Inc. (now Galleon Gold Corp.) as reported in their press releases issued between 2007 and 2014. The claims had become open for staking and Millrock re-staked the land position.
Additionally, Millrock has entered into an option agreement on the Canwell claims where very high grades of nickel, copper and platinum group elements, including the rare platinum group metals osmium, iridium, ruthenium, and rhodium are known from historical surface rock sampling and drilling.
In total, Millrock’s Nikolai Project now consists of 146 State of Alaska Mining Claims covering 9,454 hectares in a highly prospective, underexplored ultramafic Ni-Cu-PGE mineralized belt (Figure 1). The claims are proximal to paved highways, and a network of gravel roads and trails afford ready access to the Canwell claim block. The City of Fairbanks lies approximately 200 kilometers to the northwest. The city of Delta Junction lies 130 km to the north of the project and has many services and amenities that support the Alaska mining community. The main Alaska power line and railway lie 150 kilometers to the west along the Denali Highway.
Remobilized high-grade Ni-Cu-PGE mineralization (typical in large Ni camps)
Volcanogenic Massive Sulfide (VMS – Besshi style) Cu (Zn-Pb) Au, Ag (analogy = Windy Craggy deposit, Canada)
Geologically, the project is located within the underexplored Wrangellia Terrane of Central Alaska. A characteristic component of this terrane is the Nikolai Greenstone, an extensive sequence of Late Triassic flood basalt rocks. Mafic and ultramafic intrusions, the source for the Nikolai Greenstone, along with Permian and Cretaceous felsic plutons, intruded Permian volcanic and volcaniclastic rocks. Wrangellia holds high potential for the discovery of economic magmatic sulfide deposits containing nickel, copper, cobalt, platinum, palladium, iridium, rhodium, osmium, ruthenium, gold, silver, lead, and zinc. Past producing mines and known deposits within the Wrangellia include Kennecott Copper Mines, Windy Craggy, Wellgreen-Nickel Shaw, and White River.
At the Eureka claim block, 104 State of Alaska mining claims were staked and are 100% owned by Millrock. Previously discovered Ni-Cu-PGE prospects form a northwest trend of soil and rock anomalies that contain elevated nickel, copper, platinum, palladium, and gold. After an initial discovery by Inco Ltd. in 1997, drilling by Pure Nickel Inc. and ITOCHU Corporation between 2008 and 2013 resulted in the discovery of a mineralized corridor called the Eureka Zone. More than fifteen kilometers in length, the disseminated Ni-Cu-PGE mineralization is associated with serpentinized mafic and ultramafic rocks (Table 1, Pure Nickel Inc., News Release, October 29th, 2013).
Based on these historical drill hole results, Millrock has identified a zone of mineralization (1,700m x 600m x 300m) that contains potentially economic concentrations of nickel, copper, cobalt, platinum, palladium, and gold. Additionally, Millrock postulates that higher grade mineralization may occur in embayment features at the base of the Eureka Zone, where heavy metals may accumulate during fractionation and crystallization of the ultramafic intrusion. Further drilling is warranted to confirm this hypothesis, along with in-fill drilling on the identified zone of mineralization, with the goal of defining a NI 43-101/JORC compliant resource. The company cautions they have not yet done sufficient exploration to test these hypotheses and there is no certainty that exploration will be successful in confirming these hypotheses.
Table 1. Historical Eureka Zone drillhole intersections reported by Pure Nickel (Press Release, October 29th, 2013)
Drill Hole
From (m)
To (m)
Estimated True Width (m)2
Ni (%)
Cu (%)
Co (%)
Pt (ppb)
Pd (ppb)
Au (ppb)
Ag (g/t)
MAN05-01A1,3
35.0
136.8
99.9
0.25
0.08
0.017
79
49
23
N/A
PNI-07-0021
100.6
388.0
246.4
0.21
0.02
0.016
54
37
11
0.20
FL-0041,3
108.8
242.6
114.7
0.20
0.05
0.015
52
35
24
0.00
PNI-10-028
201.0
488.4
226.4
0.21
0.07
0.016
38
82
10
0.41
PNI-10-029
172.1
399.0
211.8
0.21
0.04
0.015
34
77
6
0.36
PNI-10-030
377.7
729.5
284.6
0.20
0.06
0.016
39
74
11
0.44
PNI-10-0331
210.2
496.0
231.2
0.21
0.05
0.017
36
62
20
0.37
PNI-10-0351
192.4
471.0
224.6
0.23
0.06
0.017
39
81
8
0.40
PNI-12-0631
146.6
241.7
94.8
0.24
0.15
0.018
97
156
31
1.11
PNI-07-0011
397.5
659.1
211.6
0.24
0.08
0.018
50
114
10
0.56
PNI-10-0361
163.2
559.9
319.7
0.25
0.09
0.018
54
121
13
0.59
FL-0061,3
185.0
382.8
160.0
0.24
0.09
0.019
57
115
14
N/A
FL-0031,3
60.2
393.2
269.4
0.21
0.08
0.017
54
117
12
N/A
PNI-09-201,3
192.5
394.0
200.4
0.24
0.02
0.014
N/A
N/A
7
0.11
PNI-13-0691
160.3
373.7
205.2
0.24
0.09
0.017
61
122
19
0.72
PNI-13-071
99.4
247.0
146.8
0.17
0.08
0.015
46
76
14
0.57
And
328.0
342.7
14.6
0.19
0.16
0.016
64
127
21
1.19
PNI-13-072
217.0
432.5
162.6
0.20
0.08
0.017
49
104
13
0.45
PNI-13-0731
245.5
376.7
130.5
0.22
0.07
0.016
52
118
16
0.36
PNI-13-0741
198.0
453.2
253.9
0.20
0.06
0.016
38
91
11
0.34
PNI-13-0751
73.0
116.7
43.4
0.23
0.06
0.016
46
105
11
0.34
And
254.0
377.0
122.4
0.17
0.05
0.015
33
80
11
0.18
1 Incomplete intersection of the Eureka Zone
2 True widths estimated from hole angle and average dip of mineralization (46˚)
3 Not Continuously Sampled
N/A No Assays Reported
m = meters, ppb = parts per billion, g/t = grams per tonne
Note: The Millrock Qualified Person (QP) does not have access to all the drill logs and assay results and has no way to verify the results that were published by Pure Nickel. The Millrock QP was responsible for the team that drilled holes beginning with the “FL” prefix in his prior role as Exploration Manager for Inco Ltd. subsidiary company American Copper & Nickel Company. The Millrock QP has access to the drill logs and original assay certificates for these holes.
At the Canwell claim block, Millrock has entered into an agreement under which it has been granted the option to purchase the Canwell Ni-Cu-PGE project from property owner David Johnson. The property covers 42 State of Alaska mining claims (2,720 hectares). Millrock may purchase a 100% interest in the property by performing exploration work totaling US$5.0 million in value, making cash payments of US$500,000 and incremental payments of Millrock shares (5.0 million in total), and granting a buyable royalty. Millrock is making an initial share issuance of 1,000,000 Millrock shares and US$25,000 as the signing payment. The agreement with the owner is subject to approval by the TSX Venture Exchange.
Ni-Cu-PGE mineralization is associated with mafic and ultramafic dikes/sills at Canwell and are hypothesized as deep-rooted feeders to the same ultramafic sills located at Eureka. Felsic intrusions on the Canwell property have the potential to upgrade the Ni-Cu-PGE mineralization through remobilization processes. Ni-Cu-PGE prospects located by previous explorers include Emerick, Forbes, Odie, and Canwell Ridge. Millrock due diligence samples collected in 2020 and 2021 from the Forbes prospect returned results ranging from 0.36% to 4.05% copper, 0.14% to 2.87% nickel, 44 to 716.4 ppm cobalt, 0.051 to 0.114 ppm gold, 3.774 to 7.745 ppm silver, 0.471 to 0.848 ppm palladium, 0.179 to 0.373 ppm platinum, 0.023 to 0.074 ppm iridium, 0.010 to 0.060 ppm osmium, 0.017 to 0.054 ppm rhodium and below detection to 0.110 ppm ruthenium (Table 2).
Table 2. 2020-2021 Due diligence sample assay results from the Forbes prospect
Sample
Prospect
Ni (%)
Cu (%)
Co (ppm)
Pt (ppb)
Pd (ppb)
Au (ppb)
Ag (ppb)
Ir (ppb)
Os (ppb)
Rh (ppb)
Ru (ppb)
701325
Forbes
2.87
4.05
716.4
373
848
51.8
7745
23
10
17
<50
701326
Forbes
0.14
0.36
44
179
471
114.5
3774
74
60
54
110
The potential for Besshi-type Volcanic Massive Sulfides (VMS) also occurs on the property in the Permian volcanic and volcaniclastic rocks adjacent to the mafic and ultramafic sequence. VMS prospects located by previous explorers include Silver, Red Knob, Plateau, Canyon, Verona Pick, and Woody. Millrock due diligence samples collected in 2020 and 2021 on the Plateau and Woody prospects returned results ranging from 0.01 to10.74% copper, 1.51 to 5450.48 ppm lead, 20.1 to 3989.8 ppm zinc, below detection to 11.856 ppm gold, 0.116 to 189 ppm silver, and below detection to 0.177 ppm palladium (Table 3).
Table 3. 2020-2021 Due diligence sample assay results from the Plateau and Woody prospects
Sample
Prospect
Cu (%)
Pb (ppm)
Zn (ppm)
Au (ppb)
Ag (ppb)
Pd (ppb)
701333
Plateau
0.01
1376.18
675.0
10.5
919
24
701334
Plateau
10.74
37.02
95.3
561.3
82933
<10
701335
Plateau
4.12
22.16
190.9
14.7
16978
<10
701320
Woody
0.01
53.23
146.0
2.7
283
<10
701321
Woody
5.37
5450.48
3989.8
11855.8
53916
177
701322
Woody
3.56
596.68
971.6
332.4
189000
32
701323
Woody
4.85
2456.93
758.6
2317.3
37418
46
701410
Woody
0.01
4.30
65.1
16.7
241
<10
967701
Woody
0.01
2.64
20.1
1.3
116
<10
967702
Woody
0.08
1.51
44.4
<0.2
178
14
967703
Woody
0.02
6.70
83.8
2.7
337
<10
The assay results reported in Table 2 and 3 were collected by the Millrock QP and analyzed in 2021. The samples were analyzed at the Bureau Veritas Laboratory in Vancouver and Ontario, Canada using methods AQ252, MA404, and NA-PGE-S. The assay results confirm similar grades to those reported by historical workers.
Millrock has reviewed existing data and built a comprehensive exploration plan. The Company will seek joint venture partners to fund exploration and thereby earn an interest in the project.
Quality Control – Quality Assurance Millrock adheres to stringent Quality Assurance – Quality Control (“QA/QC”) standards. Rock samples are kept in a secure location at all times. Rock samples are assayed at the Bureau Veritas laboratory in Vancouver, Canada. Preparation and analysis methods are described in further detail here. The sample preparation method code being utilized for the current rock sampling program was PRP70-250. Analysis methods used include AQ252-EXT (Aqua Regia – ICP-ES/MS) for all samples, MA404 (Aqua Regia and Multi-Acid – AAS) for overlimit samples (>10,000 ppm Cu, >10,000 ppm Ni & >100,000 ppb Ag), and NA-PGE-S for rare PGE’s. For every 20 rock samples, a standard sample (Certified Reference Materials) of known copper concentration was analyzed. The Qualified Person is of the opinion that the results reported in this press release are reliable.
Qualified Person The scientific and technical information disclosed within this document has been prepared, reviewed, and approved by Gregory A. Beischer, President, CEO, and a director of Millrock Resources. Mr. Beischer is a qualified person as defined in NI 43-101.
About Millrock Resources Inc. Millrock Resources Inc. is a premier project generator to the mining industry. Millrock identifies, packages, and operates large-scale projects for joint venture, thereby exposing its shareholders to the benefits of mineral discovery without the usual financial risk taken on by most exploration companies. The company is recognized as the premier generative explorer in Alaska, holds royalty interests in British Columbia, Canada, and Sonora State, Mexico, is a significant shareholder of junior explorer ArcWest Exploration Inc. and owns a large shareholding in Resolution Minerals Limited. Funding for drilling at Millrock’s exploration projects is primarily provided by its joint venture partners. Business partners of Millrock have included some of the leading names in the mining industry: EMX Royalty, Coeur Explorations, Centerra Gold, First Quantum, Teck, Kinross, Vale, Inmet and, Altius as well as junior explorers Resolution, Riverside, PolarX, Felix Gold and Tocvan.
ON BEHALF OF THE BOARD “Gregory Beischer” Gregory Beischer, President & CEO
FOR FURTHER INFORMATION, PLEASE CONTACT: Melanee Henderson, Investor Relations Toll-Free: 877-217-8978 | Local: 604-638-3164 Twitter | Facebook | LinkedIn
Some statements in this news release may contain forward-looking information (within the meaning of Canadian securities legislation) including without limitation the intention to form joint ventures and to perform further exploration. These statements address future events and conditions and, as such, involve known and unknown risks, uncertainties and other factors which may cause the actual results, performance or achievements to be materially different from any future results, performance or achievements expressed or implied by the statements.
VANCOUVER, British Columbia, Feb. 14, 2022 (GLOBE NEWSWIRE) — Rover Metals Corp. (TSXV: ROVR) (OTCQB: ROVMF) (FRA:4XO) (“Rover” or the “Company”) is pleased to announce that Fundamental Research Corp. (“FRC”) has published their updated analyst report on Rover, dated January 2022. The report can be accessed here: https://www.researchfrc.com/company/rover-metals-corp/
FRC is one of the largest issuer-paid independent stock market research firms in the world, with a 17-year track record of covering 550+ companies. As of December 14, 2020, FRC’s top picks were up 55.6% on average since the initiation of coverage.
Judson Culter, CEO at Rover Metals, states “Rover Metals operates in a prolific mining jurisdiction in the southern Northwest Territories (“NT”). Three weeks ago, our neighbour, Fortune Minerals, announced its intent to acquire a refinery location north of Edmonton, AB. The infrastructure needed to bring the NT’s next gold mine into production, looks to soon be in place. The proposed location for Fortune’s NICO processing facility is located 40km northwest of Rover’s Cabin Gold Project, along the recently constructed Tlicho All Season Road (“TASR”). TASR opened to the public in November 2021. Rover plans to send samples of its drill core, from its Cabin Gold Project, to the lab for metallurgic testing in H1 of this year. The goal of the testing will be to determine the recovery flotation rates for the ore at Cabin. The next step, after receiving the metallurgical results, would be to work with Fortune to determine the possible economics of a processing agreement.
Winter Phase 3 Exploration, at our Cabin Gold Project, is expected to commence soon. The Company will be issuing an updating release in the coming days.”
Advisory Agreements The Company has issued 218,840 common shares, for the settlement of $12,500 in trade payables, for consulting services provided in Q4-2021, pursuant to pre-approved shares for services agreements. The services were provided by two advisors to the Company. Only one of these shares for services agreements will continue into 2022. The shares bear the minimum four-month regulatory hold period from the date of issuance.
Investor Relations The Company has renewed its agreement with Momentum Public Relations Inc. (“Momentum PR”) for investor relations services for another six months through to July 31, 2022. Pursuant to the renewal agreement, Momentum PR will be granted 600,000 incentive stock options, pursuant to the Company’s shareholder approved Stock Option Plan. The incentive stock options have been granted in three tranches as follows: 200,000 options with an exercise price of $0.06, 200,000 options with an exercise price of $0.075, and 200,000 options with an exercise price of $0.09.
About Rover Metals Rover is a precious metals exploration company specialized in North American precious metal resources, that is currently advancing the gold potential of its existing projects in the Northwest Territories of Canada (60th parallel). The Company commenced Phase 2 Exploration at its 100% owned Cabin Gold Project in Q3-2021, and the analysis and reporting of the Phase 2 Exploration work at Cabin Gold continues through to the date of this release. The Company anticipates commencing its Phase 3 Exploration Program at Cabin in March of this year.
ON BEHALF OF THE BOARD OF DIRECTORS “Judson Culter” Chief Executive Officer and Director
For further information, please contact: Email: info@rovermetals.com Phone: +1 (778) 754-2617
Statement Regarding Forward-Looking Information This news release contains statements that constitute “forward-looking statements.” Such forward-looking statements involve known and unknown risks, uncertainties and other factors that may cause Rover’s actual results, performance or achievements, or developments in the industry to differ materially from the anticipated results, performance or achievements expressed or implied by such forward-looking statements. Forward-looking statements are statements that are not historical facts and are generally, but not always, identified by the words “expects,” “plans,” “anticipates,” “believes,” “intends,” “estimates,” “projects,” “potential” and similar expressions, or that events or conditions “will,” “would,” “may,” “could” or “should” occur. There can be no assurance that such statements prove to be accurate. Actual results and future events could differ materially from those anticipated in such statements, and readers are cautioned not to place undue reliance on these forward-looking statements. Any factor could cause actual results to differ materially from Rover’s expectations. Rover undertakes no obligation to update these forward-looking statements in the event that management’s beliefs, estimates or opinions, or other factors, should change.
THE FORWARD-LOOKING INFORMATION CONTAINED IN THIS NEWS RELEASE REPRESENTS THE EXPECTATIONS OF THE COMPANY AS OF THE DATE OF THIS NEWS RELEASE AND, ACCORDINGLY, IS SUBJECT TO CHANGE AFTER SUCH DATE. READERS SHOULD NOT PLACE UNDUE IMPORTANCE ON FORWARD-LOOKING INFORMATION AND SHOULD NOT RELY UPON THIS INFORMATION AS OF ANY OTHER DATE. WHILE THE COMPANY MAY ELECT TO, IT DOES NOT UNDERTAKE TO UPDATE THIS INFORMATION AT ANY PARTICULAR TIME EXCEPT AS REQUIRED IN ACCORDANCE WITH APPLICABLE LAWS.
NEITHER THE TSX VENTURE EXCHANGE NOR ITS REGULATION PROVIDER (AS THAT TERM IS DEFINED IN THE POLICIES OF THE TSX VENTURE EXCHANGE) ACCEPTS RESPONSIBILITY FOR THE ADEQUACY OF THIS RELEASE.