VANCOUVER, British Columbia, Sept. 28, 2022 (GLOBE NEWSWIRE) — Rover Metals Corp. (TSXV: ROVR) (OTCQB: ROVMF) (FSE:4XO) (“Rover” or the “Company”) announces that further to its releases of August 16, 2022, September 14, 2022, and September 22, 2022, the Company has now received approval from the Toronto Venture Exchange for the Indian Mountain Lake (“IML”) option purchase agreement, and the milestone payments contained therein.
IML VMS Project The IML VMS Project has had exploration dating back to the 1940s and has a historical resource spread across four zones on the project. The BB Zone and Kennedy Lake Zone have a combined historic resource of 1,400,000 tons grading 10% combined zinc and lead with 3.5 OPT (ounces per ton) of silver*. Approximately 900 metres west of the BB Zone, the Kennedy Lake West Zone has a historic resource of 610,000 tons grading 1.15% copper*. About 8 km southeast of the BB Zone, the Susu Lake Zone, has a historical resource consisting of 142,500 tons grading 0.95% copper*.
The property is located approximately 195 km east-northeast of Yellowknife, NT, off the eastern arm of Great Slave Lake. Seasonal access relies upon fixed or rotor wing support. A right of way was cleared to the Project from Thompson Landing in the 1970s. If this right of way were to be brushed out, it would provide barge access at Thompson Landing, from Yellowknife, with ground transportation, considerably lowering any logistical costs. Future Government of Canada federally funded hydro-energy infrastructure could come close to the Project if the Taltson Hydro Dam expansion proceeds through the eastern arm of Great Slave Lake into Yellowknife. At the southwest-end of Great Slave Lake, Osisko Metals is gearing up to reopen the Pine Point Zinc-Lead Mine. At nearby Hay River, NT, there is a rail line to the Teck Resources Zinc Refinery in Trail, BC.
*These resources are historic in nature. Further drilling is needed to bring them up to CIM Definition Standards. The historic data has not been verified by Rover. The historic information is provided in the 2103 Assessment Report for Indian Mountain Lake which is in public record with the Government of the Northwest Territories.
Technical information has been approved by Gary Vivian, M.Sc., P.Geo., QP for the purposes of NI 43-101.
New Website An updated Corporate Fact Sheet, reflecting the addition of Nevada Lithium, is now available on our new website and a new corporate presentation will be available shortly.
Judson Culter, CEO at Rover Metals, states “Zinc and Copper, along with Lithium are the future, and fundamental to the growth of our company. However, we’re not abandoning our precious metals roots. Greenstone belts in northern Canada are well known for their abundance of gold and silver. The IML greenstone belt is comprised of 31,000 acres, and the historic base metal resource is coming from just three percent of the land package. The historic BB Zone and historic Kennedy Lake Zone include a historic resource of 4,900,000 ounces of high-grade silver. We believe the existing silver endowment is indicative of the potential for the remainder of the 30,000 acres of greenstone belt.”
About Rover Metals Rover is a publicly traded junior mining company that trades on the TSXV under symbol ROVR, on the OTCQB under symbol ROVMF, and on the FSE under symbol 4XO. The Company is now developing a diverse portfolio of mineral resource projects: (1) Nevada Claystone Lithium; (2) Zinc-Copper-Lead-Silver in NT, Canada; as well as (3) Gold in NT, Canada. The Company is exclusive to the mining jurisdictions of Canada and the U.S.
ON BEHALF OF THE BOARD OF DIRECTORS “Judson Culter” Chief Executive Officer and Director
For further information, please contact: Email: info@rovermetals.com Phone: +1 (778) 754-2617
Statement Regarding Forward-Looking Information This news release contains statements that constitute “forward-looking statements.” Such forward-looking statements involve known and unknown risks, uncertainties and other factors that may cause Rover’s actual results, performance or achievements, or developments in the industry to differ materially from the anticipated results, performance or achievements expressed or implied by such forward-looking statements. Forward-looking statements are statements that are not historical facts and are generally, but not always, identified by the words “expects,” “plans,” “anticipates,” “believes,” “intends,” “estimates,” “projects,” “potential” and similar expressions, or that events or conditions “will,” “would,” “may,” “could” or “should” occur. There can be no assurance that such statements prove to be accurate. Actual results and future events could differ materially from those anticipated in such statements, and readers are cautioned not to place undue reliance on these forward-looking statements. Any factor could cause actual results to differ materially from Rover’s expectations. Rover undertakes no obligation to update these forward-looking statements in the event that management’s beliefs, estimates or opinions, or other factors, should change.
THE FORWARD-LOOKING INFORMATION CONTAINED IN THIS NEWS RELEASE REPRESENTS THE EXPECTATIONS OF THE COMPANY AS OF THE DATE OF THIS NEWS RELEASE AND, ACCORDINGLY, IS SUBJECT TO CHANGE AFTER SUCH DATE. READERS SHOULD NOT PLACE UNDUE IMPORTANCE ON FORWARD-LOOKING INFORMATION AND SHOULD NOT RELY UPON THIS INFORMATION AS OF ANY OTHER DATE. WHILE THE COMPANY MAY ELECT TO, IT DOES NOT UNDERTAKE TO UPDATE THIS INFORMATION AT ANY PARTICULAR TIME EXCEPT AS REQUIRED IN ACCORDANCE WITH APPLICABLE LAWS.
NEITHER THE TSX VENTURE EXCHANGE NOR ITS REGULATION PROVIDER (AS THAT TERM IS DEFINED IN THE POLICIES OF THE TSX VENTURE EXCHANGE) ACCEPTS RESPONSIBILITY FOR THE ADEQUACY OF THIS RELEASE.
Three widely spaced reconnaissance holes up to 600 metres apart were drilled to test the Trap target (“Trap”), a north-northwest trending structurally controlled corridor with evidence of overprinting porphyry veins and late-stage carbonate base metal (“CBM”) veins. All three holes intersected highly altered porphyry rocks with multiple sheeted and stockwork veinlets, with hole TRC-1 yielding the most robust results as follows:
Recent geological mapping and sampling has materially extended the strike length of the Trap target to 1.75 kilometres, and it remains open in both directions along strike for further expansion.
TORONTO, Sept. 27, 2022 /CNW/ – Collective Mining Ltd. (TSXV: CNL) (OTCQX: CNLMF) (“Collective” or the “Company”) is pleased to announce diamond drill hole and rock chip assay results from reconnaissance work, which outlines a new discovery referred to as the Trap mineralized corridor (“Trap”). Trap is located approximately four kilometres to the north-northeast of the Company’s flagship Apollo discovery and is one of seven grassroots generated porphyry and porphyry-related targets at its flagship Guayabales project located in Caldas, Colombia. Apollo is a newly discovered high-grade copper-gold-silver porphyry-related breccia with previously announced intercepts including the discovery hole APC-2, which intersected 207.15 metres @ 2.68 g/t AuEq and APC-8, which intersected 265.75 metres @ 2.44 g/t gold equivalent (See press releases dated August 10th and September 13th respectively). As part of its fully funded 20,000+ metre drill program for 2022, there are currently three diamond drill rigs operating at the Apollo target.
“This new and early-stage discovery at the Trap target highlights the immensely prospective nature of our Guayabales project. With slightly more than one year of exploration under our belt, our young Company, which is anchored by a core team of talented individuals, has drilled four new grassroot discoveries. Our priority remains the drilling and expanding of our flagship Main Breccia discovery at the Apollo target, but our reconnaissance exploration teams continue to identify new zones and targets with different styles of mineralization located within a four-kilometre by four-kilometre area hosting a cluster of porphyry and porphyry-related style targets. I am impressed with the continued drilling success at the Guayabales project. Our robust rate in making new discoveries at the project is virtually unparalleled in the mining industry and is a strong testament to the mineral endowment of this emerging mining district,” commented Ari Sussman, Executive Chairman.
Details (See Table 1 and Figures 1 – 3)
The Company recently completed three scout diamond drill holes plus additional channel chip sampling and geological mapping at the Trap target, a newly discovered structural corridor with details as follows:
Geology mapping and rock sampling highlights a north-northwest trending structural corridor superimposed on earlier porphyry related mineralization event and all hosted within quartz diorite rocks. Rock sampling of sporadic outcrops along the 1.75-kilometre mineralized corridor yielded 32 samples grading over 1 g/t gold (range 1 g/t Au to 10.7 g/t Au) with silver values up to 687 g/t and copper values up to 3.7%.
Three scout drill holes were completed in the central (TRC-1) and southern portion (VICE-1 & 2) of the trap corridor and returned the following significant intercepts:
In each hole the mineralization relates to an early gold-copper (chalcopyrite) phase linked with potassic alteration which is overprinted by a younger precious-polymetallic vein system associated with intense sericite alteration resulting in a white bleaching of the rock fabric. Veinlet systems include sheeted and stockwork forms in multiple different orientations.
Trap remains open in all directions and further reconnaissance work continues along this zone. A follow up drill program will ensue once additional data is collected, and targets are further refined.
The Company continues to prioritize the Apollo discovery due to the significant results intercepted to date with diamond drilling including hole APC-2, which intersected 207.15 metres @ 2.68 g/t AuEq and hole APC-8, which intersected 265.75 metres @ 2.44 g/t gold equivalent as announced in press releases dated August 10th, 2022, and September 13th respectively). Assay results are anticipated in the near term for four additional holes from Apollo with the following encouraging visual intercepts for two of the holes that targeted and successfully intersected the Main Breccia discovery:
Table 1: Assays Results
HoleID
From (m)
To (m)
Intercept (m)
Au (g/t)
Ag (g/t)
Cu %
AuEq (g/t) *
TRC-1
233.80
336.00
102.20
1.26
12
0.09
1.53
Incl
259.10
269.00
9.90
3.00
25
0.25
3.65
294.50
303.70
9.20
1.82
31
0.07
2.27
VICE-1
212.60
227.30
14.70
1.14
26
0.01
1.44
Incl
213.20
214.80
1.60
2.33
47
0.01
2.87
219.55
220.70
1.15
1.91
131
0.04
3.66
and
253.50
270.50
17.00
0.69
6
0.01
0.75
VICE-2
214.60
233.50
18.90
1.06
36
0.18
1.83
Incl
214.60
216.60
2.00
3.55
208
0.17
6.51
*AuEq (g/t) is calculated as follows: (Au (g/t) x 0.95) + (Ag g/t x 0.014 x 0.95) + (Cu (%) x 1.96 x 0.95) utilizing metal prices of Cu – US$4.00/lb, Ag – $20/oz and Au – US$1,400/oz and recovery rates of 95% for Au, Ag and Cu. Recovery rate assumptions are speculative as no metallurgical work has been completed to date.
** A 0.2 g/t AuEq cut-off grade was employed with no more than 15% internal dilution. True widths are unknown, and grades are uncut.
Figure 1: Plan View of the Guayabales Project Highlighting the Trap and Apollo Targets (CNW Group/Collective Mining Ltd.)
Figure 2: Plan View of Trap Highlighting Reconnaissance Drill Holes and Rock Samples Over 1 g/t AuEq (CNW Group/Collective Mining Ltd.)
Figure 3: Images of Drill Core for Trap Outlining Late Stage Porphyry Related CBM Veins in A and C, and Porphyry Mineralization in B. (CNW Group/Collective Mining Ltd.)
About Collective Mining Ltd.
To see our latest corporate presentation and related information, please visit www.collectivemining.com
Collective Mining is an exploration and development company focused on identifying and exploring prospective mineral projects in South America. Founded by the team that developed and sold Continental Gold Inc. to Zijin Mining for approximately $2 billion in enterprise value, the mission of the Company is to repeat its past success in Colombia by making significant new mineral discoveries and advance the projects to production. Management, insiders and close family and friends own nearly 45% of the outstanding shares of the Company and as a result, are fully aligned with shareholders.
The Company currently holds an option to earn up to a 100% interest in two projects located in Colombia. As a result of an aggressive exploration program at both the Guayabales and San Antonio projects, a total of seven major targets have been defined at Guayabales as well as another three at San Antonio. The Company has made a total of five significant grassroot discoveries at both projects with near-surface discovery holes at the Guayabales project yielding 302 metres at 1.11 g/t AuEq at the Olympus target, 163 metres at 1.3 g/t AuEq at the Donut target, 207.15 metres at 2.68 g/t AuEq, 180.6 metres at 2.43 g/t AuEg and 87.8 metres at 2.49 g/t AuEg at the Apollo target and most recently, 102.2m @ 1.53 g/t AuEq at the Trap target. At the San Antonio project, the Company intersected, from surface, 710 metres at 0.53 AuEq. (See related press releases on our website for AuEq calculations)
Qualified Person (QP) and NI43-101 Disclosure
David J Reading is the designated Qualified Person for this news release within the meaning of National Instrument 43-101 (“NI 43-101”) and has reviewed and verified that the technical information contained herein is accurate and approves of the written disclosure of same. Mr. Reading has an MSc in Economic Geology and is a Fellow of the Institute of Materials, Minerals and Mining and of the Society of Economic Geology (SEG).
Technical Information
Rock and core samples have been prepared and analyzed at SGS laboratory facilities in Medellin, Colombia and Lima, Peru. Blanks, duplicates, and certified reference standards are inserted into the sample stream to monitor laboratory performance. Crush rejects and pulps are kept and stored in a secured storage facility for future assay verification. No capping has been applied to sample composites. The Company utilizes a rigorous, industry-standard QA/QC program.
FORWARD-LOOKING STATEMENTS
This news release contains certain forward-looking statements, including, but not limited to, statements about the drill programs, including timing of results, and Collective’s future and intentions. Wherever possible, words such as “may”, “will”, “should”, “could”, “expect”, “plan”, “intend”, “anticipate”, “believe”, “estimate”, “predict” or “potential” or the negative or other variations of these words, or similar words or phrases, have been used to identify these forward-looking statements. These statements reflect management’s current beliefs and are based on information currently available to management as at the date hereof.
Forward-looking statements involve significant risk, uncertainties, and assumptions. Many factors could cause actual results, performance, or achievements to differ materially from the results discussed or implied in the forward-looking statements. These factors should be considered carefully, and readers should not place undue reliance on the forward-looking statements. Although the forward-looking statements contained in this news release are based upon what management believes to be reasonable assumptions, Collective cannot assure readers that actual results will be consistent with these forward-looking statements. These forward-looking statements are made as of the date of this news release, and Collective assumes no obligation to update or revise them to reflect new events or circumstances, except as required by law.
Neither the TSXV nor its Regulation Services Provider (as that term is defined in the policies of the TSXV) accepts responsibility for the adequacy or accuracy of this news release.
View looking east along the Eureka Zone within a large mafic-ultramafic magmatic complex. Note: Outline of the Ultramafic complex and Eureka zone are approximate.
Figure 2
Cross section view of Eureka Zone looking west, showing trace of holes FL-003 and FL-006 drilled by INCO in 1997.
VANCOUVER, British Columbia, Sept. 26, 2022 (GLOBE NEWSWIRE) — Millrock Resources Inc. (TSX-V: MRO) (“Millrock”) is pleased to report additional assay results from the sampling of historical core from the Eureka Zone at its 100% owned Nikolai Project, which hosts nickel (Ni) – copper (Cu) – cobalt (Co) – platinum group elements (PGE) prospects.
The Nikolai Project is located within Alaska’s Delta Mining District, approximately 130 kilometers by road south of Delta Junction and approximately 280 kilometers southeast of Fairbanks. The Eureka zone consists of disseminated Ni-Cu-Co-PGE mineralization initially discovered by a subsidiary of INCO, and further expanded by Pure Nickel Inc., as reported in their press releases ranging between 2007-2014 (see Figure 1).
The new assay results confirm the existence of low-grade Ni-Cu-Co-PGE mineralization immediately below and adjacent to the Core Eureka Zone (“CEZ”). The new zone is named the Lower Eureka Zone (“LEZ”). Along with the Upper Eureka Zone (“UEZ”), hole FL-003, drilled by INCO in 1997, intersected 346 meters of nickel mineralization, representing an approximate true width of 275 meters (Figure 2).
Millrock President and CEO Gregory Beischer commented: “From historical drilling, it is clear that a large volume of mineralized rock is present in the Eureka Zone. We believe the demand for nickel, cobalt, and other Critical and Strategic Metals will be exceptionally strong in the coming decades, making low-grade mineralization such as at Eureka of interest.”
About Eureka Zone: Based on historical drill hole results, Millrock identified a probable zone of mineralization measuring approximately 1,200 meters by 400 meters by 300 meters that contains low but potentially economic concentrations of nickel, copper, cobalt, platinum, palladium, and gold. Upon further review of the historical drill hole results, it was noted that only incomplete, non-continuous sampling was done in rocks intersected below the CEZ in hole FL-003. Drill core from this hole is preserved at the Geologic Materials Center in Anchorage, Alaska. Millrock collected and assayed samples from hole FL-003 in the suspected LEZ.
Highlights of the core sampling program include:
FL-003: 100 samples were assayed between hole depths of 273.4 meters and 412.1 meters
FL-003: mineralized interval of 135.6 meters grading 0.20% Ni, 0.05% Cu, 0.016% Co, 0.062 ppm Pd, 0.026 ppm Pt, and 0.014 ppm Au (including eight historical intervals).
Based on the newly received assays and historical assays from INCO holes FL-003 and FL-006, Millrock now interprets there to be three distinct domains (UEZ, CEZ, and LEZ) within the Eureka Zone, with an estimated true thickness at the drilled location of 275 meters (Figure 2).
These three domains consist of strongly serpentinized rocks:
1: Upper Eureka Zone (UEZ) – sulfur-poor peridotite, with disseminated sulfides.
Drillhole
To (m)
From (m)
Interval (m)
Ni (%)
Cu (%)
Co (%)
Pd (ppm)
Pt (ppm)
Au (ppm)
NiEq%
CuEq%
FL-003
60.2
173.7
113.5
0.20
0.05
0.014
0.101
0.046
0.007
0.32
0.65
FL-006
185.0
298.1
113.1
0.21
0.06
0.018
0.093
0.046
0.006
0.35
0.70
2: Core Eureka Zone (CEZ) – sulfur-rich peridotite and norite with disseminated sulfides.
Drillhole
To (m)
From (m)
Interval (m)
Ni (%)
Cu (%)
Co (%)
Pd (ppm)
Pt (ppm)
Au (ppm)
NiEq%
CuEq%
FL-003
173.7
271.9
98.2
0.22
0.12
0.019
0.141
0.064
0.018
0.42
0.85
FL-006
298.1
382.8
84.7
0.26
0.13
0.020
0.143
0.069
0.025
0.47
0.94
3: Lower Eureka Zone (LEZ) – sulfur-poor melanorite, with disseminated sulfides.
Drillhole
To (m)
From (m)
Interval (m)
Ni (%)
Cu (%)
Co (%)
Pd (ppm)
Pt (ppm)
Au (ppm)
NiEq%
CuEq%
FL-003
271.9
407.5
135.6
0.20
0.05
0.016
0.062
0.027
0.014
0.32
0.64
FL-006
Hole was ended prior to the LEZ
Note: NiEq% and CuEq% in this press release are calculated using the following metal prices: Nickel = $7.00/lb., Copper = $3.50/lb., Cobalt = $25.00/lb., Palladium = $1800/oz., Platinum = $900/oz. and Gold = $1600/oz.
In order to determine the deportment of nickel, copper, cobalt, and the precious metals, Millrock has submitted samples for laboratory analysis to identify which minerals are host to the valuable metals. From this information, an idea of metal recoverability can be gleaned. This will be very important information to have for a project of this type and scale.
Quality Control – Quality Assurance Millrock adheres to stringent Quality Assurance – Quality Control (“QA/QC”) standards. Core samples are kept in a secure location at all times. In this case, the samples were assayed at the Bureau Veritas laboratory in Vancouver, Canada. Preparation and analysis methods are described in further detail here. The sample preparation method code being utilized for the current sampling program was PRP70-250. Analysis methods used include MA370 – 4-acid digestion ICP-ES Finish and FA330 – Fire assay fusion Au, Pt, Pd by ICP-ES. For every 10 core samples, a blank, duplicate, or standard sample (Certified Reference Materials) of known copper, nickel, platinum, palladium, and gold concentration was analyzed. The Qualified Person is of the opinion that the results reported in this press release are reliable.
Historical assay results for core samples originally obtained by INCO in 1997 were used, in part, for the composite grade calculation for the LEZ in hole FL-003. Millrock has not independently verified the results. However, the drilling work completed in 1997 was done under the direct supervision of Gregory Beischer in his prior role as Exploration Manager for INCO. Mr. Beischer is the Qualified Person responsible for the contents of this disclosure. The historical samples were assayed at Chemex Lab, Inc. Appropriate quality control measures were in place.
Qualified Person The technical information within this document has been reviewed and approved by Gregory A. Beischer, President, CEO, and a director of Millrock. Mr. Beischer is a Qualified Person as defined in NI 43-101.
About Millrock Resources Inc. Millrock Resources Inc. is a premier project generator to the mining industry. Millrock identifies, packages, and operates large-scale projects for joint venture, thereby exposing its shareholders to the benefits of mineral discovery without the usual financial risk taken on by most exploration companies. The company is recognized as the premier generative explorer in Alaska, is a significant shareholder of junior explorer ArcWest Exploration Inc. and owns a large shareholding in Resolution Minerals Limited and Felix Gold. Funding for drilling at Millrock’s exploration projects is primarily provided by its joint venture partners. Business partners of Millrock have included some of the leading names in the mining industry: EMX Royalty, Centerra Gold, First Quantum, Teck, Kinross, Vale, Inmet and, Altius as well as junior explorers Resolution, Riverside, PolarX, Felix Gold, and Tocvan.
ON BEHALF OF THE BOARD “Gregory Beischer” Gregory Beischer, President & CEO
FOR FURTHER INFORMATION, PLEASE CONTACT: Melanee Henderson, Investor Relations Toll-Free: 877-217-8978 | Local: 604-638-3164 Twitter | Facebook | LinkedIn
Some statements in this news release contain forward-looking information. These statements address future events and conditions and, as such, involve known and unknown risks, uncertainties and other factors which may cause the actual results, performance, or achievements to be materially different from any future results, performance or achievements expressed or implied by the statements. Such factors include without limitation the completion of the ongoing metal deportment study, and the completion of planned expenditures, the ability to complete exploration programs on schedule and the success of exploration programs.
“NEITHER TSX VENTURE EXCHANGE NOR ITS REGULATION SERVICES PROVIDER (AS THAT TERM IS DEFINED IN THE POLICIES OF THE TSX VENTURE EXCHANGE) ACCEPTS RESPONSIBILITY FOR THE ADEQUACY OR ACCURACY OF THIS RELEASE.”
Plan View of the Guayabales Project Highlighting the Apollo Target
Figure 2
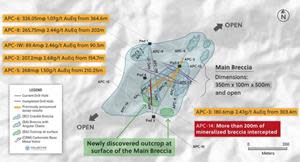
Plan View of the Main Breccia Discovery at the Apollo Target, Highlighting in Green the Newly Discovered Areas Where the Main Breccia Outcrops at Surface and Assay Results from Drill Holes Announced to Date
Figure 3
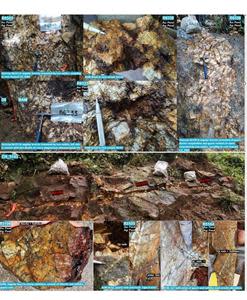
Photos of Various Surface Exposures of Angular Breccia Discovered to the North and East of Drill Pad 3
Recent geological mapping of rocks exposed by pad 3 drill access tracks have confirmed that the Main Breccia discovery at the Apollo Target daylights at surface north and east of the drill pad.
Recently completed drill hole, APC-14, which was drilled due north from pad 3, intersected the Main Breccia approximately 50 metres below the newly discovered northern outcrop. The hole cut more than 240 metres in total of favorable mineralization within the Main Breccia. Assay results for drill holes APC-11 through APC-14 are anticipated in the near term.
Visual observation of the shallow portion of drill hole APC-14, indicates a marked increase in chalcopyrite leading to the possibility that copper grades will be higher than seen elsewhere in the Main Breccia discovery. Additionally, the Company’s conviction that the porphyry source for the Main Breccia discovery lies due south has now been increased. As a result, exploratory drill holes are currently being finalized to test the southern porphyry target.
The discovery of the northern outcrop of the Main Breccia coupled with visual observations in drill hole APC-14 has extended the strike length of the system to the southwest by 35 metres. As a result, the Main Breccia discovery now measures 385 metres in strike by 100 metres across by 500 metres vertical and remains open in most directions for further expansion. With respect to the eastern outcrop, exploration drilling is required to determine its geometry and how it might connect with the Main Breccia as presently it lies outside of the current working model.
TORONTO, Sept. 22, 2022 (GLOBE NEWSWIRE) — Collective Mining Ltd. (TSXV: CNL) (OTCQX: CNLMF) (“Collective” or the “Company”) is pleased to announce that visual observations from outcrop mapping and shallow diamond drill hole APC-14, confirm that the Main Breccia discovery at the Apollo target (“Apollo”) daylights at surface over significant areas located to the north and east of drill pad 3 in the southern part of the discovery. Apollo is one of eight grassroot generated porphyry related targets at the Guayabales project, located in Caldas, Colombia. The Main Breccia discovery at Apollo is a high-grade, bulk tonnage copper-gold-silver porphyry-related breccia target with previously announced intercepts including hole APC-2, which intersected 207.15 metres @ 2.68 g/t AuEq and APC-8, which intersected 265.75 metres @ 2.44 g/t gold equivalent (See press releases dated August 10th and September 13th respectively). As part of its fully funded 20,000+ metre drill program for 2022, there are currently three diamond drill rigs operating at the Apollo target.
“Confirmation that the Main Breccia discovery at Apollo extends to surface enhances future possibilities for the project. Additionally, the fact that we see a noticeable increase in chalcopyrite near surface in the southern part of the Main Breccia discovery has our team excited that the porphyry source is nearby and is likely located beneath the robust, yet untested high-grade copper-in-soil anomaly located due south of drill pad 3. As a result, our team is busy planning exploration drill holes to test for the porphyry source with additional details to be provided shortly,” commented Ari Sussman, Executive Chairman.
Details (See Figures 1 to 3)
The Company recently completed geological mapping of new outcrop exposure created by tracks designed to service the drill rig at Pad 3 at Apollo. This work has confirmed exposure of mineralized angular breccia at surface as part of the Main Breccia discovery first announced by the Company on June 22, 2022. Logging visuals from recently completed diamond hole APC-14, which was drilled beneath a portion of the northern outcrop area, intersected mineralized angular breccia commencing at 50 metres vertically below surface. The following observations are highlighted:
During the last two weeks the surface exploration team has identified various outcrops with mineralized angular breccia locating north of Pad 3. Geological observations in all outcrop areas highlight mineralized angular breccia with iron oxides and sulfides within the matrix between the clasts with a partial overprint of sericite alteration. Two historical samples taken from a very limited exposure of breccia outcrop within this area returned 0.6 g/t gold,18 g/t silver and 0.1% copper and 4.1 g/t gold and 29.3 g/t silver respectively. The recently excavated surface exposures have been systematically sampled and assay results are pending.
Visual observations from a recently completed diamond hole, APC-14, drilled to the north from Pad 3 and directly underneath a portion of the northern outcrop area, highlighted the presence of angular breccia hosting pyrite and significant chalcopyrite mineralization in disseminations and as replacement within the breccia matrix. This hole intercepted mineralized breccia from approximately 84 metres downhole (50 metres vertical) down to 132 metres with a second zone commencing at 197 metres and finishing at approximately 391 metres downhole. Assay results for this and other holes are expected in the near term.
The Apollo target area, as defined to date by limited surface outcrops, rock sampling of CBM veins and available breccia exposures plus copper and molybdenum soil geochemistry, covers an 800-meter X 700-meter area. This Apollo target area hosts the Company’s new grassroots Main Breccia discovery which, based on recent drill results, measures up to 385 metres in strike length by 100 metres in width and 500 metres vertical. The Main Breccia discovery remains open in most directions and drill holes will continue to confirm and expand the discovery. Within the broader target there are additional, yet untested breccia, porphyry and vein targets which could facilitate further expansion at Apollo.
To see our latest corporate presentation and related information, please visit www.collectivemining.com
Collective Mining is an exploration and development company focused on identifying and exploring prospective mineral projects in South America. Founded by the team that developed and sold Continental Gold Inc. to Zijin Mining for approximately $2 billion in enterprise value, the mission of the Company is to repeat its past success in Colombia by making significant new mineral discoveries and advance the projects to production. Management, insiders and close family and friends own nearly 45% of the outstanding shares of the Company and as a result, are fully aligned with shareholders.
The Company currently holds an option to earn up to a 100% interest in two projects located in Colombia. As a result of an aggressive exploration program on both the Guayabales and San Antonio projects, a total of eight major targets have been defined. The Company has made significant grassroots discoveries at both projects with near-surface discovery holes at the Guayabales project yielding 302 metres at 1.11 g/t AuEq at the Olympus target, 163 metres at 1.3 g/t AuEq at the Donut target and recently, at the Apollo target, 207.15 metres at 2.68 g/t AuEq, 180.6 metres at 2.43 g/t AuEg and 87.8 metres at 2.49 g/t AuEg. At the San Antonio project, the Company intersected, from surface, 710 metres at 0.53 AuEq. (See related press releases on our website for AuEq calculations)
Qualified Person (QP) and NI43-101 Disclosure
David J Reading is the designated Qualified Person for this news release within the meaning of National Instrument 43-101 (“NI 43-101”) and has reviewed and verified that the technical information contained herein is accurate and approves of the written disclosure of same. Mr. Reading has an MSc in Economic Geology and is a Fellow of the Institute of Materials, Minerals and Mining and of the Society of Economic Geology (SEG).
Technical Information
Rock and core samples have been prepared and analyzed at SGS laboratory facilities in Medellin, Colombia and Lima, Peru. Blanks, duplicates, and certified reference standards are inserted into the sample stream to monitor laboratory performance. Crush rejects and pulps are kept and stored in a secured storage facility for future assay verification. No capping has been applied to sample composites. The Company utilizes a rigorous, industry-standard QA/QC program.
Contact Information
Collective Mining Ltd. Steven Gold, Vice President, Corporate Development and Investor Relations Tel. (416) 648-4065
FORWARD-LOOKING STATEMENTS
This news release contains certain forward-looking statements, including, but not limited to, statements about the drill programs, including timing of results, and Collective’s future and intentions. Wherever possible, words such as “may”, “will”, “should”, “could”, “expect”, “plan”, “intend”, “anticipate”, “believe”, “estimate”, “predict” or “potential” or the negative or other variations of these words, or similar words or phrases, have been used to identify these forward-looking statements. These statements reflect management’s current beliefs and are based on information currently available to management as at the date hereof.
Forward-looking statements involve significant risk, uncertainties, and assumptions. Many factors could cause actual results, performance, or achievements to differ materially from the results discussed or implied in the forward-looking statements. These factors should be considered carefully, and readers should not place undue reliance on the forward-looking statements. Although the forward-looking statements contained in this news release are based upon what management believes to be reasonable assumptions, Collective cannot assure readers that actual results will be consistent with these forward-looking statements. These forward-looking statements are made as of the date of this news release, and Collective assumes no obligation to update or revise them to reflect new events or circumstances, except as required by law.
Neither the TSXV nor its Regulation Services Provider (as that term is defined in the policies of the TSXV) accepts responsibility for the adequacy or accuracy of this news release.
VANCOUVER, British Columbia, Sept. 20, 2022 (GLOBE NEWSWIRE) — Rover Metals Corp. (TSXV: ROVR) (OTCQB: ROVMF) (FSE:4XO) (“Rover” or the “Company”) is pleased to announce that it has signed a letter of intent (“LOI”) to option a 100% ownership interest in a claystone lithium project located in the state of Nevada, USA. The land package under option is a district scale lithium claystone deposit situated on Bureau of Land Management land.
Nevada Claystone Lithium Project The Company, through the vendor of the project, and through ALS Laboratories, has verified high-grade lithium surface samples at the project. Highlights of these surface grab samples processed by ALS Laboratories include: Sample# AMZ-8 of 780ppm Li, Sample# AMZ-26 of 910ppm Li, and Sample# AMZ-28 of 710ppm Li. The Company has pulled additional surface grab samples from the project and analysed them with a Handheld Laser Induced Breakdown Spectroscopy (“HH LIBS”). Highlights of the HH LIBS include: 1,218 ppm Li, 778 ppm Li, 724 ppm Li, and 707 ppm Li.
Based on the results of its surface sampling campaign at the project, the Company has outlined a USD200,000 Reverse Circulation Drill Program to follow-up on the high-grade areas of the project.
The project includes green energy infrastructure of hydro power lines, direct road access, and a nearby town with a readily available work force.
Later-stage comparable claystone lithium projects include Cypress Development’s Clayton Valley project; American Lithium’s TLC project; Spearmint Resources’ McGee project; Noram Lithium’s Zeus project, and Iconic Minerals’ Bonnie Claire project. All of the aforementioned companies are later-stage mining companies, with a NI 43-101 resource definition. Rover’s Nevada Lithium project is greenfields in nature, with no drilling to date.
Summary of First Year Commitments Under the LOI The Company’s earn-in to a 100% ownership of the claystone lithium project calls for USD200,000 in exploration expenditures within 24 months of the signing of a definitive agreement.
Technical information has been approved by David White, P.Geo., QP for the purposes of NI 43-101. ALS Laboratories is ISO/IEC 17025:2017 and ISO 9001:2015 certified.
An updating release will be provided once the Company executes a definitive option agreement.
Tobin Gold Project The Company has made the decision to drop its acquisition plans for the Tobin Gold Project, NV, USA in light of the annual advance royalty holding costs of the Tobin project, and also as a result of today’s news with regards to the acquisition of a new Nevada Lithium project.
Judson Culter, CEO at Rover Metals, states, “The Biden Administration’s Bill for Inflation Reduction and Energy puts milestones in place for critical minerals like Lithium to be effective January 1, 2023. Rover’s management looked all over the U.S. and Canada and ultimately decided on Nevada as the best jurisdiction to advance a lithium project. Yes, the project is greenfields in nature, however, Rover’s management team has a proven track record in deploying millions of dollars in exploration capital into mineral resource projects. We see tremendous near-term growth at this project.
Our corporate website will be updated in the coming days to reflect the Lithium asset addition.”
About Rover Metals Rover is a publicly traded junior mining company that trades on the TSXV under symbol ROVR, on the OTCQB under symbol ROVMF, and on the FSE under symbol 4XO. The Company is now developing both: (1) critical minerals projects; as well as (2) precious metals projects. The Company is exclusive to the mining jurisdictions of Canada and the U.S. Five of the Company’s existing mineral resource development projects are located near to the city of Yellowknife, 60th parallel, Canada.
ON BEHALF OF THE BOARD OF DIRECTORS “Judson Culter” Chief Executive Officer and Director
For further information, please contact: Email: info@rovermetals.com Phone: +1 (778) 754-2617
Statement Regarding Forward-Looking Information This news release contains statements that constitute “forward-looking statements.” Such forward-looking statements involve known and unknown risks, uncertainties and other factors that may cause Rover’s actual results, performance or achievements, or developments in the industry to differ materially from the anticipated results, performance or achievements expressed or implied by such forward-looking statements. Forward-looking statements are statements that are not historical facts and are generally, but not always, identified by the words “expects,” “plans,” “anticipates,” “believes,” “intends,” “estimates,” “projects,” “potential” and similar expressions, or that events or conditions “will,” “would,” “may,” “could” or “should” occur. There can be no assurance that such statements prove to be accurate. Actual results and future events could differ materially from those anticipated in such statements, and readers are cautioned not to place undue reliance on these forward-looking statements. Any factor could cause actual results to differ materially from Rover’s expectations. Rover undertakes no obligation to update these forward-looking statements in the event that management’s beliefs, estimates or opinions, or other factors, should change.
THE FORWARD-LOOKING INFORMATION CONTAINED IN THIS NEWS RELEASE REPRESENTS THE EXPECTATIONS OF THE COMPANY AS OF THE DATE OF THIS NEWS RELEASE AND, ACCORDINGLY, IS SUBJECT TO CHANGE AFTER SUCH DATE. READERS SHOULD NOT PLACE UNDUE IMPORTANCE ON FORWARD-LOOKING INFORMATION AND SHOULD NOT RELY UPON THIS INFORMATION AS OF ANY OTHER DATE. WHILE THE COMPANY MAY ELECT TO, IT DOES NOT UNDERTAKE TO UPDATE THIS INFORMATION AT ANY PARTICULAR TIME EXCEPT AS REQUIRED IN ACCORDANCE WITH APPLICABLE LAWS.
NEITHER THE TSX VENTURE EXCHANGE NOR ITS REGULATION PROVIDER (AS THAT TERM IS DEFINED IN THE POLICIES OF THE TSX VENTURE EXCHANGE) ACCEPTS RESPONSIBILITY FOR THE ADEQUACY OF THIS RELEASE.
North Vancouver, British Columbia–(Newsfile Corp. – September 15, 2022) – Lion One Metals Limited (TSXV: LIO) (OTCQX: LOMLF) (ASX: LLO) (“Lion One” or the “Company”) is pleased to announce the results from drillhole TUDDH-608 a direct follow-up to the TUG-141/TUDDH-601 high-grade zone discovery at its fully permitted Tuvatu Alkaline Gold Project in Fiji.
TUDDH-608 intersected:
19.60m at 21.16 g/t Au from 594.5-614.1m, which includes a zone of 16.20m at 25.28 g/t Au from 596.7-612.9m.
The dip of this hole at this depth was approximately 60° equating to a true horizontal width of 11.85m.
TUDDH-608 was drilled from surface at an azimuth of approximately N090°E, aimed at intersecting the TUG-141/TUDDH-601 high-grade zone at a high angle to determine the true width of the high-grade zone at this location.https://embed.fireplace.yahoo.com/embed?ctrl=Monalixa&m_id=monalixa&m_mode=document&site=sports&os=android&pageContext=%257B%2522wiki_topics%2522%253A%2522Lion%2522%252C%2522lmsid%2522%253A%2522a0V0W00000HOPDcUAP%2522%252C%2522revsp%2522%253A%2522newsfile_64%2522%252C%2522lpstaid%2522%253A%25229b04419e-750c-3224-9125-6febee8bd22b%2522%252C%2522pageContentType%2522%253A%2522story%2522%257D
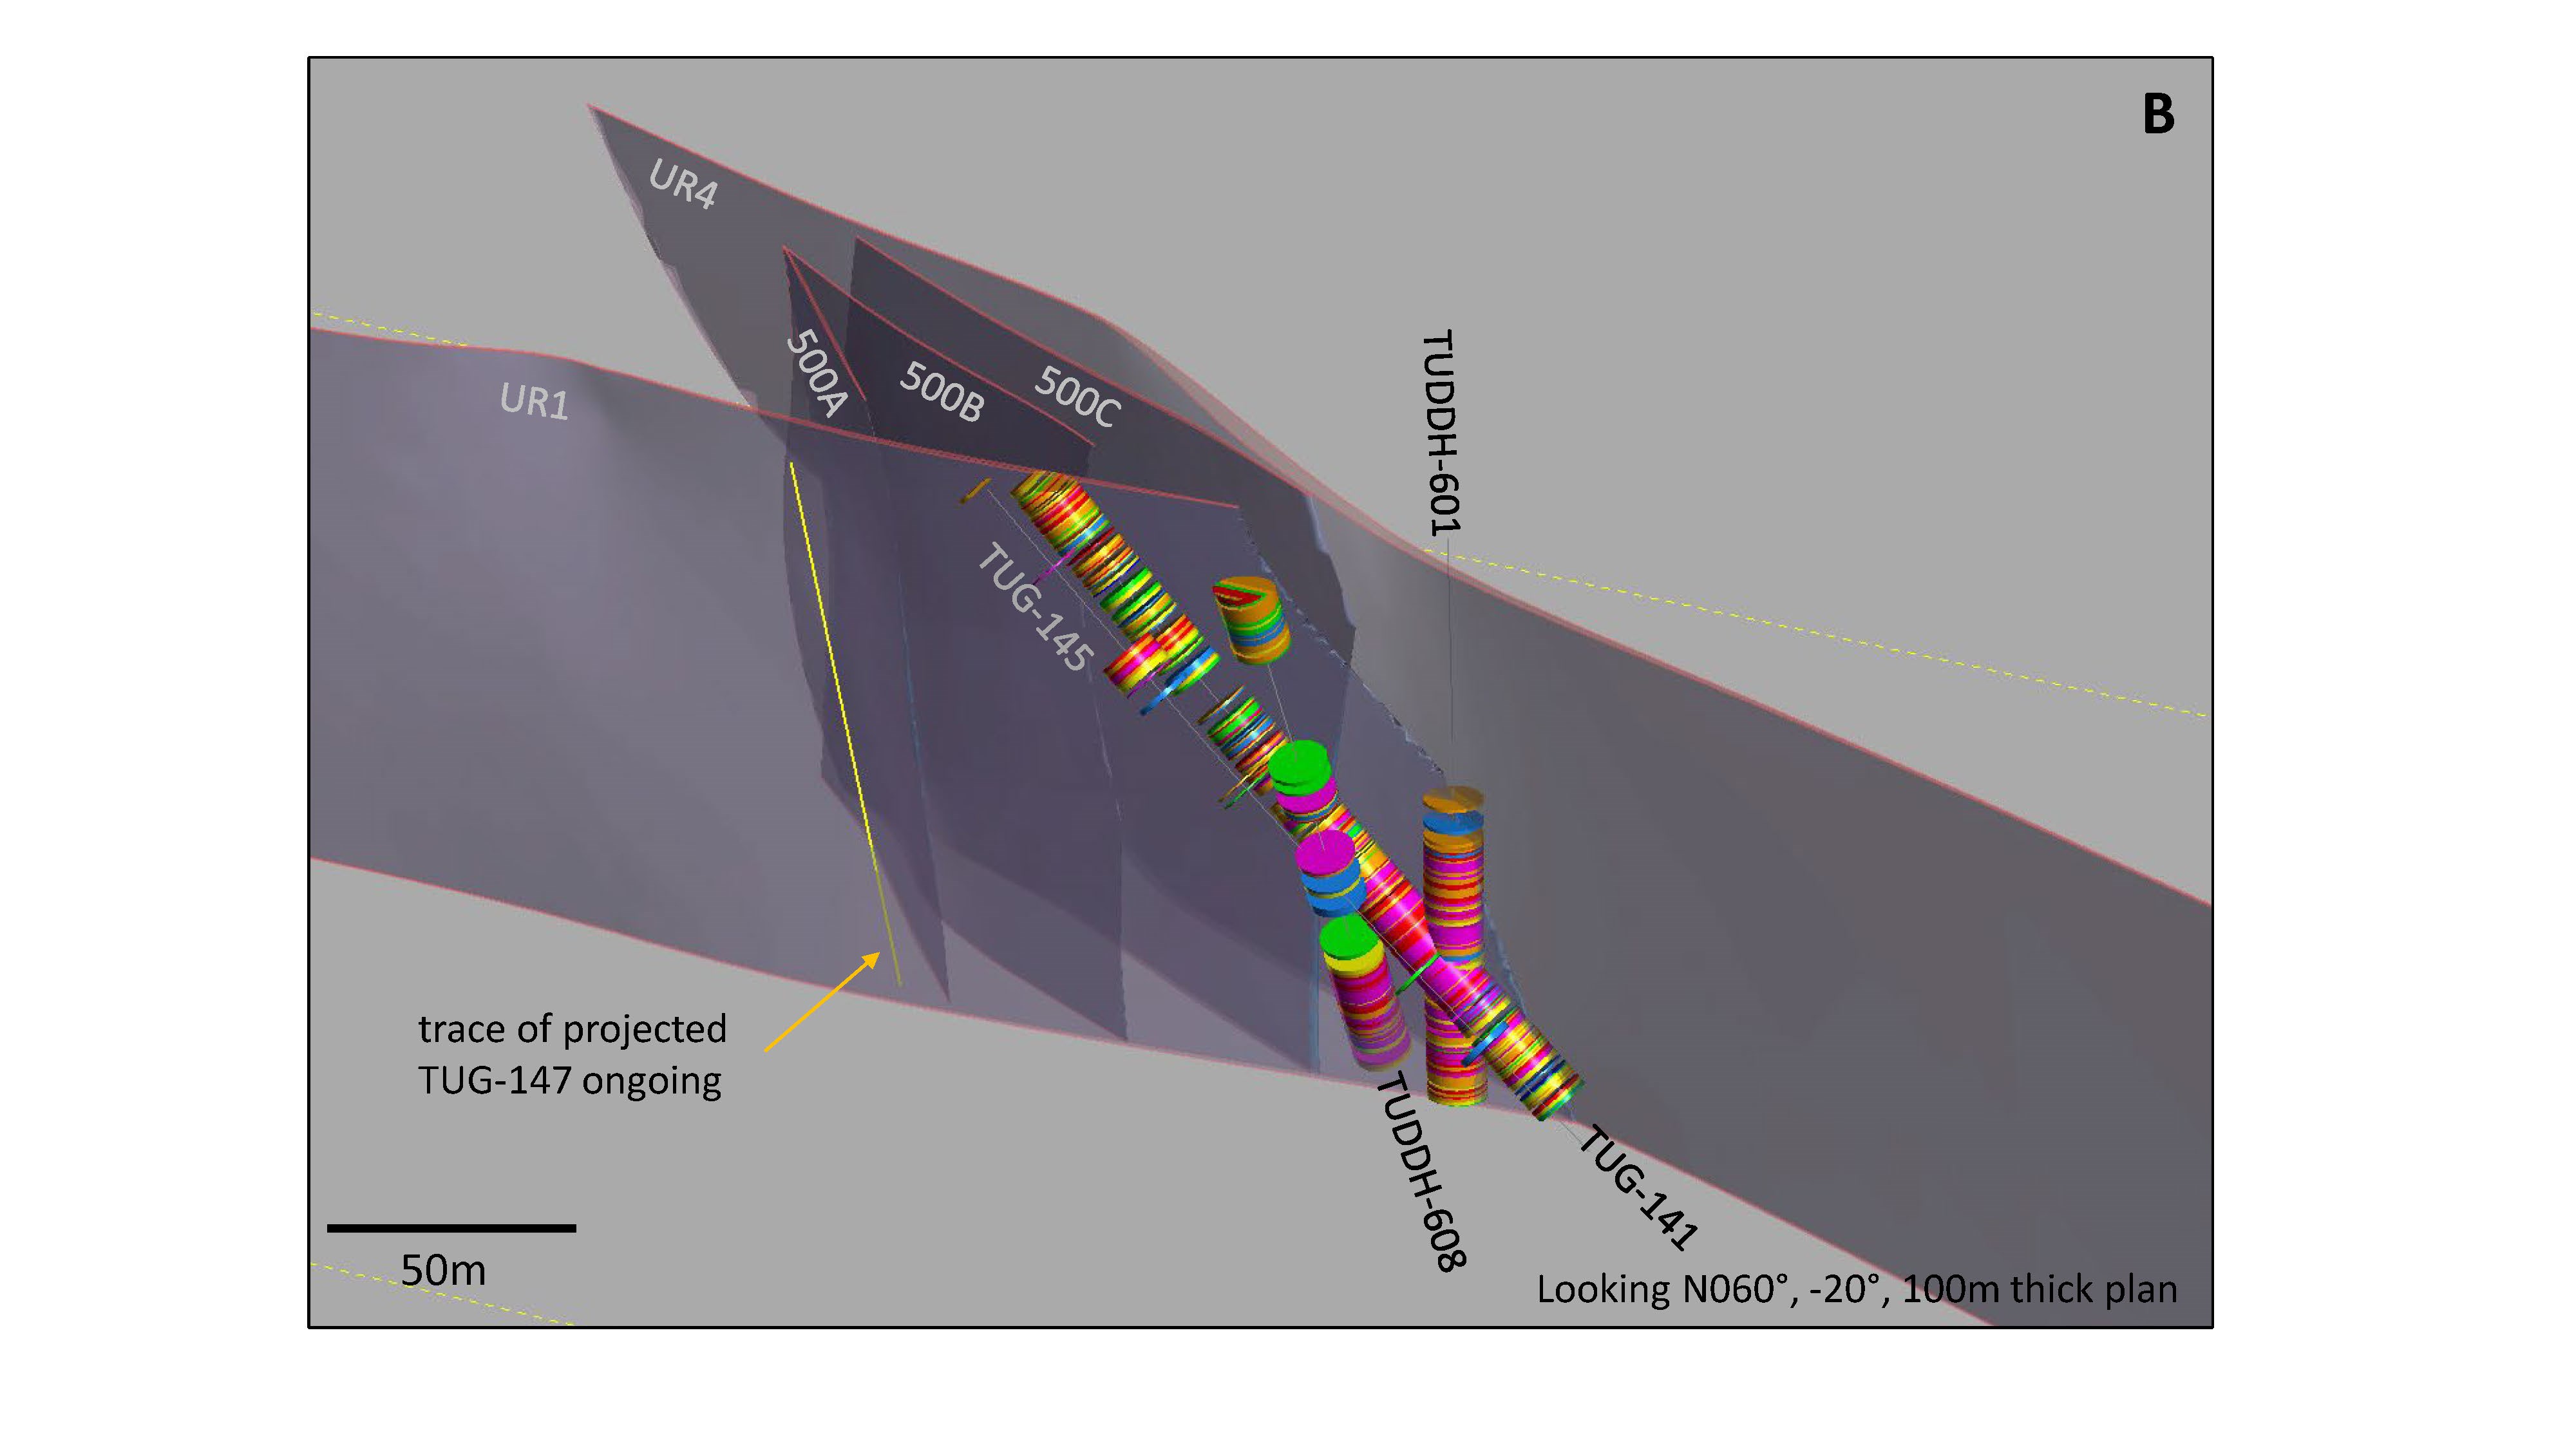
Figure 1 show the trace of TUDDH-608 and its location relative to the current interpretation of the TUG-141/TUDDH-601 high-grade dilation zone, and indicates that TUDDH-608 intersected high-grade Au mineralization approximately 20m north of subvertical hole TUDDH-601, and 15m below the discovery hole TUG-141. The trace of the currently drilling TUG-147 drillhole, designed to intersect the high-grade mineralized zone an additional 90 to the north of TUDDH-608 is also shown on Figure 1. TUG-147 is expected to cross the target rocks in the next 7-10 days.
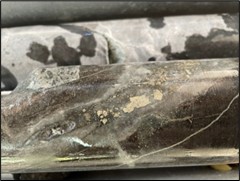
Figure 2 includes some photos of the mineralization intersected by hole TUDDH-608. All results >0.5 g/t Au are summarized below in Table 1.
Lion One Sr. Vice-President of Exploration Sergio Cattalani, stated “This is yet another exceptional set of results from the ongoing drilling of the high-grade zone defined by the previous drill holes TUG-141 and TUDDH-601. Our current interpretation of this portion of the 500 Zone feeder is that of a wide zone of dilation associated with the interplay of major structural corridors (UR1 and UR4) and the main lithological contact between monzonite and andesite that has the potential to extend for tens to hundreds of meters both vertically and along the NS direction. True widths exceeding 10m at the narrower apex of this dilational zone suggest a significant increase in gold ounces once this zone has been adequately drilled off, and this, independent of the rest of the extensive vertical 500 zone feeder that is known to exceed 1100m in vertical extent. We will continue to expand this critical zone of high-grade mineralization with ongoing drilling both from surface as well as from the underground decline.”
Figure 1: Oblique views looking N320° and down 45° (A) and looking N060° and down 20° (B) of a 100m thick horizontal slice of the UR1-UR4 high-grade mineralized zone. Yellow trace is the projected trace of TUG-147 (in progress).
Figures 2: Photos from TUDDH-608 drill core, as follows: A) 571.5m, 17.03 g/t Au; B) 601.9m, 23.21 g/t Au; C) 599.5m, 108.31 g/t Au; D) 606.5m, 54.54 g/t Au; E) 611.8m, 45.02 g/t Au; F) close-up of cut core from photo E showing VG.
Table 1: Drilling intervals for diamond drill hole TUDDH-608 returning >0.5 g/t Au (intervals > 3.0 g/t Au cutoff are shown in red, and intervals >9.0 g/t Au or longer than 1.2m are bolded).
Hole ID
From (m)
To (m)
Interval (m)
Grade (g/t Au)
TUDDH-608
38.0
38.6
0.6
1.03
263.8
264.4
0.6
0.71
285.1
285.7
0.6
0.69
493.6
493.9
0.3
3.07
503.2
510.0
6.8
2.45
Incl.
506.7
507.3
0.6
10.49
511.2
515.7
4.5
1.45
517.8
518.1
0.3
1.08
519.3
523.2
3.9
1.49
557.1
557.7
0.6
9.08
Incl.
557.1
557.4
0.3
11.64
Incl.
557.4
557.7
0.3
6.51
559.2
559.8
0.6
3.02
571.4
572.6
1.2
9.41
Incl.
571.4
572.6
0.6
17.02
576.5
577.4
0.9
0.51
594.5
618.2
19.6
21.16
Incl.
596.7
597.9
1.2
85.09
Incl.
597.9
598.6
0.7
9.42
Incl.
598.6
598.9
0.3
8.38
Incl.
598.9
599.2
0.3
11.44
Incl.
599.2
599.5
0.3
6.98
Incl.
599.5
599.8
0.3
36.39
Incl.
599.8
600.4
0.6
108.31
Incl.
600.4
600.7
0.3
21.69
Incl.
600.7
601.7
1.0
13.54
Incl.
601.7
602.2
0.5
23.39
Incl.
602.2
602.5
0.3
0.72
Incl.
602.5
603.1
0.6
80.01
Incl.
603.1
603.7
0.6
7.05
Incl.
603.7
604.0
0.3
11.97
Incl.
604.0
604.6
0.6
3.09
Incl.
604.6
605.2
0.6
2.93
Incl.
605.2
606.0
0.8
1.41
Incl.
606.0
606.6
0.6
54.53
Incl.
606.6
607.2
0.6
11.99
Incl.
607.2
607.8
0.6
8.30
Incl.
607.8
608.4
0.6
29.56
Incl.
608.4
609.3
0.9
1.34
Incl.
609.3
609.6
0.3
24.31
609.6
610.2
0.6
2.61
Incl.
610.2
610.8
0.6
10.85
Incl.
610.8
611.1
0.3
7.54
611.1
611.4
0.3
2.90
Incl.
611.4
612.1
0.7
45.02
Incl.
612.1
612.9
0.8
13.31
612.9
613.8
0.9
0.54
613.8
614.1
0.3
1.87
616.1
618.2
2.1
4.25
Incl.
616.1
616.7
0.6
11.72
670.2
670.5
0.3
0.97
Table 2: Survey details of diamond drill holes referenced in this release. Previously released drill holes are not included here.
Hole No
Coordinates (Fiji map grid)
RL
final depth
dip
azimuth
N
E
m
(TN)
TUDDH-608
1876280
3920472
286.51
678.1
-64
089
TUG-147
1876435
3920584
116
in progress
-75
099
Qualified Person
In accordance with National Instrument 43-101 – Standards of Disclosure for Mineral Projects (“NI 43-101”), Sergio Cattalani, P.Geo, Senior Vice President Exploration, is the Qualified Person for the Company and has reviewed and is responsible for the technical and scientific content of this news release.
QAQC Procedures
Lion One adheres to rigorous QAQC procedures above and beyond basic regulatory guidelines in conducting its sampling, drilling, testing, and analyses. The Company utilizes its own fleet of diamond drill rigs, using PQ, HQ and NQ sized drill core rods. Drill core is logged and split by Lion One personnel on site. Samples are delivered to and analysed at the Company’s geochemical and metallurgical laboratory in Fiji. Duplicates of all samples with grades above 0.5 g/t Au are both re-assayed at Lion One’s lab and delivered to ALS Global Laboratories in Australia (ALS) for check assay determinations. All samples for all high-grade intercepts are sent to ALS for check assays. All samples are pulverized to 80% passing through 75 microns. Gold analysis is carried out using fire assay with an AA finish. Samples that have returned grades greater than 10.00 g/t Au are then re-analysed by gravimetric method. For samples that return greater than 0.50 g/t Au, repeat fire assay runs are carried out and repeated until a result is obtained that is within 10% of the original fire assay run. For samples with multiple fire assay runs, the average of duplicate runs is presented. Lion One’s laboratory can also assay for a range of 71 other elements through Inductively Coupled Plasma Optical Emission Spectrometry (ICP-OES), but currently focuses on a suite of 9 important pathfinder elements. All duplicate anomalous samples are sent to ALS labs in Townsville QLD and are analysed by the same methods (Au-AA26, and Au-GRA22 where applicable). ALS also analyses for 33 pathfinder elements by HF-HNO3-HClO4 acid digestion, HCl leach and ICP-AES (method ME-ICP61).
About Lion One Metals Limited
Lion One’s flagship asset is 100% owned, fully permitted high grade Tuvatu Alkaline Gold Project, located on the island of Viti Levu in Fiji. Lion One envisions a low-cost high-grade underground gold mining operation at Tuvatu coupled with exciting exploration upside inside its tenements covering the entire Navilawa Caldera, an underexplored yet highly prospective 7km diameter alkaline gold system. Lion One’s CEO Walter Berukoff leads an experienced team of explorers and mine builders and has owned or operated over 20 mines in 7 countries. As the founder and former CEO of Miramar Mines, Northern Orion, and La Mancha Resources, Walter is credited with building over $3 billion of value for shareholders.
On behalf of the Board of Directors of Lion One Metals Limited “Walter Berukoff“ Chairman and CEO
Neither the TSX Venture Exchange nor its Regulation Service Provider accepts responsibility for the adequacy or accuracy of this release.
This press release may contain statements that may be deemed to be “forward-looking statements” within the meaning of applicable Canadian securities legislation. All statements, other than statements of historical fact, included herein are forward looking information. Generally, forward-looking information may be identified by the use of forward-looking terminology such as “plans”, “expects” or “does not expect”, “proposed”, “is expected”, “budget”, “scheduled”, “estimates”, “forecasts”, “intends”, “anticipates” or “does not anticipate”, or “believes”, or variations of such words and phrases, or by the use of words or phrases which state that certain actions, events or results may, could, would, or might occur or be achieved. This forward-looking information reflects Lion One Metals Limited’s current beliefs and is based on information currently available to Lion One Metals Limited and on assumptions Lion One Metals Limited believes are reasonable. These assumptions include, but are not limited to, the actual results of exploration projects being equivalent to or better than estimated results in technical reports, assessment reports, and other geological reports or prior exploration results. Forward-looking information is subject to known and unknown risks, uncertainties and other factors that may cause the actual results, level of activity, performance or achievements of Lion One Metals Limited or its subsidiaries to be materially different from those expressed or implied by such forward-looking information. Such risks and other factors may include, but are not limited to: the stage development of Lion One Metals Limited, general business, economic, competitive, political and social uncertainties; the actual results of current research and development or operational activities; competition; uncertainty as to patent applications and intellectual property rights; product liability and lack of insurance; delay or failure to receive board or regulatory approvals; changes in legislation, including environmental legislation, affecting mining, timing and availability of external financing on acceptable terms; not realizing on the potential benefits of technology; conclusions of economic evaluations; and lack of qualified, skilled labour or loss of key individuals. Although Lion One Metals Limited has attempted to identify important factors that could cause actual results to differ materially from those contained in forward-looking information, there may be other factors that cause results not to be as anticipated, estimated or intended. Accordingly, readers should not place undue reliance on forward-looking information. Lion One Metals Limited does not undertake to update any forward-looking information, except in accordance with applicable securities laws.
Vancouver, British Columbia–(Newsfile Corp. – September 13, 2022) – Riverside Resources Inc.(TSXV: RRI) (OTCQB: RVSDF) (FSE: 5YY) (“Riverside” or the “Company”) is pleased to report assay results for the remaining 7 drillholes of its twelve-hole, 1700-meter diamond drill program completed at the Oakes Gold Project (the “Project”) in northwestern Ontario, Canada. The primary focus of the first drill program at Oakes was to test the ‘HG’ Target identified by geophysics and trenching programs for gold grades and continuity. The results came back favorable with hole 22-11 returning 5 intervals of gold over a total interval of 55 meters and hole 22-06 returning 4m @ 1.7 g/t Au. The Induced Polarization (IP) work conducted by Riverside in the summer of 2021 showed the HG IP Target extended westward beyond the area of trenching and sampling. Drilling this year has now confirmed the gold continuity of over 1.2 kilometer strike, hitting the mineralized structure and further open in both east and west. The drill results announced here fit with the orogenic gold model and further drilling can be progressed with confidence as all the holes of this program were shallow, with intercepts at less than 120m for most cases, while the system is wide open at depth.
This drill campaign has now successfully expanded the known gold mineralization well beyond the outcrops and laid the groundwork for the next drill campaign to continue expanding the Oakes gold camp. IP data provided strong conductivity and complimentary resistivity anomaly trending roughly east-west parallel to the geological units with greater confidence. The 7 holes announced here intercepted favorable geology of metavolcanics, “greenstone”, consistent with the geology noted in the first five holes and further geological constraints. As this part of Oakes has never been drilled, the first drill program comprised of shallow holes with the intent of intercepting the target at 100 m vertical below surface. The mineralized zone on surface is known to pinch and swell and averages about 5 m in width. The best hole in the second batch of reporting was DDH-22-06 which returned 1.7 g/t over 4 m with one sample being almost 5 g/t gold. The best intercept in the program was 8.4 g/t over 1 m in Hole #2.
Table 1: Spring 2022 Drill Program Highlights at Oakes (holes 6-12)
Hole No.
from (m)
to (m)
length (m)
Au (g/t)
OAKES-22-06
72
76
4
1.7
including
72
73
1
4.9
OAKES-22-06
85
88
3
1.0
OAKES-22-07
98
100
2
0.9
OAKES-22-08
9
10.5
1.5
0.4
OAKES-22-09
18
18.5
0.5
1.0
OAKES-22-11
22
23
1
2.2
OAKES-22-11
96.5
98
1.5
1.0
OAKES-22-11
113.5
115
1.5
1.1
OAKES-22-11
125.5
127
1.5
2.3
OAKES-22-11
151
152
1
0.9
OAKES-22-12
106.5
108
1.5
2.4
OAKES-22-12
130
131
1
0.4
All samples comprised half-core, saw-cut samples with QA/QC described below and further at www.rivres.com. Samples are generally considered to be 90-95% to true width.https://embed.fireplace.yahoo.com/embed?ctrl=Monalixa&m_id=monalixa&m_mode=document&site=sports&os=android&pageContext=%257B%2522ctopid%2522%253A%25221542500%253B1577000%2522%252C%2522hashtag%2522%253A%25221542500%253B1577000%2522%252C%2522wiki_topics%2522%253A%2522Target_Corporation%253BDrill%253BTom%25C3%25A1%25C5%25A1_Hole%25C5%25A1%253BDrilling%253BCompany%2522%252C%2522lmsid%2522%253A%2522a0V0W00000HOPDcUAP%2522%252C%2522revsp%2522%253A%2522newsfile_64%2522%252C%2522lpstaid%2522%253A%25220b3e363e-27c8-3807-828c-310b2cededf8%2522%252C%2522pageContentType%2522%253A%2522story%2522%257D
Technical Interpretations & Observations
DDH-22-06 & 07 were designed to intercept the HG Zone beneath Trench 1 at about 100 m depth. The target zone comprises strongly foliated, fine grained, metavolcanic rocks showing strong silicified zones with narrow bleached sections. Alteration comprises abundant biotite and chlorite bands, the top of the unit shows quartz veining with semi-massive pyrite-pyrrhotite and trace chalcopyrite which generally described the mineralized environment at Oakes. Quartz carbonate veinlets and stringers are more frequent from 80 m to 110 m down the hole consistent with the drill target gold bearing area. The overall 25-30m mineralization halo and main zone which is near vertical, now demonstrates strong consistency and provides the Company confidence of a significant gold system at Oakes. DDH-22-08 hit a fault and could not reach the target. DDH-22-09 was the setback collared to drill the Brinklow IP anomaly south of HG Zone, while DDH-22-10 was collared on the Crib Road with the intent to test the IP anomaly associated with the metasediment/metavolcanic contact boundary mapped at this location. Holes 8, 9 and 10 were not intended to evaluate the HG target and were instead testing parallel features. Holes 6, 7, 11, 12 provide technical data specific to the HG trend and give positive results for further exploration at Oakes which lies 25 km east of the Hard Rock Mine currently being constructed by Greenstone Gold (Equinox Gold) with a Proven & Probable Reserves of 5.5Moz at 1.27 g/t Au.[1]
Figure 1: Collars and projected drill holes for 12 holes plotted on IP Chargeability Map
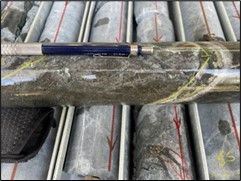
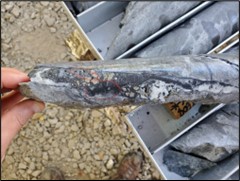
DDH-22-11 was targeting an IP conductivity anomaly associated with the HG Zone on trend with the mineralization defined on surface (and in drill core) at Hole 6 located 600 m to the east along what is believed to be the same structure. Assays returned gold results associated with veining throughout the hole and as high as 2.3 g/t gold. Hole 11 was collared in metasedimentary rocks and drilled northward into metavolcanic rocks. Bedding and the contact between the two units was measured at 50 degrees to the core axis whereas foliation and shearing is at about 45 degrees. Alteration comprises moderately to strong biotitic and weak to strong chlorite zones sometimes associated with carbonate zones. Quartz veining and silica content increases starting at 80 m downhole. Sulphides are associated with quartz veins and comprise 2-5% disseminated Pyrite-Pyrrhotite seen within local fracture fillings and stringers.
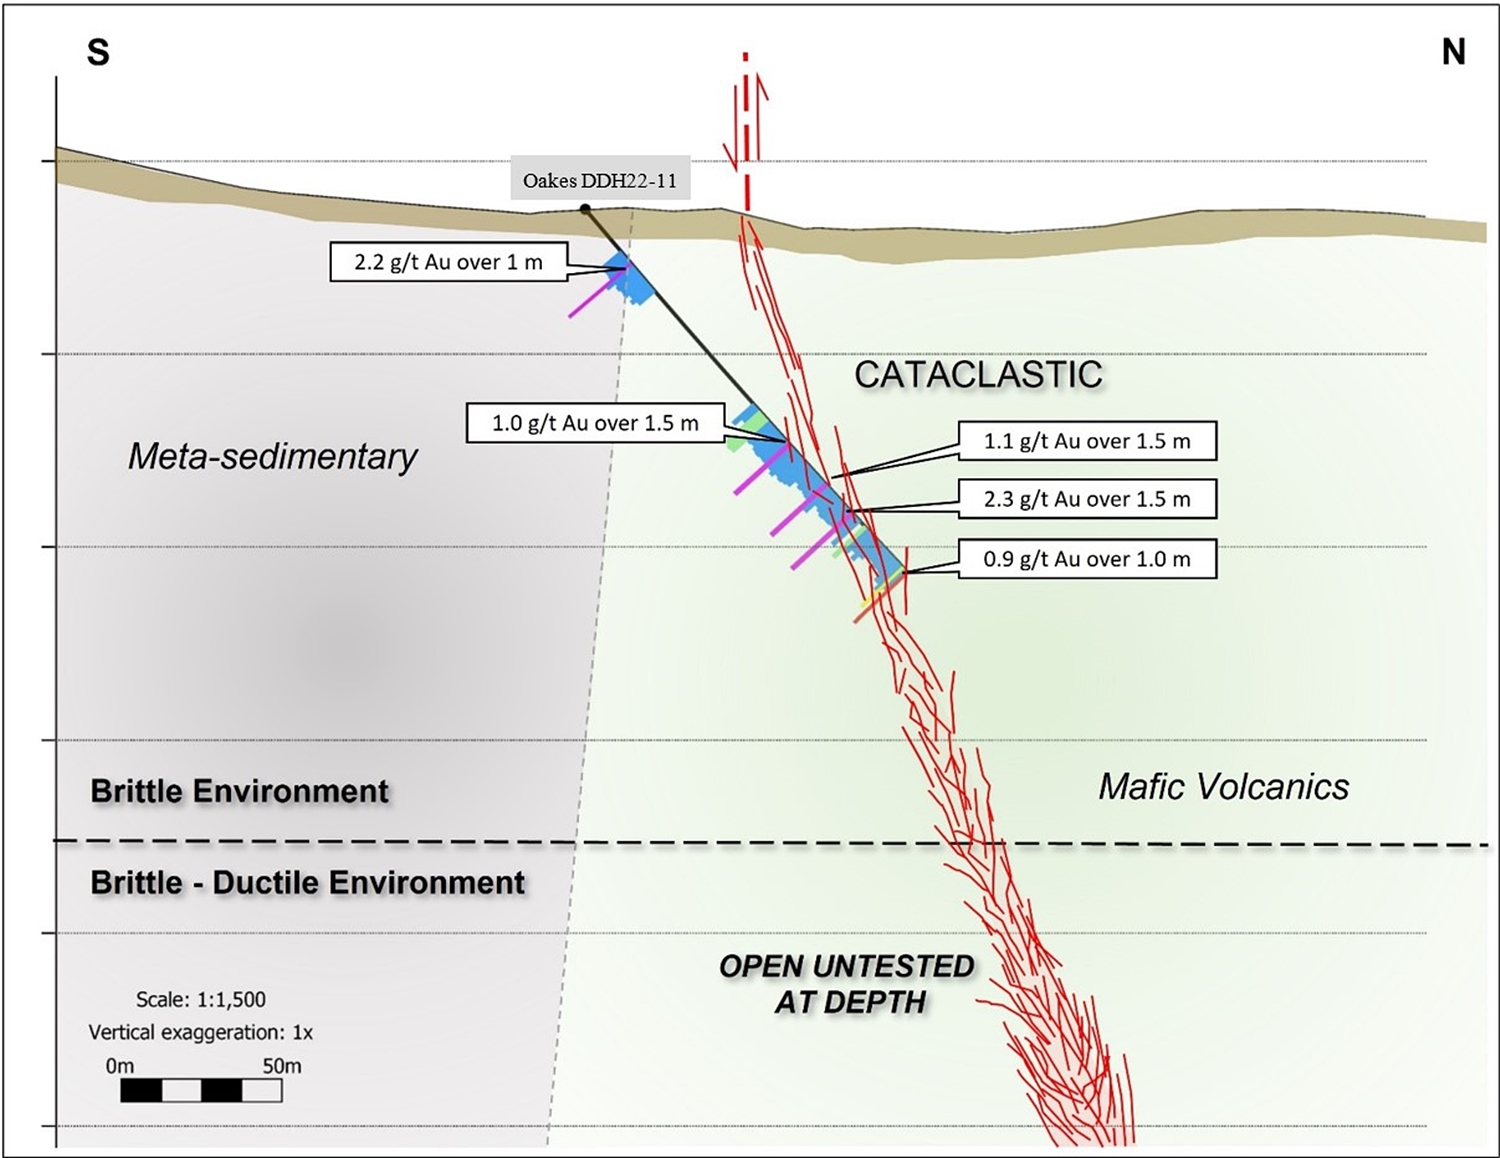
Figure 2: Interpreted North – South Cross Section DDH-22-11 demonstrating the progression from brittle down into brittle-ductiledeformation as the targeting model having found gold over 55m drill width zone in hole 11
DDH-22-12 was collared in gabbro and drilled north through metasedimentary rock into metavolcanics. Mineralization is noted within similar altered rock but only within shears in the mafic volcanics and does not appear to be associated with the contact zones. Sheared zones commonly a focus for gold mineralization in orogenic systems like this one are expressed as altered, fine-grained, metavolcanics with moderate to strong chlorite-biotite alteration with quartz-carbonate veins and stringers with 1-2% disseminated pyrite and pyrrhotite.
Conclusions
The HG Zone at Oakes has been proven to extend well beyond the strike extent defined by trenching and has now been drill proven to at least 1.1 km in length. To date the drilling has only tested the upper 100 m of the structure where mineralization appears associated with quartz veins that show visible gold within pyrite rich veins. The gold mineralization is associated with quartz and quartz-carbonate veins in shear zones within metavolcanic rocks often (near-vertical which can bode well for potential future mining and predicting the next round of drilling). Quartz veins that are subparallel to foliation appear to be the veins that carry gold and are cut by later quartz carbonate veins that do not have sulfides. The quartz veins are mostly associated with brittle type fracturing with lesser semi-ductile type, potentially indicating that drilling was approaching the upper brittle-ductile transition which can be highly favorable in large orogenic gold deposits. The nature of the fracturing suggests that the shallow drilling is primarily within the upper brittle deformation zone as shown in Figure 2. The fact that the gold veins can now be traced in drill holes more than 3x beyond the previous surface trenching expands the Oakes project potential greatly.
The Oakes property is located along the general metallogenic boundary of the Wabigoon and Quetico sub-provinces and this boundary is commonly a major fault breaks, and large gold resources are associated with these breaks generally in secondary shear zones in the Canadian shield geologic provinces. The Hemlo Gold Mine to the south is hosted in a brittle fracture environment and the Black Fox gold mine to the east in Matheson is hosted in a semi-ductile fracture system at depth and more brittle near the surface. Riverside sees the potential for brittle fracture zones progress into semi ductile and ductile zones at depth in general becoming wider and potentially richer as has commonly been found and further drilling is warranted.
Riverside’s President and CEO, John-Mark Staude:“Riverside has expanded the gold zone at Oakes along strike over 1 km and begun showing the continuity on surface and to depth, consistent with the goals for the 2022 drill program. Next steps will include more geophysics to map the structural features to trace the HG Zone and gold mineralization. We are very encouraged by these good results covered in this and the prior news release and are pleased to see how effective the geophysical surveys were at finding mineralization and predicting extensions. Moreover, we remain very cautiously optimistic to see our first program of shallow drilling demonstrate continuity of mineralization along strike and at depth. Riverside continues to pursue the Prospect Generator hybrid model, by providing shareholders with the upside for discovery on multiple projects, and with different partners, along with the current self-funded value adding project.”
Qualified Person & QA/QC: As part of the quality control Riverside inserted blanks, duplicates and two different standards, into the sample stream prior to delivery at Activation Laboratories in Thunder Bay. Logged core was delivered from site to a core cutting facility in Thunder Bay by Riverside and trucked to Activation Laboratories from this facility typically in batches of 2 to 4 holes at a time. Multi-Element Analysis using Aqua Regia Extraction and (40 element) Inductively Coupled Plasma Atomic Emission Spectrometry Analytical and fire assay for gold methods where used. Activation Laboratories is an ISO/IEC accredited laboratory.
The scientific and technical data contained in this news release was reviewed and approved by Freeman Smith, P.Geo., a non-independent qualified person to Riverside Resources, who is responsible for ensuring that the geologic information provided within this news release is accurate and who acts as a “qualified person” under National Instrument 43-101 Standards of Disclosure for Mineral Projects.
About Riverside Resources Inc.: Riverside is a well-funded exploration company driven by value generation and discovery. The Company has over $4M in cash, no debt and less than 80M shares outstanding with a strong portfolio of gold-silver and copper assets and royalties in North America. Riverside has extensive experience and knowledge operating in Mexico and Canada and leverages its large database to generate a portfolio of prospective mineral properties. In addition to Riverside’s own exploration spending, the Company also strives to diversify risk by securing joint-venture and spin-out partnerships to advance multiple assets simultaneously and create more chances for discovery. Riverside has properties available for option, with information available on the Company’s website at www.rivres.com.
ON BEHALF OF RIVERSIDE RESOURCES INC.
“John-Mark Staude”
Dr. John-Mark Staude, President & CEO
For additional information contact:
John-Mark Staude President, CEO Riverside Resources Inc. info@rivres.com Phone: (778) 327-6671 Fax: (778) 327-6675 Web: www.rivres.com
Certain statements in this press release may be considered forward-looking information. These statements can be identified by the use of forward-looking terminology (e.g., “expect”,” estimates”, “intends”, “anticipates”, “believes”, “plans”). Such information involves known and unknown risks — including the availability of funds, the results of financing and exploration activities, the interpretation of exploration results and other geological data, or unanticipated costs and expenses and other risks identified by Riverside in its public securities filings that may cause actual events to differ materially from current expectations. Readers are cautioned not to place undue reliance on these forward-looking statements, which speak only as of the date of this press release.
Neither the TSX Venture Exchange nor its Regulation Services Provider (as that term is defined in the policies of the TSX Venture Exchange) accepts responsibility for the adequacy or accuracy of this release.
Click Image for Ordering FAQ’s or Better Call Me @ 855.505.1900
What are the Benefits of buying Brand New RCM 1000 oz Silver Bars?
Royal Canadian Mint Bars are Brand New, never owned before. Unlike Comex Silver Bars that are previously owned and commonly found in almost 99% of all 1000oz silver Bar Programs. Know what you are buying with a trusted name and a brand-new product.
RCM Silver bars range from 900 – 990+ ounces each, exact weights available
The Royal Canadian Mint is known for their purity & expertise in providing a high-quality product
Miles Franklin has immediate availability of 1000 oz. Royal Canadian Mint silver bars
Royal Canadian Mint Bars include Insured Shipping to Brink’s Vaults
Royal Canadian Mint Bars can be stored at either Brink’s Toronto or Brink’s New York JFK
Miles Franklin Precious Metal Storage Details:
Bars are exclusively your private property. They are not registered with any commodity exchange
1000oz. Silver bars offer the most competitive and lowest pricing and premiums possible
Rates start at $490 per year per $100,000 in value, billed quarterly
3 Bar Minimum for initial account set up, 1 Bar per order there-after to qualify for this rate
Bars with Miles Franklin are fully segregated and never commingled
Extremely Liquid, bars may be sold back to Miles Franklin at any time
Vancouver, British Columbia–(Newsfile Corp. – September 12, 2022) – Goldshore Resources Inc. (TSXV: GSHR) (OTCQB: GSHRF) (FSE: 8X00) (“Goldshore” or the “Company“), is pleased to announce assay results from eight holes drilled to test gold mineralization at the East Coldstream deposit at the Moss Lake Project in Northwest Ontario, Canada (the “Moss Lake Gold Project“).
Highlights:
Results for eight holes, drilled to better define the gold mineralization of the East Coldstream deposit, have confirmed three broad lenses of gold mineralization within the two main shear zones with best intercepts of:
23m @ 1.34 g/t Au from 244m depth in CED-22-004, including
7.35m @ 3.77 g/t Au from 254.2m
17.3m @ 1.55 g/t Au from 487m depth in CED-22-005
20m @ 1.15 g/t Au from 402m depth in CED-22-006
26m @ 1.66 g/t Au from 451m, including
7.9m @ 4.20 g/t Au from 465m
25.7m @ 2.07 g/t Au from 488m
37.05m @ 1.54 g/t Au from 209.3m depth in CED-22-007
27.9m @ 1.14 g/t Au from 387m depth in CED-22-008, including
13m @ 2.14 g/t Au from 401m
The better intercepts are all centered around five high-grade gold zones of mineralized breccia, including:
1.05m @ 15.8 g/t Au from 257.95m depth in CED-22-004
0.9m @ 14.3 g/t Au from 472m depth in CED-22-006, and
0.65m @ 13.5 g/t Au from 502m
0.85m @ 10.6 g/t Au from 244.35m depth in CED-22-007, and
0.4m @ 12.6 g/t Au from 418m
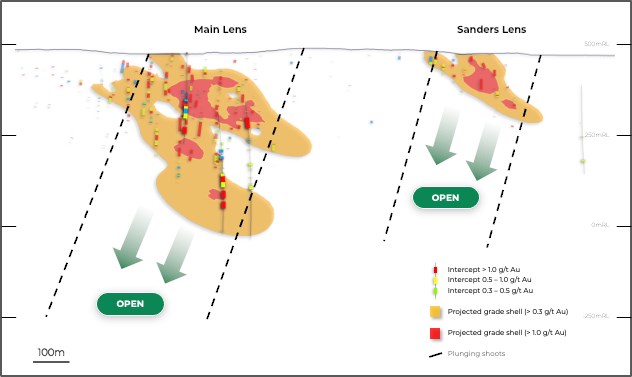
These results show that the three gold mineralized lenses have a clear steep plunge and highlight significant upside potential at depth within structurally controlled shoots.
President and CEO Brett Richards stated: “These first results are extremely encouraging and significant to the overarching strategy of developing a secondary resource to Moss Lake. This will provide optionality that can only help improve the new PEA study next year. The results also point to a second significant project within our land package, which highlights the potential for further discoveries.”
Technical Overview
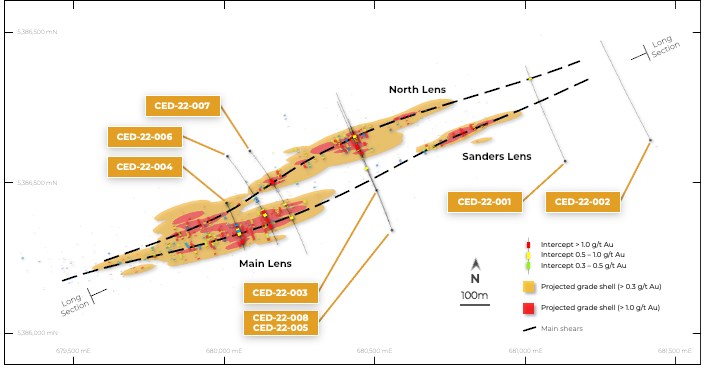
Figure 1 shows the location of the East Coldstream deposit relative to the Moss Lake deposit and the Archean Shebandowan Greenstone Belt. Table 1 and Figure 3 show the significant intercepts. Table 2 and Figure 2 show the drill hole locations. Figures 4 and 5 show a cross section through CED-22-006 and long section along the southern zone, respectively.
Figure 1: Location map showing East Coldstream relative to Moss Lake
Intersections calculated above a 0.3 g/t Au cut off with a top cut of 30 g/t Au and a maximum internal waste interval of 10 metres. Bordered intervals are intersections calculated above a 1.0 g/t Au cut off. Intervals in bold are those with a grade thickness factor exceeding 20 gram x metres / tonne gold. True widths are approximate and assume a subvertical body.
Table 2: Location of drill holes in this press release
HOLE
EAST
NORTH
RL
AZIMUTH
DIP
EOH
CED-22-001
681,136
5,386,570
479
337°
-50°
483.0m
CED-22-002
681,420
5,386,640
479
335°
-50°
494.85m
CED-22-003
680,507
5,386,473
481
336°
-50°
360.0m
CED-22-004
680,008
5,386,430
477
155°
-60°
302.8m
CED-22-005
680,559
5,386,340
486
342°
-60°
810.1m
CED-22-006
680,010
5,386,586
475
140°
60°
600.0m
CED-22-007
680,085
5,386,604
473
138°
-59°
657.05m
CED-22-008
680,559
5,386,340
483
340°
-50°
603.0m
Approximate collar coordinates in NAD 83, Zone 15N
Results have been received for eight of the initial 17 holes in the first pass drilling program at East Coldstream. These drillholes tested the existing mineralized lenses, as well as possible eastern and down-dip extensions.
Our work on the mineralization paragenesis and its structural controls has shown that gold mineralization is related to pervasive silica-hematite alteration and sulfide veining associated with an extensional brecciation event following extensive shearing. At the deposit scale, this formed three lenticular bodies within two main shear zones (Figure 1). Based on structural measurements from oriented core, each body has a steeply west-dipping plunge and a gently east-pitching stretching lineation that creates an internal fabric to mineralization (Figure 4). This structural control creates the potential for additional high-grade mineralization to occur below the shallowly drilled portions of the shears zones such as encountered in CED-22-007.
CED-22-001 and -002 tested a similar geophysical feature to the east of the East Coldstream deposit. CED-22-001 was drilled closest to East Coldstream and encountered narrow zones of mineralization, while CED-22-002 was drilled 300 meters further east and did not encounter significant results. This sterilizes the immediate extension, but given the lenticular geometry of mineralization, leaves open the prospectively of the structure further to the east.
CED-22-003 and -004 drilled the North and Main Lenses, respectively. Both holes intersected broad low-grade mineralized zones, including 19.15m @ 0.61 g/t Au from 269.55m in CED-22-003; and 48m @ 0.39 g/t Au from 168m and 23m @ 1.34 g/t Au in CED-22-004.
Holes CED-22-005 to -008 tested down plunge extensions of the known mineralization. All holes intersected variable widths of higher grade mineralization, including 17.3m @ 1.55 g/t Au from 487m in CED-22-005; 20.0m @ 1.15 g/t Au from 402m, 26.0m @ 1.66 g/t Au from 451m, and 25.7m @ 2.07 g/t Au from 488m in CED-22-006; 37.05m @ 1.54 g/t Au from 209.3m in CED-22-007; and 27.9m @ 1.14 g/t Au from 387m in CED-22-008.
Pete Flindell, VP Exploration for Goldshore, said “Our analysis of drill results at East Coldstream confirms the two parallel shear zones that were modelled in the past. The recognition of a greater structural control within these shears has led to the modelling of three steeply dipping lenticular shoots that remain open at depth. A gently dipping internal fabric suggests that mineralization is focused within discrete structures that may allow us to model a higher-grade resource than exists in the historic estimate.”
Analytical and QA/QC Procedures
All samples were sent to ALS Geochemistry in Thunder Bay for preparation and analysis was performed in the ALS Vancouver analytical facility. ALS is accredited by the Standards Council of Canada (SCC) for the Accreditation of Mineral Analysis Testing Laboratories and CAN-P-4E ISO/IEC 17025. Samples were analyzed for gold via fire assay with an AA finish (“Au-AA23”) and 48 pathfinder elements via ICP-MS after four-acid digestion (“ME-MS61”). Samples that assayed over 10 ppm Au were re-run via fire assay with a gravimetric finish (“Au-GRA21”).
In addition to ALS quality assurance / quality control (“QA/QC”) protocols, Goldshore has implemented a quality control program for all samples collected through the drilling program. The quality control program was designed by a qualified and independent third party, with a focus on the quality of analytical results for gold. Analytical results are received, imported to our secure on-line database and evaluated to meet our established guidelines to ensure that all sample batches pass industry best practice for analytical quality control. Certified reference materials are considered acceptable if values returned are within three standard deviations of the certified value reported by the manufacture of the material. In addition to the certified reference material, certified blank material is included in the sample stream to monitor contamination during sample preparation. Blank material results are assessed based on the returned gold result being less than ten times the quoted lower detection limit of the analytical method. The results of the on-going analytical quality control program are evaluated and reported to Goldshore by Orix Geoscience Inc.
About Goldshore
Goldshore is an emerging junior gold development company, and owns the Moss Lake Gold Project located in Ontario. Wesdome Gold Mines Ltd. (“Wesdome“), is currently a large shareholder of Goldshore with an approximate 27% equity position in the Company. Well-financed and supported by an industry-leading management group, board of directors and advisory board, Goldshore is positioned to advance the Moss Lake Gold Project through the next stages of exploration and development.
About the Moss Lake Gold Project
The Moss Lake Gold Project is located approximately 100 km west of the city of Thunder Bay, Ontario. It is accessed via Highway 11 which passes within 1 km of the property boundary to the north. The Moss Lake Gold Project covers 14,292 hectares and consists of 282 unpatented and patented mining claims.
The Moss Lake Gold Project hosts a number of gold and base metal rich deposits including the Moss Lake Deposit, the East Coldstream Deposit (Table 3), the historically producing North Coldstream Mine (Table 4), and the Hamlin Zone, all of which occur over a mineralized trend exceeding 20 km in length. A historical preliminary economic assessment (the “Moss Lake Historical Estimate“) was completed on the Moss Lake Gold Project in 2013 and published by Moss Lake Gold Mines Ltd. (“Moss Lake Gold Mines“)1,3. A historical mineral resource estimate (the “East Coldstream Historical Estimate“) was completed on the East Coldstream Deposit in 2011 by Foundation Resources Inc.2,3 In addition to these zones, the Moss Lake Gold Project also hosts a number of under-explored mineral occurrences which are reported to exist both at surface and in historically drilled holes. The Moss Lake Deposit is a shear-hosted disseminated-style gold deposit which outcrops at surface. It has been drilled over a 2.5 km length and to depths of 300 m with 376 holes completed between 1983 and 2017. The last drilling program conducted in 2016 and 2017 by Wesdome, which consisted of widely spaced holes along the strike extension of the deposit was successful in expanding the mineralized footprint and hydrothermal system 1.6 km to the northeast. Additionally, the deposit remains largely open to depth. In 2017, Wesdome completed an induced polarization survey which traced the potential extensions of pyrite mineralization associated with the Moss Lake Deposit over a total strike length of 8 km and spanning the entire extent of the survey grids.
The East Coldstream Deposit is a shear-hosted disseminated-style gold deposit which locally outcrops at surface. It has been drilled over a 1.3 km length and to depths of 200 m with 138 holes completed between 1988 and 2017. The deposit remains largely open at depth and may have the potential for expansion along strike. Historic drill hole highlights from the East Coldstream Deposit include 4.86 g/t Au over 27.3 m in C-10-15.
The historically producing North Coldstream Mine is reported to have produced significant amounts of copper, gold and silver4 from mineralization with potential iron-oxide-copper-gold deposit style affinity. The exploration potential immediately surrounding the historic mining area is not currently well understood and historic data compilation is required.
The Hamlin Zone is a significant occurrence of copper and gold mineralization, and also of potential iron-oxide-copper-gold deposit style affinity. Between 2008 and 2011, Glencore tested Hamlin with 24 drill holes which successfully outlined a broad and intermittently mineralized zone over a strike length of 900 m. Historic drill hole highlights from the Hamlin Zone include 0.9 g/t Au and 0.35% Cu over 150.7 m in HAM-11-75.
The Moss Lake, East Coldstream and North Coldstream deposits sit on a mineral trend marked by a regionally significant deformation zone locally referred to as the Wawiag Fault Zone in the area of the Moss Lake Deposit. This deformation zone occurs over a length of approximately 20 km on the Moss Lake Gold Project and there is an area spanning approximately 7 km between the Moss Lake and East Coldstream deposits that is significantly underexplored.
Table 3: Historical Mineral Resources1,2,3
INDICATED
INFERRED
Deposit
Tonnes
Au g/t
Au oz
Tonnes
Au g/t
Au oz
Moss Lake Historical Estimate
Open Pit Potential
39,795,000
1.1
1,377,300
48,904,000
1.0
1,616,300
Underground Potential
–
–
–
1,461,100
2.9
135,400
Moss Lake Total
39,795,000
1.1
1,377,300
50,364,000
1.1
1,751,600
East Coldstream Historical Estimate
East Coldstream Total
3,516,700
0.85
96,400
30,533,000
0.78
763,276
Combined Total
43,311,700
1.08
1,473,700
80,897,000
0.98
2,514,876
Notes:
Source: Poirier, S., Patrick, G.A., Richard, P.L., and Palich, J. “Technical Report and Preliminary Economic Assessment for the Moss Lake Project”, prepared for Moss Lake Gold Mines Ltd. The qualified persons for the Moss Lake Historical Estimate are Pierre-Luc Richard, MSc, PGeo (InnovExplo Inc), and Carl Pelletier, BSc, PGeo (InnovExplo Inc), and the effective date of the Moss Lake Historical Estimate is February 8, 2013. In-Pit results are presented undiluted and in situ, within Whittle-optimized pit shells. Underground results are presented undiluted and in situ, outside Whittle-optimized pit shells. The Moss Lake Historical Estimate includes 18 gold-bearing zones and 1 envelope containing isolated gold intercepts. Whittle parameters: mining cost = C$2.28; pit slope angle = 50.0 degrees; production cost = C$9.55; mining Dilution = 5%; mining recovery = 95%; processing recovery = 80% to 85%; gold price = C$1,500. In-Pit and Underground resources were compiled at cut-off grades from 0.3 to 5.0 g/t Au (for sensitivity characterization). A cut-off grade of 0.5 g/t Au was selected as the official in-pit cut-off grade and a cut-off grade of 2.0 g/t Au was selected as the official underground cut-off grade. The Moss Lake Historical Estimate is based on 352 diamond drill holes (90,978 m) drilled from 1983 and 2008. A fixed density of 2.78 g/cm3 was used. A minimum true thickness of 5.0 m was applied, using the grade of the adjacent material when assayed or a value of zero when not assayed. Capping was established at 35 g/t Au, supported by statistical analysis and the high grade distribution within the deposit. Compositing was done on drill hole sections falling within the mineralized zone solids (composite = 1 m). Resources were evaluated from drill hole samples using the ID2 interpolation method in a multi-folder percent block model using Gems version 6.4. Based on geostatistics, the ellipse range for interpolation was 75m x 67.5m x 40m. The Indicated category is defined by combining the blocks within the two main zones and various statistical criteria, such as average distance to composites, distance to closest composite, quantity of drill holes within the search area. Ounce (troy) = metric tons x grade / 31.10348. Calculations used metric units (metres, tonnes and g/t). The number of metric tonnes was rounded to the nearest thousand. Any discrepancies in the totals are due to rounding effects; rounding followed the recommendations in NI 43-101.
Source: McCracken, T. “Technical Report and Resource Estimate on the Osmani Gold Deposit, Coldstream Property, Northwestern Ontario”, prepared for Foundation Resources Inc. and Alto Ventures Ltd. The East Coldstream Historical Estimate is based on a 0.4 g/t Au cut-off grade. The qualified persons for the East Coldstream Historical Estimate are Todd McCracken, P.Geo. (Tetratech Wardrop), and Jeff Wilson, Ph.D., P.Geo. (Tetratech Wardrop), and the effective date of the East Coldstream Historical Estimate is December 12, 2011. Resources are presented unconstrained, undiluted and in situ. The East Coldstream Historical Estimate includes 2 gold-bearing zones. A cut-off grade of 0.4 g/t Au was selected as the official resource cut-off grade. The East Coldstream Historical Estimate is based on 116 diamond drill holes drilled from 1986 to 2011. A fixed density of 2.78 g/cm3 was used. Capping was established at 5.89 g/t Au and 5.70 g/t Au for domains EC-1 and EC-2, respectively. This is supported by statistical analysis and the high-grade distribution within the deposit. Compositing was done on drill hole sections falling within the mineralized zone solids (composite = 1 m). Resources were evaluated from drill hole samples using the ID2 interpolation method in a multi-folder percent block model using Datamine Studio 3 version 3.20.5321.0. Recource categorization is based on spatial continuity based from the variography of the assays within the drillholes. Ounce (troy) = metric tons x grade / 31.10348. Calculations used metric units (metres, tonnes and g/t). The number of metric tonnes was rounded to the nearest thousand. Any discrepancies in the totals are due to rounding effects; rounding followed the recommendations in NI 43-101.
The reader is cautioned that the Moss Lake Historical Estimate East and the East Coldstream Historical Estimate (the “Historical Estimates“) are considered historical in nature and as such is based on prior data and reports prepared by previous property owners. The reader is cautioned not to treat them, or any part of them, as current mineral resources or reserves. The Company has determined these historical resources are reliable, and relevant to be included here in that they demonstrate simply the mineral potential of the Moss Lake Gold Project. A qualified person has not done sufficient work to classify the Historical Estimates as current resources and Goldshore is not treating the Historical Estimates as current resources. Significant data compilation, re-drilling, re-sampling and data verification may be required by a qualified person before the Historical Estimates can be classified as a current resource. There can be no assurance that any of the historical mineral resources, in whole or in part, will ever become economically viable. In addition, mineral resources are not mineral reserves and do not have demonstrated economic viability. Even if classified as a current resource, there is no certainty as to whether further exploration will result in any inferred mineral resources being upgraded to an indicated or measured mineral resource category. The Historical Estimates relating to inferred mineral resources were calculated using prior mining industry standard definitions and practices for estimating mineral resource and mineral reserves. Such prior definitions and practices were utilized prior to the implementation of the current standards of the Canadian Institute of Mining for mineral resource estimation, and have a lower level of confidence.
Table 4: Reported Historical Production from the North Coldstream Deposit4
Deposit
Tonnes
Cu %
Au g/t
Ag
Cu lbs
Au oz
Ag oz
Historical Production
2,700,0000
1.89
0.56
5.59
102,000,000
44,000
440,000
Note:
Source: Schlanka, R., 1969. Copper, Nickel, Lead and Zinc Deposits of Ontario, Mineral Resources Circular No. 12, Ontario Geological Survey, pp. 314-316.
Peter Flindell, P.Geo., MAusIMM, MAIG, Vice President – Exploration of the Company, a qualified person under NI 43-101 has approved the scientific and technical information contained in this news release.
Neither the TSXV nor its Regulation Services Provider (as that term is defined in the policies of the TSXV) accepts responsibility for the adequacy or accuracy of this release.
For More Information – Please Contact:
Brett A. Richards President, Chief Executive Officer and Director Goldshore Resources Inc.
This news release contains statements that constitute “forward-looking statements.” Such forward-looking statements involve known and unknown risks, uncertainties and other factors that may cause the Company’s actual results, performance or achievements, or developments to differ materially from the anticipated results, performance or achievements expressed or implied by such forward-looking statements. Forward-looking statements are statements that are not historical facts and are generally, but not always, identified by the words “expects,” “plans,” “anticipates,” “believes,” “intends,” “estimates,” “projects,” “potential” and similar expressions, or that events or conditions “will,” “would,” “may,” “could” or “should” occur.
Forward-looking statements in this news release include, among others, statements relating to expectations regarding the exploration and development of the Moss Lake Gold Project, and other statements that are not historical facts. By their nature, forward-looking statements involve known and unknown risks, uncertainties and other factors which may cause our actual results, performance or achievements, or other future events, to be materially different from any future results, performance or achievements expressed or implied by such forward-looking statements. Such factors and risks include, among others: the Company may require additional financing from time to time in order to continue its operations which may not be available when needed or on acceptable terms and conditions acceptable; compliance with extensive government regulation; domestic and foreign laws and regulations could adversely affect the Company’s business and results of operations; the stock markets have experienced volatility that often has been unrelated to the performance of companies and these fluctuations may adversely affect the price of the Company’s securities, regardless of its operating performance; and the impact of COVID-19.
The forward-looking information contained in this news release represents the expectations of the Company as of the date of this news release and, accordingly, is subject to change after such date. Readers should not place undue importance on forward-looking information and should not rely upon this information as of any other date. The Company undertakes no obligation to update these forward-looking statements in the event that management’s beliefs, estimates or opinions, or other factors, should change.
This news release does not constitute an offer to sell, or a solicitation of an offer to buy, any securities in the United States. The securities have not been and will not be registered under the United States Securities Act of 1933, as amended (the “U.S. Securities Act”) or any state securities laws and may not be offered or sold within the United States or to U.S. Persons unless registered under the U.S. Securities Act and applicable state securities laws or an exemption from such registration is available.
VANCOUVER, British Columbia, Sept. 08, 2022 (GLOBE NEWSWIRE) — Rover Metals Corp. (TSXV: ROVR) (OTCQB: ROVMF) (FSE:4XO) (“Rover” or the “Company”) further to its release of August 16, 2022, Rover is pleased to announce the launch of its new website showcasing the pivot by the Company into critical minerals. On August 16, 2022, the Company announced its intent to option a 90% ownership interest in the Indian Mountain Lake VMS project, NT, Canada.
Indian Mountain Lake VMS Project The Indian Mountain Lake VMS Project has had exploration dating back to the 1940s and has a historical resource spread across four zones on the project. The BB Zone and Kennedy Lake Zone have a combined historic resource of 1,400,000 tons grading 10% combined zinc and lead with 3.5 OPT (ounces per ton) of silver*. Approximately 900 metres west of the BB Zone, the Kennedy Lake West Zone has a historic resource of 610,000 tons grading 1.15% copper*. About 8 km southeast of the BB Zone, the Susu Lake Zone, has a historical resource consisting of 142,500 tons grading 0.95% copper*.
The property is located approximately 195 km east-northeast of Yellowknife, NT, off the eastern arm of Great Slave Lake. Seasonal access relies upon fixed or rotor wing support. A right of way was cleared to the project from Thompson Landing in the 1970s. If this right of way were to be brushed out it would provide barge access at Thompson Landing, from Yellowknife, with ground transportation, considerably lowering any logistical costs. Future Government of Canada federally funded hydro-energy infrastructure could come close to the project if the Taltson Hydro Dam expansion proceeds through the eastern arm of Great Slave Lake into Yellowknife. At the southwest-end of Great Slave Lake, Osisko Metals is gearing up to reopen the Pine Point Zinc-Lead Mine. At nearby Hay River, NT, there is a rail line to the Teck Resources Zinc Refinery in Trail, BC.
*These resources are historic in nature. Further drilling is needed to bring them up to CIM Definition Standards. The historic data has not been verified by Rover. The historic information is provided in the 2103 Assessment Report for Indian Mountain Lake which is in public record with the Government of the Northwest Territories.
Technical information has been approved by Gary Vivian, M.Sc., P.Geo., QP for the purposes of NI 43-101.https://embed.fireplace.yahoo.com/embed?ctrl=Monalixa&m_id=monalixa&m_mode=document&site=sports&os=android&pageContext=%257B%2522ctopid%2522%253A%25221542500%253B1577000%2522%252C%2522hashtag%2522%253A%25221542500%253B1577000%2522%252C%2522wiki_topics%2522%253A%2522Indian_Mountain_Lake%252C_Pennsylvania%253BCompany%253BGreat_Slave_Lake%253BTSX_Venture_Exchange%253BGovernment_of_Canada%253BYellowknife%253BCanada%253BVancouver%253BMetal%2522%252C%2522lmsid%2522%253A%2522a0770000002m0AbAAI%2522%252C%2522revsp%2522%253A%2522globenewswire.com%2522%252C%2522lpstaid%2522%253A%2522536092c9-1665-3bdf-9dc6-31420ca7ae8e%2522%252C%2522pageContentType%2522%253A%2522story%2522%257D
An updating release will be provided once the Company has executed its Definitive Option Agreement for the Indian Mountain Lake project.
Judson Culter, CEO at Rover Metals, states “We see tremendous growth coming for critical minerals fueled by domestic EV demand in the U.S. and Canada. We are also excited to see initiatives being put in place by the securities regulators to help publicly traded junior mining companies succeed, this includes enforcing rules against manipulative stock trading practices, such as naked short selling.”
Corporate Update A Q&A interview with Rover’s CEO, Judson Culter, is now also available for viewing here.
Upcoming Conference Rover Metals will be presenting at the Redefining Electric Metals Conference in Calgary, AB, on September 19th and 20th. Registration is at www.redefiningelectricalmetals.com
Shares for Services Agreement The Toronto Venture Exchange (TSXV) has approved a shares for services agreement with one of the Company’s Advisors (the “Services Agreement”). The Services Agreement calls for monthly advisory services of $7,500 to be settled through the issuance of common shares in the Company for a three-month period beginning July 1, 2022 and ending on September 30, 2022. Thereafter, for the final three months of the contract, the monthly fee shall revert to $5,000 per month, with up to 50% of the $5,000 monthly fee to be settled in common shares of the Company, at the option of the Company. The share issuances shall be made on a quarterly basis, and the conversion price shall be the higher of: (1) closing price on the last trading day of the calendar business quarter, or (2) the five day VWAP at the end of the quarter. In connection with TSXV policy, the conversion price shall not be lower then $0.05 per share.
About Rover Metals Rover is a publicly traded junior mining company that trades on the TSXV under symbol ROVR, on the OTCQB under symbol ROVMF, and on the FSE under symbol 4XO. The Company is now developing both: (1) critical minerals projects; as well as (2) precious metals projects. The Company is exclusive to the mining jurisdictions of Canada and the U.S. Five of the Company’s mineral resource development projects are located near to the city of Yellowknife, 60th parallel, Canada.
ON BEHALF OF THE BOARD OF DIRECTORS “Judson Culter” Chief Executive Officer and Director
For further information, please contact: Email: info@rovermetals.com Phone: +1 (778) 754-2617
Statement Regarding Forward-Looking Information This news release contains statements that constitute “forward-looking statements.” Such forward-looking statements involve known and unknown risks, uncertainties and other factors that may cause Rover’s actual results, performance or achievements, or developments in the industry to differ materially from the anticipated results, performance or achievements expressed or implied by such forward-looking statements. Forward-looking statements are statements that are not historical facts and are generally, but not always, identified by the words “expects,” “plans,” “anticipates,” “believes,” “intends,” “estimates,” “projects,” “potential” and similar expressions, or that events or conditions “will,” “would,” “may,” “could” or “should” occur. There can be no assurance that such statements prove to be accurate. Actual results and future events could differ materially from those anticipated in such statements, and readers are cautioned not to place undue reliance on these forward-looking statements. Any factor could cause actual results to differ materially from Rover’s expectations. Rover undertakes no obligation to update these forward-looking statements in the event that management’s beliefs, estimates or opinions, or other factors, should change.
THE FORWARD-LOOKING INFORMATION CONTAINED IN THIS NEWS RELEASE REPRESENTS THE EXPECTATIONS OF THE COMPANY AS OF THE DATE OF THIS NEWS RELEASE AND, ACCORDINGLY, IS SUBJECT TO CHANGE AFTER SUCH DATE. READERS SHOULD NOT PLACE UNDUE IMPORTANCE ON FORWARD-LOOKING INFORMATION AND SHOULD NOT RELY UPON THIS INFORMATION AS OF ANY OTHER DATE. WHILE THE COMPANY MAY ELECT TO, IT DOES NOT UNDERTAKE TO UPDATE THIS INFORMATION AT ANY PARTICULAR TIME EXCEPT AS REQUIRED IN ACCORDANCE WITH APPLICABLE LAWS.
NEITHER THE TSX VENTURE EXCHANGE NOR ITS REGULATION PROVIDER (AS THAT TERM IS DEFINED IN THE POLICIES OF THE TSX VENTURE EXCHANGE) ACCEPTS RESPONSIBILITY FOR THE ADEQUACY OF THIS RELEASE.