Vancouver, British Columbia–(Newsfile Corp. – September 29, 2022) – Goldshore Resources Inc. (TSXV: GSHR) (OTCQB: GSHRF) (FSE: 8X00) (“Goldshore” or the “Company“), is pleased to announce assay results from its ongoing 100,000-meter drill program at the Moss Lake Project in Northwest Ontario, Canada (the “Moss Lake Gold Project“).
Highlights:
- Results for five holes, drilled to infill historic but poorly surveyed drill sections in the Main Zone, have confirmed higher-grade gold mineralization within a large volume of well mineralized diorite with best intercepts of:
- 192.75m @ 1.02 g/t Au from 94.45m depth in MMD-22-051, including
- 62m @ 1.49 g/t Au from 113m and
- 48.7m @ 1.29 g/t Au from 208.3m
- 11.85m @ 1.87 g/t Au from 441.15m depth in MMD-22-041
- 28.0m @ 1.51 g/t Au from 580.0m depth in MMD-22-046, including
- 11.0m @ 3.45 g/t Au from 587.0m
- 9.75m @ 1.78 g/t Au from 282.55m depth in MMD-22-047
- 34.25m @ 1.03 g/t Au from 209.0m depth in MMD-22-049, including
- 3.8m @ 6.98 g/t Au from 239.45m
President and CEO Brett Richards stated: “As we have been discussing for some time, the continued results of intersecting wide zones of +1 g/t Au mineralization underpin our belief that the Moss Lake Deposit has potential to develop an initial high-grade phase 1 open pit within the larger low-grade open pit operation. It can be seen that the projected grade shell of +1.0 g/t Au is significant at this early stage, and we will look to further explore these high grade areas, as we continue with our program.”
Technical Overview
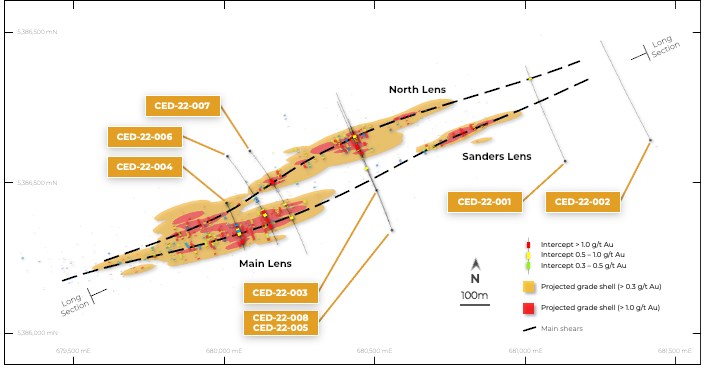
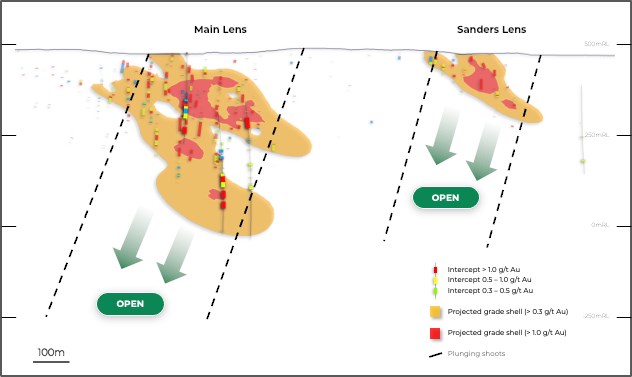
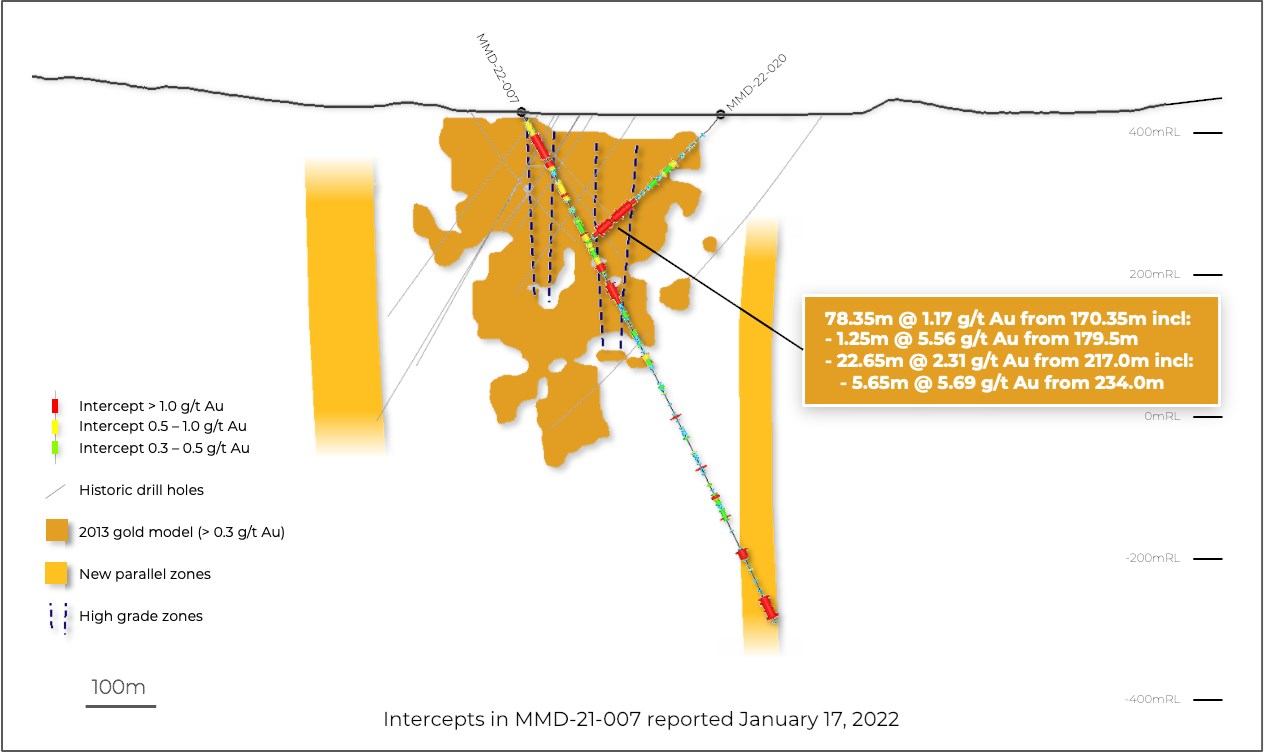
Figure 1 shows the better intercepts in plain view and Figure 2 is a typical section through hole MMD-22-041 and MMD-22-051.

Figure 1: Drill plan showing best of several +1 g/t Au intercepts relative to implicit modelled grade shells
To view an enhanced version of this graphic, please visit:
https://images.newsfilecorp.com/files/8051/138713_5b416c09a4a41877_002full.jpg
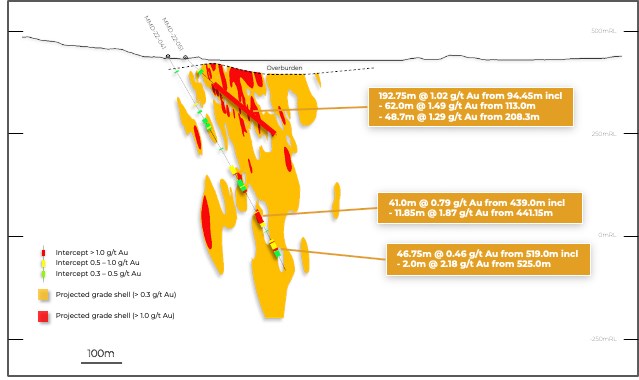
Figure 2: Drill section through MMD-22-041 and MMD-22-051 relative to implicit modelled grade shells
To view an enhanced version of this graphic, please visit:
https://images.newsfilecorp.com/files/8051/138713_5b416c09a4a41877_003full.jpg
Table 1 shows the significant intercepts. Table 2 shows the drill hole locations.
Table 1: Significant downhole gold intercepts
| HOLE ID | FROM | TO | LENGTH (m) | TRUE WIDTH (m) | CUT GRADE (g/t Au) | UNCUT GRADE (g/t Au) |
| MMD-22-041 | 41.00 | 45.00 | 4.00 | 2.0 | 0.38 | 0.38 |
| 132.80 | 137.00 | 4.20 | 2.1 | 0.75 | 0.75 | |
| 152.75 | 158.60 | 5.85 | 3.0 | 0.39 | 0.39 | |
| 175.35 | 187.00 | 11.65 | 5.9 | 0.30 | 0.30 | |
| 189.90 | 205.25 | 15.35 | 7.8 | 0.36 | 0.36 | |
| 258.75 | 262.15 | 3.40 | 1.7 | 0.48 | 0.48 | |
| 308.10 | 332.05 | 23.95 | 12.3 | 0.67 | 0.67 | |
| including | 330.00 | 332.05 | 2.05 | 1.1 | 1.89 | 1.89 |
| 348.45 | 383.00 | 34.55 | 18.0 | 0.43 | 0.43 | |
| including | 380.00 | 382.00 | 2.00 | 1.0 | 2.50 | 2.50 |
| 439.00 | 480.00 | 41.00 | 21.3 | 0.79 | 0.79 | |
| including | 441.15 | 453.00 | 11.85 | 6.1 | 1.87 | 1.87 |
| 493.00 | 495.35 | 2.35 | 1.2 | 0.32 | 0.32 | |
| 519.00 | 565.75 | 46.75 | 24.3 | 0.46 | 0.46 | |
| including | 525.00 | 527.00 | 2.00 | 1.0 | 2.18 | 2.18 |
| and | 543.50 | 549.00 | 5.50 | 2.9 | 1.02 | 1.02 |
| MMD-22-046 | 8.00 | 37.50 | 29.50 | 14.3 | 0.50 | 0.50 |
| including | 29.40 | 31.40 | 2.00 | 1.0 | 1.16 | 1.16 |
| 65.00 | 111.00 | 46.00 | 21.9 | 0.82 | 0.82 | |
| including | 66.00 | 77.00 | 11.00 | 5.3 | 1.41 | 1.41 |
| and | 100.00 | 111.00 | 11.00 | 5.2 | 1.30 | 1.29 |
| 144.00 | 148.00 | 4.00 | 1.9 | 0.31 | 0.31 | |
| 154.00 | 157.00 | 3.00 | 1.4 | 0.55 | 0.55 | |
| 172.00 | 182.00 | 10.00 | 4.6 | 1.29 | 1.29 | |
| including | 176.00 | 182.00 | 6.00 | 2.8 | 1.96 | 1.96 |
| 220.00 | 239.00 | 19.00 | 8.5 | 0.48 | 0.48 | |
| 253.00 | 268.00 | 15.00 | 6.7 | 0.35 | 0.35 | |
| 306.45 | 346.00 | 39.55 | 17.3 | 0.71 | 0.71 | |
| including | 307.00 | 312.25 | 5.25 | 2.3 | 2.48 | 2.48 |
| and | 334.00 | 336.10 | 2.10 | 0.9 | 2.93 | 2.93 |
| and | 342.00 | 344.20 | 2.20 | 1.0 | 1.27 | 1.27 |
| 370.00 | 386.90 | 16.90 | 7.4 | 0.37 | 0.37 | |
| 411.00 | 416.90 | 5.90 | 2.5 | 0.31 | 0.31 | |
| 421.90 | 496.55 | 74.65 | 32.1 | 0.66 | 0.66 | |
| including | 424.00 | 426.00 | 2.00 | 0.9 | 2.51 | 2.51 |
| and | 468.10 | 472.00 | 3.90 | 1.7 | 3.37 | 3.37 |
| 512.45 | 520.00 | 7.55 | 3.2 | 0.46 | 0.46 | |
| 575.00 | 577.00 | 2.00 | 0.8 | 0.45 | 0.45 | |
| 580.00 | 608.00 | 28.00 | 11.8 | 1.51 | 1.51 | |
| including | 587.00 | 598.00 | 11.00 | 4.6 | 3.45 | 3.45 |
| MMD-22-047 | 26.50 | 59.70 | 33.20 | 22.6 | 0.36 | 0.36 |
| including | 40.50 | 43.90 | 3.40 | 2.3 | 1.08 | 1.08 |
| 94.90 | 107.00 | 12.10 | 8.4 | 0.35 | 0.35 | |
| 136.40 | 138.90 | 2.50 | 1.7 | 0.30 | 0.30 | |
| 141.90 | 204.90 | 63.00 | 43.8 | 0.37 | 0.37 | |
| including | 172.20 | 175.05 | 2.85 | 2.0 | 1.12 | 1.12 |
| 239.90 | 242.75 | 2.85 | 2.0 | 1.09 | 1.09 | |
| including | 240.65 | 242.75 | 2.10 | 1.5 | 1.29 | 1.29 |
| 282.55 | 333.90 | 51.35 | 36.9 | 0.73 | 0.73 | |
| including | 282.55 | 292.30 | 9.75 | 7.0 | 1.78 | 1.78 |
| 363.90 | 366.20 | 2.30 | 1.7 | 0.52 | 0.52 | |
| 371.80 | 375.60 | 3.80 | 2.8 | 0.36 | 0.36 | |
| 398.90 | 407.70 | 8.80 | 6.4 | 0.54 | 0.54 | |
| 580.00 | 582.70 | 2.70 | 2.1 | 0.34 | 0.34 | |
| MMD-22-049 | 20.00 | 47.00 | 27.00 | 13.8 | 0.59 | 0.59 |
| 68.25 | 91.00 | 22.75 | 11.6 | 0.48 | 0.48 | |
| 140.00 | 142.00 | 2.00 | 1.0 | 0.35 | 0.35 | |
| 166.00 | 193.00 | 27.00 | 13.7 | 0.44 | 0.44 | |
| 209.00 | 243.25 | 34.25 | 17.7 | 1.03 | 1.03 | |
| including | 217.95 | 220.00 | 2.05 | 1.1 | 2.09 | 2.09 |
| and | 239.45 | 243.25 | 3.80 | 2.0 | 6.98 | 6.98 |
| 254.35 | 279.70 | 25.35 | 13.2 | 0.66 | 0.66 | |
| including | 254.80 | 260.65 | 5.85 | 3.1 | 2.07 | 2.07 |
| 290.75 | 318.00 | 27.25 | 14.1 | 0.50 | 0.50 | |
| 353.00 | 410.00 | 57.00 | 29.4 | 0.51 | 0.51 | |
| 434.00 | 436.00 | 2.00 | 1.1 | 0.54 | 0.54 | |
| 468.50 | 471.40 | 2.90 | 1.6 | 0.31 | 0.31 | |
| 518.00 | 523.00 | 5.00 | 2.8 | 0.38 | 0.38 | |
| 572.00 | 575.30 | 3.30 | 1.9 | 0.53 | 0.53 | |
| 640.70 | 642.90 | 2.20 | 1.3 | 0.59 | 0.59 | |
| MMD-22-051 | 44.85 | 55.60 | 10.75 | 7.9 | 0.35 | 0.35 |
| 94.45 | 287.20 | 192.75 | 149.1 | 1.02 | 1.02 | |
| including | 94.45 | 97.00 | 2.55 | 1.9 | 1.08 | 1.08 |
| and | 113.00 | 175.00 | 62.00 | 48.0 | 1.49 | 1.49 |
| and | 188.00 | 191.80 | 3.80 | 2.9 | 1.59 | 1.59 |
| and | 208.30 | 257.00 | 48.70 | 37.7 | 1.29 | 1.29 |
| Intersections calculated above at 0.3 g/t Au cut off with a top cut of 30 g/t Au and a maximum internal waste interval of 10 metres. Bordered intervals are intersections calculated above a 1.0 g/t Au cut off. Intervals in bold are those with a grade thickness factor exceeding 20 gram x metres / tonne gold. True widths are approximate and assume a subvertical body. |
Table 2: Location of drill holes in this press release
| HOLE | EAST | NORTH | RL | AZIMUTH | DIP | EOH |
| MMD-22-041 | 668,784 | 5,379,185 | 436 | 154° | -61° | 606.0 |
| MMD-22-046 | 668,865 | 5,379,218 | 435 | 156° | -61° | 609.1 |
| MMD-22-047 | 669,155 | 5,379,424 | 429 | 153° | -47° | 602.05 |
| MMD-22-049 | 668,953 | 5,379,245 | 428 | 155° | -60° | 666.05 |
| MMD-22-051 | 668,704 | 5,379,104 | 434 | 154° | -45° | 293.0 |
| Approximate collar coordinates in NAD 83, Zone 15N |
Results have been received for five holes that have infilled areas of the Main Zone that are between sections drilled by historic holes with collar survey problems. As a result, they will replace the low-confidence historic holes in the upcoming resource model update.
As with the historic holes, these holes intersected several broad zones of low-grade mineralization within the altered diorite intrusion host. Examples include 41.0m @ 0.79 g/t Au from 439.0m depth and 46.75m @ 0.46 g/t Au from 519.0m in MMD-22-041; 88.0m @ 0.48 g/t Au from 388.0m in MMD-22-042; 46.0m @ 0.82 g/t Au from 65.0m, 39.55m @ 0.71 g/t Au from 306.45m and 74.65m @ 0.66 g/t Au from 421.9m in MMD-22-046; 63.0m @ 0.37 g/t Au from 141.9m and 51.35m @ 0.73 g/t Au from 282.55m in MMD-22-047; and 57.0m @ 0.51 g/t Au from 353.0m in MMD-22-049. The long intercept in MMD-22-051 of 192.75m @ 1.02 g/t Au from 94.45m is similar but higher grade.
All these low-grade zones occur as envelopes to higher-grade structures that form a three-dimensional, anastomosing shear network that has developed in response to strain on the altered diorite intrusion. Results include the broad zones of +1 g/t Au mineralization shown in the highlights (e.g., 192.75m @ 1.02 g/t Au from 94.45m depth in MMD-22-051) and several narrow high-grade intervals, including 1.0m @ 9.14 g/t Au from 449.0m depth in MMD-22-041; 1.0m @ 12.7 g/t Au from 441.0m, 0.9m @ 9.99 g/t Au from 468.1m and 1.0m @ 16.6 g/t Au from 587.0m in MMD-22-046; 0.85m @ 5.93 g/t Au from 290.7m in MMD-22-047; 0.45m @ 8.22 g/t Au from 30.55m, 0.75m @ 12.0 g/t Au from 421.25m, 0.55m @ 9.93 g/t Au from 306.95m and 0.65m @ 15.1 g/t Au from 365.35m in MMD-22-049; and 1.0m @ 14.0 g/t Au from 159.0m and 1.0m @ 10.6 g/t Au from 256.0m in MMD-22-051.
Geological modelling of the altered diorite host rock and anastomosing shear network has progressed faster than anticipated and is nearly complete. The new model will enable the interpolation of low and high-grade gold populations within constraining wireframes, which we expect will provide a more accurate estimation of the gold distribution and, therefore, the contained gold resource.
Pete Flindell, VP Exploration for Goldshore, said, “These drill results confirm our contention that there are coherent zones of +1 g/t Au gold mineralization with a “sea” of low grade mineralization that should allow for the generation of a smaller, higher-grade resource at the Moss Lake Project. Drilling around these higher grade zones continues.”
Analytical and QA/QC Procedures
All samples were sent to ALS Geochemistry in Thunder Bay for preparation and analysis was performed in the ALS Vancouver analytical facility. ALS is accredited by the Standards Council of Canada (SCC) for the Accreditation of Mineral Analysis Testing Laboratories and CAN-P-4E ISO/IEC 17025. Samples were analyzed for gold via fire assay with an AA finish (“Au-AA23”) and 48 pathfinder elements via ICP-MS after four-acid digestion (“ME-MS61”). Samples that assayed over 10 ppm Au were re-run via fire assay with a gravimetric finish (“Au-GRA21”).
In addition to ALS quality assurance / quality control (“QA/QC”) protocols, Goldshore has implemented a quality control program for all samples collected through the drilling program. The quality control program was designed by a qualified and independent third party, with a focus on the quality of analytical results for gold. Analytical results are received, imported to our secure on-line database and evaluated to meet our established guidelines to ensure that all sample batches pass industry best practice for analytical quality control. Certified reference materials are considered acceptable if values returned are within three standard deviations of the certified value reported by the manufacture of the material. In addition to the certified reference material, certified blank material is included in the sample stream to monitor contamination during sample preparation. Blank material results are assessed based on the returned gold result being less than ten times the quoted lower detection limit of the analytical method. The results of the on-going analytical quality control program are evaluated and reported to Goldshore by Orix Geoscience Inc.
About Goldshore
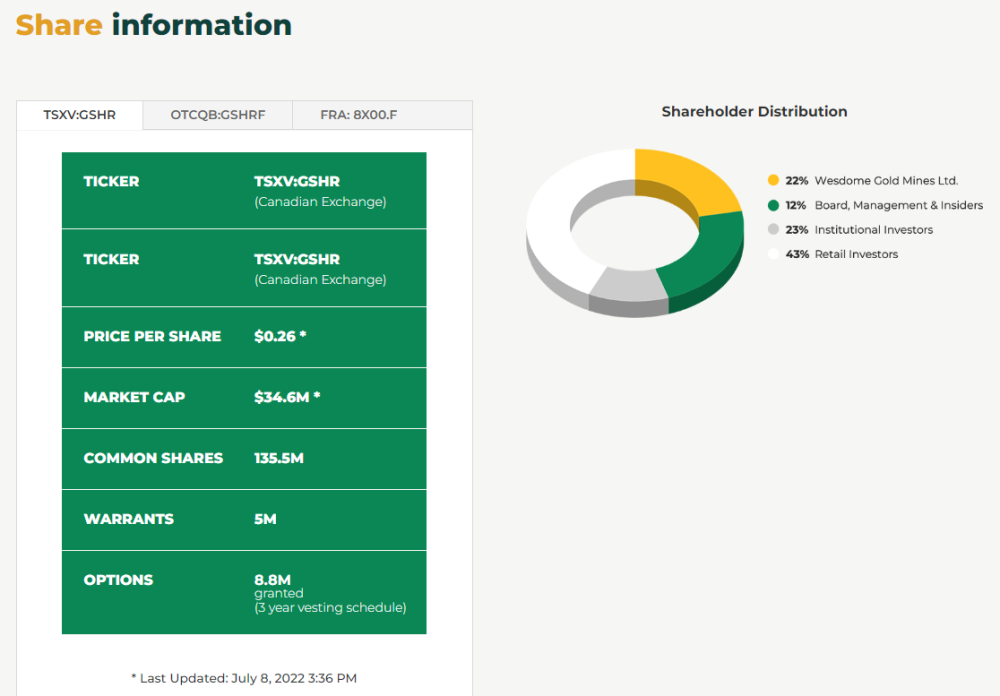
Goldshore is an emerging junior gold development company, and owns the Moss Lake Gold Project located in Ontario. Wesdome is currently a large shareholder of Goldshore with an approximate 27% equity position in the Company. Well-financed and supported by an industry-leading management group, board of directors and advisory board, Goldshore is positioned to advance the Moss Lake Gold Project through the next stages of exploration and development.
About the Moss Lake Gold Project
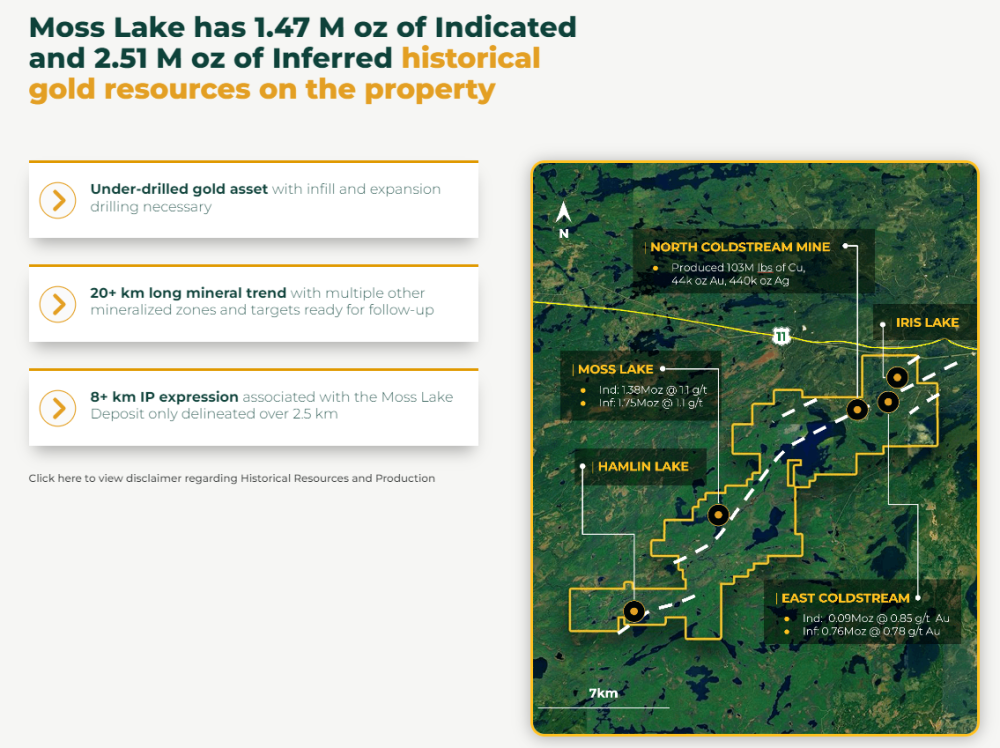
The Moss Lake Gold Project is located approximately 100 km west of the city of Thunder Bay, Ontario. It is accessed via Highway 11 which passes within 1 km of the property boundary to the north. The Moss Lake Gold Project covers 14,292 hectares and consists of 282 unpatented and patented mining claims.
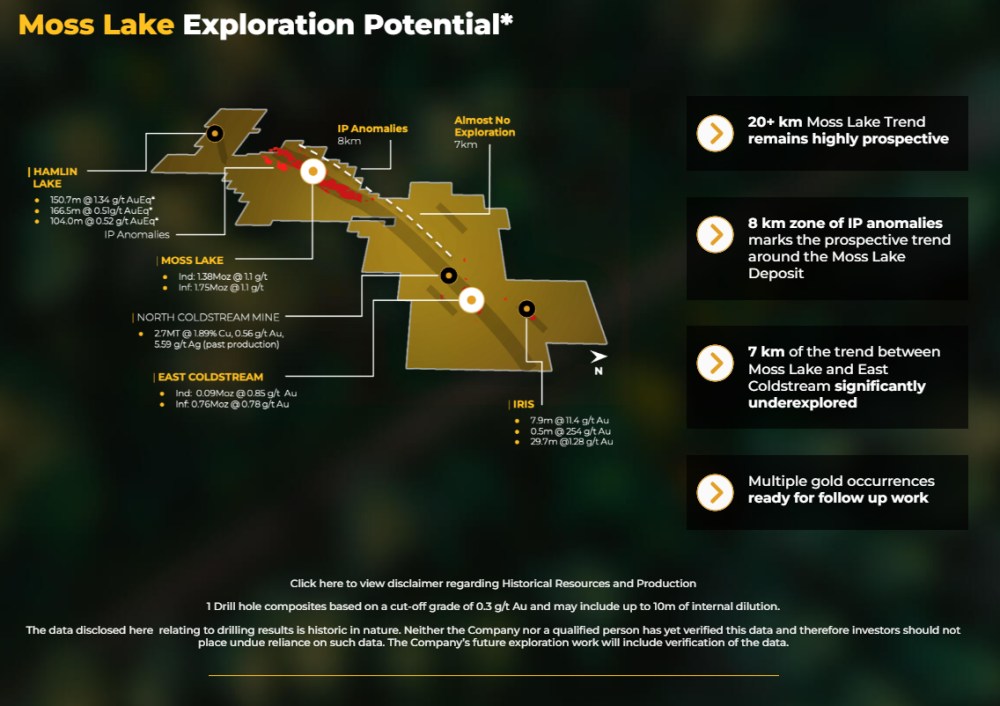
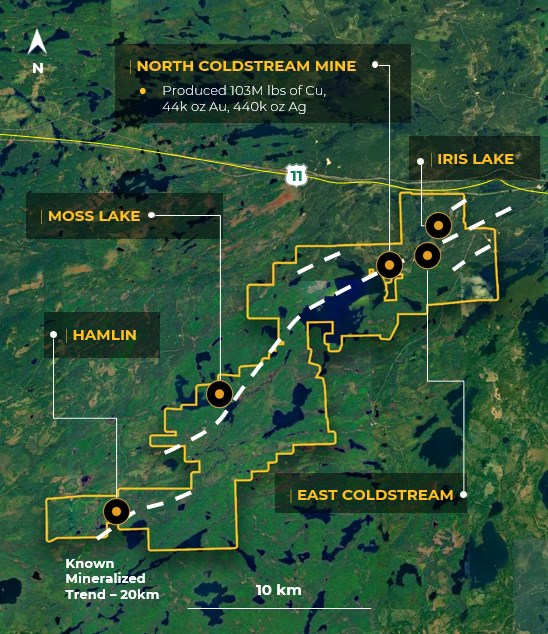
The Moss Lake Gold Project hosts a number of gold and base metal rich deposits including the Moss Lake Deposit, the East Coldstream Deposit (Table 3), the historically producing North Coldstream Mine (Table 4), and the Hamlin Zone, all of which occur over a mineralized trend exceeding 20 km in length. A historical preliminary economic assessment (the “Moss Lake Historical Estimate“) was completed on the Moss Lake Gold Project in 2013 and published by Moss Lake Gold Mines Ltd. (“Moss Lake Gold Mines“)1,3. A historical mineral resource estimate (the “East Coldstream Historical Estimate“) was completed on the East Coldstream Deposit in 2011 by Foundation Resources Inc.2,3 In addition to these zones, the Moss Lake Gold Project also hosts a number of under-explored mineral occurrences which are reported to exist both at surface and in historically drilled holes. The Moss Lake Deposit is a shear-hosted disseminated-style gold deposit which outcrops at surface. It has been drilled over a 2.5 km length and to depths of 300 m with 376 holes completed between 1983 and 2017. The last drilling program conducted in 2016 and 2017 by Wesdome Gold Mines Ltd. (“Wesdome“), which consisted of widely spaced holes along the strike extension of the deposit was successful in expanding the mineralized footprint and hydrothermal system 1.6 km to the northeast. Additionally, the deposit remains largely open to depth. In 2017, Wesdome completed an induced polarization survey which traced the potential extensions of pyrite mineralization associated with the Moss Lake Deposit over a total strike length of 8 km and spanning the entire extent of the survey grids.
The East Coldstream Deposit is a shear-hosted disseminated-style gold deposit which locally outcrops at surface. It has been drilled over a 1.3 km length and to depths of 200 m with 138 holes completed between 1988 and 2017. The deposit remains largely open at depth and may have the potential for expansion along strike. Historic drill hole highlights from the East Coldstream Deposit include 4.86 g/t Au over 27.3 m in C-10-15.
The historically producing North Coldstream Mine is reported to have produced significant amounts of copper, gold and silver4 from mineralization with potential iron-oxide-copper-gold deposit style affinity. The exploration potential immediately surrounding the historic mining area is not currently well understood and historic data compilation is required.
The Hamlin Zone is a significant occurrence of copper and gold mineralization, and also of potential iron-oxide-copper-gold deposit style affinity. Between 2008 and 2011, Glencore tested Hamlin with 24 drill holes which successfully outlined a broad and intermittently mineralized zone over a strike length of 900 m. Historic drill hole highlights from the Hamlin Zone include 0.9 g/t Au and 0.35% Cu over 150.7 m in HAM-11-75.
The Moss Lake, East Coldstream and North Coldstream deposits sit on a mineral trend marked by a regionally significant deformation zone locally referred to as the Wawiag Fault Zone in the area of the Moss Lake Deposit. This deformation zone occurs over a length of approximately 20 km on the Moss Lake Gold Project and there is an area spanning approximately 7 km between the Moss Lake and East Coldstream deposits that is significantly underexplored.
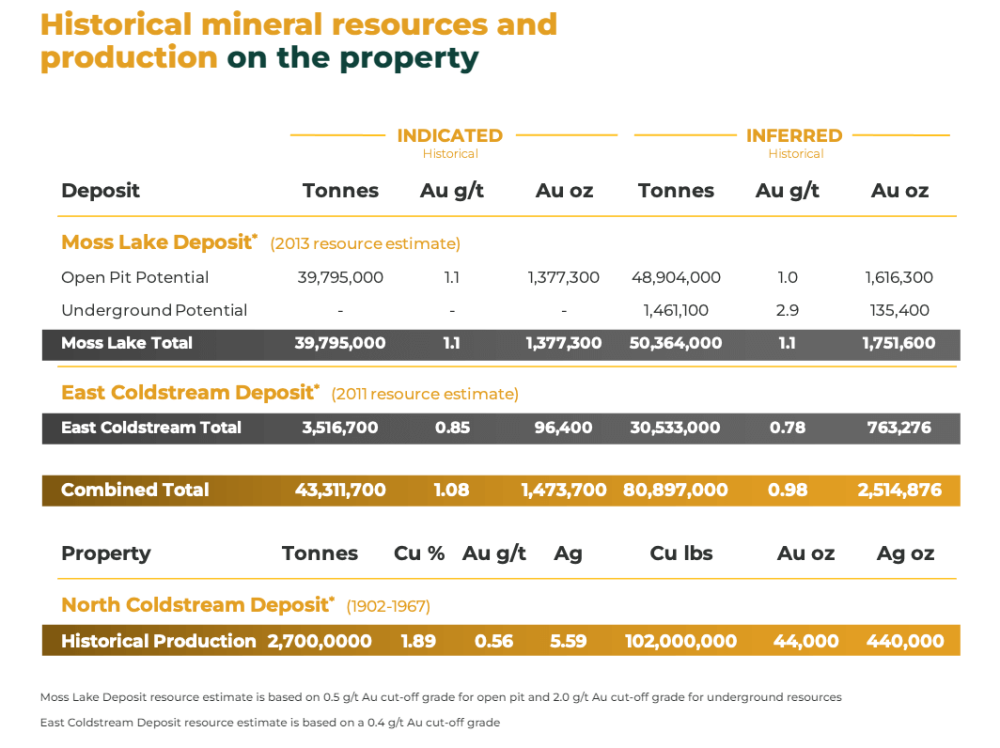
Table 3: Historical Mineral Resources1,2,3
| INDICATED | INFERRED | |||||
| Deposit | Tonnes | Au g/t | Au oz | Tonnes | Au g/t | Au oz |
| Moss Lake Historical Estimate | ||||||
| Open Pit Potential | 39,795,000 | 1.1 | 1,377,300 | 48,904,000 | 1.0 | 1,616,300 |
| Underground Potential | – | – | – | 1,461,100 | 2.9 | 135,400 |
| Moss Lake Total | 39,795,000 | 1.1 | 1,377,300 | 50,364,000 | 1.1 | 1,751,600 |
| East Coldstream Historical Estimate | ||||||
| East Coldstream Total | 3,516,700 | 0.85 | 96,400 | 30,533,000 | 0.78 | 763,276 |
| Combined Total | 43,311,700 | 1.08 | 1,473,700 | 80,897,000 | 0.98 | 2,514,876 |
Notes:
(1) Source: Poirier, S., Patrick, G.A., Richard, P.L., and Palich, J. “Technical Report and Preliminary Economic Assessment for the Moss Lake Project”, prepared for Moss Lake Gold Mines Ltd. The qualified persons for the Moss Lake Historical Estimate are Pierre-Luc Richard, MSc, PGeo (InnovExplo Inc), and Carl Pelletier, BSc, PGeo (InnovExplo Inc), and the effective date of the Moss Lake Historical Estimate is February 8, 2013. In-Pit results are presented undiluted and in situ, within Whittle-optimized pit shells. Underground results are presented undiluted and in situ, outside Whittle-optimized pit shells. The Moss Lake Historical Estimate includes 18 gold-bearing zones and 1 envelope containing isolated gold intercepts. Whittle parameters: mining cost = C$2.28; pit slope angle = 50.0 degrees; production cost = C$9.55; mining Dilution = 5%; mining recovery = 95%; processing recovery = 80% to 85%; gold price = C$1,500. In-Pit and Underground resources were compiled at cut-off grades from 0.3 to 5.0 g/t Au (for sensitivity characterization). A cut-off grade of 0.5 g/t Au was selected as the official in-pit cut-off grade and a cut-off grade of 2.0 g/t Au was selected as the official underground cut-off grade. The Moss Lake Historical Estimate is based on 352 diamond drill holes (90,978 m) drilled from 1983 and 2008. A fixed density of 2.78 g/cm3 was used. A minimum true thickness of 5.0 m was applied, using the grade of the adjacent material when assayed or a value of zero when not assayed. Capping was established at 35 g/t Au, supported by statistical analysis and the high grade distribution within the deposit. Compositing was done on drill hole sections falling within the mineralized zone solids (composite = 1 m). Resources were evaluated from drill hole samples using the ID2 interpolation method in a multi-folder percent block model using Gems version 6.4. Based on geostatistics, the ellipse range for interpolation was 75m x 67.5m x 40m. The Indicated category is defined by combining the blocks within the two main zones and various statistical criteria, such as average distance to composites, distance to closest composite, quantity of drill holes within the search area. Ounce (troy) = metric tons x grade / 31.10348. Calculations used metric units (metres, tonnes and g/t). The number of metric tonnes was rounded to the nearest thousand. Any discrepancies in the totals are due to rounding effects; rounding followed the recommendations in NI 43-101.
(2) Source: McCracken, T. “Technical Report and Resource Estimate on the Osmani Gold Deposit, Coldstream Property, Northwestern Ontario”, prepared for Foundation Resources Inc. and Alto Ventures Ltd. The East Coldstream Historical Estimate is based on a 0.4 g/t Au cut-off grade. The qualified persons for the East Coldstream Historical Estimate are Todd McCracken, P.Geo. (Tetratech Wardrop), and Jeff Wilson, Ph.D., P.Geo. (Tetratech Wardrop), and the effective date of the East Coldstream Historical Estimate is December 12, 2011. Resources are presented unconstrained, undiluted and in situ. The East Coldstream Historical Estimate includes 2 gold-bearing zones. A cut-off grade of 0.4 g/t Au was selected as the official resource cut-off grade. The East Coldstream Historical Estimate is based on 116 diamond drill holes drilled from 1986 to 2011. A fixed density of 2.78 g/cm3 was used. Capping was established at 5.89 g/t Au and 5.70 g/t Au for domains EC-1 and EC-2, respectively. This is supported by statistical analysis and the high grade distribution within the deposit. Compositing was done on drill hole sections falling within the mineralized zone solids (composite = 1 m). Resources were evaluated from drill hole samples using the ID2 interpolation method in a multi-folder percent block model using Datamine Studio 3 version 3.20.5321.0. Resource categorization is based on spatial continuity based from the variography of the assays within the drillholes. Ounce (troy) = metric tons x grade / 31.10348. Calculations used metric units (metres, tonnes and g/t). The number of metric tonnes was rounded to the nearest thousand. Any discrepancies in the totals are due to rounding effects; rounding followed the recommendations in NI 43-101.
(3) The reader is cautioned that the Moss Lake Historical Estimate East and the East Coldstream Historical Estimate (the “Historical Estimates“) are considered historical in nature and as such is based on prior data and reports prepared by previous property owners. The reader is cautioned not to treat them, or any part of them, as current mineral resources or reserves. The Company has determined these historical resources are reliable, and relevant to be included here in that they demonstrate simply the mineral potential of the Moss Lake Gold Project. A qualified person has not done sufficient work to classify the Historical Estimates as current resources and Goldshore is not treating the Historical Estimates as current resources. Significant data compilation, re-drilling, re-sampling and data verification may be required by a qualified person before the Historical Estimates can be classified as a current resource. There can be no assurance that any of the historical mineral resources, in whole or in part, will ever become economically viable. In addition, mineral resources are not mineral reserves and do not have demonstrated economic viability. Even if classified as a current resource, there is no certainty as to whether further exploration will result in any inferred mineral resources being upgraded to an indicated or measured mineral resource category. The Historical Estimates relating to inferred mineral resources were calculated using prior mining industry standard definitions and practices for estimating mineral resource and mineral reserves. Such prior definitions and practices were utilized prior to the implementation of the current standards of the Canadian Institute of Mining for mineral resource estimation, and have a lower level of confidence.
Table 4: Reported Historical Production from the North Coldstream Deposit4
| Deposit | Tonnes | Cu % | Au g/t | Ag | Cu lbs | Au oz | Ag oz |
| Historical Production | 2,700,0000 | 1.89 | 0.56 | 5.59 | 102,000,000 | 44,000 | 440,000 |
Note:
(4) Source: Schlanka, R., 1969. Copper, Nickel, Lead and Zinc Deposits of Ontario, Mineral Resources Circular No. 12, Ontario Geological Survey, pp. 314-316.
Peter Flindell, P.Geo., MAusIMM, MAIG, Vice President – Exploration of the Company, a qualified person under NI 43-101 has approved the scientific and technical information contained in this news release.
Neither the TSXV nor its Regulation Services Provider (as that term is defined in the policies of the TSXV) accepts responsibility for the adequacy or accuracy of this release.
For More Information – Please Contact:
Brett A. Richards
President, Chief Executive Officer and Director
Goldshore Resources Inc.
P. +1 604 288 4416 M. +1 905 449 1500
E. brichards@goldshoreresources.com
W. www.goldshoreresources.com
Facebook: GoldShoreRes | Twitter: GoldShoreRes | LinkedIn: goldshoreres
Cautionary Note Regarding Forward-Looking Statements
This news release contains statements that constitute “forward-looking statements.” Such forward looking statements involve known and unknown risks, uncertainties and other factors that may cause the Company’s actual results, performance or achievements, or developments to differ materially from the anticipated results, performance or achievements expressed or implied by such forward-looking statements. Forward looking statements are statements that are not historical facts and are generally, but not always, identified by the words “expects,” “plans,” “anticipates,” “believes,” “intends,” “estimates,” “projects,” “potential” and similar expressions, or that events or conditions “will,” “would,” “may,” “could” or “should” occur.
Forward-looking statements in this news release include, among others, statements relating to expectations regarding the exploration and development of the Moss Lake Gold Project, and other statements that are not historical facts. By their nature, forward-looking statements involve known and unknown risks, uncertainties and other factors which may cause our actual results, performance or achievements, or other future events, to be materially different from any future results, performance or achievements expressed or implied by such forward-looking statements. Such factors and risks include, among others: the Company may require additional financing from time to time in order to continue its operations which may not be available when needed or on acceptable terms and conditions acceptable; compliance with extensive government regulation; domestic and foreign laws and regulations could adversely affect the Company’s business and results of operations; the stock markets have experienced volatility that often has been unrelated to the performance of companies and these fluctuations may adversely affect the price of the Company’s securities, regardless of its operating performance; and the impact of COVID-19.
The forward-looking information contained in this news release represents the expectations of the Company as of the date of this news release and, accordingly, is subject to change after such date. Readers should not place undue importance on forward-looking information and should not rely upon this information as of any other date. The Company undertakes no obligation to update these forward-looking statements in the event that management’s beliefs, estimates or opinions, or other factors, should change.
This news release does not constitute an offer to sell, or a solicitation of an offer to buy, any securities in the United States. The securities have not been and will not be registered under the United States Securities Act of 1933, as amended (the “U.S. Securities Act”) or any state securities laws and may not be offered or sold within the United States or to U.S. Persons unless registered under the U.S. Securities Act and applicable state securities laws or an exemption from such registration is available.

To view the source version of this press release, please visit https://www.newsfilecorp.com/release/138713