TORONTO, Feb. 8, 2023 /CNW/ – Collective Mining Ltd. (TSXV: CNL) (OTCQX: CNLMF) (“Collective” or the “Company”) will be presenting at the OTC Markets Group Precious Metals Virtual Investor Conference on Wednesday, February 15, 2023, at 11:00am ET.
Using the link below, investors can register and listen to the presentation, and take part in a question and answer session at the end. The presentation is expected to last 30 minutes.
DATE: Wednesday, February 15, 2023 TIME: 11:00am ET – 11:30am ET LINK:https://bit.ly/3JCTs89
Please log in 5-10 minutes early to register. An archived webcast will also be made available after the event.
Ari Sussman, Executive Chairman of Collective Mining will be providing an overview and will discuss the Company’s “Main Breccia” discovery at the Apollo target. The Main Breccia discovery is a high-grade and bulk tonnage, copper-silver-gold porphyry-related breccia system characterized by two main, yet distinct pulses of mineralized fluids flooding the breccia with metals.
The Company’s Guayabales project is located in the mining-friendly department of Caldas, Colombia, in the heart of a long-established mining camp with ten fully permitted and operating mines located within three kilometres of the project. As a result, the Guayabales project is blessed with excellent infrastructure with roads and hydroelectric powerlines traversing the project and an abundant labour force located nearby in the townships of Supia and Marmato.
The phase II drilling program is underway with three rigs currently operating focused on testing near surface mineralization and expanding the dimensions of the Main Breccia system. Assay results are expected in the near term for the final three holes of the 2022 program, including westwards step-out hole APC-28, which cut more than 600 metres of continuous mineralization. Additionally, the first hole of the Phase II program is now complete, and core has been dispatched to the lab for assaying.
About Collective Mining Ltd.
To see our latest corporate presentation and related information, please visit www.collectivemining.com
Founded by the team that developed and sold Continental Gold Inc. to Zijin Mining for approximately $2 billion in enterprise value, Collective Mining is a copper, silver and gold exploration company based in Canada, with projects in Caldas, Colombia. The Company has options to acquire 100% interests in two projects located directly within an established mining camp with ten fully permitted and operating mines.
The Company’s flagship project, Guayabales, is anchored by the Apollo target, which hosts the large-scale, bulk-tonnage and high-grade copper, silver and gold Main Breccia discovery. The Company’s near-term objective is to continue with expansion drilling of the Main Breccia discovery while increasing confidence in the highest-grade portions of the system.
Management, insiders and close family and friends own approximately 52% of the outstanding shares of the Company and as a result, are fully aligned with shareholders. The Company is listed on the TSXV under the trading symbol “CNL” and on the OTCQX under the trading symbol “CNLMF”.
Information Contact:
Follow Executive Chairman Ari Sussman (@Ariski) and Collective Mining (@CollectiveMini1) on Twitter
FORWARD-LOOKING STATEMENTS
This news release contains certain forward-looking statements, including, but not limited to, statements about the drill programs, including timing of results, and Collective’s future and intentions. Wherever possible, words such as “may”, “will”, “should”, “could”, “expect”, “plan”, “intend”, “anticipate”, “believe”, “estimate”, “predict” or “potential” or the negative or other variations of these words, or similar words or phrases, have been used to identify these forward-looking statements. These statements reflect management’s current beliefs and are based on information currently available to management as at the date hereof.
Forward-looking statements involve significant risk, uncertainties, and assumptions. Many factors could cause actual results, performance, or achievements to differ materially from the results discussed or implied in the forward-looking statements. These factors should be considered carefully, and readers should not place undue reliance on the forward-looking statements. Although the forward-looking statements contained in this news release are based upon what management believes to be reasonable assumptions, Collective cannot assure readers that actual results will be consistent with these forward-looking statements. These forward-looking statements are made as of the date of this news release, and Collective assumes no obligation to update or revise them to reflect new events or circumstances, except as required by law.
Neither the TSXV nor its Regulation Services Provider (as that term is defined in the policies of the TSXV) accepts responsibility for the adequacy or accuracy of this news release.
The Best Video on Why and When to Buy and Sell Physical Precious Metals:
I’m a licensed broker for Miles Franklin Precious Metals Investments, The Only Online Dealer that is Licensed and Bonded Period! Where we provide unlimited options to expand your precious metals portfolio, from:
Vancouver, British Columbia–(Newsfile Corp. – February 6, 2023) – Dolly Varden Silver Corporation (TSXV: DV) (OTCQX: DOLLF) (the “Company” or “Dolly Varden“) is pleased to announce that final results from drilling during the 2022 season on the Dolly Varden area of the Kitsault Valley Project have been received, including significant results from both the southern and northern limits at the Wolf Deposit: the southwest Wolf Vein Extension as well as the East Wolf Vein offset. Results include the highest grade silver assay yet received from the Dolly Varden Property. Mineralization remains open for expansion at the deposit.
Highlights from the Wolf Vein include:
Wolf Vein Northeast: DV22-329: 1,499 g/t Ag, 1.89% Pb, 0.46% Zn over 15.94 meters (8.77 meters estimated true width), including the highest grade silver assay reported from the project to-date with coarse, native silver mineralization that returned 23,997 g/t Ag, 1.24% Pb, 0.34% Zn over 0.35 meters (0.19m estimated true width).
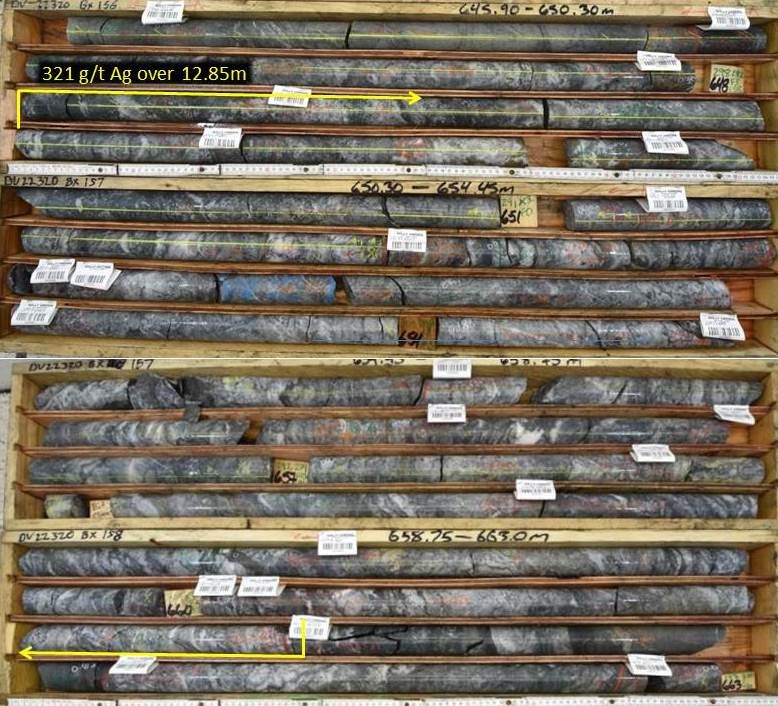
Wolf Vein Southwest: DV22-320: 321 g/t Ag, 0.84% Pb, 0.84% Zn over 12.85 meters (6.81 meters estimated true width) including 664 g/t Ag, 1.24% Pb, 3.54% Zn over 1.63 meters (0.86 meters estimated true width).
Highlights from exploration drilling at Kitsol Vein and a new discovery at the Red Point target include:
Red Point: DV22-321: 8.10 g/t Au, 244 g/t Ag and 5.16% Cu over 1.00 meter*.
Red Point: DV22-322: 17.20 g/t Au and 1.65% Cu over 1.15 meters*.
*(intervals stated in core length unless otherwise indicated)
“Results from the Wolf Vein continue to exceed expectations, returning the highest-grade silver assay yet received, more than doubling the strike length of the deposit through step outs to the north and south as well as returning wide, robust silver and base metal grades at depth. Our priority during the 2023 will be to connect the Wolf Deposit with the Kitsol Deposit, located 1,400 meters to the south. Additionally, encouraging gold, silver and copper mineralization at the new Red Point discovery is encouraging,” said Shawn Khunkhun, President and CEO of Dolly Varden Silver.
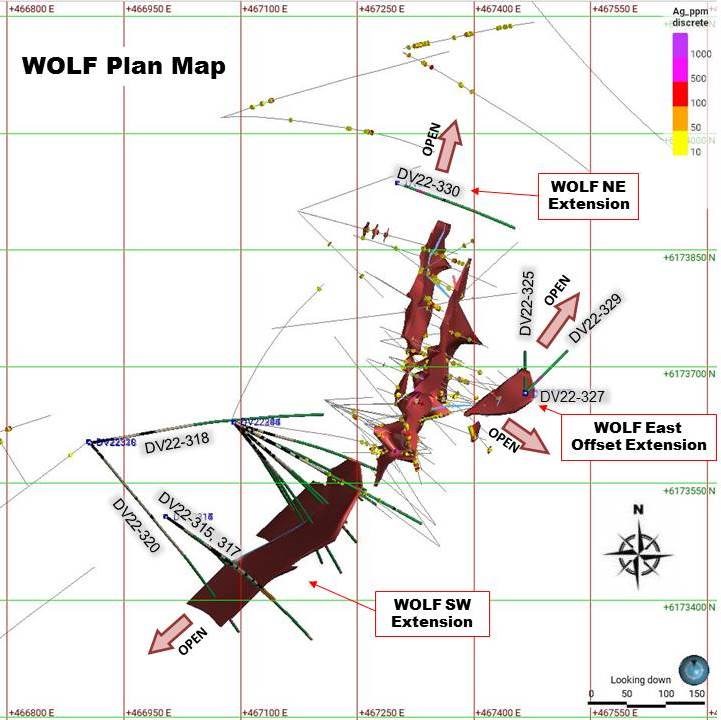
On the East Wolf offset, the 50m step out drill hole DV22-329 cut an interval of multi-phase veins and breccia, demonstrating the robust Wolf Vein system remains open along strike to the east and northeast.
Testing the southwestern known limits of the Wolf Vein, drill hole DV22-320 is the southernmost hole completed to-date and the vein intercept in that hole is over 825 meters distance down plunge on the system from the reported intercept in drill hole DV22-329. Drill hole DV22-320 is a 63m step-out down plunge from previously reported DV22-316, which intersected 550 g/t Ag over 9.80m (see news release dated November 21, 2022). DV22-320 is located over 350m to the southwest from the 2021 discovery drill hole DV21-273, demonstrating that silver-rich mineralization hosted by the Wolf vein continues to depth and remains open for expansion to the southwest under the sedimentary cover rocks (Figure 2).
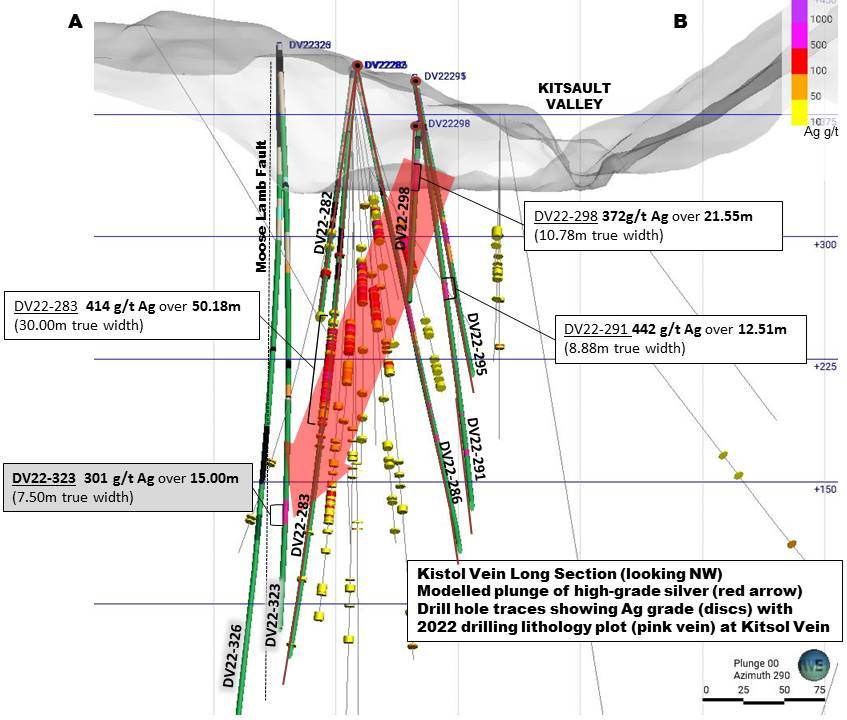
At the Kitsol Vein, step-out hole DV22-323 expanded high grade silver mineralization an additional 85 meters down-plunge from previously released results (Figure 6).
At the Red Point exploration target, high-grade gold and silver mineralization was discovered, with significant copper in strong pyrite-chalcopyrite mineralization in a new area (Figure 7). Mineralization is wide open for expansion.
Figure 1. Kitsault Valley trend and mineral deposits.
Drilling objectives during 2022 at the Dolly Varden Property was to expand the wide high grade silver mineralization at on the Wolf Vein, step out and infill at Torbrit and Kitsol as well as test several other nearby exploration targets. A total of 52 holes for 18,614 meters were completed at the Dolly Varden Project during 2022; 20 holes for 9,994 meters were completed at the Wolf Vein, 18 holes for 3,524 meters at the Torbrit Deposit, 8 holes for 2,900 meters of infill and step out drilling at Kitsol Vein and 6 holes for 2,196 meters in additional exploration. This is in addition to 18,448m in 56 holes at the Homestake Ridge Property for a total of 37,062m in 108 holes on the Kitsaut Valley project in 2022.
Wolf Vein
Mineralization at the Wolf Vein consists of multiple epithermal silica vein and brecciation events along a northeast trending, steeply northwest dipping zone (Figures 2 and 3). Silver-bearing minerals include: native silver, silver sulphosalts, tennantite, argentite and argentiferous galena (Figures 4 and 5).
The mineralized interval in DV22-320 suggests an open-ended 350m long mineralized shoot to the southwest of discovery hole DV21-273, which returned 17.50m averaging 214 g/t Ag and 0.47% Pb including 1.22m averaging 1,532 g/t Ag, 0.44 g/t Au, 2.11% Pb and 1.07% Zn (see Dolly Varden news release, December 20, 2021). Drilling to the southwest tested mineralization within volcanic rocks, below the Upper Hazelton sediment cap and are associated with strong potassic alteration. This trend continues south for 1,400 m to the Kitsol Vein (Figure 7).
Drill holes DV22-315 and 317 are on section with DV22-316 (Figure 2) but intersected the Wolf structure approximately 100 meters above and 75 meters below, respectively, the projection of the higher grade silver zone intersected in DV22-316.
High-grade silver in drill hole DV22-329 occurs within a very strong, multiphase vein and breccia vein that is offset to the main Wolf Vein by a post-mineral fault. The dip of the offset limb is approximately 55 degrees to the northwest, is open to the east and northeast, projecting just below the slope surface (Figures 2 and 3). Two other step outs from the same pad include DV22-325 and 327. Drill hole DV22-327 is approximately a 25 meter step-out returning 1,457 g/t Ag over 3.06 m (1.68m estimated true thickness). Drill hole DV22-325 intersected a post-mineral mafic dyke at the projected depth of vein mineralization (Table 1).
Figure 2. Longitudinal Section, open down plunge from DV22-320 on main Wolf Vein and open to the East from DV22-329 drilled on Wolf East offset vein.
Mineralization in drill hole DV22-323 at the Kitsol Vein demonstrates the continuity of steeply plunging, high-grade silver mineralization within the Kitsol structure. Mineralization was encountered 85 meters down-plunge from previously reported drill hole DV22-283 with 414 g/t Ag over 50.00m (see news release dated August 10, 2022). A further step out drill hole DV22-326 crossed the northwest striking Moose Lamb Fault into the hanging wall rock and did not encounter the Kistsol Vein (see Figure 6).
Figure 6. Kitsol Longitudinal Section A-B with DV22-323: an 85 meter step-out down-plunge.
Three exploration drill holes from one drill pad tested an Induced Polarity chargeability anomaly and the depth extent of gold bearing veins from the Red Point Area. The target is located approximately 500m west of the Kitsol Vein. All holes intersected strong QSP (quartz-pyrite -sericite) alteration with stockwork veining that returned anomalous gold over broad intervals (Table 2). In areas where the quartz veining intensified and brecciation occurred, gold and copper grades increased.
Highlights from the two drill holes oriented to the southwest that tested below the surface veining at the Red Point Prospect include:
DV22-321: 0.59 g/t Au over 49.00m
DV22-321: 2.94 g/t Au and 1.65% Cu over 5.00m
DV22-321: 8.10 g/tAu, 244 g/t Ag and 5.16% Cu over 1.00 m
DV22-322: 17.20g/t Au and 1.93% Cu over 1.15 m
Figure 7. Plan view location of Kitsol, Red Point and North Star Connection drill holes
The North StarConnection target, located to the west of Torbrit in the centre of the Kitsault River valley was tested with drill holes DV22-328 and 331. Vein- style mineralization was intersected along the projected trace of the North Star structure and appears to be continuous with the Torbrit deposit. No significant silver mineralization was encountered however anomalous gold values within the vein were received.
Exploration drill hole DV22-324 was drilled approximately 1,200 meters northwest of the Wolf Deposit, testing underneath the sediment cap (Figure 1). The drill pad was located in the centre of the valley, west of the Silver Horde alteration zone. Minor veining and moderate alteration was encountered with no significant assay results (see Table 2). Further targeting work is ongoing in this area.
Table 2. Kitsol and Exploration drill hole assays
Area
Hole ID
From (m)
To (m)
Length (m)
Est.True Width* (m)
Ag (g/t)
Pb (%)
Zn (%)
Au (g/t)
Kitsol
DV22-323
325.30
340.30
15.00
9.6
301
0.23
0.56
including
332.40
338.30
5.90
3.78
434
0.41
0.69
Kitsol
DV22-326
Moose
Lamb
Fault
North Star
DV22-328
266.56
273.00
6.44
5.99
4
0.02
0.04
0.22
North Star
DV22-331
267.00
270.40
3.40
2.96
4
0.05
0.20
0.17
Red Point
DV22-319
4.20
11.00
6.80
75% to 90% of length
0.20
and
18.00
22.00
4.00
0.33
and
39.00
55.50
16.50
0.17
and
124.00
142.70
18.70
0.14
and
158.00
165.00
7.00
0.19
and
175.00
184.00
9.00
0.22
Red Point
DV22-321
6.19
12.00
5.81
75% to 90% of length
0.22
and
23.00
29.00
6.00
0.44
and
103.00
105.00
2.00
3.01
and
113.00
162.00
49.00
13
0.59
including
138.00
143.00
5.00
83
2.94
including
139.00
140.00
1.00
244
8.10
and
248.00
261.00
13.00
0.73
Red Point
DV22-322
2.88
11.00
8.12
75% to 90% of length
0.18
and
45.00
76.00
31.00
0.19
and
106.60
107.75
1.15
23
0.07
0.13
17.20
Silver Horde
DV22-324
243.00
244.00
1.00
85% to 90% of length
125
0.99
0.04
and
419.50
420.00
0.50
12
1.82
0.54
Table 3. Drill hole collar locations and orientations
Zone
Hole ID
Easting UTM83 (m)
Northing UTM83 (m)
Elev. (masl)
Azimuth
Dip
Length (m)
Wolf West
DV22315
467003
6173509
390
125
-62
424.00
Wolf West
DV22317
467003
6173509
390
125
-80
684.00
Wolf HW
DV22318
466902
6173602
415
80
-65
696.00
Wolf West
DV22320
466902
6173602
415
137
-63
699.00
Wolf East
DV22325
467465
6173669
520
355
-68
141.00
Wolf East
DV22327
467465
6173669
520
355
-85
102.00
Wolf East
DV22329
467465
6173669
520
40
-50
120.00
Wolf NE
DV22330
467315
6173933
485
110
-45
231.00
Red Point
DV22319
467047
6171996
620
40
-74
357.00
Red Point
DV22321
467047
6171996
620
200
-50
342.00
Red Point
DV22322
467047
6171996
620
200
-75
339.00
Kitsol
DV22323
467482
6172114
411
106
-58
468.00
Kitsol
DV22326
467482
6172114
411
111
-64
564.00
North Star
DV22328
467713
6171589
394
125
-55
354.00
North Star
DV22331
467713
6171589
394
125
-55
351.00
Silver Horde
DV22324
466644
6174379
392
60
-50
453.00
Quality Assurance and Quality Control
The Company adheres to CIM Best Practices Guidelines for exploration related activities conducted on its property. Quality Assurance and Quality Control (QA/QC) procedures are overseen by the Qualified Person.
Dolly Varden QA/QC protocols are maintained through the insertion of certified reference material (standards), blanks and field duplicates within the sample stream. Drill core is cut in-half with a diamond saw, with one-half placed in sealed bags and shipped to the laboratory and the other half retained on site. Third party laboratory checks on 5% of the samples are carried out as well. Chain of custody is maintained from the drill to the submittal into the laboratory preparation facility.
Analytical testing was performed by ALS Canada Ltd. in North Vancouver, British Columbia. The entire sample is crushed and a 500 gram split is pulverized to minus 200mesh. Multi-element analyses were determined by Inductively-Coupled Plasma Mass Spectrometry (ICP-MS) for 48 elements following a 4-acid digestion process. High grade silver testing was determined by Fire Assay with either an atomic absorption, or a gravimetric finish, depending on grade range. Au is determined by Fire Assay on a 30g split.
Qualified Person
Rob van Egmond, P.Geo. Vice-President Exploration for Dolly Varden Silver, the “Qualified Person” as defined by NI 43-101 has reviewed, validated and approved the scientific and technical information contained in this news release and supervises the ongoing exploration program at the Dolly Varden Project.
About Dolly Varden Silver Corporation
Dolly Varden Silver Corporation is a mineral exploration company focused on advancing its 100% held Kitsault Valley Project (which combines the Dolly Varden Project and the Homestake Ridge Project) located in the Golden Triangle of British Columbia, Canada, 25kms by road to tide water. The 163 sq. km. project hosts the high-grade silver and gold resources of Dolly Varden and Homestake Ridge along with the past producing Dolly Varden and Torbrit silver mines. It is considered to be prospective for hosting further precious metal deposits, being on the same structural and stratigraphic belts that host numerous other, on-trend, high-grade deposits, such as Eskay Creek and Brucejack. The Kitsault Valley Project also contains the Big Bulk property which is prospective for porphyry and skarn style copper and gold mineralization, similar to other such deposits in the region (Red Mountain, KSM, Red Chris).
Forward Looking Statements
This release may contain forward-looking statements or forward-looking information under applicable Canadian securities legislation that may not be based on historical fact, including, without limitation, statements containing the words “believe”, “may”, “plan”, “will”, “estimate”, “continue”, “anticipate”, “intend”, “expect”, “potential”, and similar expressions. Forward-looking statements involve known and unknown risks, uncertainties, and other factors which may cause the actual results, performance, or achievements of Dolly Varden to be materially different from any future results, performance, or achievements expressed or implied by the forward-looking statements. Forward looking statements or information in this release relates to, among other things, the results of previous field work and programs and the continued operations of the current exploration program, interpretation of the nature of the mineralization at the project and that that the mineralization on the project is similar to Eskay and Brucejack, results of the mineral resource estimate on the project, the potential to grow the project, the potential to expand the mineralization and our beliefs about the unexplored portion of the property.
These forward-looking statements are based on management’s current expectations and beliefs and assume, among other things, the ability of the Company to successfully pursue its current development plans, that future sources of funding will be available to the company, that relevant commodity prices will remain at levels that are economically viable for the Company and that the Company will receive relevant permits in a timely manner in order to enable its operations, but given the uncertainties, assumptions and risks, readers are cautioned not to place undue reliance on such forward-looking statements or information. The Company disclaims any obligation to update, or to publicly announce, any such statements, events or developments except as required by law.
For additional information on risks and uncertainties, see the Company’s most recently filed annual management discussion & analysis (“MD&A“) and management information circular dated January 21, 2022 (the “Circular“), both of which are available on SEDAR at www.sedar.com. The risk factors identified in the MD&A and the Circular are not intended to represent a complete list of factors that could affect the Company.
Neither the TSX Venture Exchange nor its Regulation Services Provider (as that term is defined in the policies of the TSX-V) accepts responsibility for the adequacy or accuracy of this news release.
Widths of Mineralized System Expanded Significantly
Vancouver, British Columbia–(Newsfile Corp. – February 2, 2023) – Goldshore Resources Inc. (TSXV: GSHR) (OTCQB: GSHRF) (FSE: 8X00) (“Goldshore” or the “Company“), is pleased to announce assay results from its ongoing 100,000-meter drill program at the Moss Lake Project in Northwest Ontario, Canada (the “Moss Lake Gold Project“).
Highlights:
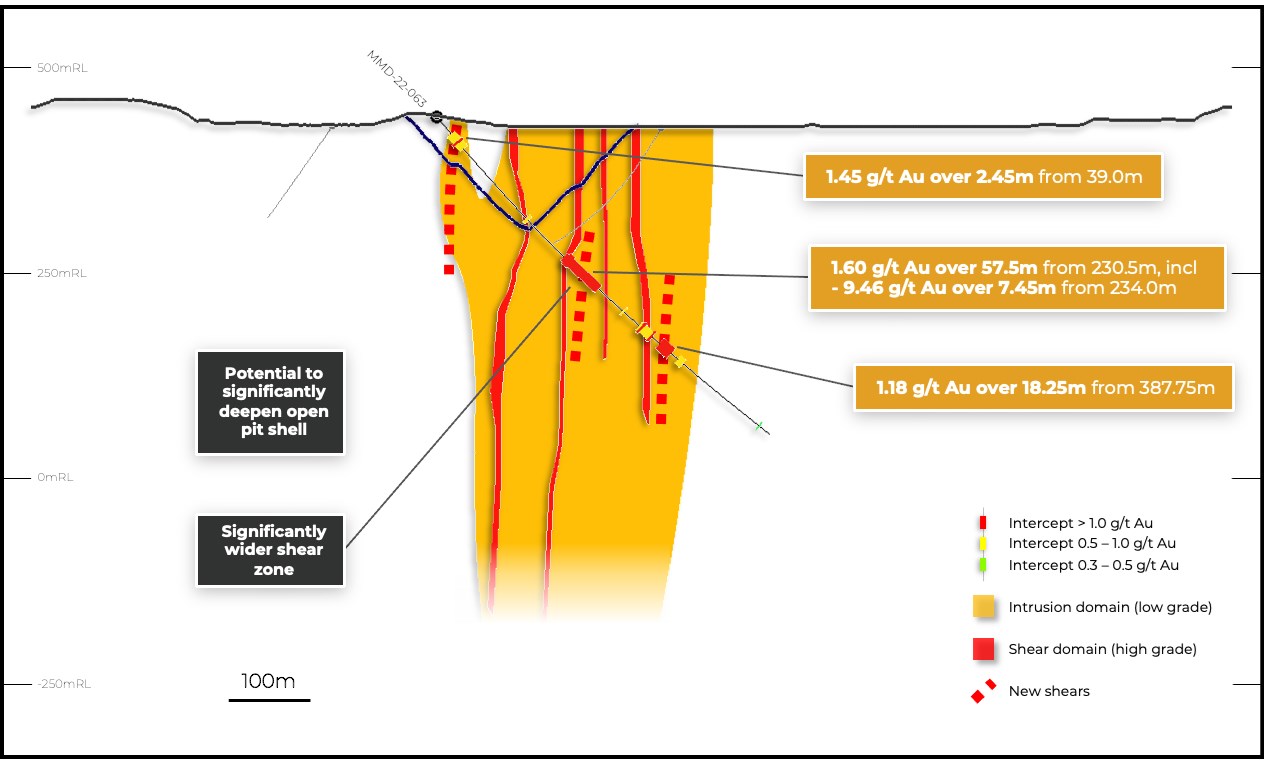
Hole MMD-22-063 has confirmed the presence of high-grade mineralization within the previously perceived low grade and low tonnage Southwest Zone and shown the zone to be almost 300 meters wide. Best intercepts include:
1.60 g/t Au over 57.5m from 230.5m depth in MMD-22-063 including:
9.46 g/t Au over 7.45m from 234.0m
1.18 g/t Au over 18.25m from 387.75m
Results for thirteen holes drilled to explore the northern and southern flanks of the mineralized shear zone system in the Main Zone have expanded the cumulative width of multiple, close-spaced, high-grade gold shears by 150-200 meters to over 550 meters at the Main Zone with best intercepts of:
0.93 g/t Au over 126.0m from 467.0m depth in MMD-22-059 including:
1.64 g/t over 48.0m from 513.0m
3.67 g/t Au over 13.65m from 612.35m
1.05 g/t Au over 34.0m from 257.0m depth in MMD-22-088 including:
1.51 g/t Au over 15.0m from 276.0m
1.84 g/t Au over 14.95m from 483.05m
President and CEO, Brett Richards, stated: “These results once again support our thesis that the size and scale of the Moss Lake Gold Project will be large enough to support a material and meaningful update to the mineral resource estimate (“MRE”) in April 2023, followed by a preliminary economic assessment (“PEA”) on the updated resource. We continue to find additions to the resource on step out holes laterally and along strike from the historic resource profile, and we look to continue to explore the impact of these additions to the resource model, as well as guiding us in future drill targets.”
Technical Overview
Figure 1 shows the better intercepts in plain view and Figure 2 is a typical section through hole MMD-22-063. Table 1 shows the significant intercepts. Table 2 shows the drill hole locations.
Figure 1: Drill plan showing best of several +1 g/t Au intercepts relative to the current Mineral Resource and highlighting the additional shears.
Figure 2: Drill section through MMD-22-063 relative to the current Mineral Resource and highlighting the additional shears and potential to significantly deepen the open pit shell.
Results have been received for MMD-22-063, which was the final hole from the first pass drill pattern at the Southwest Zone. The hole infills two previous holes and has shown that there is continuity to the high-grade core of the zone. In addition to the high-grade lenses highlighted above, the hole also intersected multiple lenses of lower grade mineralization throughout the hole including 0.58 g/t Au over 23.2m from 27.9m, 0.81 g/t Au over 20.6m from 355m, and 0.55 g/t Au over 7.95m from 417.05m. These confirm the increased tonnage potential in the Southwest Zone with mineralization above the low-grade cutoff of 0.40 g/t Au used for the current mineral resource estimate over a zone that is almost 300 meters wide.
A second pass drill pattern over the Southwest zone was completed in January, infilling the newly discovered high-grade shears and exploring for additional shears.
Results have also been received for thirteen holes that have explored the edges of the Main Zone on its northern and southern flanks. Six holes targeted the northern side of the shear system, and seven holes targeted the southern side. These holes intersected high-grade shears over a zone that is 200 meters wider than previously understood, making the main zone over 550 meters wide at its widest point.
As with the center of the Main Zone, these shears lie within broad zones of low-grade mineralization within the altered diorite intrusion host. Examples include 0.84 g/t Au over 37m from 608m in MQD-22-058; 0.33 g/t Au over 35.65m from 231.35m, 0.42 g/t Au over 34m from 273m and 0.86 g/t Au over 126m from 467m in MMD-22-059; 0.58 g/t Au over 75m from 543.5m in MMD-22-060; 0.91 g/t Au over 33m from 257m in MMD-22-088; 0.58 g/t Au over 75m from 422m in MMD-22-089; 0.39 g/t Au over 40.5m from 453.8m in MQD-22-091; and 0.72 g/t Au over 15m from 207 in MMD-22-095.
The shears in the north and south were sparsely drilled by historical drill holes and represent opportunity to potentially expand the mineral resource and to properly understand the mineralizing system.
A detailed review of current and previous high-grade intercepts has identified various gold, silver, and bismuth bearing tellurides across all three zones of the Moss Lake Gold Project deposit. The tellurides have been located within pyrite±-chalcopyrite bearing quartz-chlorite-carbonate veins and sulphide-rich hydrothermal breccias previously identified in the vein paragenesis to be emplaced near the end of deformational history. Identifying and outlining the late structural events will allow for enhanced targeting of the high-grade portions of Moss Lake Gold Project and will assist in refining generative targets by focusing on preferred horizons for these structures to occur.
Figure 3: Tellurides identified at 234.1m of MQD-21-009 within a py+cpy bearing undulating qt+ch±cb shear vein. The sample yielded 39.7g/t Au, 73.7g/t Ag, 63.5g/t Te over 0.9m.
Pete Flindell, VP Exploration for Goldshore, said, “The high-grade drill results in the Southwest Zone provide confidence that this area has significant resource potential. The results along the northern and southern flanks of the Main Zone also represent a significant expansion to the width of the mineralized zone, which should assist our goal of potentially expanding the mineral resource and improving its quality in early Q2.”
Table 1: Significant downhole gold intercepts
HOLE ID
FROM
TO
LENGTH (m)
TRUE WIDTH (m)
CUT GRADE (g/t Au)
UNCUT GRADE (g/t Au)
MMD-22-058
314.00
321.00
7.00
4.1
0.41
0.41
374.90
392.30
17.40
10.3
0.36
0.36
466.00
468.30
2.30
1.4
0.38
0.38
491.70
505.00
13.30
8.1
0.39
0.39
517.00
519.00
2.00
1.2
0.35
0.35
553.45
574.45
21.00
13.3
0.37
0.37
593.00
595.00
2.00
1.3
0.37
0.37
608.00
645.00
37.00
23.9
0.87
0.87
including
614.00
621.00
7.00
4.5
1.40
1.40
and
628.00
636.00
8.00
5.2
1.04
1.04
and
641.00
645.00
4.00
2.6
1.54
1.54
MMD-22-059
231.35
307.00
75.65
51.8
0.36
0.36
including
236.00
239.20
3.20
2.2
1.01
1.01
and
280.00
284.00
4.00
2.7
1.45
1.45
342.00
348.00
6.00
4.2
0.36
0.36
361.00
392.00
31.00
22.0
0.36
0.36
467.00
593.00
126.00
92.3
0.93
0.93
including
475.60
484.70
9.10
6.6
1.50
1.50
and
504.65
509.30
4.65
3.4
1.08
1.08
and
513.00
561.00
48.00
35.3
1.64
1.64
612.35
626.00
13.65
10.2
2.56
3.67
MMD-22-060
95.20
102.00
6.80
3.5
0.40
0.40
336.95
346.00
9.05
5.1
0.31
0.31
361.10
379.00
17.90
10.2
0.70
0.70
including
364.00
368.10
4.10
2.3
2.14
2.14
475.80
481.10
5.30
3.1
0.39
0.39
543.50
569.00
25.50
16.1
0.79
0.79
584.00
592.15
8.15
5.2
0.46
0.46
MMD-22-061
113.55
121.00
7.45
3.9
0.30
0.30
125.25
130.00
4.75
2.5
0.31
0.31
213.00
216.40
3.40
1.9
0.38
0.38
234.95
237.00
2.05
1.1
0.46
0.46
331.65
343.30
11.65
6.7
0.58
0.58
449.00
455.10
6.10
3.6
0.39
0.39
460.00
462.00
2.00
1.2
0.64
0.64
570.00
593.00
23.00
14.5
0.31
0.31
MMD-22-063
27.90
51.10
23.20
15.0
0.58
0.58
including
39.00
41.95
2.95
1.9
1.45
1.45
165.00
169.00
4.00
2.7
0.53
0.53
230.50
288.00
57.50
42.0
1.60
1.60
including
234.00
241.45
7.45
5.4
9.46
9.46
328.00
330.00
2.00
1.5
0.89
0.89
355.00
375.60
20.60
15.5
0.81
0.81
including
357.00
360.00
3.00
2.2
3.57
3.57
and
373.00
375.60
2.60
2.0
1.28
1.28
387.75
406.00
18.25
13.8
1.18
1.18
417.05
425.00
7.95
6.0
0.55
0.55
544.00
546.00
2.00
1.6
0.31
0.31
MMD-22-068
17.15
23.00
5.85
2.9
0.34
0.34
307.00
327.00
20.00
11.8
0.42
0.42
337.10
341.40
4.30
2.5
0.45
0.45
347.95
350.55
2.60
1.5
0.44
0.44
361.00
376.00
15.00
9.0
0.61
0.61
including
370.00
373.00
3.00
1.8
1.78
1.78
570.40
581.30
10.90
7.1
0.32
0.32
625.55
672.00
46.45
31.3
0.35
0.35
MMD-22-069
57.00
63.00
6.00
3.3
0.77
0.77
266.50
276.00
9.50
6.5
0.52
0.52
525.00
530.00
5.00
3.5
0.35
0.35
540.15
545.00
4.85
3.4
0.45
0.45
567.00
569.95
2.95
2.1
0.61
0.61
581.90
588.20
6.30
4.5
0.32
0.32
MMD-22-071
629.85
633.80
3.95
3.0
0.45
0.45
MMD-22-084
194.00
213.15
19.15
14.9
0.53
0.53
including
198.00
203.00
5.00
3.9
1.32
1.32
229.00
231.00
2.00
1.6
0.47
0.47
255.00
258.50
3.50
2.8
1.74
1.74
292.55
294.55
2.00
1.6
0.43
0.43
399.00
403.65
4.65
3.8
0.96
0.96
MMD-22-088
55.25
58.05
2.80
2.0
0.31
0.31
111.00
115.55
4.55
3.3
0.31
0.31
149.00
166.00
17.00
12.8
0.45
0.45
179.00
186.00
7.00
5.3
0.41
0.41
209.70
222.00
12.30
9.4
0.46
0.46
257.00
291.00
34.00
26.3
1.05
1.05
including
276.00
291.00
15.00
11.6
1.51
1.51
432.00
434.00
2.00
1.6
0.46
0.46
444.95
468.10
23.15
18.5
0.32
0.32
483.05
498.00
14.95
12.0
1.84
1.84
including
483.05
496.00
12.95
10.4
2.04
2.04
MMD-22-089
302.10
309.00
6.90
5.1
0.63
0.63
including
307.00
309.00
2.00
1.5
1.30
1.30
321.00
334.80
13.80
10.3
0.34
0.34
390.00
392.00
2.00
1.5
0.41
0.41
422.00
497.00
75.00
58.4
0.59
0.59
including
431.00
433.00
2.00
1.5
3.66
3.66
and
444.00
456.00
12.00
9.3
1.05
1.05
and
478.00
488.00
10.00
7.8
1.19
1.19
MMD-22-091
153.70
162.55
8.85
6.1
0.53
0.53
201.00
206.95
5.95
4.2
0.42
0.42
363.55
378.00
14.45
10.7
0.32
0.32
397.00
401.55
4.55
3.4
0.45
0.45
453.80
494.30
40.50
30.8
0.41
0.41
MMD-22-093
473.25
481.00
7.75
6.0
0.61
0.61
496.00
512.80
16.80
13.2
0.44
0.44
including
509.25
512.80
3.55
2.8
1.05
1.05
523.00
525.25
2.25
1.8
3.04
3.04
551.00
555.20
4.20
3.3
0.32
0.32
587.20
606.20
19.00
15.1
0.33
0.33
617.40
620.55
3.15
2.5
0.33
0.33
628.00
630.80
2.80
2.2
0.56
0.56
MMD-22-095
161.20
167.45
6.25
4.4
1.10
1.10
including
163.00
165.00
2.00
1.4
2.41
2.41
186.30
190.00
3.70
2.6
0.33
0.33
207.00
222.00
15.00
10.7
0.72
0.72
including
211.65
215.05
3.40
2.4
1.56
1.56
267.00
276.00
9.00
6.5
0.46
0.46
including
274.00
276.00
2.00
1.4
1.61
1.61
373.60
376.15
2.55
1.9
0.44
0.44
412.50
418.00
5.50
4.1
0.71
0.71
Intersections calculated above at 0.3 g/t Au cut off with a top cut of 30 g/t Au and a maximum internal waste interval of 10 metres. Bordered intervals are intersections calculated above a 1.0 g/t Au cut off. Intervals in bold are those with a grade thickness factor exceeding 20 gram x metres / tonne gold. True widths are approximate and assume a subvertical body.
Table 2: Location of drill holes in this press release
HOLE
EAST
NORTH
RL
AZIMUTH
DIP
EOH
MMD-22-058
668,743
5,379,407
454
153°
-60°
645.00
MMD-22-059
668,819
5,379,436
439
154°
-50°
648.00
MMD-22-060
668,909
5,379,474
436
155°
-60°
600.05
MMD-22-061
669,091
5,379,558
448
155°
-60°
600.00
MMD-22-063
668,481
5,378,460
439
148°
-50°
563.00
MMD-22-068
669,177
5,379,614
455
154°
-60°
699.10
MMD-22-069
669,254
5,379,629
445
151°
-59°
600.00
MMD-22-071
669,077
5,378,242
432
335°
-51°
648.00
MMD-22-084
668,973
5,378,574
428
337°
-45°
414.15
MMD-22-088
669,031
5,378,642
431
336°
45°
498.00
MMD-22-089
668,972
5,378,560
428
314°
-51°
497.90
MMD-22-091
669,172
5,378,762
431
332°
-49°
494.30
MMD-22-093
669,018
5,378,463
430
289°
-50°
651.00
MMD-22-095
669,090
5,378,690
428
345°
-45°
420.00
Approximate collar coordinates in NAD 83, Zone 15N
Analytical and QA/QC Procedures
All samples were sent to ALS Geochemistry in Thunder Bay for preparation and analysis was performed in the ALS Vancouver analytical facility. ALS is accredited by the Standards Council of Canada (SCC) for the Accreditation of Mineral Analysis Testing Laboratories and CAN-P-4E ISO/IEC 17025. Samples were analyzed for gold via fire assay with an AA finish (“Au-AA23”) and 48 pathfinder elements via ICP-MS after four-acid digestion (“ME-MS61”). Samples that assayed over 10 ppm Au were re-run via fire assay with a gravimetric finish (“Au-GRA21”).
In addition to ALS quality assurance / quality control (“QA/QC”) protocols, Goldshore has implemented a quality control program for all samples collected through the drilling program. The quality control program was designed by a qualified and independent third party, with a focus on the quality of analytical results for gold. Analytical results are received, imported to our secure on-line database and evaluated to meet our established guidelines to ensure that all sample batches pass industry best practice for analytical quality control. Certified reference materials are considered acceptable if values returned are within three standard deviations of the certified value reported by the manufacture of the material. In addition to the certified reference material, certified blank material is included in the sample stream to monitor contamination during sample preparation. Blank material results are assessed based on the returned gold result being less than ten times the quoted lower detection limit of the analytical method. The results of the on-going analytical quality control program are evaluated and reported to Goldshore by Orix Geoscience Inc.
About Goldshore
Goldshore is an emerging junior gold development company, and owns 100% of the Moss Lake Gold Project located in Ontario. Wesdome is currently a large shareholder of Goldshore with an approximate 22% equity position in the Company. Well-financed and supported by an industry-leading management group, board of directors and advisory board, Goldshore is positioned to advance the Moss Lake Gold Project through the next stages of exploration and development.
Peter Flindell, P.Geo., MAusIMM, MAIG, Vice President – Exploration of the Company, a qualified person under NI 43-101 has approved the scientific and technical information contained in this news release.
Neither the TSXV nor its Regulation Services Provider (as that term is defined in the policies of the TSXV) accepts responsibility for the adequacy or accuracy of this release.
For More Information – Please Contact:
Brett A. Richards President, Chief Executive Officer and Director Goldshore Resources Inc.
This news release contains statements that constitute “forward-looking statements.” Such forward looking statements involve known and unknown risks, uncertainties and other factors that may cause the Company’s actual results, performance or achievements, or developments to differ materially from the anticipated results, performance or achievements expressed or implied by such forward-looking statements. Forward looking statements are statements that are not historical facts and are generally, but not always, identified by the words “expects,” “plans,” “anticipates,” “believes,” “intends,” “estimates,” “projects,” “potential” and similar expressions, or that events or conditions “will,” “would,” “may,” “could” or “should” occur. Forward-looking statements in this news release include, among others, statements relating to: expectations regarding the exploration and development of the Moss Lake Gold Project; an updated mineral resource estimate and the timing thereof; completion of a PEA and the timing thereof, and other statements that are not historical facts.
By their nature, forward-looking statements involve known and unknown risks, uncertainties and other factors which may cause our actual results, performance or achievements, or other future events, to be materially different from any future results, performance or achievements expressed or implied by such forward-looking statements. Such factors and risks include, among others: the Company may require additional financing from time to time in order to continue its operations which may not be available when needed or on acceptable terms and conditions acceptable; compliance with extensive government regulation; domestic and foreign laws and regulations could adversely affect the Company’s business and results of operations; the stock markets have experienced volatility that often has been unrelated to the performance of companies and these fluctuations may adversely affect the price of the Company’s securities, regardless of its operating performance; and the impact of COVID-19.
The forward-looking information contained in this news release represents the expectations of the Company as of the date of this news release and, accordingly, is subject to change after such date. Readers should not place undue importance on forward-looking information and should not rely upon this information as of any other date. The Company undertakes no obligation to update these forward-looking statements in the event that management’s beliefs, estimates or opinions, or other factors, should change.
This news release does not constitute an offer to sell, or a solicitation of an offer to buy, any securities in the United States. The securities have not been and will not be registered under the United States Securities Act of 1933, as amended (the “U.S. Securities Act”) or any state securities laws and may not be offered or sold within the United States or to U.S. Persons unless registered under the U.S. Securities Act and applicable state securities laws or an exemption from such registration is available.
Burlington, Ontario–(Newsfile Corp. – January 31, 2023) – Silver Bullet Mines Corp. (TSXV: SBMI) (OTCQB: SBMCF) (‘SBMI’ or ‘the Company’) is pleased to update the assay results from its Black Copper occurrence, reported earlier on January 31, 2023.
In SBMI’s January 17, 2023 press release, SBMI advised third part geologic consultants including the QP had visited the Black Copper occurrence in late November and early December, 2022. Black Copper is situated on SBMI’s Black Diamond property roughly one point five kilometres south of the Buckeye Mine and is referred to in the January, 2021 Geologic Report. Samples from Black Copper were taken and reported the following results:
Sample number
Au (ppb)
Cu ppm
342151
615
>1000
342152
192
>1000
342153
941
>1000
342154
654
>1000
The over-detection limit for copper on these samples was 1000 parts per million. These four samples were sent for further analysis which returned:
Sample number
Cu ppm
Cu %
342151
22400
2.24
342152
37400
3.740
342153
34000
3.400
342154
54900
5.490
The press release from earlier today incorrectly stated the values in parts per million as a result of manual data entry into the press release. A copy of the Actlabs certificates for these samples is attached.
QAQC For SBMI
All the samples above were collected by Robert Komarechka and John Corkery. Samples were collected and placed in sample bags with their appropriate tag and personally taken to the courier and shipped to Actlabs in Thunder Bay, Ontario for assaying. Certified standards and blanks were used both by the Company and Actlabs.
All samples analyzed by Actlabs were by Fire Assay ICPOES (Induced coupled plasma arc with optical emission spectroscopy).
The multi-element analysis was by digestion with a combination of hydrochloric, nitric, perchloric and hydrofluoric acids.
Mr. Robert G. Komarechka, P.Geo., an independent consultant, has reviewed and verified SBMI’s work referred to herein, and is the Qualified Person for this release.
With respect to the Company’s press release concerning seeking an extension of the Warrants (as that term is defined in that release), SBMI advises it is seeking an extension on a total of 8,528,081 Warrants with new expiry dates ranging from February 6, 2024 to July 8, 2024.
For further information, please contact:
John Carter Silver Bullet Mines Corp., CEO cartera@sympatico.ca +1 (905) 302-3843
Peter M. Clausi Silver Bullet Mines Corp., VP Capital Markets pclausi@brantcapital.ca +1 (416) 890-1232
Cautionary and Forward-Looking Statements
This news release contains certain statements that constitute forward-looking statements as they relate to SBMI and its subsidiaries. Forward-looking statements are not historical facts but represent management’s current expectation of future events, and can be identified by words such as “believe”, “expects”, “will”, “intends”, “plans”, “projects”, “anticipates”, “estimates”, “continues” and similar expressions. Although management believes that the expectations represented in such forward-looking statements are reasonable, there can be no assurance that they will prove to be correct.
By their nature, forward-looking statements include assumptions, and are subject to inherent risks and uncertainties that could cause actual future results, conditions, actions or events to differ materially from those in the forward-looking statements. If and when forward-looking statements are set out in this new release, SBMI will also set out the material risk factors or assumptions used to develop the forward-looking statements. Except as expressly required by applicable securities laws, SBMI assumes no obligation to update or revise any forward-looking statements. The future outcomes that relate to forward-looking statements may be influenced by many factors, including but not limited to: the impact of SARS CoV-2 or any other global virus; reliance on key personnel; the thoroughness of its QA/QA procedures; the continuity of the global supply chain for materials for SBMI to use in the production and processing of ore; shareholder and regulatory approvals; activities and attitudes of communities local to the location of the SBMI’s properties; risks of future legal proceedings; income tax matters; fires, floods and other natural phenomena; the rate of inflation; availability and terms of financing; distribution of securities; commodities pricing; currency movements, especially as between the USD and CDN; effect of market interest rates on price of securities; and, potential dilution. SARS CoV-2 and other potential global pathogens create risks that at this time are immeasurable and impossible to define.
Burlington, Ontario–(Newsfile Corp. – January 31, 2023) – Silver Bullet Mines Corp. (TSXV: SBMI) (OTCQB: SBMCF) (‘SBMI’ or ‘the Company’) is pleased to report results from its Buckeye Mine development, ongoing PGM (platinum group metals) study, assay results from its Black Copper occurrence and the discovery of a new gold occurrence on its Black Diamond Property.
Development drift intersecting a wall of sulphides at the Buckeye Mine, Jan. 28, 2023
As of this date, the development drift at the Buckeye Mine has advanced about 116 metres from the adit alongside the main vein with ongoing bolting and screening.
In its January 17, 2023 press release, the Company advised it “…next intends to drift along the vein to an area believed to contain higher grade mineralization (see page 8 of the Geologic Report dated January 8, 2021).” However, the Company believes it may have intercepted that area of higher grade mineralization sooner than expected.
Approximately 1 metre before turning into the anticipated intersection with the main vertical vein, a 0.6 metre thick horizontal fracture zone was encountered that contained bands of massive sulphides. Horizontal sulphide bands were also noted by the QP for this press release in the Treasure Room along with paper thin layers of high purity native silver, similar to the bands in the newly discovered fracture zone. While the Company expected to locate the area of higher grade mineralization, the placement of this 0.6 metre wide area of sulphide mineralization was a positive surprise to the Company.
A blast in the drift on January 27, 2023 exposed another wall of sulphides at the end of the drift. These sulphides were also encountered sooner than the Company expected. Samples of the sulphide material are being prepared to be sent for assaying and further petrographic examination.
Regarding the earlier reported PGM assays and as previously reported, check assay samples have been sent to three independent certified labs. SBMI is awaiting complete reporting of the assays from the three labs. In addition to these check assays, the Company has contracted Dr. Andy McDonald, Mineralogist, of the Harquail School of Earth Sciences, at Laurentian University in Sudbury, Ontario, Canada, to undertake sample preparation, petrographic and scanning electron microscope examination of two samples derived from the Buckeye Mine.
The first sample being analyzed by Dr. McDonald was taken by the QP in November, 2022. It was diabase from the floor of the Treasure Room of the Buckeye Mine containing a silvery ductile mineral, subsequently confirmed by Dr. McDonald to be high purity native silver. When this sample was examined with an uncalibrated handheld X-ray fluorescent unit, the presence of palladium at 29 and 21 parts per million was noted. The second sample provided to Dr. McDonald was a malformed dore bar poured by SBMI in September, 2022 derived from the Buckeye Mine, containing highly refractory “unknown material.”
Native silver in diabase rock sample collected from the floor of the Treasure Room, Buckeye Mine
Also in SBMI’s January 17, 2023 press release, SBMI advised third part geologic consultants including the QP had visited the Black Copper occurrence in late November and early December, 2022. Black Copper is situated on SBMI’s Black Diamond property roughly one point five kilometres south of the Buckeye Mine and is referred to in the January, 2021 Geologic Report. Samples from Black Copper were taken and reported the following results:
Sample number
Au (ppb)
Cu ppm
342151
615
>1000
342152
192
>1000
342153
941
>1000
342154
654
>1000
The over-detection limit for copper on these samples was 1000 parts per million. These four samples were sent for further analysis which returned:
Sample number
Cu ppm
Cu %
342151
2240
2.24
342152
3740
3.740
342153
3400
3.400
342154
5490
5.490
In addition, during this geological study, an area of broken rusty quartz float was observed by the QP near the trail to the Richmond Basin to the west of the McMorris and Buckeye Mines. This is the Company’s first testing of this area. These quartz fragments appeared to be segments of narrow quartz veins containing sulphides. Due to a soil cover of a few inches to a foot in this area, limited time prevented exposure of the underlying bedrock. Four samples were collected from surface and yielded the following gold assays:
Sample number
Au (ppb)
Bi (ppm)
342109
17
2
342110
4450
412
342111
64
1600
342112
7
16
A bismuth assay of 1600 ppm and a silver assay over 100 ppm was recorded in sample 342111. The QP of this press release highly recommends further evaluation of this new gold occurrence.
Sample 342110 assayed 4.45 g/t Au. from the new gold occurrence.
All the samples above were collected by Robert Komarechka and John Corkery. Samples were collected and placed in sample bags with their appropriate tag and personally taken to the courier and shipped to Actlabs in Thunder Bay, Ontario for assaying. Certified standards and blanks were used both by the Company and Actlabs.
All samples analyzed by Actlabs were by Fire Assay ICPOES (Induced coupled plasma arc with optical emission spectroscopy).
The multi-element analysis was by digestion with a combination of hydrochloric, nitric, perchloric and hydrofluoric acids.
Mr. Robert G. Komarechka, P.Geo., an independent consultant, has reviewed and verified SBMI’s work referred to herein, and is the Qualified Person for this release.
With respect to the Company’s press release concerning seeking an extension of the Warrants (as that term is defined in that release), SBMI advises it is seeking an extension on a total of 8,528,081 Warrants with new expiry dates ranging from February 6, 2024 to July 8, 2024.
For further information, please contact:
John Carter Silver Bullet Mines Corp., CEO cartera@sympatico.ca +1 (905) 302-3843
Peter M. Clausi Silver Bullet Mines Corp., VP Capital Markets pclausi@brantcapital.ca +1 (416) 890-1232
Cautionary and Forward-Looking Statements
This news release contains certain statements that constitute forward-looking statements as they relate to SBMI and its subsidiaries. Forward-looking statements are not historical facts but represent management’s current expectation of future events, and can be identified by words such as “believe”, “expects”, “will”, “intends”, “plans”, “projects”, “anticipates”, “estimates”, “continues” and similar expressions. Although management believes that the expectations represented in such forward-looking statements are reasonable, there can be no assurance that they will prove to be correct.
By their nature, forward-looking statements include assumptions, and are subject to inherent risks and uncertainties that could cause actual future results, conditions, actions or events to differ materially from those in the forward-looking statements. If and when forward-looking statements are set out in this new release, SBMI will also set out the material risk factors or assumptions used to develop the forward-looking statements. Except as expressly required by applicable securities laws, SBMI assumes no obligation to update or revise any forward-looking statements. The future outcomes that relate to forward-looking statements may be influenced by many factors, including but not limited to: the impact of SARS CoV-2 or any other global virus; reliance on key personnel; the thoroughness of its QA/QA procedures; the continuity of the global supply chain for materials for SBMI to use in the production and processing of ore; shareholder and regulatory approvals; activities and attitudes of communities local to the location of the SBMI’s properties; risks of future legal proceedings; income tax matters; fires, floods and other natural phenomena; the rate of inflation; availability and terms of financing; distribution of securities; commodities pricing; currency movements, especially as between the USD and CDN; effect of market interest rates on price of securities; and, potential dilution. SARS CoV-2 and other potential global pathogens create risks that at this time are immeasurable and impossible to define.
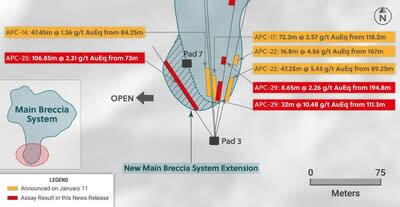
Drill hole APC-29 intercepted the highest grade near-surface copper-silver-gold mineralization encountered to date at the Main Breccia system at the Apollo target (“Apollo”) yielding 32 metres @ 10.48 g/t gold equivalent from 80 metres vertical. This hole was designed to test directly below where the Main Breccia system daylights at surface in the southern part of the system and to follow up on recently announced results for hole APC-22, which intersected 47.25 metres @ 5.45 g/t gold equivalent (see press release dated January 11, 2023). Further down-hole in APC-29, a broad zone of mineralization was encountered averaging 214.4 metres @ 1.04 g/t gold equivalent. APC-29 had to be abandoned short of target depth due to a fault while still in mineralization with the final 0.5 metre sample assaying 1.72 g/t gold, 39 g/t silver and 0.1% copper.
Drill hole APC-25 was designed as a step out hole along strike of the near surface high-grade zone of mineralization and intersected 106.85 metres @ 2.31 g/t gold equivalent starting at 65 metres vertical below surface. As a result, APC-25 has confirmed a shallow, westward expansion to the Main Breccia system and an apparent thickening to the high-grade near surface mineralized zone as the system is traced to the west.
Hole APC-26 was drilled to the northeast from Pad 4 and confirmed continuity of mineralization in that direction returning 136.9 metres @ 1.51 g/t gold equivalent contained within 311.2 metres at 1.04 g/t gold.
The phase II drilling program is underway with three rigs currently operating focused on testing near surface mineralization and expanding the dimensions of the Main Breccia system. Assay results are expected in the near term for the final three holes of the 2022 program, including westwards step-out hole APC-28, which cut more than 600 metres of continuous mineralization. Additionally, the first hole of the Phase II program is now complete, and core has been dispatched to the lab for assaying.
Ari Sussman, Executive Chairman commented: “Not only is the Main Breccia system at Apollo a large, bulk tonnage deposit but it now appears to host an outcropping and shallow zone of high-grade mineralization, which clearly enhances the value of this exciting discovery. Based on surface sampling, the system appears to daylight over an area measuring approximately 150 metres in diameter and remains open for expansion. The Main Breccia system is truly evolving into a brand-new world-class discovery right in the heart of a prolific mining camp with continuous precious metal production dating back more than 500 years.”
TORONTO, Jan. 31, 2023 /CNW/ – Collective Mining Ltd. (TSXV: CNL) (OTCQX: CNLMF) (“Collective” or the “Company”) is pleased to announce assay results from a further three holes drilled into the Main Breccia discovery at the Apollo target (“Apollo”), which is part of the Guayabales project located in Caldas, Colombia. The Main Breccia discovery is a high-grade, bulk tonnage copper-silver-gold porphyry-related system, which owes its excellent metal endowment to multiple phases of mineralization which includes older copper-silver-gold porphyry mineralization and younger, overprinting, precious metal rich sheeted carbonate base metal vein systems.
Details (See Table 1 and Figures 1–6)
Assay results for twenty-eight diamond drill holes have now been announced at Apollo with results for additional holes expected in the near term. This press release announces results of three diamond drill holes with results summarized below.
APC-25 was drilled to the northwest from Pad 3 to a maximum depth of 215.80 metres and intersected a shallow, western extension to the Main Breccia discovery averaging:
106.85 metres @ 2.31 g/t gold equivalent consisting of 0.81 g/t Au, 30 g/t Ag, 0.62% Cu and 30 ppm Mo beginning at 73 metres downhole (65 metres vertical).
The mineralized angular breccia of this intercept contains a sulphide matrix which includes 1.5% to 2.5% chalcopyrite and between 1% and 3% pyrite plus pyrrhotite. The breccia has been overprinted by a zone of carbonate and base metal (sphalerite and galena) veins, which host higher gold grades and returned an interval of 14 metres grading 3.65 g/t gold equivalent. APC-25 is the westernmost hole drilled into the Main Breccia discovery and demonstrates that the mineralization is open and is thickening in this direction. Drill holes have been designed to continue to step-out to the west to expand upon this high grade and near surface mineralization.
APC-26 was drilled northeast from pad 4 and confirms continuity within the Northern Extension Zone of the Main Breccia system, as previously defined in holes APC-17 and APC-22. The hole was drilled to a maximum downhole length of 813.7 metres and intercepted:
311.2 metres @ 1.04 g/t gold equivalent consisting of 0.74 g/t Au, 16 g/t Ag, 0.05% Cu and 10 ppm Mo from 415 metres down hole.
Gold and silver mineralization relates to sulphides hosted within the angular breccia matrix including pyrite (1%-3%), pyrrhotite (1%-2%) and chalcopyrite (0.5%-1%). A higher-grade sub-zone was encountered within the mineralized intercept averaging 136.9 metres at 1.51 g/t gold equivalent and is characterized by an increase in overprinting low and intermediate sulphidation, carbonate base metal (“CBM”) vein material including visible sphalerite and galena.
APC-29 was drilled to the north-northeast from Pad 3 to a maximum depth of 644.8 metres and intercepted three mineralized zones before the hole was abandoned short of target depth due to a complicated fault structure. The two shallow zones within this hole are located directly beneath mineralized surface outcrops with the initial 32.0 metre intercept of mineralization beginning at 111.3 metres downhole (80 metres vertical), and the second 8.65 metre mineralized zone starting at 194.8 metres downhole (143 metres vertical). These high-grade gold, silver, and copper shallow zones of mineralization are hosted within a matrix of angular quartz diorite breccia with the sulphide component consisting of chalcopyrite (0.5%-2%), pyrite (0.5%-2%) and pyrrhotite (0.5-1%). Finally, the third zone, which starts at 343.8 metres downhole (318 metres vertical) intersected more 301 metres of continuous mineralization including a higher-grade subzone over 214.4 metres. The sulphide mineralization within the breccia matrix of this intercept contained pyrrhotite (0.5%-2.5%), pyrite (1%-3%) and multiple zones of sheeted CBM vein material, which are predominantly sphalerite rich with minor galena. The following intercepts are summarized from APC-29:
32.00 metres @ 10.48 g/t gold equivalent consisting of 9.23 g/t Au, 60 g/t Ag, 0.44% Cu and 30 ppm Mo from 89.25 metres downhole (80 metres vertical depth).
8.65 metres @ 2.26 g/t gold equivalent consisting of 0.57 g/t Au, 82 g/t Ag, 0.27% Cu and 10 ppm Mo from 194.80 metres downhole (143 metres vertical depth).
214.40 metres @ 1.04 gold equivalent consisting of 0.77 g/t Au, 14 g/t Ag, 0.05% Cu and 10 ppm Mo from 343.80 metres downhole (318 metres vertical depth), which includes 98.20 metres @ 1.26 g/t gold equivalent.
The Company’s Phase II, 2023 program is well underway with two rigs focused on drilling near surface, high grade mineralization below mineralized outcrops in the southern and central areas of the Main Breccia system while simultaneously targeting expansion to the overall dimensions of the system to the west, northwest, north and northeast. Furthermore, a new drill pad (pad 8) has been constructed 150 south of the southernmost modelled boundary of the Main Breccia system at Apollo and reconnaissance drilling is underway to test a recently discovered porphyry target.
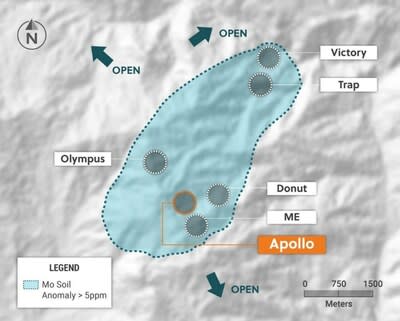
The Apollo target area, as defined to date by surface mapping, rock sampling and copper and molybdenum soil geochemistry, covers a 1,000 metres X 1,200 metres area. The Apollo target area hosts the Company’s Main Breccia discovery and multiple additional untested breccia, porphyry and vein targets. The overall Apollo target area also remains open for further expansion.
Table 1: Apollo Target Assays Results for Holes APC-25, APC-26 and APC-29
HoleID
From (m)
To (m)
Intercept (m)
Au (g/t)
Ag (g/t)
Cu %
Mo %
AuEq(g/t) *
CuEq(%) *
APC-25
73.00
179.85
106.85
0.81
30
0.62
0.003
2.31
1.26
Incl.
111.00
125.00
14.00
2.00
35
0.75
0.005
3.65
2.00
APC-26
415.00
726.20
311.20
0.74
16
0.05
0.001
1.04
incl.
415.00
551.90
136.90
1.14
20
0.06
0.001
1.51
APC-29
111.30
143.30
32.00
9.23
60
0.44
0.003
10.48
and
194.80
203.45
8.65
0.57
82
0.27
0.001
2.26
and
343.80
644.80
301.00
0.63
14
0.05
0.001
0.90
Incl.
343.80
558.20
214.40
0.77
14
0.05
0.001
1.04
Incl.
460.00
558.20
98.20
1.26
15
0.04
0.001
1.51
* AuEq (g/t) is calculated as follows: (Au (g/t) x 0.95) + (Ag g/t x 0.016 x 0.95) + (Cu (%) x 1.83 x 0.95)+ (Mo (%)*9.14 x 0.95) and CuEq (%) is calculated as follows: (Cu (%) x 0.95) + (Au (g/t) x 0.51 x 0.95) + (Ag (g/t) x 0.01 x 0.95)+ (Mo(%)x 3.75 x 0.95) utilizing metal prices of Cu – US$4.00/lb, Ag – $24/oz Mo US$20.00/lb and Au – US$1,500/oz and recovery rates of 95% for Au, Ag, Mo and Cu. Recovery rate assumptions are speculative as no metallurgical work has been completed to date.
** A 0.2 g/t AuEq cut-off grade was employed with no more than 15% internal dilution. True widths are unknown, and grades are uncut.
Figure 1: Plan View of the Main Breccia System at Apollo Highlighting Drill Holes APC-25, APC-26 and APC-29 (CNW Group/Collective Mining Ltd.)
Figure 2: Up Close View of Drill Holes Intersecting the Shallow, High-Grade Southern Zone Within the Main Breccia System at Apollo (CNW Group/Collective Mining Ltd.)
Figure 3: Plan View of the Guayabales Project Highlighting the Apollo Target (CNW Group/Collective Mining Ltd.)
To see our latest corporate presentation and related information, please visit www.collectivemining.com
Founded by the team that developed and sold Continental Gold Inc. to Zijin Mining for approximately $2 billion in enterprise value, Collective Mining is a copper, silver and gold exploration company based in Canada, with projects in Caldas, Colombia. The Company has options to acquire 100% interests in two projects located directly within an established mining camp with ten fully permitted and operating mines.
The Company’s flagship project, Guayabales, is anchored by the Apollo target, which hosts the large-scale, bulk-tonnage and high-grade copper, silver and gold Main Breccia discovery. The Company’s near-term objective is to continue with expansion drilling of the Main Breccia discovery while increasing confidence in the highest-grade portions of the system.
Management, insiders and close family and friends own nearly 35% of the outstanding shares of the Company and as a result, are fully aligned with shareholders. The Company is listed on the TSXV under the trading symbol “CNL” and on the OTCQX under the trading symbol “CNLMF”.
Qualified Person (QP) and NI43-101 Disclosure
David J Reading is the designated Qualified Person for this news release within the meaning of National Instrument 43-101 (“NI 43-101”) and has reviewed and verified that the technical information contained herein is accurate and approves of the written disclosure of same. Mr. Reading has an MSc in Economic Geology and is a Fellow of the Institute of Materials, Minerals and Mining and of the Society of Economic Geology (SEG).
Technical Information
Rock and core samples have been prepared and analyzed at SGS laboratory facilities in Medellin, Colombia and Lima, Peru. Blanks, duplicates, and certified reference standards are inserted into the sample stream to monitor laboratory performance. Crush rejects and pulps are kept and stored in a secured storage facility for future assay verification. No capping has been applied to sample composites. The Company utilizes a rigorous, industry-standard QA/QC program.
Information Contact:
Follow Executive Chairman Ari Sussman (@Ariski) and Collective Mining (@CollectiveMini1) on Twitter
FORWARD-LOOKING STATEMENTS
This news release contains certain forward-looking statements, including, but not limited to, statements about the drill programs, including timing of results, and Collective’s future and intentions. Wherever possible, words such as “may”, “will”, “should”, “could”, “expect”, “plan”, “intend”, “anticipate”, “believe”, “estimate”, “predict” or “potential” or the negative or other variations of these words, or similar words or phrases, have been used to identify these forward-looking statements. These statements reflect management’s current beliefs and are based on information currently available to management as at the date hereof.
Forward-looking statements involve significant risk, uncertainties, and assumptions. Many factors could cause actual results, performance, or achievements to differ materially from the results discussed or implied in the forward-looking statements. These factors should be considered carefully, and readers should not place undue reliance on the forward-looking statements. Although the forward-looking statements contained in this news release are based upon what management believes to be reasonable assumptions, Collective cannot assure readers that actual results will be consistent with these forward-looking statements. These forward-looking statements are made as of the date of this news release, and Collective assumes no obligation to update or revise them to reflect new events or circumstances, except as required by law.
Neither the TSXV nor its Regulation Services Provider (as that term is defined in the policies of the TSXV) accepts responsibility for the adequacy or accuracy of this news release.
Burlington, Ontario–(Newsfile Corp. – January 30, 2023) – Silver Bullet Mines Corp. (TSXV: SBMI) (OTCQB: SBMCF) (‘SBMI’ or ‘the Company’) announces it is applying to the TSX Venture Exchange to extend all warrants related to the Company’s $0.30 round of financing (the “Warrants”). The Warrants have a two-year term, are exercisable at $0.50 (fifty cents) and were issued in various tranches from February 6, 2021 to July 8, 2021.
The Company is seeking regulatory approval to extend all Warrants for one additional year from their original expiry dates.
With respect to the Arizona mining and milling operations, SBMI expects to be able to make further disclosure within two weeks.
For further information, please contact:
John Carter Silver Bullet Mines Corp., CEO cartera@sympatico.ca +1 (905) 302-3843
Peter M. Clausi Silver Bullet Mines Corp., VP Capital Markets pclausi@brantcapital.ca +1 (416) 890-1232
Cautionary and Forward-Looking Statements
This news release contains certain statements that constitute forward-looking statements as they relate to SBMI and its subsidiaries. Forward-looking statements are not historical facts but represent management’s current expectation of future events, and can be identified by words such as “believe”, “expects”, “will”, “intends”, “plans”, “projects”, “anticipates”, “estimates”, “continues” and similar expressions. Although management believes that the expectations represented in such forward-looking statements are reasonable, there can be no assurance that they will prove to be correct.
By their nature, forward-looking statements include assumptions, and are subject to inherent risks and uncertainties that could cause actual future results, conditions, actions or events to differ materially from those in the forward-looking statements. If and when forward-looking statements are set out in this new release, SBMI will also set out the material risk factors or assumptions used to develop the forward-looking statements. Except as expressly required by applicable securities laws, SBMI assumes no obligation to update or revise any forward-looking statements. The future outcomes that relate to forward-looking statements may be influenced by many factors, including but not limited to: the impact of SARS CoV-2 or any other global pathogen; reliance on key personnel; the thoroughness of its QA/QA procedures; the continuity of the global supply chain for materials for SBMI to use in the production and processing of mineralized material; shareholder and regulatory approvals; activities and attitudes of communities local to the location of the SBMI’s properties; risks of future legal proceedings; income tax matters; fires, floods and other natural phenomena; the rate of inflation; availability and terms of financing; distribution of securities; commodities pricing; currency movements, especially as between the USD and CDN; effect of market interest rates on price of securities; and, potential dilution. SARS CoV-2 and other potential global pathogens create risks that at this time are immeasurable and impossible to define.
The Issuer has not based its production decision on current resources or the results of a pre-feasibility study of mineral resources to establish mineral reserves demonstrating technical and economic viability. Significant uncertainty exists on the presence of any economic mineable material.
VANCOUVER, BC / ACCESSWIRE / January 30, 2023 / Metallic Minerals Corp. (TSX.V:MMG)(OTCQB:MMNGF) (“Metallic Minerals” or the “Company”) is pleased to announce additional results from the 2022 field program at the Keno Silver project in the historic Keno Hill silver district of the Yukon: Canada’s most important silver mining district. These results cover the West Keno area and represent the second in a series of results to be released from the Company’s 2022 exploration program, which included 3,265 meters (“m”) of diamond core drilling in 23 drill holes focused on expansion of advanced stage, “resource-ready” targets in anticipation of an inaugural NI 43-101 mineral resource estimate in 2023.
Exploration in 2022 at West Keno focused on drilling at the advanced-stage Formo target, which produced silver at various times since the 1930s from high-grade vein structures that graded over 1,000 g/t silver1. Formo is a significant inholding within the neighbouring Hecla Mining property and is on trend with the historic Hector-Calumet Mine, which produced nearly 100 million ounces of silver making it the largest individual mine in the district1.
2022 West Keno Exploration highlights
High-grade silver (“Ag”), lead (“Pb”) and zinc (“Zn”) mineralization was encountered in five of seven holes (See Table 1). Both high-grade Ag-Pb-Zn vein-style mineralization and broader zones of moderate grade Ag-Pb-Zn mineralization were encountered.
A total of 40 high-grade samples of over 100 g/t silver equivalent (“Ag Eq”) were intercepted in the 2022 West Keno drilling, including:
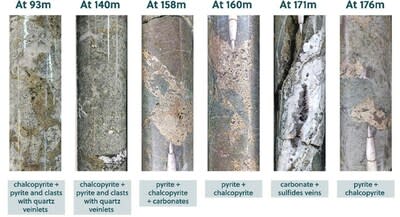
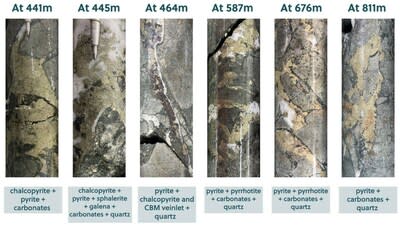
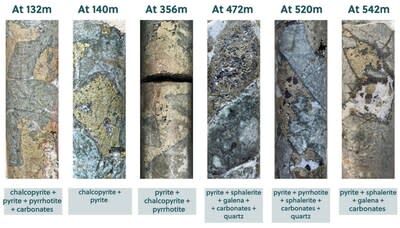
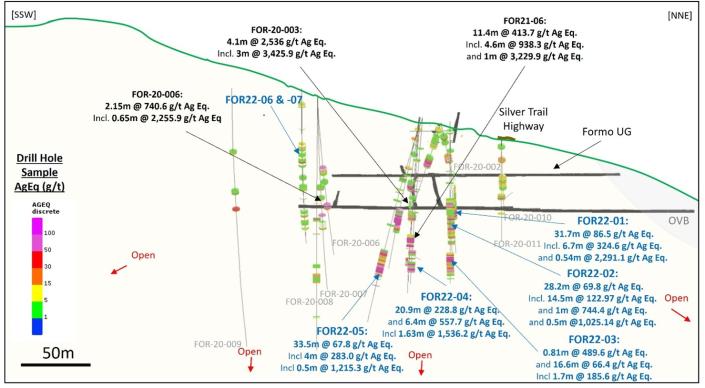
FOR22-01, 0.54 m @ 2,291 g/t Ag Eq (1,139 g/t Ag, 18.32% Pb, 14.79% Zn)
FOR22-02, 0.5 m @ 1,025.1 g/t Ag Eq (14 g/t Ag, 0.07% Pb, 23.36% Zn)
FOR22-04, 1.63 m @ 1,536.2 g/t Ag Eq (1,049.5 g/t Ag, 4.21% Pb, 9.45% Zn)
FOR22-04, 0.64 m @ 2,127.9 g/t Ag Eq (1,358 g/t Ag, 4.16% Pb, 16.42% Zn)
FOR22-05, 0.5 m @ 1,215.3 g/t Ag Eq (850 g/t Ag, 7.65% Pb, 3.97% Zn)
All five holes encountering significant silver mineralization in 2022 also intercepted broad bulk-tonnage zones averaging 26.2 m @ 85.6 g/t Ag Eq comprised of multiple high-grade vein intervals with associated stringers and stockwork veining.
Metallic Minerals President, Scott Petsel, stated, “Impressive drill results, year over year, have consistently demonstrated that Formo is one of Metallics’ highest-grade targets and have cemented it as a priority for a planned, near-term NI 43-101 resource estimate. The strategic location of the Formo deposit along the Silver Trail Highway provides easy access and adjacent electrical power and it is only two kilometers from the largest individual silver deposit in the district and less than five kilometers from both Hecla’s active mine development operations at Bermingham and the Keno operations mill at Keno City. This new step-out drilling continues to show that the deposit remains open to further testing along trend and down dip with room for significant expansion of the mineralized footprint and additional new discoveries. With these results complete we have initiated resource modelling work with SGS Geological Services on the Formo deposit.
“The Company expects to announce additional drill results from both the Keno Silver Project (primarily at the advanced-stage Caribou target), and from follow up expansion drilling at the La Plata Project over the coming weeks.”
Upcoming Events
Vancouver Resource Investment Conference – Metallic Minerals will be participating in the Vancouver Resource Investment Conference at the Yukon Pavilion on Monday January 30th. For more information, visit here.
GCFF Virtual Conference – Scott Petsel will be presenting during the GCFF Metals Investing Virtual Conference on February 23rd at 10am PT | 1pm ET. To register, click here.
OTC Markets Battery & Precious Metals Virtual Investor Conference – Metallic will be participating in the upcoming OTC Markets Battery & Precious Metals Investor Conference on Wednesday, February 15 at 10am PT | 1pm ET. To register, click here.
2023 Prospectors and Developers Convention (PDAC) – Booth, Presentation & YMA Core Shack
Metallic Minerals will be attending PDAC 2023 in Booth IE3024. Additionally, President Scott Petsel will be providing a corporate presentation at a Forum for Investors during the 2023 Prospectors and Developers convention in Toronto Monday March 6th in the silver-focused session, Room 803, between 10:00 am and 12:00 pm at the Metro Toronto Convention Center. For more information, visit here.
Figure 1. Keno Silver District Geology and Deposits
Metallic Minerals Corp., Monday, January 30, 2023, Press release picture
West Keno 2022 Drilling Program
Drilling at West Keno focused on the advanced-stage “resource-ready” Formo target area. A total of seven holes were completed over 1,145.6 meters on known projections of mineralization with the goal of expanding the potential resource footprint of the deposit in anticipation of an inaugural 43-101 mineral resource estimate in 2023. Previous drilling has recognized at least three separate parallel high-grade Ag-Pb-Zn vein structures and results of the 2022 drilling continue to demonstrate multiple vein zones in each hole with individual grades commonly more than 1,000 g/t Ag Eq (See Table 1). The Formo target represents one of the highest-grade areas drilled to date on Metallic’s Keno Silver Property with 4.1 m of 2,536 g/t Ag Eq (FOR20-03) and 1 m of 2,961.6 g/t Ag Eq (FOR21-06) as examples of drill results from previous years efforts.
Table 1 – Highlights of 2022 Drill Results from the West Keno – Formo Target Area
DDH Hole ID
From (m)
To (m)
Length (m)
Ag Eq (g/t)
Ag (g/t)
Au (g/t)
Pb (%)
Zn (%)
FOR22-01
72.3
103.95
31.65
86.5
41.1
0.01
0.54
0.70
incl
72.3
72.8
0.5
496.4
349
0.00
3.70
1.17
And incl
97.3
103.95
6.65
324.6
148.4
0.02
2.07
2.73
And incl
98.8
99.34
0.54
2291
1139
0.06
18.32
14.79
FOR22-02
91
119.2
28.2
69.8
11.6
0.02
0.11
1.25
incl
91
105.5
14.5
123
17.1
0.01
0.16
2.34
And incl
91
92
1
744.4
74
0.02
0.31
15.35
And incl
95.3
95.8
0.5
1,025.1
14
0.01
0.07
23.36
FOR22-03
77
81
4
154.2
93.6
0.01
0.83
0.90
incl
77
77.81
0.81
489.6
386
0.00
3.54
0.31
and
125
141.6
16.6
66.4
36
0.01
0.37
0.45
incl
126.8
134
7.2
107.8
58.4
0.00
0.65
0.74
FOR22-04
125.13
146
20.87
228.8
144.6
0.01
0.70
1.59
incl
126.75
127.5
0.7
1,168.5
345
0.07
3.52
16.81
And incl
137.6
144
6.4
557.7
395.9
0.02
1.65
2.99
And incl
141.81
143.44
1.63
1,536.2
1,049.5
0.11
4.21
9.45
And incl
142.8
143.44
0.64
2,127.9
1,358
0.00
4.16
16.42
FOR22-05
60.9
61.62
0.72
293.5
3.5
3.34
0.01
0.10
and
131.5
164.95
33.45
67.9
42.1
0.05
0.37
0.28
incl
147
151
4
283
195.3
0.00
1.81
0.96
And incl
148.8
149.3
0.5
1,215.3
850
0.00
7.65
3.97
And incl
164.45
164.95
0.5
280
1.9
3.25
0.00
0.00
FOR22-06
75.7
77.15
1.45
41.8
21.3
0.01
0.44
0.17
and
131.52
132.07
0.55
42.8
15.3
0.02
0.12
0.53
FOR22-07
93.4
93.9
0.5
44.9
22.3
0.01
0.20
0.39
and
123.45
124.04
0.59
43.8
31.1
0.00
0.21
0.18
Notes to reported values:
Ag equivalent is presented for comparative purposes using conservative long-term metal prices (all USD): $20.0/oz silver (Ag), $1.00/lb lead (Pb), $1.40/lb zinc (Zn).
Rcovered Silver Equivalent in Table 1 is determined as follows: Ag Eq g/t = [Ag g/t x recovery] + [Au g/t x recovery x Au price/ Ag price] + [Pb % x 10,000 x recovery x Pb price / Ag price] + [Zn% x 10,000 x recovery x Zn price / Ag price].
In the above calculations: 1% = 10,000 ppm = 10,000 g/t.
The following recoveries have been assumed for purposes of the above equivalent calculations: 95% for precious metals (Ag/Au) and 90% for all other listed metals, based on recoveries at similar nearby operations.
Intervals are reported as measured drill intersect lengths and may not represent true width.
West Keno and the Formo Area Target
The Western Keno Hill district is host to the largest historic production and current resources in the prolific Keno Hill silver district. The Formo target is located at the intersection of a north-easterly structural zone extending from the Hector-Calumet mine, which was the largest producer in the district producing nearly 100 million ounces of silver and the Elsa structural trend, which was the second largest silver producer in the district (see Figure 2).
The Formo property, which include the Formo Mine, also known as the Yukeno Mine, was acquired by Metallic Minerals in 2017. The historic Formo mine produced high-grade silver at various times since the 1930s from high-grade vein structures that graded over 1,000 g/t silver1. Significant underground exploration drifts were developed in the 1950s with most of the historic production from an open pit located alongside of the Silver Trail highway between the Elsa townsite and Keno City and last mined in the 1980s.
Figure 2 – West Keno Plan Map
Metallic Minerals Corp., Monday, January 30, 2023, Press release picture
Figure 3 – Formo Vein Long Section (looking NW)
Metallic Minerals Corp., Monday, January 30, 2023, Press release picture
The primary Formo vein structure is exposed at surface in an open cut. Multiple veins have been encountered in the target area that demonstrate an association with Triassic greenstones in the Earn group schist, similar to the Sadie Ladue deposit which produced 12.7 Moz silver at a grade of 1,620 g/t Ag1. In addition to the mineralization at the known Formo deposit, two new surface targets have been identified through soil and rock sampling along the same structural corridors that show potential to host high-grade and bulk tonnage Keno-style Ag-Pb-Zn veins on the Formo property.
Since 2020 Metallic Minerals has drilled 22 holes (3,306.9 m) at the Formo Target to compliment the six core holes and 54 percussion holes drilled by previous owners between 1980 and 1981. The Formo Target is open to significant expansion opportunities and is poised to lead the Company’s efforts to establish resources on the Keno Silver Project.
Grant of Long-Term Performance Incentives
Metallic Minerals further announces that, subject to the approval of the TSX Venture Exchange, it has granted 1,490,000 stock options (each, an “Option”) to certain directors, officers and employees of the Company in accordance with the Company’s Long-Term Performance Incentive Plan. Each Option is exercisable into one common share in the capital of the Company (“Share”) at a price of $0.23 per share, being the closing price of the Shares on the TSX Venture Exchange on January 27, 2023, for a period of five years from the date of grant. The Options are subject to certain vesting requirements in accordance with the shareholder approved plan.
About Metallic Minerals
Metallic Minerals Corp. is a leading exploration and development stage company, focused on silver and gold in the high-grade Keno Hill and Klondike districts of the Yukon, and copper, silver and critical minerals in the La Plata mining district in Colorado. Our objective is to create shareholder value through a systematic, entrepreneurial approach to making exploration discoveries, growing resources and advancing projects toward development. Metallic Minerals has consolidated the second-largest land position in the historic Keno Hill silver district of Canada’s Yukon Territory, directly adjacent to Hecla Mining’s operations, with more than 300 million ounces of high-grade silver in past production and current M&I resources. Hecla Mining Company, the largest primary silver producer in the USA and third largest in the world, completed the acquisition of Alexco Resources and their Keno Hill operations in September 2022. Metallic Minerals is also one of the largest holders of alluvial gold claims in the Yukon and is building a production royalty business by partnering with experienced mining operators. At the Company’s La Plata project in southwestern Colorado an inaugural NI 43-101 mineral resource estimate in April 2022 returned a significant porphyry copper-silver resource with results from the 2022 expansion drill program pending. All of the districts in which Metallic Minerals operates have seen significant mineral production and have existing infrastructure, including power and road access. Metallic Minerals is led by a team with a track record of discovery and exploration success on several major precious and base metal deposits in the region, as well as having large-scale development, permitting and project financing expertise. The Metallic Minerals team has been recognized for its environmental stewardship practices and is committed to responsible and sustainable resource development.
Footnotes:
Cathro, R. J., Great Mining Camps of Canada 1. The History and Geology of the Keno Hill Silver Camp, Yukon Territory. Geoscience Canada, Sept. 2006. ISSN 1911-4850.
The disclosure in this news release of scientific and technical information regarding exploration projects on Metallic Minerals’ mineral properties has been reviewed and approved by Debbie James, Senior Geologist for TruePoint Exploration, who is a Qualified Person as defined by National Instrument 43-101 – Standards of Disclosure for Mineral Projects (“NI 43-101”).
Quality Assurance / Quality Control
All samples were assayed by 36 Element Aqua Regia Digestion ICP-MS methods at Bureau Veritas labs in Vancouver with sample preparation in Whitehorse, Yukon and geochemical analysis in Vancouver, British Columbia. Samples with over limit silver and gold were re-analyzed using a 30-gram fire assay fusion with a gravimetric finish. Over-limit lead and zinc samples were analyzed by multi-acid digestion and atomic absorption spectrometry. All results have passed the QAQC screening by the lab and the company utilized a quality control and quality assurance protocol for the project, including blank, duplicate, and standard reference samples.
Forward-Looking Statements
This news release includes certain statements that may be deemed “forward-looking statements”. All statements in this release, other than statements of historical facts including, without limitation, statements regarding potential mineralization, historic production, estimation of mineral resources, the realization of mineral resource estimates, interpretation of prior exploration and potential exploration results, the timing and success of exploration activities generally, the timing and results of future resource estimates, permitting time lines, metal prices and currency exchange rates, availability of capital, government regulation of exploration operations, environmental risks, reclamation, title, statements about expected results of operations, royalties, cash flows, financial position and future dividends as well as financial position, prospects, and future plans and objectives of the Company are forward-looking statements that involve various risks and uncertainties. Although Metallic Minerals believes the expectations expressed in such forward-looking statements are based on reasonable assumptions, such statements are not guarantees of future performance and actual results or developments may differ materially from those in the forward-looking statements. Forward-looking statements are based on a number of material factors and assumptions. Factors that could cause actual results to differ materially from those in forward-looking statements include failure to obtain necessary approvals, unsuccessful exploration results, unsuccessrul operations, changes in project parameters as plans continue to be refined, results of future resource estimates, future metal prices, availability of capital and financing on acceptable terms, general economic, market or business conditions, risks associated with regulatory changes, defects in title, availability of personnel, materials and equipment on a timely basis, accidents or equipment breakdowns, uninsured risks, delays in receiving government approvals, unanticipated environmental impacts on operations and costs to remedy same and other exploration or other risks detailed herein and from time to time in the filings made by the Company with securities regulators. Readers are cautioned that mineral resources that are not mineral reserves do not have demonstrated economic viability. Mineral exploration, development of mines and mining operations is an inherently risky business. Accordingly, the actual events may differ materially from those projected in the forward-looking statements. For more information on Metallic Minerals and the risks and challenges of their businesses, investors should review their annual filings that are available at www.sedar.com.
Neither the TSX Venture Exchange nor its Regulation Services Provider (as that term is defined in the policies of the TSX Venture Exchange) accepts responsibility for the adequacy or accuracy of this release.
Silver is a precious metal that has been used for thousands of years in various forms of currency, jewelry, and industrial applications. However, the demand for silver has increased in recent years due to its use in new technologies such as Electric cars, solar panels and electronic devices. As a result, this raises concerns about the possibility of a silver deficit, where demand for the metal exceeds supply. This raises the question of whether or not a silver deficit would have any significant impact on the global economy and the price of silver.
Watch this video on Do Silver Deficits Matter?, then please share with your friends and family on social media and use the caption: Do Silver Deficits Matter?.
I’ve Been Helping My Subscribers Weather the Current Economic Mess. Now I Invite You to Join My Growing Circle of Successful Investors.
The Morgan Report is all about YOU and how you can build and preserve Wealth for generations to come. We know it can sometimes seem a daunting task to protect your assets and preserve or grow your wealth. Over 15 years ago, a small group of us started The Morgan Report and formed an exclusive membership organization to promote personal freedom, an honest money system, free market wealth accumulation, and asset protection.
Thus was born The Morgan Report – since then we’ve helped 11,000-plus members scattered over the globe in every continent and over 100,000+ e-newsletter subscribers have read our weekly e-newsletter — This Week’s View from The Morgan Report.
Through our publication, The Morgan Report, we provide you with ways to achieve greater financial security and wealth in all sorts of environments.
Learn more and become an insider for The Morgan Report, click the link below…
Because there is a 100% failure rate of ALL fiat money throughout history, you will learn what to do by obtaining your Free Report. Just enter your first name, your primary email address and click the Get Special Report button below.
Our mission statement reads…
“To teach and empower people to understand the benefits of an honest monetary system.”
Today’s monetary system is based upon a lie. The lie is that you can get something for nothing, or perhaps more simply stated, wealth can be printed. History has shown throughout 5000 years that whenever a country has tried to maintain this illusion (lie), failure has been the result. We invite you to learn more about what The Morgan Report can do for you. Click on the Learn More About The Morgan Report button now! Learn More About The Morgan Report *