Burlington, Ontario–(Newsfile Corp. – January 23, 2024) – Silver Bullet Mines Corp. (TSXV: SBMI) (OTCQB: SBMCF) (‘SBMI’ or ‘the Company’) is pleased to announce as part of its ongoing transformation to a silver producing company, it has submitted and received approval for its mine training program from the Mine Safety and Health Association (“MSHA”), part of the United States Department of Labor. This MSHA approval covers the training program for both SBMI’s underground and surface operations. The approval process included three onsite inspections by MSHA and the completion by SBMI of a detailed safety operations program.
The field team in Arizona is currently attending the annual training program which will be completed this week, following which the field team intends to address any outstanding safety-related items, develop the silver higher-grade Zone1, and commence commercial operations.
For further information, please contact:
John Carter Silver Bullet Mines Corp., CEO cartera@sympatico.ca +1 (905) 302-3843
Peter M. Clausi Silver Bullet Mines Corp., VP Capital Markets pclausi@brantcapital.ca +1 (416) 890-1232
Cautionary and Forward-Looking Statements
This news release contains certain statements that constitute forward-looking statements as they relate to SBMI and its subsidiaries. Forward-looking statements are not historical facts but represent management’s current expectation of future events, and can be identified by words such as “believe”, “expects”, “will”, “intends”, “plans”, “projects”, “anticipates”, “estimates”, “continues” and similar expressions. Although management believes that the expectations represented in such forward-looking statements are reasonable, there can be no assurance that they will prove to be correct.
By their nature, forward-looking statements include assumptions, and are subject to inherent risks and uncertainties that could cause actual future results, conditions, actions or events to differ materially from those in the forward-looking statements. If and when forward-looking statements are set out in this new release, SBMI will also set out the material risk factors or assumptions used to develop the forward-looking statements. Except as expressly required by applicable securities laws, SBMI assumes no obligation to update or revise any forward-looking statements. The future outcomes that relate to forward-looking statements may be influenced by many factors, including but not limited to: the impact of SARS CoV-2 or any other global virus; reliance on key personnel; the thoroughness of its QA/QA procedures; the continuity of the global supply chain for materials for SBMI to use in the production and processing of ore; shareholder and regulatory approvals; activities and attitudes of communities local to the location of the SBMI’s properties; risks of future legal proceedings; income tax matters; fires, floods and other natural phenomena; the rate of inflation; availability and terms of financing; distribution of securities; commodities pricing; currency movements, especially as between the USD and CDN; effect of market interest rates on price of securities; and, potential dilution. SARS CoV-2 and other potential global pathogens create risks that at this time are immeasurable and impossible to define.
Edmonton, Alberta–(Newsfile Corp. – January 22, 2024) – Grizzly Discoveries Inc. (TSXV: GZD) (FSE: G6H) (OTCQB: GZDIF) (“Grizzly” or the “Company”) is pleased to announce that, on January 19, 2024, it closed on a private placement (the “Offering”) by the issuance of 2,975,500 Units (as defined below) at a price of $0.05 per Unit for gross proceeds of $148,775.
Under the terms of the Offering, each Unit consisted of one common share of the Company (“Common Share”) and one half of one warrant (“Warrant”). Each whole Warrant entitles the holder to acquire one additional Common Share at an exercise price of $0.07 per Common Share and shall expire on the earlier of: (a) 30 days following written notice by the Issuer to the Subscriber that the volume-weighted average trading price of the Common Shares on the TSX Venture Exchange is at or greater than CA$0.10 per Common Share for 10 consecutive trading days; and (b) January 19, 2026.
The Company intends to use the proceeds from the Units for general working capital.
The Common Shares and any Common Shares issued on exercise of the Warrants are subject to restrictions on trading until May 20, 2024 in accordance with the policies of the TSX Venture Exchange.
Following closing of the Offering, the Company has 152,669,619 Common Shares issued and outstanding. The Offering is subject to Final Acceptance by the TSX Venture Exchange.
ABOUT GRIZZLY DISCOVERIES INC.
Grizzly is a diversified Canadian mineral exploration company with its primary listing on the TSX Venture Exchange focused on developing its approximately 72,700 ha (approximately 180,000 acres) of precious and base metals properties in southeastern British Columbia. Grizzly is run by a highly experienced junior resource sector management team, who have a track record of advancing exploration projects from early exploration stage through to feasibility stage.
On behalf of the Board, GRIZZLY DISCOVERIES INC. Brian Testo, CEO, President
Suite 363-9768 170 Street NW Edmonton, Alberta T5T 5L4
Neither the TSX Venture Exchange nor its Regulation Services Provider (as that term is defined in the policies of the TSX Venture Exchange) accepts responsibility for the adequacy or accuracy of this release.
KELOWNA, BC / ACCESSWIRE / January 18, 2024 / Diamcor Mining Inc. (TSX-V.DMI)(OTCQB:DMIFF)(FRA:DC3A), (“Diamcor” or the “Company”), a well-established Canadian diamond mining company with a proven history in the mining, exploration, and sale of rough diamonds announces that the Company intends to complete a convertible loan financing (the “Financing”) of up to CDN$2,000,000.00, and anticipates that an aggregate of approximately CDN$1,250,000.00 of the Financing will be subscribed to by existing larger shareholders and management of the Company. The financing will consist of unsecured convertible promissory notes (the “Notes”) having a term of two (2) years from the closing date and bearing interest at the rate of 15% per annum. During the first year, interest will accrue and be payable 12 months from the date of closing. No principal payments will be required until maturity. The principal amount of the Notes will be convertible at the election of the noteholder into Common Shares of the Company at any time up to the maturity date at the rate of CND$0.10 per share. As provided in Policy 5.2 of the TSX Venture Exchange Corporate Finance Policy Manual, interest will be convertible at the election of the noteholder into Common Shares of the Company at the Market Price as at the time of conversion of the interest.
In addition, subject to the exceptions noted below, the Company will issue non-transferable share purchase warrants to eligible participating investors, with each share purchase warrant entitling the holder thereof to purchase one (1) Common share of the Company at a price of CND$0.15 for a period of two (2) years from the date of issuance (the “Warrants”). The number of Warrants issuable to the eligible participating investors will be equal to the number of Common Shares into which the principal amount of the investor’s Note is convertible.
The proceeds from the Financing will be used for the continued advancement of efforts to increase processing volumes at the Company’s Krone-Endora at Venetia Project (the “Project”), the work programmes previously underway, the announced efforts surrounding drilling and bulk sampling on the greater portions of the Project, and for general corporate purposes. While the Company plans to continue ongoing discussions with financiers and industry-related parties on additional funding scenarios which may be beneficial in increasing long-term shareholder value and added growth, the Company will not be proceeding with the term loan financing of up to CND$5.0M previously announced on October 2, 2023.
For further detail on the Company’s future plans and its perspective on the diamond industry, please see the following in depth interview with Dean Taylor, chief executive officer of Diamcor.
The Financing is subject to regulatory approval of the TSX Venture Exchange along with completion of all definitive documentation and filings as required. All securities issued pursuant to the above will be subject to a hold period of four months plus one day following the closing.
About Diamcor Mining Inc.
Diamcor Mining Inc. is a fully reporting publicly traded Canadian diamond mining company with a well-established proven history in the mining, exploration, and sale of rough diamonds. With a long-term strategic alliance with world famous Tiffany & Co, the Company’s primary focus is on the mining and development of its Krone-Endora at Venetia Project which is co-located and directly adjacent to De Beers’ Venetia Diamond Mine in South Africa. The Venetia diamond mine is recognized as one of the world’s top diamond-producing mines, and the deposits which occur on Krone-Endora have been identified as being the result of shift and subsequent erosion of an estimated 50M tonnes of material from the higher grounds of Venetia to the lower surrounding areas in the direction of Krone and Endora. The Company focuses on the acquisition and development of mid-tier projects with near-term production capabilities and growth potential and uses unique approaches to mining that involves the use of advanced technology and techniques to extract diamonds in a safe, efficient, and environmentally responsible manner. The Company has a strong commitment to social responsibility, including supporting local communities and protecting the environment.
About the Tiffany & Co. Alliance
The Company has established a long-term strategic alliance and first right of refusal with Tiffany & Co. Canada, a subsidiary of world-famous New York based Tiffany & Co., to purchase up to 100% of the future production of rough diamonds from the Krone-Endora at Venetia Project at market prices. In conjunction with this first right of refusal, Tiffany & Co. Canada also provided the Company with financing in an effort to advance the Project as quickly as possible. Tiffany & Co. is now owned by Moet Hennessy Louis Vuitton SE (LVMH), a publicly traded company which is listed on the Paris Stock Exchange (Euronext) under the symbol LVMH and on the OTC under the symbol LVMHF. For additional information on Tiffany & Co., please visit their website at www.tiffany.com.
About the Krone-Endora at Venetia Project
Diamcor acquired the Krone-Endora at Venetia Project from De Beers Consolidated Mines Limited, consisting of the prospecting rights over the farms Krone 104 and Endora 66, which represent a combined surface area of approximately 5,888 hectares directly adjacent to De Beers’ flagship Venetia Diamond Mine in South Africa. The Company subsequently announced that the South African Department of Mineral Resources had granted a Mining Right for the Krone-Endora at Venetia Project encompassing 657.71 hectares of the Project’s total area of 5,888 hectares. The Company has also submitted an application for a mining right over the remaining areas of the Project. The deposits which occur on the properties of Krone and Endora have been identified as a higher-grade “Alluvial” basal deposit which is covered by a lower-grade upper “Eluvial” deposit. These deposits are proposed to be the result of the direct-shift (in respect to the “Eluvial” deposit) and erosion (in respect to the “Alluvial” deposit) of an estimated 1,000 vertical meters of material from the higher grounds of the adjacent Venetia Kimberlite areas. The deposits on Krone-Endora occur with a maximum total depth of approximately 15.0 metres from surface to bedrock, allowing for a very low-cost mining operation to be employed with the potential for near-term diamond production from a known high-quality source. Krone-Endora also benefits from the significant development of infrastructure and services already in place due to its location directly adjacent to the Venetia Mine, which is widely recognised as one of the top producing diamond mines in the world.
Qualified Person Statement:
Mr. James P. Hawkins (B.Sc., P.Geo.), is Manager of Exploration & Special Projects for Diamcor Mining Inc., and the Qualified Person in accordance with National Instrument 43-101 responsible for overseeing the execution of Diamcor’s exploration programmes and a Member of the Association of Professional Engineers and Geoscientists of Alberta (“APEGA”). Mr. Hawkins has reviewed this press release and approved of its contents.
This press release contains certain forward-looking statements. While these forward-looking statements represent our best current judgement, they are subject to a variety of risks and uncertainties that are beyond the Company’s ability to control or predict and which could cause actual events or results to differ materially from those anticipated in such forward-looking statements. Further, the Company expressly disclaims any obligation to update any forward looking statements. Accordingly, readers should not place undue reliance on forward-looking statements.
WE SEEK SAFE HARBOUR
Neither TSX Venture Exchange nor its Regulation Services Provider (as that term is defined in policies of the TSX Venture Exchange) accepts responsibility for the adequacy or accuracy of this release.
Edmonton, Alberta–(Newsfile Corp. – January 17, 2024) – Grizzly Discoveries Inc. (TSXV: GZD) (FSE: G6H) (OTCQB: GZDIF) (“Grizzly” or the “Company”) is pleased to announce the first assay results for rock and soil samples collected from the newly acquired and staked mineral claims in the Beaverdell area of the Greenwood District. These are the first results from an initial exploration program conducted in the South Beaverdell target area within the Greenwood Precious and Battery Metals Project. In addition, results will also be forthcoming from additional prospecting and sampling in the Greenwood area and from recent work conducted at the Robocop Property following up on copper-cobalt anomalous soils identified in work over the last two years.
Highlights:
A total of 49 rock grab samples were collected from mostly outcrop and some mineralized dump material across the South Beaverdell claims acquired in early 2023 (Figures 1 & 2).
Additional staking has been conducted to expand and firm up the land position in the area.
Rock grab samples from showings and mineralized dumps in the Gold Drop portion of the claim area returned 4 samples with >42.8 grams per tonne (g/t) silver (Ag) (1.25 ounces per ton [opt] up to 97 g/t (2.83 opt) Ag.
The high Ag values are often accompanied by high lead and zinc in the 0.1 – 2% range. The high values are associated with gossanous sulphide material in quartz veins and breccia in a shear zone in granodiorite in contact with a diorite or felsic porphyry dike (Figures 3 & 4).
A few 2023 samples from the Gold Drop claim returned weakly anomalous gold values. A single sample from a road cut to the south yielded 0.624 g/t (0.018 opt) Au (Figures 1 and 2). Historical exploration has yielded a number of high silver and gold values from selective grab samples and some chip samples from the Gold Drop underground workings including up to 51.4 g/t (1.5 opt) Au and 377.1 g/t (11.0 opt) Ag (Minfile 082ESW041).
A total of 329 soil samples were collected during 2023 at and surrounding the Gold Drop showing. A number of soil samples returned anomalous Ag, Au and Zn results (Figures 1, 2 and 5). A total of 25 samples yielded from 20 up to 348 parts per billion (ppb) Au with three samples yielding >200 ppb Au (Figure 5).
Brian Testo, President and CEO of Grizzly Discoveries, stated “We are excited with the new results to date from the new Beaverdell mineral claims and we are planning follow-up exploration including extensive soil and rock sampling programs along with ground geophysical surveys. Much of the newly acquired ground has seen little exploration and evaluation since the 1980’s. We also are looking forward to pursuing a number of high grade gold – silver – copper showings and historical mines with drilling in 2024 along with additional exploration for significant battery metal prospects in our current 165,000+ acre land holdings in the Greenwood District. We have barely scratched the surface in terms of exploration!“
Figure 1: Initial 2023 Ag results rock & soil sampling – South Beaverdell Area, Greenwood Project.
An extensive rock and soil sampling program along with new geological mapping during 2023 has been completed in preparation for drilling at a number of locations in the Greenwood Area. Additional results should be forthcoming over the next month and will be presented in additional news releases.
Quality Assurance and Control
Rock and soil samples were analyzed at ALS Global Laboratories (Geochemistry Division) in Vancouver, Canada (an ISO/IEC 17025:2017 accredited facility). Gold was assayed using a fire assay with atomic emission spectrometry and gravimetric finish when required (+10 g/t Au). Rock grab and rock chip samples from outcrop/bedrock are selective by nature and may not be representative of the mineralization hosted on the project.
The sampling program was undertaken by Company personnel under the direction of Michael B. Dufresne, M.Sc., P.Geol., P.Geo. A secure chain of custody is maintained in transporting and storing of all samples.
The technical content of this news release and the Company’s technical disclosure has been reviewed and approved by Michael B. Dufresne, M. Sc., P. Geol., P.Geo., who is the Qualified Person as defined by National Instrument 43-101 Standards of Disclosure for Mineral Projects.
ABOUT GRIZZLY DISCOVERIES INC.
Grizzly is a diversified Canadian mineral exploration company with its primary listing on the TSX Venture Exchange focused on developing its approximately 72,700 ha (approximately 180,000 acres) of precious and base metals properties in southeastern British Columbia. Grizzly is run by highly experienced junior resource sector management team, who have a track record of advancing exploration projects from early exploration stage through to feasibility stage.
On behalf of the Board,
GRIZZLY DISCOVERIES INC. Brian Testo, CEO, President
Suite 363-9768 170 Street NW Edmonton, Alberta T5T 5L4
Neither the TSX Venture Exchange nor its Regulation Services Provider (as that term is defined in the policies of the TSX Venture Exchange) accepts responsibility for the adequacy or accuracy of this release.
Caution concerning forward-looking information
This press release contains “forward-looking information” and “forward-looking statements” within the meaning of applicable securities laws. This information and statements address future activities, events, plans, developments and projections. All statements, other than statements of historical fact, constitute forward-looking statements or forward-looking information. Such forward-looking information and statements are frequently identified by words such as “may,” “will,” “should,” “anticipate,” “plan,” “expect,” “believe,” “estimate,” “intend” and similar terminology, and reflect assumptions, estimates, opinions and analysis made by management of Grizzly in light of its experience, current conditions, expectations of future developments and other factors which it believes to be reasonable and relevant. Forward-looking information and statements involve known and unknown risks and uncertainties that may cause Grizzly’s actual results, performance and achievements to differ materially from those expressed or implied by the forward-looking information and statements and accordingly, undue reliance should not be placed thereon.
Risks and uncertainties that may cause actual results to vary include but are not limited to the availability of financing; fluctuations in commodity prices; changes to and compliance with applicable laws and regulations, including environmental laws and obtaining requisite permits; political, economic and other risks; as well as other risks and uncertainties which are more fully described in our annual and quarterly Management’s Discussion and Analysis and in other filings made by us with Canadian securities regulatory authorities and available at www.sedar.com. Grizzly disclaims any obligation to update or revise any forward-looking information or statements except as may be required by law.
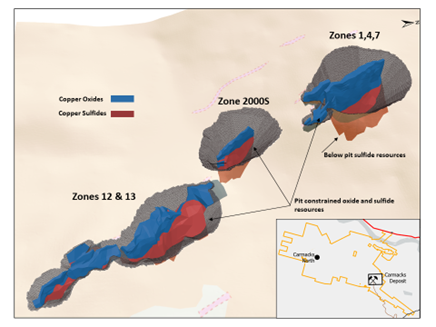
VANCOUVER, BC / ACCESSWIRE / January 17, 2024 / Granite Creek Copper Ltd. (TSXV:GCX)(OTCQB:GCXXF) (“Granite Creek” or the “Company“) is pleased to announce significantly increased recovery of copper from oxide material at its Carmacks Copper-Gold-Silver project (“Carmacks Project” or the “Project“) was achieved through metallurgical studies conducted by Kemetco Research Inc. from (“Kemetco“).
The Company’s 2023 Preliminary Economic Assessment (“2023 PEA”) for the Project identified the opportunity to significantly increase net present value (“NPV”) by improving oxide recovery. Metallurgical testing completed on the project in support of the 2023 PEA showed that while a copper recovery of over 93% could be achieved via a well-established froth flotation technique for sulphide ore, only 39.8% copper recovery from oxide ore was achieved using the same process (see Table 1 for summary of flotation results). The current test results show a total recovery of 88% for oxide material is possible, an increase of 48% over the PEA base case (Tables 1 and 2). These results will have a significant impact on the economics for the project as the PEA identified an additional $180 M of NPV5% value by increasing life of mine average recovery for copper from 64% to 77%. With sulfide recoveries of 93.7% identified in the PEA and combined oxide recoveries (initial flotation + leaching and precipitate) of 88% the potential recoveries for copper are well above the 77% target level highlighted in the 2023 PEA.
The current mine plan as outlined in the 2023 PEA contemplates processing material with a high oxide content of up to 80% oxide ore in the first five years of the mine life. During this time over 8.4 million tonnes of oxide material would be processed versus 2.88 million tonnes of sulphide material. An increase in recovery of oxide material for the first five years of mine life, as demonstrated in these test results, would have a potentially very significant impact on project economics.
Kemetco Research Inc. was retained to complete testing on tailings produced in previous metallurgical work to develop a process for treating material that will have passed through the mill and still have significant oxide copper minerals present (See Figure 1 for simplified flow sheet). This laboratory test program showcased the efficacy of copper recovery from Carmacks copper oxide flotation tailings through a low-concentration acid leach at ambient temperature and pressure followed by chemical precipitation of copper minerals. The precipitation of copper sulphide (“CuS”) from the resulting leachate was shown to be an effective method of fully recovering the leached copper from solution, yielding a very high-grade CuS precipitate that would be added to the copper concentrate further increasing the copper grade of the high-quality concentrates from the project. For reference the PEA estimated an average concentrate grade of 40% copper with significant gold and silver credits.
Figure 1: Simplified Flow Sheet
Results of this testing are outlined below:
Acid leaching was able to extract as much as 80% of the remnant copper present in a composite prepared from Carmacks copper oxide flotation tailings.
Copper in precipitates varied, but in most tests approached the theoretical grade of pure CuS which grades 66.5% Cu. High grades were obtained without pH adjustment.
This testing shows a total copper recovery from oxide material of 88% with Initial Flotation recovery of 39.8% + Leach and Precipitate recovery of 48% (80% of the remnant copper).
Adding Sodium hydrosulphide (“NaHS”) solution resulted in up to 100% precipitation of copper from leach solutions, offering a promising avenue for further refinement. Hydrogen sulphide gas was equally effective as a sulphide source for copper precipitation.
In all tests, the precipitation of CuS resulted in a drop in pH as free acid was regenerated as a by-product of the precipitation reaction, creating the potential to reuse/recycle the regenerated acid.
Table 1 Summary of flotation testing results and average values used in PEA.
Recovery %
Sample
Cu
Au
Ag
Sulphide Sample Flotation1
93.7
69.0
78.4
Oxide Sample Flotation2
39.8
57.5
37.4
Total Oxide Recovery (Initial Flotation + Leach and Precipitate)
88.0
N/A
N/A
PEA LOM Base Case3
64.0
58
60
PEA Target Case4
> 77
58
60
Sulphide flotation testing completed by SGS prior to PEA study see news release dated January 10, 2023.
Oxide flotation testing completed by SGS prior to PEA study see news release dated January 10, 2023.
Calculated LOM average recovery based on a regression curve dependant on oxide content.
Projected PEA target based on achieving a 20% increase in oxide recovery LOM.
Table 2 2023 – PEA Copper Recovery Sensitivity Table
Copper Recovery Sensitivity
PEA BASE
Target1
Pre-Tax NPV (5-10% Discount)
Overall recovery
51%
58%
64%
70%
77%
Sensitivity Range
80%
90%
100%
110%
120%
5%
$136.6M
$231.3M
$324.1M
$416.6M
$509.6M
6%
$122.2M
$209.4M
$269.6M
$383.8M
$471.0M
7%
$107.3M
$189.4M
$271.5M
$353.6M
$453.6M
8%
$93.8M
$171.1M
$248.4M
$325.8M
$403.1M
9%
$81.4M
$154.3M
$227.3M
$300.2M
$373.2M
10%
$70.1M
$139.0M
$207.8M
$276.7M
$345.6M
Based on a recovery of 93.7% for sulphide and 88% for oxide this would exceed the PEA LOM 77% target
About the Carmacks Deposit:
The road accessible Carmacks deposits hosts a NI 43-101 resource consisting of 36.2 Mt M&I, grading 1.07% CuEq 0.81% Cu, 0.31 g/t Au, 3.41 g/t Ag (see news release January 19, 2023). The deposit was the subject of a positive PEA released in January 2023 that envision a 9-year mine life based on a mill capable of processing 7,000 t/d of combined oxide and sulfide ore. The resources are contained within three conceptual open pits and are open for expansion.
Contained Copper in Measured and Indicated Resources
147 Pit 280 Mlbs copper in oxide 126 Mlbs copper in sulfide
2000 Pit 10.5 Mlbs copper in oxide 51.3 Mlbs copper in sulfide
1213 Pit 35.4 Mlbs copper in oxide 122.3 Mlbs copper in sulfide
Tim Johnson, President & CEO stated, “The 2023 PEA, a major milestone for the Company, identified several opportunities for the Project including increased recovery, resource expansion and additional mine and process optimisation. The unlocking of additional value through the improved oxide recovery that this testing represents, especially in the early years of mine life, has the potential to add significantly to the NPV of the project. These results could allow for re-evaluation of resources that didn’t make it into the mine plan due to lower grades or assumed recoveries. The process being developed by the company also has the possibility of being used in other parts of the Minto Copper belt where oxidized or partially oxidized (POX) copper ores have not been processed by other operators.”
Corporate Update
Granite Creek announces the appointment of Susan Henderson as Corporate Secretary. In this role, Ms. Henderson will play a crucial role in overseeing and managing corporate governance matters, ensuring compliance with regulatory requirements, and serving as a key liaison between the company and its stakeholders. She brings her extensive experience in the mining industry, making her well-suited to contribute to Granite Creek’s continued success. The board and executive team are confident in her ability to navigate the complex landscape of corporate governance and provide valuable insights.
Qualified Persons
Mr. Douglas Warkentin, P.Eng., a Qualified Person for the purposes of National Instrument 43-101, has reviewed and approved the technical disclosure related to metallurgical testing contained in this news release. Mr. Warkentin is a Senior Metallurgist with Kemetco Research and an advisor to the Company.
The NI 43-101 technical report entitled CARMACKS PROJECT PRELIMINARY ECONOMIC ASSESMENT (PEA) YUKON, CANADA, referenced in this news release is available on the company’s website as well as on SEDAR under the company’s profile.
2023 PEA: The Company cautions that the results of the PEA are preliminary in nature and do not include the calculation of mineral reserves as defined by NI 43-101. There is no certainty that the results of the PEA will be realized.
About Granite Creek Copper
Granite Creek Copper, a member of the Metallic Group of Companies, is a focused on the exploration and development of critical minerals projects in North America. The Company’s projects consist of its flagship 176 square kilometer Carmacks project in the Minto copper district of Canada’s Yukon Territory on trend with the high-grade Minto copper-gold mine and the advanced stage LS molybdenum project and the Star copper-nickel-PGM project, both located in central British Columbia. More information about Granite Creek Copper can be viewed on the Company’s website at www.gcxcopper.com.
Forward Looking Statements: This news release includes certain statements that may be deemed “forward-looking statements”. All statements in this release, other than statements of historical facts including, without limitation, statements regarding potential mineralization, historic production, estimation of mineral resources, the realization of mineral resource estimates, interpretation of prior exploration and potential exploration results, the timing and success of exploration activities generally, the timing and results of future resource estimates, permitting time lines, metal prices and currency exchange rates, availability of capital, government regulation of exploration operations, environmental risks, reclamation, title, and future plans and objectives of the company are forward-looking statements that involve various risks and uncertainties. Although Granite Creek Copper believes the expectations expressed in such forward-looking statements are based on reasonable assumptions, such statements are not guarantees of future performance and actual results or developments may differ materially from those in the forward-looking statements. Forward-looking statements are based on a number of material factors and assumptions. Factors that could cause actual results to differ materially from those in forward-looking statements include failure to obtain necessary approvals, unsuccessful exploration results, changes in project parameters as plans continue to be refined, results of future resource estimates, future metal prices, availability of capital and financing on acceptable terms, general economic, market or business conditions, risks associated with regulatory changes, defects in title, availability of personnel, materials and equipment on a timely basis, accidents or equipment breakdowns, uninsured risks, delays in receiving government approvals, unanticipated environmental impacts on operations and costs to remedy same, and other exploration or other risks detailed herein and from time to time in the filings made by the companies with securities regulators. Readers are cautioned that mineral resources that are not mineral reserves do not have demonstrated economic viability. Mineral exploration and development of mines is an inherently risky business. Accordingly, the actual events may differ materially from those projected in the forward-looking statements. For more information on Granite Creek Copper and the risks and challenges of their businesses, investors should review their annual filings that are available at www.sedar.com.
Neither the TSX Venture Exchange nor its Regulation Services Provider (as that term is defined in the policies of the TSX Venture Exchange) accepts responsibility for the adequacy or accuracy of this release.
NOT FOR DISTRIBUTION TO THE U.S. NEWSWIRE OR FOR DISSEMINATION IN THE UNITED STATES
Vancouver, British Columbia, Jan. 17, 2024 (GLOBE NEWSWIRE) — Terra Balcanica Resources Corp. (“Terra” or the “Company”) (CSE:TERA; FRA:UB1) is pleased to announce additional assay results from the 2023 Phase II drill campaign confirming continuation of the high-grade Cumavici Ridge polymetallic mineralization within its flagship Viogor-Zanik project in Bosnia and Herzegovina. The Company further announces closing of the final tranche of its non-brokered private placement financing (the “Offering”) of shares (the ”Shares”) for total gross proceeds of $212,200.
Highlights
Drillhole CMV23002b intersected 499 g/t AgEq over 3.8 m from 22 m downhole with a further mineralized interval of 227 g/t AgEq over 2.0 m from 31 m (Table 1);
Drillhole collar for CMV23002b is located 39 m northeast of previously reported CMV23003 and 004 and 38 m SE of 2022 drillhole CMVDD001 which returned:
CMVDD001 – 824 g/t AgEq over 4 m (see company news release dated 8th September, 2022);
CMV23003 – 457 g/t AgEq over 4.15 m;
CMV23004 – 1168 g/t AgEq over 1.35 m;
The mineralization remains open immediately northwest and down-dip to the southwest;
Terra Balcanica CEO, Dr. Aleksandar Mišković, comments: “We are delighted to continue reporting impressive silver grades from the central Cumavici Ridge system. This polymetallic, near-surface target keeps on delivering and is open along strike and down-dip. Cumavici Ridge is only one of five target zones along the 7.2 km NW-SE trending fault-hosted system that remains to be drilled, thus offering upside to advance a deposit immediately adjacent to the existing Sase Pb-Zn-Ag mine with infrastructure including mining and processing facilities. We are excited to continue advancing Viogor-Zanik’s full potential as a unique critical raw minerals land package right at Europe’s doorsteps. Additional assay results will continue to be released very shortly.”
Hole ID
From (m)
To (m)
Length (m)
Ag (g/t)
Au (g/t)
Pb (%)
Sb (%)
Zn (%)
AgEq (g/t)
CMV23002b
22.00
25.80
3.80
125
0.70
2.72
0.48
5.53
499
CMV23002b
31.00
33.00
2.00
166
0.57
0.11
0.12
0.21
227
Table 1.Assay results from drillhole CMV23002b of the Phase II drilling campaign. Interval lengths reported are drilled lengths, not true widths. Silver equivalents (“AgEq”) are based on assumed metal prices of US$1,980/oz for gold (Au), US$23/oz for silver (Ag), US$1.15/lb for zinc (Zn), US$5.42/lb for antimony (Sb) and US$1.00/lb for lead (Pb). Assumed metal recoveries of 90% Au, 93% Ag, 95% Sb, 94% Pb and Zn are based on published metallurgical tests on analogous intermediate sulphidation epithermal vein deposits.
Figure 1. Geological map illustrating the drillholes at the Cumavici Ridge locality. AgEq values are labelled for selected 2022 and 2023 drill intercepts (See Company’s new releases dated 13 November 2023, 27 February 2023). Current drilling efforts confirm mineralization over 82 m NW/SE strike length. (WGS84/UTM Zone 34N (click here to view image).
Hole ID
Easting
Northing
Elevation (m)
Dip
Azimuth
Depth (m)
Recovery (%)
CMV23002b
360224.6
4888498.1
594.58
-50
050
56.2
99
Table 2.Collar locations for reported Phase II drillhole. Coordinates and elevation were taken by local consultant surveyors using a differential GPS unit. (WGS84/UTM Zone 34N).
Future Exploration Program Further drilling efforts at Cumavici Ridge will aim to connect the shallow high-grade interval reported in this release to the 531 g/t AgEq over 0.75 m and 355 g/t AgEq over 1.10 m reported over 600 m to the northwest (see Company news release dated 5th November 2023). The system remains untested and open to the southwest down-dip which will also be targeted in 2024 drilling.
Figure 2. Drillhole section through step out drill fence located 42 m SE of the 2022 discovery holes at Cumavici Ridge. Assay interval reported for CMV23002b (click here to view image).
QAQC Half core (PQ3 and HQ3) samples were delivered by truck to ALS Bor, Serbia for sample preparation and analysis at the ALS laboratory Loughrea, Ireland an ISO/IEC 17025:2017 certified testing laboratory. Sample preparation PREP-31BY method was used on all core samples. This involves crushing to 70% less than 2 mm, rotary split 1kg and pulverizing the split to greater than 85% passing 75 microns. Gold was assayed by 30g fire assay with ICP-AES finish (Au-ICP21). Analyses of silver and base metals were completed by highly oxidising digestion with HNO3, KClO3 and HBr (ASY-ORE) and the final solution in dilute aqua regia is determined by ICP-AES (ME-ICPORE). Control samples, comprising certified reference materials (CDN-ME-1811), quarter core field duplicates and blanks were inserted at a rate of 9% and investigated as part of the company’s quality assurance and quality control program.
Final Tranche of Private Placement Financing Closed The Company issued an additional aggregate of 1,200,000 Shares at a price of $0.04 per Share for gross proceeds of $48,000 pursuant to the Offering announced on December 1st, 2023.
In total, the Company has issued 5,305,000 Shares at a price of $0.04 for gross proceeds of $212,200. Terra will use the net proceeds of the Offering for working capital and to finance the acquisition of a strategic mineral exploration licence in Bosnia and Herzegovina. Pursuant to applicable Canadian securities laws, all securities issued and issuable in connection with the closing of the final tranche of the Private Placement will be subject to a four (4) month hold period ending May 17th, 2024. There were no finders’ fees paid in any of the tranches of the Offering.
This news release does not constitute an offer to sell or a solicitation of an offer to sell any of the securities in the United States. The securities have not been and will not be registered under the United States Securities Act of 1933, as amended (the “U.S. Securities Act”) or any state securities laws, and may not be offered or sold within the United States, or to or for the account or benefit of any U.S. person or any person in the United States, unless registered under the U.S. Securities Act and applicable state securities laws or an exemption from such registration is available. “United States” and “U.S. Person” are as defined in Regulation S under the U.S. Securities Act.
Qualified Person Dr. Aleksandar Mišković, P.Geo, is the Company’s designated Qualified Person for this news release within the meaning of National Instrument 43-101 Standards of Disclosure of Mineral Projects (“NI 43-101”) and has reviewed and validated that the information contained in this news release as accurate.
About the Company Terra Balcanica is a polymetallic exploration company targeting large-scale mineral systems in the Balkans of southeastern Europe. The Company has 90% interest in the Viogor-Zanik Project in eastern Bosnia and Herzegovina, 100% of the Kaludra and Ceovishte mineral exploration licences in southern Serbia. The Company emphasizes responsible engagement with local communities and stakeholders. It is committed to proactively implementing Good International Industry Practice (GIIP) and sustainable health, safety, and environmental management.
ON BEHALF OF THE BOARD OF DIRECTORS
Terra Balcanica Resources Corp. “Aleksandar Mišković”
This news release contains certain forward-looking information and forward-looking statements within the meaning of applicable securities legislation (collectively “forward-looking statements”). The use of any of the words “will”, “intends” and similar expressions are intended to identify forward-looking statements. These statements involve known and unknown risks, uncertainties and other factors that may cause actual results or events to differ materially from those anticipated in such forward-looking statements. Such forward-looking statements should not be unduly relied upon. Actual results achieved may vary from the information provided herein as a result of numerous known and unknown risks and uncertainties and other factors. The Company believes the expectations reflected in those forward-looking statements are reasonable, but no assurance can be given that these expectations will prove to be correct. The Company does not undertake to update these forward-looking statements, except as required by law.
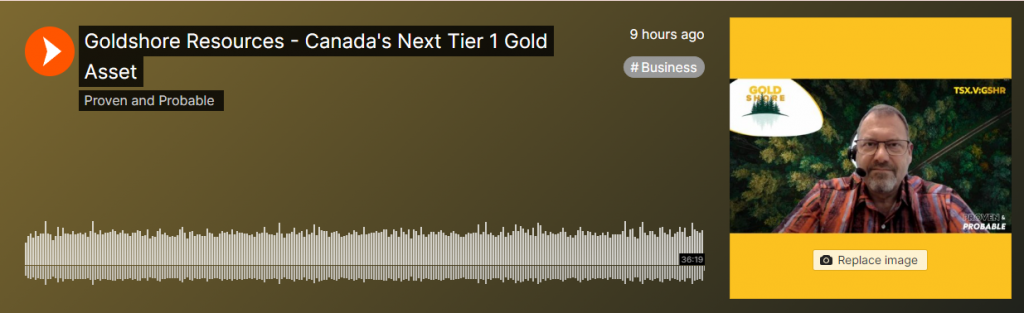
Must watch interview with a serial wealth builder sharing his valuable insights into the gold exploration stocks and how you may profit. Learn how to appraise gold exploration and mining companies. Joining us for a conversation is Brett Richards of Goldshore Resources, which is on a journey to become Canada’s next Tier 1 Gold Asset. In this interview will cover a number of fundamental aspects about speculation in the gold exploration companies, 5 key criteria that all speculators should know before buy a resource stock. We will cover the cost basis for gold 43-101 Mineral Resource categories for inferred, indicated, measured resources, along with proven, and probable reserves.
After a comprehensive review of the aforementioned we discuss the unique investment proposition for Goldshore Resources, which hosts the 6,000,000 Oz. (Inferred) Moss Lake Gold Project, along with catalyst for 2024.
Timestamp: :17 Gold price and disconnect with gold mining and gold exploration stocks 4:30 Have we reached capitulation 5:25 5 Key Criteria for Natural Resource Speculators 9:28 Gold Grades and Cost Per Oz. for Inferred, Indicated, Measured, Proven and Probable 11:26 Investment Proposition for GoldShore Resources 13:12 Let’s go on-site 19:17 Updated MRE 21:13 Summary: 23:17 Next Unanswered Question 27:14 Capital Structure 28:55 Stock took a hit 30:40 Why you don’t sell because the stock price drops 31:47 What keeps you up at night 33:40 What did I forget to ask
Goldshore is an emerging junior gold development company, and owns the Moss Gold Project located in Ontario. Wesdome Gold Mines Ltd. is currently a large shareholder of Goldshore. Supported by an industry-leading management group, board of directors and advisory board, Goldshore is positioned to advance the Moss Gold Project through the next stages of exploration and development.
Vancouver, British Columbia–(Newsfile Corp. – January 16, 2024) – Dolly Varden Silver Corporation (TSXV: DV) (OTCQX: DOLLF) (the “Company” or “Dolly Varden“) is pleased to announce drill results from its 2023 program at the Homestake Silver deposit in BC’s Golden Triangle. The 23 drillholes reported total 12,150m of drilling targeting priority zones within the deposit and have significantly expanded the width and extent of the reinterpreted high-grade silver and gold mineralized plunge.
Highlights from Homestake Silver (intervals shown are core length**):
HR23-419: Mineralized envelope: 315 g/t AgEq (2.57 g/t Au and 102 g/t Ag) over 79.20 meters, including internal breccia vein intervals grading 1,508 g/t AgEq (9.53 g/t Au and 718 g/t Ag) over 9.22 meters length, 7,572 g/t AgEq (36.66 g/t Au and 4,533 g/t Ag) over 1.05 meters.
HR23-416 Mineralized envelope: 357 g/t AgEq (1.74 g/t Au, 213 g/t Ag) over 93.95 meters length, including internal breccia vein intervals grading 2,802 g/t AgEq (11.80 g/t Au and 1,824 g/t Ag) over 9.16 meters length, 4,176 g/t AgEq (13.16 g/t Au and 3,085 g/t Ag) over 2.26 meters and 9,422 g/t AgEq (55.40 g/t Au and 4,830 g/t Ag) over 1.02 meters.
HR23-415: Mineralized envelope: 630 g/t AgEq (5.11 g/t Au and 206 g/t Ag) over 22.80 meters, including internal breccia vein intervals grading 1,754 g/t AgEq (14.38 g/t Au and 562 g/t Ag) over 6.80 meters length, 4,617 g/t AgEq (43.40 g/t Au and 1,020 g/t Ag) over 0.88 meters.
HR23-413: Mineralized envelope: 226 g/t AgEq (1.40 g/t Au and 110 g/t Ag) over 40.00 meters, including internal breccia vein intervals grading 668 g/t AgEq (3.05 g/t Au and 415 g/t Ag) over 3.96 meters, 1,998 g/t AgEq (6.49 g/t Au and 1,460 g/t Ag) over 0.63 meters.
HR23-407: Mineralized envelope: 246 g/t AgEq (2.32 g/t Au and 54 g/t Ag) over 55.90 meters length, including internal breccia vein intervals grading 932 g/t AgEq (8.94 g/t Au and 191 g/t Ag) over 10.72 meters length, 2,149 g/t AgEq (24.38 g/t Au and 129 g/t Ag) over 0.57 meters and 1,883 g/t AgEq (17.78 g/t Au and 410 g/t Ag) over 2.20 meters.
HR23-411: Expansion step out hole to the southeast; 445 g/t AgEq (0.91 g/t Au and 369 g/t Ag) over 10.55 meters including 2,068 g/t AgEq (1.73 g/t Au and 1,925 g/t Ag) over 0.55 meters.
*AuEq and AgEq are calculated using only the two precious metal components at $US1650/oz Au, $US20/oz Ag, Assays are not capped
**Estimated true widths vary depending on intersection angles and range from 65% to 85% of core lengths, further modelling of the new interpretation is needed before true widths can be calculated
“The 2023 drilling at Homestake Silver has identified a substantial zone of exceptional precious metal grades, often typified by multiple phases of silver and gold mineralization, over wide, continuous intervals that are potentially amendable to bulk underground mining methods,” said Shawn Khunkhun, CEO of Dolly Varden Silver. “Results from additional step-out holes to the north of these intercepts are being finalized and are expected to be announced shortly.”
“Applying what was learned from the structural reinterpretation work at the Homestake Main gold zone to the existing wider spaced drilling at Homestake Silver Zone has led to the discovery of high-grade pathways within a continuous mineralized envelope with average precious metal grades above the average resource grades and over much wider intervals than expected,” states Rob Van Egmond, P.Geo, Vice President of Exploration.
Figure 1. Location along Dolly Varden’s Kitsault Valley trend of Deposits
Drill holes HR23-416 and HR23-419 have a down dip spacing of 105 meters on the same vertical cross-section. The holes were up and down dip, respectively, from historic drill hole HR09-161 which graded 352 AgEq (2.89 g/t Au and 112 g/t Ag) over 72.75 meters over the width of the mineralized envelope (see figure 2 section). Drillholes HR23-413 and HR23-415 are located on section 25m to the north-northwest and HR23-407 is 100m along strike from HR23-416/419.
Drillholes HR23-396 and 397 were drilled up dip of the wide, higher-grade plunge intersecting individual higher-grade vein breccias extending above the mineralized envelope.
Drilling targeted the high-grade plunge within the Homestake Silver deposit. These holes focused on defining and expanding the wide gold and silver (+/- lead and zinc) mineralized zone along the low angle, northerly plunge of the high-grade mineralization. The reinterpretation concluded that the wider mineralization zone at Homestake Silver is at a similar plunge orientation as that of the Homestake Main deposit, located 300m to the northwest. The average grades are higher, on a precious metal silver equivalent basis, than the average grade of the silver deposits at the Dolly Varden property to the south due to the increased gold content at the Homestake Ridge deposits.
Figure 2. Drill hole HR23-416 from the Homestake Silver deposit. A 12.60-meter section from the 93.95-meter mineralized envelope highlighting the 1.02-meter high-grade multi-pulse vein breccia pathway. Strong alteration and stockwork with local multi-pulse vein and vein breccias can be seen throughout the interval.
Drill hole HR23-411 is a 50m step out (down dip) from the southeastern end of Homestake Silver showing that the gold and silver mineralization remains open in that direction. Drill hole HR23-414 was drilled in the unmineralized footwall to Homestake Silver.
Finalized results remain to be released for 47 of the 115 drill hole, 51,454.90 meter, 2023 Kitsault Valley Project exploration drill program. These include 25 drill holes at Homestake Main (11,054.90m), 4 drill holes (2,478.00m) from Homestake Silver northern extension and 6 drill holes (1,627m) from Homestake Ridge property exploration drill holes. Plus 12 drill holes (7,400m) from the southern Dolly Varden property.
Figure 3. Homestake Silver Long section looking southwest with 2023 drill hole highlights. 100m wide window.
The Homestake Ridge deposits are interpreted as structurally controlled, multi-phase epithermal vein stockwork and vein breccia system hosted in Jurassic aged Hazelton volcanic rocks. Mineralization consists of pyrite, +/-galena and sphalerite in a breccia matrix within a silica breccia vein system (see Figure 2). The northwest orientation of the main Homestake structural trend appears to have numerous subparallel internal structures that are interpreted to form the controls for higher grade gold and silver shoots within a broader Mineralized envelope at the Homestake Silver deposit. The main structural corridor dips steeply to the northeast at Homestake Main and rolls to vertical or steeply southwest at Homestake Silver (see Figure 5).
Figure 4. Homestake Silver Plan View with Current Mineral Resource block model, primarily of Inferred resource classification with 2023 drill collar locations highlighted.
Table 1. Completed Drill Hole Assays from the Homestake Silver Deposit Area
Hole ID
From (m)
To (m)
Length (m)
Au (g/t)
Ag (g/t)
AuEq* (g/t)
AgEq* (g/t)
HR23-419
306.40
385.60
79.20
2.57
102
3.80
315
including
313.43
322.65
9.22
9.53
718
18.19
1508
including
320.00
321.00
1.00
33.05
184
35.26
2923
including
321.60
322.65
1.05
36.66
4533
91.34
7572
including
325.74
326.84
1.10
20.90
121
22.36
1853
including
328.95
329.55
0.60
29.30
302
32.94
2731
including
367.39
368.55
1.16
21.60
36
22.03
1826
HR23-418
NSV
NSV
HR23-416
204.05
298.00
93.95
1.74
213
4.30
357
including
214.13
215.13
1.00
2.77
519
9.03
748
including
230.64
239.80
9.16
11.80
1824
33.80
2802
including
231.32
231.89
0.57
5.75
4290
57.50
4767
including
234.04
236.30
2.26
13.16
3085
50.38
4176
including
238.78
239.80
1.02
55.40
4830
113.67
9422
including
283.00
284.50
1.50
8.37
207
10.87
901
and
320.00
343.00
23.00
1.13
46
1.68
139
including
329.00
331.00
2.00
3.58
281
6.97
578
including
339.00
343.00
4.00
3.78
82
4.77
395
HR23-415
305.90
328.70
22.80
5.11
206
7.59
630
including
313.40
314.40
1.00
2.74
453
8.21
680
including
318.40
325.20
6.80
14.38
562
21.16
1754
including
319.42
320.30
0.88
43.40
1020
55.71
4617
and
336.75
393.50
56.75
1.22
32
1.61
133
including
338.75
346.60
7.85
3.13
149
4.93
409
including
382.80
384.15
1.35
4.10
114
5.48
454
HR23-414
NSV
NSV
HR23-413
230.00
244.00
14.00
3.96
15
4.15
344
including
237.00
238.00
1.00
47.30
40
47.79
3961
and
263.00
303.00
40.00
1.40
110
2.72
226
including
264.55
265.60
1.05
4.32
479
10.10
837
including
271.85
275.81
3.96
3.05
415
8.05
668
including
271.85
272.48
0.63
6.49
1460
24.10
1998
including
278.57
280.74
2.17
8.43
622
15.93
1321
including
279.79
280.74
0.95
13.60
966
25.25
2093
HR23-412
165.95
166.45
0.50
0.66
401
5.49
455
including
280.38
281.85
1.47
0.29
177
2.43
201
and
293.30
304.00
10.70
0.95
238
3.82
316
including
298.00
302.00
4.00
1.79
538
8.28
686
including
299.35
300.00
0.65
2.71
1245
17.73
1470
Table 1. con’t. Completed Drill Hole Assays from the Homestake Silver Deposit Area
Hole ID
From (m)
To (m)
Length (m)
Au (g/t)
Ag (g/t)
AuEq* (g/t)
AgEq* (g/t)
HR23-411
464.65
475.20
10.55
0.91
369
5.37
445
including
469.95
474.20
4.25
1.41
801
11.07
918
including
470.45
471.00
0.55
1.73
1925
24.95
2068
including
473.20
474.20
1.00
1.59
1120
15.10
1252
HR23-410
Results Pending
HR23-409
457.69
466.20
8.51
1.80
21
2.05
170
including
457.69
458.22
0.53
2.19
162
4.14
344
HR23-408
100.00
102.10
2.10
NSV
478
5.77
479
and
168.50
169.36
0.86
0.88
123
2.36
196
and
211.10
212.40
1.30
NSV
622
7.51
622
including
279.85
280.33
0.48
3.21
27
3.53
293
HR23-407
317.90
338.00
20.10
1.96
3
2.00
165
including
328.76
330.00
1.24
23.80
13
23.96
1986
and
346.10
402.00
55.90
2.32
54
2.97
246
including
354.88
365.60
10.72
8.94
191
11.24
932
including
354.88
355.45
0.57
24.38
129
25.93
2149
including
356.90
357.40
0.50
18.80
481
24.60
2039
including
360.55
361.87
1.32
8.71
382
13.31
1103
including
363.40
365.60
2.20
17.78
410
22.72
1883
HR23-406
NSV
NSV
HR23-405
394.00
433.23
39.23
1.78
NSV
1.78
148
including
402.65
414.00
11.35
3.20
NSV
3.20
265
including
417.00
423.25
6.25
2.48
NSV
2.48
206
HR23-404
614.25
651.60
37.35
0.58
2
0.60
50
HR23-403
287.50
395.00
107.50
1.46
16
1.65
137
including
288.00
288.50
0.50
24.30
659
32.25
2673
including
342.00
346.00
4.00
12.37
143
14.09
1168
including
342.00
344.00
2.00
22.26
248
25.25
2093
including
371.00
372.00
1.00
11.55
7
11.64
965
HR23-402
613.78
652.00
38.22
1.81
2
1.84
152
including
613.78
617.66
3.88
7.05
5
7.11
589
including
614.85
615.85
1.00
12.80
4
12.85
1065
HR23-401
538.00
539.40
1.40
0.04
180
2.22
184
HR23-400
352.82
354.00
1.18
0.36
471
6.04
501
and
534.07
576.00
41.93
1.24
2
1.27
105
including
543.00
550.00
7.00
2.47
4
2.52
209
HR23-399
Results Pending
HR23-398
536.75
567.00
30.25
1.31
3
1.34
111
including
544.00
545.30
1.30
5.20
2
5.22
433
Table 1. con’t. Completed Drill Hole Assays from the Homestake Silver Deposit Area
Hole ID
From (m)
To (m)
Length (m)
Au (g/t)
Ag (g/t)
AuEq* (g/t)
AgEq* (g/t)
and
576.79
577.95
1.16
4.15
7
4.23
351
HR23-397
210.50
253.69
43.19
0.45
62
1.21
100
including
228.65
229.59
0.94
2.16
326
6.09
505
HR23-396
187.38
227.25
39.87
0.53
61
1.26
104
including
213.57
214.07
0.50
2.76
668
10.82
897
and
250.00
250.50
0.50
0.20
744
9.17
760
HR23-395
341.65
342.15
0.50
2.19
1715
22.88
1897
and
382.30
403.92
21.62
2.57
2
2.60
215
including
386.00
387.12
1.12
12.00
10
12.13
1005
including
396.87
401.50
4.63
6.40
4
6.45
534
including
396.87
398.40
1.53
10.45
6
10.53
873
HR23-394
Results Pending
HR23-393
560.70
562.75
2.05
NSV
364
4.44
368
HR23-389
Results Pending
*AuEq and AgEq are calculated using two precious metal components at $US1650/oz Au, $US20/oz Ag. Assays are not capped. No Significant Values (NSV)
**Estimated true widths vary depending on intersection angles and range from 50% to 90% of core lengths
Table 2. Drill Hole Collar Data for 2023 Homestake Silver Deposit Drilling Reported
Hole ID
Easting UTM83 (m)
Northing UTM83 (m)
Elevation (m)
Azimuth
Dip
Length (m)
HR23-393
464252
6178460
703
235
-51
855.00
HR23-395
463581
6179029
834
225
-48
516.00
HR23-396
463642
6178780
857
235
-45
300.00
HR23-397
463642
6178780
857
230
-50
300.00
HR23-398
463581
6179029
834
225
-55
600.00
HR23-400
463607
6178909
841
223
-60
612.00
HR23-401
464118
6178529
720
230
-50
696.00
HR23-402
463714
6179021
798
220
-50
681.00
HR23-403
463607
6178909
841
230
-50
516.00
HR23-404
463714
6179021
798
23
-50
654.00
HR23-405
463607
6178909
841
235
-54
522.00
HR23-406
464017
6178679
738
223
-50
642.00
HR23-407
463677
6178837
828
223
-50
441.00
HR23-408
463737
6178684
819
223
-45
402.00
HR23-409
463677
6178837
828
223
-60
575.00
HR23-411
463947
6178487
748
235
-50
588.00
HR23-412
463737
6178684
819
223
-60
475.00
HR23-413
463690
6178787
827
223
-46
399.00
HR23-414
463631
6179194
814
225
-53
501.00
HR23-415
463690
6178787
827
223
-54
449.00
HR23-416
463693
6178746
833
223
-50
383.00
HR23-418
463352
6178808
997.35
275
-52
585.00
HR23-419
463693
6178746
833
223
-60
458.00
Quality Assurance and Quality Control
The Company adheres to CIM Best Practices Guidelines for exploration related activities conducted on its property. Quality Assurance and Quality Control (QA/QC) procedures are overseen by the Qualified Person.
Dolly Varden QA/QC protocols are maintained through the insertion of certified reference material (standards), blanks and field duplicates within the sample stream. Drill core is cut in-half with a diamond saw, with one-half placed in sealed bags and shipped to the laboratory and the other half retained on site. Third party laboratory checks on 5% of the samples are carried out as well. Chain of custody is maintained from the drill to the submittal into the laboratory preparation facility.
Analytical testing was performed by ALS Canada Ltd. in North Vancouver, British Columbia. The entire sample is crushed to 70% minus 2mm (10 mesh), of which a 500 gram split is pulverized to minus 200 mesh. Multi-element analyses were determined by Inductively Coupled Plasma Mass Spectrometry (ICP-MS) for 48 elements following a 4-acid digestion process. High grade silver testing was determined by Fire Assay with either an atomic absorption, or a gravimetric finish, depending on grade range. Au is also determined by fire assay on a 30g split with either atomic absorption, or gravimetric finish, depending on grade range. Metallic screen assays may be completed on very high grade samples.
Qualified Person
Rob van Egmond, P.Geo., Vice-President Exploration for Dolly Varden Silver, the “Qualified Person” as defined by NI43-101 has reviewed, validated and approved the scientific and technical information contained in this news release and supervises the ongoing exploration program at the Dolly Varden Project.
Dolly Varden Announces New Investor Relations Services Providers
The Company has entered into an agreement with Triomphe Holdings Ltd. (dba Capital Analytica) (“Capital Analytica”) for investor relations and communication services (the “Consulting Agreement”). The Consulting Agreement has an initial term of six months, commencing January 1 , 2024 under which the Company will pay to Capital Analytica an aggregate of $120,000 at a rate of $20,000 per month, and has an option to renew the Consulting Agreement for an additional 6 months at a rate of $10,000 per month, unless terminated earlier in accordance with the Consulting Agreement.
Pursuant to the terms of the Consulting Agreement, Capital Analytica will provide ongoing capital markets consultation, ongoing social media consultation regarding engagement and enhancement, social sentiment reporting, social engagement reporting, discussion forum monitoring and reporting, corporate video dissemination, and other related investor relations services.
Capital Analytica is a Nanaimo based company owned and operated by Jeff French who is arm’s length to the Company and holds no securities, directly or indirectly of the Company.
The Company is also pleased to announce the engagement of Zoppa Media Group to provide additional investor relations services beginning effective January 12, 2024. Dolly Varden has entered into a consulting agreement with Zoppa Media Group (the “Services Agreement”), pursuant to which Zoppa Media Group will provide certain investor relations services including investor outreach and management of the Company’s social media accounts in order to increase awareness regarding Dolly Varden. Pursuant to the Services Agreement, the Zoppa Media Group will provide such services on a month-to-month basis for a renewable one year term for a fee of $10,000 per month.
Zoppa Media Group is a Vancouver based company, owned by Diana Zoppa. Diana Zoppa has previously served Dolly Varden in an executive assistant role prior to gaining investor relations experience with a number of publicly trading companies. The Zoppa Media Group and Diana Zoppa hold 25,200 common shares of the Company.
About Dolly Varden Silver Corporation
Dolly Varden Silver Corporation is a mineral exploration company focused on advancing its 100% held Kitsault Valley Project (which combines the Dolly Varden Project and the Homestake Ridge Project) located in the Golden Triangle of British Columbia, Canada, 25kms by road to tide water. The 163 sq. km. project hosts the high-grade silver and gold resources of Dolly Varden and Homestake Ridge along with the past producing Dolly Varden and Torbrit silver mines. It is considered to be prospective for hosting further precious metal deposits, being on the same structural and stratigraphic belts that host numerous other, on-trend, high-grade deposits, such as Eskay Creek and Brucejack. The Kitsault Valley Project also contains the Big Bulk property which is prospective for porphyry and skarn style copper and gold mineralization, similar to other such deposits in the region (Red Mountain, KSM, Red Chris).
Forward-Looking Statements
This release may contain forward-looking statements or forward-looking information under applicable Canadian securities legislation that may not be based on historical fact, including, without limitation, statements containing the words “believe”, “may”, “plan”, “will”, “estimate”, “continue”, “anticipate”, “intend”, “expect”, “potential”, and similar expressions. Forward-looking statements involve known and unknown risks, uncertainties, and other factors which may cause the actual results, performance, or achievements of Dolly Varden to be materially different from any future results, performance, or achievements expressed or implied by the forward-looking statements. Forward-looking statements or information in this release relates to, among other things, the 2022 drill program at the Kitsault Valley Project, the results of previous field work and programs and the continued operations of the current exploration program, interpretation of the nature of the mineralization at the project and that that the mineralization on the project is similar to Eskay and Brucejack, results of the mineral resource estimate on the project, the potential to grow the project, the potential to expand the mineralization and our beliefs about the unexplored portion of the property.
These forward-looking statements are based on management’s current expectations and beliefs and assume, among other things, the ability of the Company to successfully pursue its current development plans, that future sources of funding will be available to the company, that relevant commodity prices will remain at levels that are economically viable for the Company and that the Company will receive relevant permits in a timely manner in order to enable its operations, but given the uncertainties, assumptions and risks, readers are cautioned not to place undue reliance on such forward-looking statements or information. The Company disclaims any obligation to update, or to publicly announce, any such statements, events or developments except as required by law.
For additional information on risks and uncertainties, see the Company’s most recently filed annual management discussion & analysis (“MD&A“) and management information circular dated January 21, 2022 (the “Circular“), both of which are available on SEDAR at www.sedar.com. The risk factors identified in the MD&A and the Circular are not intended to represent a complete list of factors that could affect the Company.
Neither the TSX Venture Exchange nor its Regulation Services Provider (as that term is defined in the policies of the TSX-V) accepts responsibility for the adequacy or accuracy of this news release.
We offer herein an investment rationale for gold mining equities that rests primarily on investment fundamentals particular to the mining sector. Speculation on the future course of the gold price takes a back seat. A tailwind from higher metal prices would, of course, be helpful but in our view would only add heft to an already powerful investment case.
1. Extreme Undervaluation
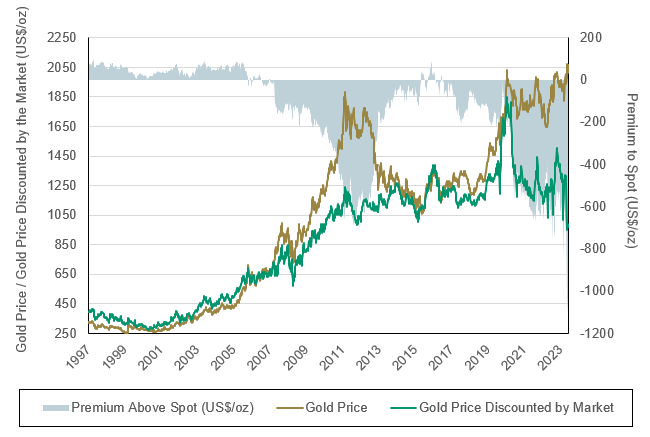
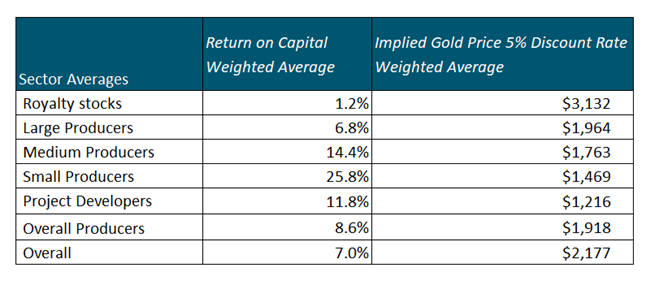
Gold mining stock valuations are the lowest in 25 years. The spread between the gold price and the discount implied to spot based on the market price of the equities is a massive $700+ per ounce. In other words, cash flow from a gold price 65% of the current spot price would return the entire market value of the group based on existing reserves. BMO calculates an average return on capital of 14.4% for mid-capitalization producers and 25.8% for small-cap producers in a semi-liquidation scenario (see Figure A2). We believe investment returns would be substantially greater in a full liquidation scenario, which would assume the elimination of all discretionary capital spending. In essence, the theoretical returns from taking many of the mid- and small-cap producers private would be compelling from the perspective of a corporate raider. The “corporate raider” perspective is of course only a notional concept to illustrate the extreme undervaluation of the sector. The risk typically associated with extreme undervaluation is the amount of time required for the investment thesis to prove out, not loss of capital.
Figure A1. Gold Price Discounted by the Market @ 0% Discount Rate
Source: BMO Capital Markets. Data as of 12/31/2023. Included for illustrative purposes only. Past performance is no guarantee of future results.
Figure A2. Return on Capital for Gold Miners
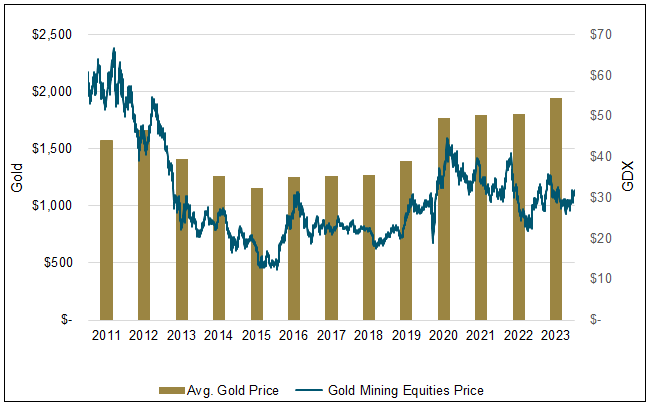
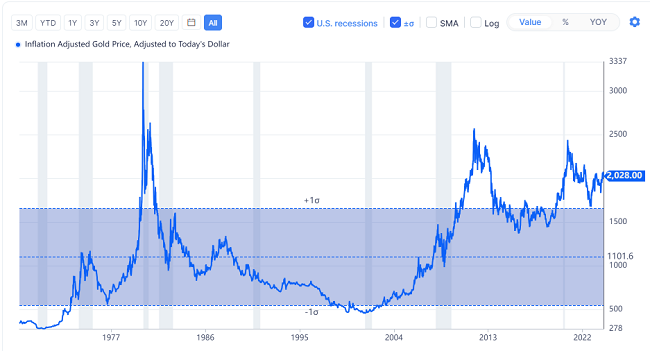
2. Divergence from Gold Price
The average annual gold price has increased over 20% since 2011. The gold price is the single most important fundamental driver of earnings and returns on capital. However, gold stocks have declined over 40% (based on GDX1) since 2011. We have enumerated several reasons for this 60% performance divergence in an earlier commentary, Gold vs. Gold Stocks, An Unresolved Incongruity. In our view, those factors have been excessively discounted. In our opinion, there is near-term potential for a substantial mean reversion trade even assuming no further rise in the gold price.
Figure B. Gold Mining Equities vs. Average Gold Price2
Source: BMO Capital Markets. Data as of 12/31/2023. Included for illustrative purposes only. Past performance is no guarantee of future results.
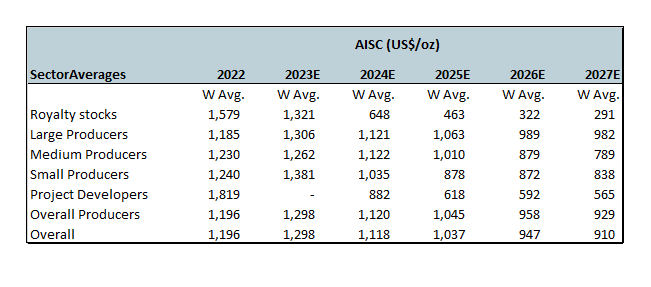
3. 2024 Profitability Set for Sharp Improvement
Profit margins will improve even in a flat gold price environment. Inflation has started to cool off thanks to the Federal Reserve’s (Fed’s) tight money campaign. More importantly, this capital-intensive industry has made significant advances in productivity that will drive margin expansion. BMO Research forecasts a decline in production costs (All In Sustaining Costs or AISC) of 14%, 11% and 25% for large-, mid- and small-cap producers, respectively. These projections are based on BMO’s “bottoms up” analysis of each company’s 2024 outlook. The improvement can be explained by general cost deflation, across-the-board productivity advances and, for smaller producers, the normal post-start-up improvement in recently completed mine construction.
Figure C. Gold Miners: All In Sustaining Costs Estimates
Source: BMO Capital Markets, Bloomberg, FactSet. Included for illustrative purposes only. Past performance is no guarantee of future results.
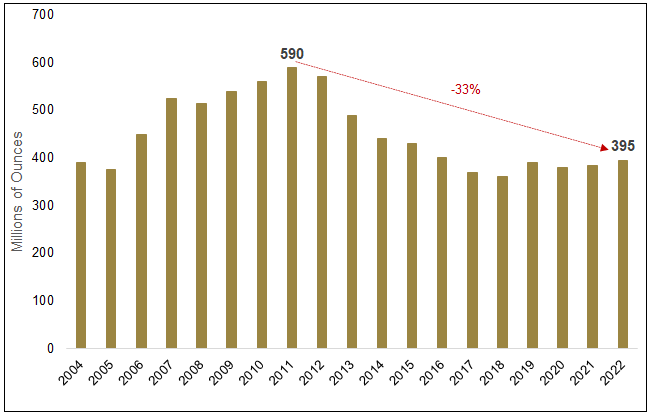
4. Chronic Underinvestment Sets Up Potential Demand/Supply Squeeze
According to Bloomberg, the reserve life of the top 10 miners has declined 33% in the last 10 years. As noted in #1 above, the gold mining industry is in a quasi-liquidation mode.
Figure D. Gold Reserves by the Top 10 Miners
Source: Bloomberg. Data as of 12/31/2022. Included for illustrative purposes only. Past performance is no guarantee of future results.
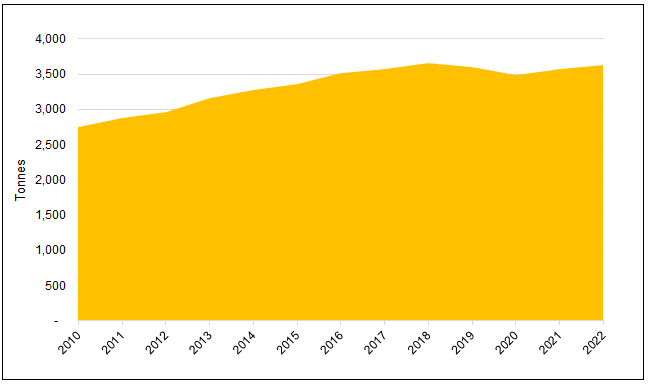
5. Understatement of Book Value
According to anecdotal inputs from industry management, the replacement cost of existing capacity is substantially above (50% or more) stated book value. That observation suggests a consistent metal price range of $2,500 to $3,000 would be necessary to sustain the current annual mine production of 3,500 metric tonnes. The response of production to higher gold prices has been non-existent, with little rise since 2018.
Figure E. Annual Gold Mine Production Has Been Relatively Flat
Source: World Gold Council. Data as of 12/31/2022. Included for illustrative purposes only. Past performance is no guarantee of future results.
6. Classic Contrarian Setup
Gold mining equities represent a classic contrarian setup, especially if gold prices continue their steady historic rate of increase. GDX (passive) and active managers have experienced minimal inflows in recent years. In fact, GDX has seen outflows of nearly 17% over the past five years. Peak assets under management for GDX were $18.4 billion in 2020, versus $13 billion at the end of 2023. The market cap of the entire gold mining sector is ~$300 billion, less than the market caps of individual companies like The Home Depot, Costco and Mastercard.
7. Fed Pivots Precede Outsized Performance
Every Fed pivot has been followed by outsized gains in gold mining equities. GDX gains:
Period 5/00-1/08: 400%
Period 1/16-8/16: 238%
Period 3/20-7/20: 208%
The current Fed pivot, telegraphed at the December Federal Open Market Committee (FOMC) meeting, appears related to pressure from U.S. Treasury Secretary Yellen (and the Biden administration) due to election-year politics. In a December 12, 2023, interview, just ahead of the December FOMC meeting, Treasury Secretary Yellen stated, “Of course, as inflation comes down, other things equal, real interest rates tend to rise, which causes a tightening of monetary policy in a sense. So that’s one factor that could weigh in a decision that the Fed makes about the path of interest rates.”
A subtle hint, to be sure, but there is no doubt that the administration views current Fed policy as too restrictive. Could the subsequent Fed pivot amount to a premature declaration of victory over inflation? We must wait and see, but wage settlements, a major component of manufacturing costs, have been rising at an accelerating rate, as shown in Figure F.
Figure F.
Source: Bloomberg Law labor. Data as of Q1 2023. Note: Starting with Q1 2016, averages are based on each contract’s ratification date. Prior to 2016, averages are based on the date each contract was added to Bloomberg Law’s database. Included for illustrative purposes only. Past performance is no guarantee of future results.
Productivity gains notwithstanding, it is not a stretch to suggest that another Fed policy mistake may be in the cards.
8. New Geopolitical Landscape Favors Gold
The emerging geopolitical landscape favors gold and outweighs the traditional inverse relationship of gold to restrictive central bank monetary policy. Central bank buying of gold bullion increased 14% through Q3 2023 versus 2022 and easily exceeded the record level established the previous year. Importantly, official purchases are not sensitive to market prices. Such purchases are integral to a strategy recently formulated by the BRICs (Brazil, Russia, India and China) trading block to recycle trade surpluses through channels other than U.S. Treasuries, which have lost luster as safe, neutral assets. Even though the realignment of geopolitical forces that has become obvious in recent months has been gestating for several years, the actions taken to reduce U.S. dollar exposure are, in our opinion, in their infancy. In December, JPMorgan Chase estimated that 20% of oil is now traded in currencies other than the U.S. dollar. (Luke Gromen, 1/5/2024 Ten Interesting Things We Have Read Recently.)
Figure G. Gold Buying by Central Banks Has Reached All-Time High
Source: State Street Global Advisors, Metals Focus, Refinitiv GFMA, World Gold Council. Data as of 12/31/2022. Included for illustrative purposes only. Past performance is no guarantee of future results.
9. Western Investment Absent from Gold Ascent to Record High
Under 1% of all global AUM is allocated to gold versus 8% at the peak in 1980. Is it not somewhat astonishing that gold is managing to trade at record highs with virtually no participation from Western investors? These same investors helped drive gold to its previous record high in 2011 of $1,921 per ounce by piling into SPDR Gold Trust ETF (GLD)3 and other fledgling gold-backed ETFs whose AUMs grew from infancy in (2004) to over 2,500 tonnes at the peak in 2012. In our view, a gold rush proportional to 2008-2011 could easily double the gold price from current levels. What might drive allocation, as reflected in Figure H, to 2% or even 3%? The 8% of 1980 might be a stretch as there was no Bitcoin, little private equity, AI or other exotic options for portfolio “diversifiers” in those ancient days. However, it doesn’t take much to imagine that these overcrowded trades (the opposite of gold) could become discredited and/or played out, somewhat similar to the dot-com bust of 2000.
Figure H. Gold’s % Share of Global Equity and Bond Securities
Source: BIS, ICE Benchmark Administration, Metals Focus, Refinitiv GFMS, World Bank, World Federation of Exchanges, World Gold Council. Included for illustrative purposes only. Past performance is no guarantee of future results.
10. Catalyst = Higher Gold Prices
Value trades can drag on endlessly without a spark. What is the catalyst to ignite performance in gold mining equities? The simple answer is the continuation of the rising trend of gold prices. The chart below instructs that gold has soundly outpaced the S&P 5004 over the past 25 years, excluding income, and more than kept pace with income included. The gold price is not in nosebleed territory. One must simply expect the 25-year trend to continue for gold stocks to combust spontaneously. The simple explanation for the trend is the long-term devaluation of the US dollar against physical assets.
Figure Ia. Gold vs. S&P 500 for 25 Years Ended 12/31/2023
Cumulative Returns
Gold Bullion 617%
S&P 500 Index 288%
S&P 500 Total Return Index (Dividends Reinvested) 518%
Source: Bloomberg. Data as of 12/31/2023. Included for illustrative purposes only. Past performance is no guarantee of future results.
The optically flashy $2,035 per ounce gold price of yesterday’s closing, is well below the peaks set in 2011 and 1980 on an inflation-adjusted basis.
Figure Ib. Inflation Adjusted Gold Price, Adjusted to Today’s Dollar
Source: GuruFocus. Data as of 12/31/2023. Included for illustrative purposes only. Past performance is no guarantee of future results.
Taking only the past decade into account, most would agree that the macroeconomic landscape for the U.S. dollar, the principal competitor for gold, is materially worse. Our view that the metal would be more properly priced in the range of $2,500-$3,000 does not seem farfetched.
Our expectation of further upside for gold and related mining stocks is corroborated by technical analysis:
Figures J.
Source: Worth Charting. Data as of 12/31/2022. Included for illustrative purposes only. Past performance is no guarantee of future results.
11. M&A Activity Set to Accelerate
The present-day investment case for gold stocks echoes that for quality industrial stocks of the late 1970s. In essence: solid, cash flow generating companies that in many instances could be worth more in liquidation than as going concerns. Corporate raiders acquired investment stakes to pressure management to “surface” values for the benefit of long-suffering shareholders. We do not think this highly specialized sector will attract corporate raiders. However, we do think impatient shareholders could welcome predatory M&A (mergers and acquisitions). A perfect example is the recently announced takeover of Marathon Gold by Calibre Mining. The related information circular states that as many as 20 counterparties expressed potential interest in acquiring Marathon. We believe that many of the rejected suitors are likely to be actively considering other takeover targets. On this note, we saw yet another opportunistic acquisition of Osino Resources by Dundee Precious Metals near the end of 2023.
The Investment Case: Clear and Compelling
In our opinion, the investment case for gold mining equities is clear and compelling. It is based on considerations of value and circumstances. The unknown element is the requisite patience before investors discover the attraction. In our view, that uncertainty is easily outweighed by the asymmetric proposition of minimal downside offset by outsized upside potential.
1
VanEck Vectors Gold Miners ETF (GDX) tracks the overall performance of companies involved in the gold mining industry.
2
Gold bullion is measured by the Bloomberg GOLDS Comdty Spot Price.
3
The SPDR Gold Shares ETF (GLD) tracks the price of gold bullion in the over-the-counter (OTC) market.
4
The S&P 500 or Standard & Poor’s 500 Index is a market-capitalization-weighted index of the 500 largest U.S. publicly traded companies.
Important Disclosure
Past performance is no guarantee of future results. You cannot invest directly in an index. Investments, commentary and statements are unique and may not be reflective of investments and commentary in other strategies managed by Sprott Asset Management USA, Inc., Sprott Asset Management LP, Sprott Inc., or any other Sprott entity or affiliate. Opinions expressed in this content are those of the author and may vary widely from opinions of other Sprott affiliated Portfolio Managers or investment professionals.
This content may not be reproduced in any form, or referred to in any other publication, without acknowledgment that it was produced by Sprott Asset Management LP and a reference to sprott.com. The opinions, estimates and projections (“information”) contained within this content are solely those of Sprott Asset Management LP (“SAM LP”) or its affiliates and are subject to change without notice. SAM LP makes every effort to ensure that the information has been derived from sources believed to be reliable and accurate. However, SAM LP and affiliates assume no responsibility for any losses or damages, whether direct or indirect, which arise out of the use of this information. SAM LP and affiliates are not under any obligation to update or keep current the information contained herein. The information should not be regarded by recipients as a substitute for the exercise of their own judgment. Please contact your own personal advisor on your particular circumstances. Views expressed regarding a particular company, security, industry or market sector should not be considered an indication of trading intent of any investment funds managed by SAM LP or its affiliates. These views are not to be considered as investment advice nor should they be considered a recommendation to buy or sell.
The information contained herein does not constitute an offer or solicitation to anyone in the United States or in any other jurisdiction in which such an offer or solicitation is not authorized or to any person to whom it is unlawful to make such an offer or solicitation.
The information provided is general in nature and is provided with the understanding that it may not be relied upon as, nor considered to be, the rendering or tax, legal, accounting or professional advice. Readers should consult with their own accountants and/or lawyers for advice on the specific circumstances before taking any action.