(Bloomberg) — US President-elect Donald Trump warned the so-called BRICS nations that he would require commitments that they would not move to create a new currency as an alternative to using the US dollar and repeated threats to levy a 100% tariff.
“The idea that the BRICS Countries are trying to move away from the Dollar while we stand by and watch is OVER,” Trump said in a post to his Truth Social network on Saturday.
“We require a commitment from these Countries that they will neither create a new BRICS Currency, nor back any other Currency to replace the mighty U.S. Dollar or, they will face 100% Tariffs, and should expect to say goodbye to selling into the wonderful U.S. Economy,” he added.
Trump on his campaign trail pledged that he would make it costly for countries to move away from the US dollar. And he’s threatened to use tariffs to ensure they complied. Saturday’s threat took on new relevance as the president-elect prepares to retake power in January.
Trump and his economic advisers have been discussing ways to punish allies and adversaries alike who seek to engage in bilateral trade in currencies other than the dollar. Those measures include considering options such as export controls, currency manipulation charges and levies on trade, according to people familiar with the matter.
Trump has long stressed that he wants the US dollar to remain the world’s reserve currency, saying in a March interview with CNBC that he “would not allow countries to go off the dollar” because it would be “a hit to our country.”
The BRICS nations — as Brazil, Russia, India, China and South Africa are collectively known — discussed the issue of de-dollarization at a summit in 2023. Backlash against the dollar’s dominance gained traction in 2022 when the US led efforts to impose economic sanctions on Russia.
Economic advisers to Trump and his campaign have spoken in particular about targeting the BRICS effort.
Earlier: Trump Aides Discuss Penalties for Nations That De-Dollarize
“There is no chance that the BRICS will replace the U.S. Dollar in International Trade, and any Country that tries should wave goodbye to America,” Trump said Saturday.
The president-elect has already rattled world markets ahead of his second term with threats to levy an additional 10% tariffs on goods from China and 25% tariffs on all products from Mexico and Canada if those countries do not do more to stem the flow of illegal drugs and undocumented migrants across US borders.
Canadian Prime Minister Justin Trudeau met with Trump on Friday to discuss trade and border issues in a bid to tamp down tensions between the two allied nations after the tariff threat.
In this video, Dr. John Mark Staude and Georgie Mark discuss exciting developments from Riverside Resources, including the upcoming spin-out of Blue Jay Resources, a company focused on gold exploration in Ontario’s Beardmore-Geraldton gold belt. Dr. Staude highlights the strategic decision to diversify Riverside’s portfolio beyond Mexico, with Ontario offering a prime location for gold discovery. Georgie Mark, the newly appointed CEO of Blue Jay Resources, shares his vision for the company’s growth, including exploring high-grade gold deposits that have been overlooked for over 70 years. They also discuss Riverside’s strong capital structure and the opportunity for shareholders to benefit from both Riverside and Blue Jay’s future success. Find out why Rick Rule is a shareholder in Riverside Resources.
PHILADELPHIA, PA and VANCOUVER, BC / ACCESSWIRE / November 27, 2024 / Jericho Energy Ventures Inc. (TSXV:JEV)(OTC PINK:JROOF)(FRA:JLM) (“Jericho”, “JEV” or the “Company”) is pleased to announce that its wholly owned subsidiary, Hydrogen Technologies (“HT“), has been awarded a UK patent for its groundbreaking zero-emission hydrogen-oxygen (H2/O2) combustion technology.
This is a continuation of Jericho’s IP protection strategy for its cutting-edge clean energy solutions, which are aimed at transforming the commercial hydrogen energy market. In addition to the newly granted UK patent, HT has secured multiple patents from the United States Patent and Trademark Office (USPTO), with others currently pending approval.
Brian Williamson, CEO of JEV, commented: “Securing this UK patent is a key milestone in our IP protection strategy as we move to commercialization of our groundbreaking H2/O2 combustion technology. We remain committed to an IP protection strategy that recognizes the value of Jericho’s IP portfolio with each new generation and innovation.”
HT is presently working with its manufacturing partners, Superior Boiler and Selas Heat Technology, to deploy its cutting-edge DCC™ boiler technology at a prominent Western US university to provide decarbonized district heat for its campus. This development places JEV and HT at the forefront of market ready solutions to decarbonize the estimated $198 billion global district heating market.¹
HT is actively collaborating with several multinational corporations, universities, and districts to study the use of its zero-emission hydrogen boiler technology to significantly reduce scope 1 emissions.
Hydrogen Technologies’ GHG-free hydrogen-fueled boilers offer a highly efficient and sustainable alternative to conventional fossil fuel-based boilers. DCC™ boilers eliminate greenhouse gas emissions, providing a clean and eco-friendly source of steam and hot water for various industries and applications. HT’s DCC™ system is a recipient of the Solar Impulse Foundation’s prestigious “Solar Impulse Efficient Solution” award recognizing profitable solutions to protect the environment.
JEV recently announced plans to spinout its hydrogen platform from its traditional energy assets as a separate, pure-play H2 solutions company to maximize shareholder value.
About Hydrogen Technologies
Hydrogen Technologies (HT) offers its award-winning CLEAN, ZERO-EMISSION ENERGY SOLUTION for the Commercial and Industrial Boiler Market. There are a wide range of applications for our cleanH2steam DCC™ boiler, which works much like traditional commercial heat, hot water and industrial steam boilers. Whether the application is district heating, food processing, chemical refining, pharmaceuticals, pulp and paper mills, or any other industrial process, HT has a reliable, efficient and clean solution for your GHG and ESG goals.
Jericho is an energy company positioned for the current energy transitions; owning, operating and developing both traditional hydrocarbon JV assets and advancing the low-carbon energy transition, with active investments in hydrogen. Our wholly owned subsidiary, Hydrogen Technologies, delivers breakthrough, patented, zero-emission boiler technology to the Commercial & Industrial heat and steam industry. We also hold strategic investments and board positions in California Catalysts (formerly H2U Technologies), a leading developer of advanced materials for electrolysis, and Supercritical Solutions, developing the world’s first, high pressure, ultra-efficient electrolyzer. Jericho also owns and operates long-held producing oil and gas JV assets in Oklahoma which it is currently developing from cash flows in an effort to further increase production.
CONTACT: Allen Wilson, Director, or Adam Rabiner, Dir. of Investor Relations Jericho Energy Ventures Inc. Tel. 604.343.4534 Email: investorrelations@jerichoenergyventures.com
This news release contains certain “forward-looking information” and “forward-looking statements” (collectively, “forward-looking statements“) within the meaning of applicable securities laws. Such forward-looking statements are not representative of historical facts or information or current condition, but instead represent only Jericho’s beliefs regarding future events, plans or objectives, many of which, by their nature, are inherently uncertain and outside of Jericho’s control. Forward-looking statements are frequently characterized by words such as ”plan”, “expect”, “project”, “intend”, “believe”, “anticipate”, “estimate” and other similar words, or statements that certain events or conditions “may”, “will” or “may not” occur.
Forward-looking statements are subject to a variety of risks and uncertainties and other factors that could cause actual events or results to differ materially from those anticipated in the forward-looking statements, which include, but are not limited to: regulatory changes; changes to the definition of, or interpretation of, foreign private issuer status; the impacts of COVID-19 and other infectious diseases; general economic conditions; industry conditions; current and future commodity prices and price volatility; significant and ongoing stock market volatility; currency and interest rate fluctuation; governmental regulation of the energy industry, including environmental regulation; geological, technical and drilling problems; unanticipated operating events; the availability of capital on acceptable terms; the need to obtain required approvals from regulatory authorities; liabilities and risks inherent in oil and gas exploration, development and production operations; liabilities and risks inherent in early stage hydrogen technology projects, energy storage, carbon capture and new energy systems; changes in government environmental objectives or plans; and the other factors described in Jericho’s public filings available at www.sedarplus.ca.
The forward-looking statements contained herein are based on certain key expectations and assumptions of Jericho concerning anticipated financial performance, business prospects, strategies, regulatory regimes, the sufficiency of budgeted capital expenditures in carrying out planned activities, the ability to obtain financing on acceptable terms, expansion of consumer adoption of the Company’s (or its subsidiaries’) technologies and products, results of DCC™ feasibility studies and the success of investments, all of which are subject to change based on market conditions, potential timing delays and other risk factors. Although Jericho believes that these assumptions and the expectations are reasonable based on information currently available to management, such statements are not guarantees of future performance and actual results or developments may differ materially from those in the forward-looking statements. Investors should not place undue reliance on forward-looking statements.
Readers are cautioned that the foregoing lists are not exhaustive. The forward-looking statements contained in this news release are made as of the date of this news release, and Jericho does not undertake to update any forward-looking statements that are contained or referenced herein, except as required by applicable securities laws.
Neither the TSX Venture Exchange nor its Regulation Services Provider (as that term is defined in the policies of the TSX Venture Exchange) accepts responsibility for the adequacy or accuracy of this release.
¹ Future Market Insights, “District Heating Market Outlook (2023 to 2033),”by Nikhil Kaitwade, Analyst, January 2023
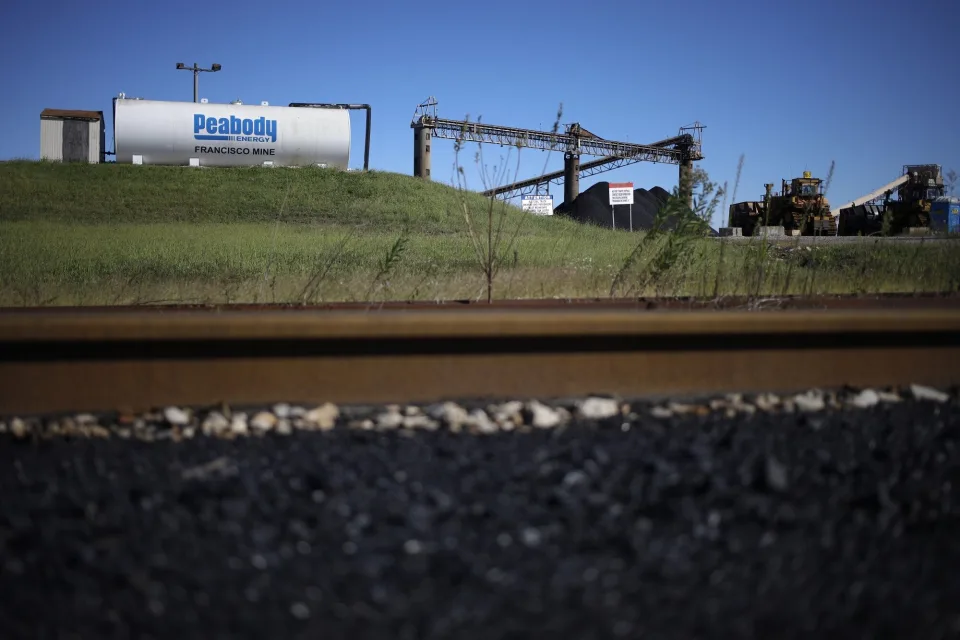
(Bloomberg) — With US demand for coal waning, Peabody Energy Corp. has struck a deal to shift its focus on targeting growth in the global steel market.
Peabody, the biggest US coal miner, agreed to pay as much as $3.78 billion for four mines in Australia that supply metallurgical coal — a key ingredient in steelmaking. The agreement with Anglo American Plc, announced Monday, will help Peabody almost triple its met coal output within two years, putting the St. Louis company on pace to be the world’s third-biggest exporter.
“This is a significant change,” Chief Financial Officer Mark Spurbeck said Monday during a call with analysts. “This transaction will reshape Peabody.”
Peabody shares slipped as much as 6.6% Monday, the biggest intraday decline since Aug. 5.
Peabody is a major supplier of thermal coal to fuel power plants, though the company has been seeking to shift its mix in recent years as utilities burn less of the dirtiest fossil fuel. Steel production is also a major source of planet-warming emissions, but it’s critical for most major infrastructure projects and demand is expected to climb.
The Anglo transaction means about 74% Peabody’s earnings are expected to come from international shipments of met coal, up from 50% now, according to the CFO.
It’s also notable that the mines Peabody is acquiring are in Australia, close to the rapidly growing economies of Asia. Peabody had pursued another deal for Australian assets in 2022, but no transaction was completed. The company expects this deal to close in mid-2025 and it will be accretive almost immediately.
The deal comes amid signs of a rebound in Chinese steel production, but Peabody will likely be delivering more met coal “everywhere” in Asia, according to Andy Blumenfeld, director of data analytics at McCloskey by Opis. India, Japan and emerging economies in Southeast Asia will all be clamoring for shipments.
“They need the steel,” Blumenfeld said. “It’s critical for growing any economy.”
A passerby walks past an electric monitor displaying recent movements of various stock prices outside a bank in Tokyo · Reuters
Tom Westbrook
Thu, November 21, 2024 at 9:29 PM EST 3 min read
By Tom Westbrook
SINGAPORE (Reuters) – Gold was headed for its largest weekly gain in nearly eight months on Friday and the euro hovered at a 13-month low as Russia lowered its threshold for using nuclear weapons and fired a hypersonic ballistic missile at Ukraine.
The risk of escalation also sent European gas prices to a one-year high and pushed investors towards safe havens, underpinning German debt and putting the Swiss franc on course for its first weekly rise in two months.
In Asia on Friday, chipmakers led stocks a little higher after Nvidia touched a record high in U.S. trade on solid earnings, with shares in Taiwan and South Korea up more than 1% and the Nikkei gaining 0.8%.
Gold was steady at $2,677 an ounce and up more than 4.5% for the week so far while bitcoin, stood on the brink of breaking above $100,000 for the first time.
Assets linked to Adani Group companies remained under pressure, with dollar bonds nursing losses following chairman Gautam Adani’s indictment for fraud by U.S. prosecutors.
Russia on Tuesday lowered its threshold for using nuclear weapons and overnight responded to the U.S. and UK allowing Kyiv to strike Russian territory with western weapons by firing a hypersonic intermediate-range missile at Ukraine’s Dnipro.
“Those weapons typically carry nuclear warheads,” said analysts at ANZ Bank, noting the attack sent oil prices higher.
“The exchange indicates the war has entered a new phase, raising concerns around disruptions to supply.”
Brent crude futures are up nearly 4.5% on the week and edged up to touch a two-week high of $74.44 a barrel in Asia trade.
The euro has been friendless and down for seven of the past eight weeks as Europe faces U.S. tariffs, slowing growth, the collapse of Germany’s government and strains in France’s government over its 2025 budget.
“There doesn’t seem to be anything on the plus side of the euro ledger just at the moment,” said National Australia Bank’s head of FX research, Ray Attrill.
At $1.0469 the common currency is close to breaking support at last year’s low of $1.0448. European stocks are also headed for a fifth weekly drop in a row, while world stocks are up 1% this week.
The dollar index eyed a weekly gain of 0.4% and traded at 107.05. S&P 500 futures were flat. Benchmark 10-year Treasury yields held at 4.432%, more or less steady on the week.
Markets imply about a 58% chance of a Fed cut, down from 83% a week earlier.
Data in Japan showed core inflation held above the central bank’s 2% target in October, keeping pressure for a rate rise. Markets are pricing about a 57% chance of a 25 basis point Bank of Japan rate hike in December and the prospect has injected some volatility and even support for the yen.
The yen, down 4% this quarter, was trading firmer at 154.38 per dollar in morning trade.
“Together with speculation about (finance ministry) intervention, I think selling on upticks on dollar/yen is quite decent,” said Keita Matsumoto, head of financial institution sales and solutions at Citigroup Global Markets Japan in Tokyo.
“Our investor clients and corporate clients are rather sellers of dollar/yen close to 155.”
PHILADELPHIA, PA and VANCOUVER, BC / ACCESSWIRE / November 19, 2024 / Jericho Energy Ventures Inc. (TSXV:JEV)(OTC:JROOF)(FRA:JLM) (“Jericho”, “JEV” or the “Company”) is pleased to announce that a California-based project co-developed by its wholly owned subsidiary, Hydrogen Technologies (“HT“), has been awarded USD$1 million in funding from the U.S. Department of Energy’s Hydrogen and Fuel Cell Technologies Office (HTFO).
The project, Hydrogen Permitting Issues and Improvements (HPII), was developed by HT and three partners: Sandia National Laboratories, GHD (a global professional services company with expertise in hydrogen infrastructure), and the University of California at Riverside. The team will identify and address challenges with the deployment of hydrogen-powered equipment (e.g., steam/hot water boilers, fuel cells and fork-lifts) at locations where hydrogen is likely to play a role but is currently an unfamiliar fuel, such as at manufacturing facilities or district heating systems.
HT will receive a share of the total funding for its part in engaging current and potential users of hydrogen-fueled boilers, their permitting authorities, community and environmental organizations.
The HPII project will identify and address technological and administrative barriers to permitting hydrogen projects. The project focuses on providing state-of-the-art safety and risk analysis for select use-cases and real-world data on at-scale issues and concerns to improve integration into existing industrial infrastructure. The project includes a strong community engagement strategy where local representatives from disadvantaged communities are engaged early in the process to identify challenges and mitigation measures to ensure success.
Brian Williamson, CEO of Jericho Energy Ventures, commented: “We are proud to be part of this important DOE-funded project with our esteemed partners. We see the independent launch of our Hydrogen Solution Platform accelerating our access to future collaborations and partnerships with groups pushing full steam ahead with lower emissions industrial and commercial solutions. Beyond delivering our patented, zero-emission hydrogen DCC boiler technology, we are increasingly being recognized as a trusted, innovative hydrogen solutions partner to industry and government.”
HT is collaborating with several multi-national corporations and universities to complete feasibility studies for the utilization of our zero-emission hydrogen boiler technology. HT is presently working with its manufacturing partner, Superior Boiler, to deploy its boiler technology at a prominent Western US university while providing decarbonized district heat for its campus.
Hydrogen Technologies’ GHG-free hydrogen-fueled boilers offer a highly efficient and sustainable alternative to conventional fossil fuel-based boilers. DCC™ boilers eliminate greenhouse gas emissions, providing a clean and eco-friendly source of steam and hot water for various industries and applications. HT’s DCC™ system is a recipient of the Solar Impulse Foundation’s prestigious “Solar Impulse Efficient Solution” award recognizing profitable solutions to protect the environment.
JEV recently announced plans to spinout its hydrogen platform from its traditional energy assets as a separate, pure-play H2 solutions company to maximize shareholder value.
The Company also announces that it has arranged a shares for debt transaction to settle an aggregate of $376,071 in interest accrued on convertible debentures outstanding up to November 12, 2024 and disclosed in the Company’s financial statements and in the Company’s news releases dated January 7, 2022 and April 5, 2024. The shares for debt settlement is subject to approval from the TSX Venture Exchange (“TSXV“), pursuant to TSXV Policy 4.3 – Shares for Debt, which will be followed by the Company issuing an aggregate of 2,892,846 common shares (the “Settlement Shares“) at a deemed price of $0.13 to 14 of the holders of the debentures of which two are non-arm’s length parties to the Company. The Settlement Shares will be issued subject to prospectus exemptions available pursuant to Canadian securities laws and will be subject to a four month and one day hold period.
The shares for debt transaction was approved by the Company’s board of directors and did not require a formal valuation nor minority shareholder approval pursuant to Multilateral Instrument 61-101.
About Hydrogen Technologies
Hydrogen Technologies (HT) offers its award-winning CLEAN, ZERO-EMISSION ENERGY SOLUTION for the Commercial and Industrial Boiler Market. There are a wide range of applications for our cleanH2steam DCC™ boiler, which works much like traditional commercial heat, hot water and industrial steam boilers. Whether the application is district heating, food processing, chemical refining, pharmaceuticals, pulp and paper mills, or any other industrial process, HT has a reliable, efficient and clean solution for your GHG and ESG goals.
Jericho is an energy company positioned for the current energy transitions; owning, operating and developing both traditional hydrocarbon JV assets and advancing the low-carbon energy transition, with active investments in hydrogen. Our wholly owned subsidiary, Hydrogen Technologies, delivers breakthrough, patented, zero-emission boiler technology to the Commercial & Industrial heat and steam industry. We also hold strategic investments and board positions in California Catalysts (formerly H2U Technologies), a leading developer of advanced materials for electrolysis, and Supercritical Solutions, developing the world’s first, high pressure, ultra-efficient electrolyzer. Jericho also owns and operates long-held producing oil and gas JV assets in Oklahoma which it is currently developing from cash flows in an effort to further increase production.
JEV CONTACT: Allen Wilson, Director, or Adam Rabiner, Dir. of Investor Relations Jericho Energy Ventures Inc. Tel. 604.343.4534 Email: investorrelations@jerichoenergyventures.com
This news release contains certain “forward-looking information” and “forward-looking statements” (collectively, “forward-looking statements“) within the meaning of applicable securities laws. Such forward-looking statements are not representative of historical facts or information or current condition, but instead represent only Jericho’s beliefs regarding future events, plans or objectives, many of which, by their nature, are inherently uncertain and outside of Jericho’s control. Forward-looking statements are frequently characterized by words such as ”plan”, “expect”, “project”, “intend”, “believe”, “anticipate”, “estimate” and other similar words, or statements that certain events or conditions “may”, “will” or “may not” occur. Specifically, this news release contains forward-looking statements relating to, among others, the successful specific grant funding application and approvals by the DOE. Selection for award negotiations is not a commitment by DOE to issue an award or provide funding.
Forward-looking statements are subject to a variety of risks and uncertainties and other factors that could cause actual events or results to differ materially from those anticipated in the forward-looking statements, which include, but are not limited to: regulatory changes; changes to the definition of, or interpretation of, foreign private issuer status; the impacts of COVID-19 and other infectious diseases; general economic conditions; industry conditions; current and future commodity prices and price volatility; significant and ongoing stock market volatility; currency and interest rate fluctuation; governmental regulation of the energy industry, including environmental regulation; geological, technical and drilling problems; unanticipated operating events; the availability of capital on acceptable terms; the need to obtain required approvals from regulatory authorities; liabilities and risks inherent in oil and gas exploration, development and production operations; liabilities and risks inherent in early stage hydrogen technology projects, energy storage, carbon capture and new energy systems; changes in government environmental objectives or plans; and the other factors described in Jericho’s public filings available at www.sedarplus.ca.
The forward-looking statements contained herein are based on certain key expectations and assumptions of Jericho concerning anticipated financial performance, business prospects, strategies, regulatory regimes, the sufficiency of budgeted capital expenditures in carrying out planned activities, the ability to obtain financing on acceptable terms, expansion of consumer adoption of the Company’s (or its subsidiaries’) technologies and products, results of DCC™ feasibility studies and the success of investments, all of which are subject to change based on market conditions, potential timing delays and other risk factors. Although Jericho believes that these assumptions and the expectations are reasonable based on information currently available to management, such statements are not guarantees of future performance and actual results or developments may differ materially from those in the forward-looking statements. Investors should not place undue reliance on forward-looking statements.
Readers are cautioned that the foregoing lists are not exhaustive. The forward-looking statements contained in this news release are made as of the date of this news release, and Jericho does not undertake to update any forward-looking statements that are contained or referenced herein, except as required by applicable securities laws.
Neither the TSX Venture Exchange nor its Regulation Services Provider (as that term is defined in the policies of the TSX Venture Exchange) accepts responsibility for the adequacy or accuracy of this release.
TULSA, OK and VANCOUVER, BC / ACCESSWIRE / November 4, 2024 / Jericho Energy Ventures Inc. (TSXV:JEV)(OTC PINK:JROOF)(FRA:JLM) (“Jericho”, “JEV” or the “Company”) is pleased to announce that its Board of Directors has approved Management’s plan to separate Jericho’s hydrogen solutions platform (the “Spinout Transaction”) into a new entity to be named Hydrogen Technologies Corporation (“HTC”), subject to certain conditions including receipt of necessary regulatory and shareholder approvals.
Assuming completion of the Spinout Transaction on the terms contemplated by management, each JEV shareholder will retain their shares of Jericho and, in consideration of the transfer of JEV’s hydrogen assets to HTC, will receive shares of HTC (a newly formed BC-based reporting issuer) on a pro rata basis. The definitive terms of the Spinout Transaction are expected to be contained in a management information circular delivered to shareholders in connection with the meeting to approve the Spinout Transaction.
The purpose of the proposed Spinout Transaction is to create two independent specialized energy companies, with a clear focus on leadership in their respective markets. This move will allow both businesses to operate with distinct strategies, tailored capital structures, and focused investment plans, aiming to deliver superior outcomes for stakeholders.
While management intends to move forward with implementation of the Spinout Transaction on a priority basis, definitive terms of the Spinout Transaction, including the final determination to submit a proposal to shareholders, is subject to ongoing review by management and the Board of Directors. The Spinout Transaction is also subject to approval of the TSX Venture Exchange (“TSXV”), approval of the Jericho shareholders and will be subject to approval of the British Columbia courts if effected by way of plan of arrangement. Shareholder approval may be sought at the Company’s Annual General Meeting (“AGM”), scheduled for January 15, 2025 or at a subsequent meeting held for the purpose of such approval.
After the separation, Jericho Energy Ventures would continue to trade on the TSX Venture Exchange under the symbol JEV, representing its oil and gas business.
Brian Williamson, CEO of Jericho Energy Ventures, stated, “By separating our hydrogen platform, we can create two agile, focused companies. This will allow each to pursue its strategic objectives independently and position them for long-term growth and success. We believe JEV shareholders will benefit from the distinct growth opportunities in both the hydrogen and oil & gas sectors, with each company committed to maximizing value within its industry.”
About Jericho Energy Ventures
Jericho is an energy company positioned for the current energy transitions; owning, operating and developing both traditional hydrocarbon JV assets and advancing the low-carbon energy transition, with active investments in hydrogen. Our wholly owned subsidiary, Hydrogen Technologies, delivers breakthrough, patented, zero-emission boiler technology to the Commercial & Industrial heat and steam industry. We also hold strategic investments and board positions in H2U Technologies (a breakthrough electrocatalyst and low-cost electrolyzer platform) and Supercritical Solutions (developing the world’s first, high pressure, ultra-efficient electrolyzer). Jericho also owns and operates long-held producing oil and gas JV assets in Oklahoma which it is currently developing from cash flows in an effort to further increase production.
JEV CONTACT: Allen Wilson, Director, or Adam Rabiner, Dir. of Investor Relations Jericho Energy Ventures Inc. Tel. 604.343.4534 Email: investorrelations@jerichoenergyventures.com
This news release contains certain “forward-looking information” and “forward-looking statements” (collectively, “forward-looking statements“) within the meaning of applicable securities laws. Such forward-looking statements are not representative of historical facts or information or current condition, but instead represent only Jericho’s beliefs regarding future events, plans or objectives, many of which, by their nature, are inherently uncertain and outside of Jericho’s control. Forward-looking statements are frequently characterized by words such as ”plan”, “expect”, “project”, “intend”, “believe”, “anticipate”, “estimate” and other similar words, or statements that certain events or conditions “may”, “will” or “may not” occur. Specifically, this news release contains forward-looking statements relating to implementation of the Spinout Transaction and receipt of necessary approvals.
Forward-looking statements are subject to a variety of risks and uncertainties and other factors that could cause actual events or results to differ materially from those anticipated in the forward-looking statements, which include, but are not limited to: regulatory changes; changes to the definition of, or interpretation of, foreign private issuer status; the impacts of COVID-19 and other infectious diseases; general economic conditions; industry conditions; current and future commodity prices and price volatility; significant and ongoing stock market volatility; currency and interest rate fluctuation; governmental regulation of the energy industry, including environmental regulation; geological, technical and drilling problems; unanticipated operating events; the availability of capital on acceptable terms; the need to obtain required approvals from regulatory authorities; liabilities and risks inherent in oil and gas exploration, development and production operations; liabilities and risks inherent in early stage hydrogen technology projects, energy storage, carbon capture and new energy systems; changes in government environmental objectives or plans; and the other factors described in Jericho’s public filings available at www.sedarplus.ca.
The forward-looking statements contained herein are based on certain key expectations and assumptions of Jericho concerning anticipated financial performance, business prospects, strategies, regulatory regimes, the sufficiency of budgeted capital expenditures in carrying out planned activities, the ability to obtain financing on acceptable terms, expansion of consumer adoption of the Company’s (or its subsidiaries’) technologies and products, results of DCC™ feasibility studies and the success of investments, all of which are subject to change based on market conditions, potential timing delays and other risk factors. Although Jericho believes that these assumptions and the expectations are reasonable based on information currently available to management, such statements are not guarantees of future performance and actual results or developments may differ materially from those in the forward-looking statements. Investors should not place undue reliance on forward-looking statements.
Readers are cautioned that the foregoing lists are not exhaustive. The forward-looking statements contained in this news release are made as of the date of this news release, and Jericho does not undertake to update any forward-looking statements that are contained or referenced herein, except as required by applicable securities laws.
Neither the TSX Venture Exchange nor its Regulation Services Provider (as that term is defined in the policies of the TSX Venture Exchange) accepts responsibility for the adequacy or accuracy of this release.
Vancouver, British Columbia–(Newsfile Corp. – November 18, 2024) – Silver47 Exploration Corp. (TSXV: AGA) (“Silver47” or the “Company), is pleased to announce the first results from the 2024 drill program at the Company’s wholly-owned flagship Red Mountain Project in Alaska, USA. The results for the first of 6 holes drilled on the property in 2024 indicate strong potential for increased high-grade infill drilling within the Dry Creek resource area. A total of 1,039 metres of drilling was completed in 6 holes at the Dry Creek, West Tundra Flats, and Kiwi prospects combined.
Highlights from hole DC24-106:
Drilling cut several massive sulphide horizons within a 24.5m semi-massive mineralized section at the Dry Creek Zone with the highest gold grade interval intercepted to date on the project and remains open
From a depth of 128.29m, hole 106 cut 2.48 m of 61.44% ZnEq or 2,938.5 g/t AgEq (14.95 g/t gold 249.50 g/t silver, 21.97% zinc, 7.03% lead, 0.42% copper)
From a depth of 133.87m, hole 106 cut 0.91 m of 46.74% ZnEq or 2,235 g/t AgEq (8.08 g/t gold, 225.00 g/t silver, 21.20% zinc, 6.68% lead, 0.42% copper)
From 126.40 m-150.91m a 24.51 m interval graded 10.17% ZnEq or 486.3 g/t AgEq (1.99 g/t gold, 55.50 g/t silver, 4.08% zinc 1.32% lead, 0.10% copper)
Mr. Alex Walls, P.Geo., Vice President of Exploration, stated: “We are extremely excited to report these kinds of high-grade polymetallic intercepts in our first drill program on the Project. This drill intercept supports our thesis that Red Mountain Project hosts significant precious metal enrichment in addition to the base metal endowment.”
Dry Creek Target Area
The Dry Creek mineralization consists of multiple horizons of semi-massive to massive sulfides within the metavolcanics and metasediments of the Totatlanika Schist which can be traced for 4,500m and dips steeply to the north. The Fosters and Discovery lenses of VMS mineralization make up the central 1,400m of the Dry Creek North Horizon occurring as massive to semi-massive silver-zinc-lead-gold-copper sulfides. The lenses pinch and swell along strike and down-dip, as is typical of VMS deposits. True width intersections are up to 40 m at Fosters where there is evidence of growth faults, showing potential proximity to a VMS feeder zone.
Figure 1. Plan map of drill holes at Dry Creek and West Tundra Flats resource areas.
Equivalencies are calculated using ratios with metal prices of US$2,750/tonne Zn, US$2,100/tonne Pb, US$8,880/tonne Cu, US$1,850/oz Au, and US$23/oz Ag and
Metal recoveries are based on metallurgical work returned of 90% Zn, 75% Pb, 70% Cu, 70% Ag, and 80% Au.
Zinc Equivalent (ZnEq %) = [Zn (%) x 1] + [Pb (%) x 0.6364] + [Cu (%) x 2.4889] + [Ag (ppm) x 0.0209] + [Au (ppm) x 1.923]
Silver Equivalent (AgEq g/t) = [Zn (%) x 47.81] + [Pb (%) x 30.43] + [Cu (%) x 119] + [Ag (g/t) x 1] + [Au (g/t) x 91.93]
Hole DC24-106 was planned to step 60m down-dip from near-surface mineralized intercepts in DC97-03, DC97-04, DC97-07, and DC97-08. Additionally, the hole was intended to test continuity of high-grade mineralization between the 1997 holes and the deep, down-dip intercept in DC18-79. DC24-106 passes through regionally metamorphosed metasediments and metavolcanics of the Totatlanika Schist. The 24.51m mineralized intercept is hosted in a metarhyolite unit, with increasing intervals of semi-massive sulfides from 126.40m, massive sulfides from 128.3m, and finishing with semi-massive sulfides from 143.45 to 150.91m. The sulfides are comprised of aphanitic to coarse pyrite, sphalerite, galena, and chalcopyrite. The mineralized widths are consistent with the historical results, and the 2.48m of 14.95 g/t gold is the highest-grade gold interval drilled to date on the Red Mountain Project.
This successful infill hole in the centre of the Dry Creek resource indicates a strong potential for rapid resource upgrade and growth extending down-dip. The wide spacing of the historical drilling provides ample opportunity to increase the resource, which remains open at depth and along strike.
Table 2. 2024 Drill Collar Information, Red Mountain Project.
Red Mountain 2024 Diamond Drill Hole Collars
Hole ID
Easting
Northing
Elevation (m)
Azimuth
Dip
Depth (m)
Zone
Status
DC24-106
481059
7088384
1233
170
-72
192
Dry Creek
Reported Here
DC24-104
480364
7088200
1218
180
-45
112
Dry Creek
Results Pending
DC24-105
480364
7088200
1218
180
-75
120
Dry Creek
Results Pending
WT24-33
483950
7090863
982
0
-90
185
West Tundra Flats
Results Pending
WT24-34
484196
7090851
968
38
-78
146
West Tundra Flats
Results Pending
KW24-03
470228
7085491
1561
180
-50
283
Kiwi
Results Pending
Easting and northing in metres, NAD27 zone 6
About the Red Mountain VMS-SEDEX Project – Alaska, USA
Silver47’s flagship Red Mountain property covers 633 square kilometres of Alaska State-managed land 100km south of Fairbanks, Alaska. The project is well situated for infrastructure, 30km east of the community of Healy which has power, rail and state highway access to Alaska Route 3, providing a valuable connection to Anchorage and tide water. The Company has an approved permit to conduct advanced exploration, including drilling, across the property.
Red Mountain hosts a NI 43-101 inferred mineral resource estimate of 15.6Mt at 7% ZnEq for 1Mt of ZnEq or 335.7 g/t AgEq for 168.6 Moz AgEq at the Dry Creek (DC) and West Tundra Flats (WTF) resource areas as combined open pit and underground. DC and WTF are the two most advanced mineralized zones at Red Mountain, with at least 20 additional mineralized prospects discovered on the property to date over the 60 kilometres of highly prospective geology.
For more information, see the Red Mountain NI 43-101 technical report titled “Technical Report on the Red Mountain VMS Property, Bonnifield Mining District, Alaska, USA” dated January 12, 2024, prepared by Apex Geoscience Ltd., can be found on the Company’s website https://silver47.ca/ and SEDAR+.
Quality Assurance and Quality Control
Quality assurance and quality control (QAQC) protocols for drill core sampling at Red Mountain project followed industry standard practices. Core samples were typically taken at 1.0m intervals in mineralized zones, and 3.0m intervals outside of mineralized zones. Sample lengths were adjusted as necessary so as not to cross lithologic and mineralogic boundaries. QAQC check samples were inserted into the sample stream with one blank, one duplicate (coarse), and one certified reference material (CRM) occurring within every 20 samples. Drill core was cut in half, bagged, sealed and delivered directly to ALS Minerals Fairbanks, Alaska for transport to the ALS Minerals Laboratories labs in North Vancouver, British Columbia. ALS Minerals Laboratories are registered to ISO 9001:2008 and ISO 17025 accreditations for laboratory procedures. Core samples were analyzed at ALS Laboratory facilities in North Vancouver using four-acid digestion with an ICP-MS finish. Gold analysis was by fire assay with atomic absorption finish, or gravimetric finish for over-limit samples. Over-limits for silver, zinc, copper, and lead were analyzed using Ore Grade four-acid digestion. The standards, certified reference materials, were acquired from CDN Resource Laboratories Ltd. of Langley, British Columbia and selected to represent expected mineralization.
Qualified Person
Mr. Alex S. Wallis, P.Geo., is Vice President of Exploration for the Company who is a “qualified person” as defined by National Instrument 43-101. Mr. Wallis has verified the data disclosed in this press release, including the sampling, analytical and test data underlying the technical information and has approved the technical information in this press release.
About Silver47 Exploration Corp.
Silver47 wholly-owns three silver and critical metals (polymetallic) exploration projects in Canada and the US: the Flagship Red Mountain silver-gold-zinc-copper-lead VMS-SEDEX project in southcentral Alaska; the Adams Plateau silver-zinc-copper-gold-lead SEDEX-VMS project in southern British Columbia, and the Michelle silver-lead-zinc-gallium-antimony MVT-SEDEX Project in Yukon Territory. Silver47 Exploration Corporation shares trade on the TSX-V under the ticker symbol AGA. For more information about Silver47, please visit our website at www.silver47.ca.
On Behalf of the Board of Directors Mr. Gary R. Thompson, Director and CEO info@silver47.ca 403-870-1166
No securities regulatory authority has either approved or disapproved of the contents of this release. Neither the TSXV nor its Regulation Services Provider (as that term is defined in the policies of the TSXV) accepts responsibility for the adequacy or accuracy of this release.
FORWARD-LOOKING STATEMENTS
Information set forth in this news release may involve forward-looking statements under applicable securities laws. Forward-Looking statements are statements that relate to future, not past, events. In this context, forward-looking statements often address expected future business and financial performance, and often contain words such as “anticipate”, “believe”, “plan”, “estimate”, “expect”, and “intend”, statements that an action or event “may”, “might”, “could”, “should”, or “will” be taken or occur, including statements relating to the trading of the Company’s common shares on the TSXV, the prospective geology and composition of its properties, anticipated results of further exploration on its properties, statements relating to the YESAB litigation, or other similar expressions and all statements, other than statements of historical fact included herein. By their nature, forward-looking statements involve known and unknown risks, uncertainties and other factors which may cause our actual results, performance or achievements, or other future events, to be materially different from any future results, performance or achievements expressed or implied by such forward-looking statements. Such factors include, among others, the following risks: the need for additional financing; the satisfaction of the conditions imposed by the TSXV on the Listing; operational risks associated with mineral exploration; regulatory risks; fluctuations in commodity prices; title matters; litigation risks; and the additional risks identified in the Company’s long form prospectus dated October 25, 2024 filed under its issuer profile on SEDAR+ and other reports and filings with the TSXV and applicable Canadian securities regulators. Forward-Looking statements are made based on management’s beliefs, estimates and opinions on the date that statements are made and the Company undertakes no obligation to update forward-looking statements if these beliefs, estimates and opinions or other circumstances should change, except as required by applicable securities laws. Investors are cautioned against attributing undue certainty to forward-looking statements.
(Bloomberg) — President-elect Donald Trump nominated Chris Wright, who runs a Colorado-based oil and natural gas fracking services company, to lead the Energy Department.
Wright, the chief executive officer of Liberty Energy Inc., has no previous Washington experience. He’s made a name for himself as a vocal proponent of oil and gas, saying fossil fuels are crucial for spreading prosperity and lifting people from poverty. The threat of global warming, he has said, is exaggerated.
“Chris has been a leading technologist and entrepreneur in Energy,” Trump said in a statement Saturday. “He has worked in Nuclear, Solar, Geothermal, and Oil and Gas. Most significantly, Chris was one of the pioneers who helped launch the American Shale Revolution that fueled American Energy Independence, and transformed the Global Energy Markets and Geopolitics.”
Trump said Wright, if confirmed, would also sit on the newly formed Council of National Energy that will be chaired by Doug Burgum, Trump’s nominee to lead the Interior Department.
The Energy Department has a disparate mission that includes helping to maintain the nation’s nuclear warheads, studying supercomputers and maintaining the US’s several hundred million-barrel stockpile of crude oil.
It also plays a key role in approving projects to export liquefied natural gas, something that was paused during Biden’s administration. Trump has vowed to undo the pause.
While the department has little authority over oil and gas development, Wright will play a leading role in helping Trump carry out his energy priorities.
Trump’s selection of Wright, whose company is among the largest providers of fracking services globally, is a show of support for the hot-button oil and gas extraction method that Trump frequently touted during the campaign to attack his Democratic opponent Kamala Harris.
Harris said she’d consider banning the technique during her 2020 primary run and reversed course in her 2024 campaign.
‘No Climate Crisis’
Wright’s company published a 180-page paper this year that concluded climate change “is far from the world’s greatest threat to human life,” and that “hydrocarbons are essential to improving the wealth, health, and life opportunities for the less energized.”
“There is no climate crisis. And we are not in the midst of an energy transition either,” Wright said in a video posted on his LinkedIn page. “Humans, and all complex life on earth, is simply impossible without carbon dioxide — hence the term carbon pollution is outrageous.”
Wright holds engineering degrees from the Massachusetts Institute of Technology and the University of California at Berkeley. He describes himself on his Denver-based company’s website as a “tech nerd turned entrepreneur and a dedicated humanitarian.”
While Wright has warned that subsidies for wind and solar drive up power prices and increase grid instability, he does support alternative energy. He serves on the board of small modular reactor developer Oklo Inc., and his company is an investor in geothermal energy and sodium-ion battery technology.
“I’m not here to protect market share for oil gas,” he said during a 2022 interview with Bloomberg Television. “We should do credible things, mostly driven by market forces. But shoveling subsidies at wind and solar, which are 3% of global energy, that’s not meaningfully going to change greenhouse gas emissions. But it is going to drive electricity prices up.”
Wright is also on the board EMX Royalty Corp., a global mining royalties firm, according to his company bio.
Trump named Wright with backing from Continental Resources Chairman Harold Hamm, a Trump energy adviser and donor. Hamm said in an interview with the Houston-based trade publication Hart Energy that Wright was his choice for the job.
If confirmed by Congress, Wright would play a leading role in Trump carrying out his campaign pledge to declare a national emergency on energy. Trump has cast such a declaration as helping increase domestic energy production — including for electricity — which he says is needed to help meet booming power needs for artificial intelligence.
Under the first Trump administration, the Energy Department played a critical role in the president-elect’s efforts to revive US coal power, an initiative he’s hinted he may attempt again.
Wright would also oversee Trump’s promise to refill the nation’s emergency cache of crude oil. The Strategic Petroleum Reserve, which has a capacity of more than 700 million barrels, reached lows not seen since the 1980s following the Biden administration’s unprecedented drawdown of a record 180 million barrels in the wake of Russia’s invasion of Ukraine.
Trump’s first energy secretary, former Texas Governor Rick Perry, called for eliminating the agency entirely during a run for president in the 2012 cycle. He later apologized and vowed to defend the agency “after being briefed on so many of the vital functions” it plays.