Kelowna, British Columbia–(Newsfile Corp. – February 12, 2025) – F3 Uranium Corp (TSXV: FUU) (OTCQB: FUUFF) (“F3” or “the Company“) is pleased to announce that persistent prospective geological characteristics were intersected in the last eight drill holes of the 2024 program focused on continued exploration and expansion of the B1 conductor and A1 extension, as well as further testing of the Harrison Fault area. Geochemistry and assay results from 25 drill holes from 2024 JR Zone and exploration drilling are still outstanding and will be incorporated into the 2025 drill planning and released as they come available.
B1 Conductor:
PLN24-188 tested the B1 conductor 120m north of PLN24-168 (currently the southernmost hole to intersect B1); the drillhole was lost in unconsolidated sand. Retested with hole PLN24-195 which intersected strong bleaching, clay and hematite alteration. PLN24-190 on line 3360S targeted between strong boron anomalies intersected in both PLN24-122 and PLN24-135. The hole intersected strong sandstone dissolution, graphitic faulting in basement and up to 420cps at 568.5m within a hematite altered fault zone. PLN24-193 attempted to test the Athabasca Sandstone above the B1 conductor in an area devoid of previous drilling. The hole intersected strong sandstone alteration and sulfides in the sandstone.
A1 Extension south of Harrison Fault:
PLN24-189 tested the A1 extension on line 3450S approximately 200m along strike south of radioactivity intersected in PLN24-187. The hole intersected 360cps at a depth of 419m and a strongly hematite, clay and sericite rich fault zone from 503.4-537.1m, interpreted to be the continuation of the A1 structure, extending the fault zone to nearly 620m south of Harrison Fault. PLN24-191 was abandoned prior to target depth due to excessive drillhole deviation.
Harrison Fault Area:
PLN24-192 tested the basement wedge along the Harrison Fault between holes PLN24-146 and PLN24-162. The hole successfully intersected the wedge and strong associated alteration, with the lower Athabasca Sandstone displaying strong alteration and dravite breccias (See Image 1). PLN24-194 was planned 100m northeast of hole PLN24-142, testing the Harrison Fault further to the northwest. The hole successfully intersected the fault zone from 266-335.5m containing strong graphite and sulphide alteration. The intersection of the Harrison Fault and the A1 and B1 conductors continues to display very encouraging alteration and large-scale complex structures supported by strong geochemistry, such as in drillhole PLN24-152. The area remains a high priority exploration target.
Map 1. Patterson Lake North, 2024 Scintillometer Results
To view an enhanced version of this graphic, please visit:
https://images.newsfilecorp.com/files/8110/240184_d88abf7e443e3af9_002full.jpg
Table 1. Drill Hole Summary and Handheld Spectrometer Results
To view an enhanced version of this graphic, please visit:
https://images.newsfilecorp.com/files/8110/240184_d88abf7e443e3af9_003full.jpg
Handheld spectrometer composite parameters:
1: Minimum Thickness of 0.5m
2: CPS Cut-Off of 300 counts per second
3: Maximum Internal Dilution of 2.0m
Image 1: Brecciated Athabasca Sandstone in PLN24-192
To view an enhanced version of this graphic, please visit:
https://images.newsfilecorp.com/files/8110/240184_d88abf7e443e3af9_004full.jpg
Natural gamma radiation in the drill core that is reported in this news release was measured in counts per second (cps) using a handheld Radiation Solutions RS-125 scintillometer. The Company considers greater than 300 cps on the handheld spectrometer as anomalous, >10,000 cps as high grade and greater than 65,535 cps as off-scale. The reader is cautioned that scintillometer readings are not directly or uniformly related to uranium grades of the rock sample measured and should be used only as a preliminary indication of the presence of radioactive materials.
Samples from the drill core are split into half sections on site. Where possible, samples are standardized at 0.5m down-hole intervals. One-half of the split sample is sent to SRC Geoanalytical Laboratories (an SCC ISO/IEC 17025: 2005 Accredited Facility) in Saskatoon, SK while the other half remains on site for reference. Analysis includes a 63 element suite including boron by ICP-OES, uranium by ICP-MS and gold analysis by ICP-OES and/or AAS.
The Company considers uranium mineralization with assay results of greater than 1.0 weight % U3O8 as “high grade” and results greater than 20.0 weight % U3O8 as “ultra-high grade”.
All depth measurements reported are down-hole and true thicknesses are yet to be determined.
About the Patterson Lake North Property:
The Company’s 42,961-hectare 100% owned Patterson Lake North Project (PLN) is located just within the south-western edge of the Athabasca Basin in proximity to Paladin’s Triple R and NexGen Energy’s Arrow high-grade uranium deposits, an area poised to become the next major area of development for new uranium operations in northern Saskatchewan. The PLN Project consists of the 4,074-hectare Patterson Lake North Property, the 19,864-hectare Minto Property, and the 19,022-hectare Broach Property. All three properties comprising the PLN Project are accessed by Provincial Highway 955; the new JR Zone uranium discovery on the PLN property is located 23km northwest of Paladin’s Triple R deposit.
Qualified Person:
The technical information in this news release has been prepared in accordance with the Canadian regulatory requirements set out in National Instrument 43-101 and approved on behalf of the company by Raymond Ashley, P.Geo., President & COO of F3 Uranium Corp, a Qualified Person. Mr. Ashley has verified the data disclosed.
About F3 Uranium Corp.:
F3 Uranium is a uranium exploration company, focusing on the recently discovered high-grade JR Zone on its Patterson Lake North (PLN) Project in the Western Athabasca Basin. F3 Uranium currently has 3 properties in the Athabasca Basin: Patterson Lake North, Minto, and Broach. The western side of the Athabasca Basin, Saskatchewan, is home to some of the world’s largest high grade uranium deposits including Triple R and Arrow and poised to become the next major area of high grade uranium operations in the world.
Forward-Looking Statements
This news release contains certain forward-looking statements within the meaning of applicable securities laws. All statements that are not historical facts, including without limitation, statements regarding future estimates, plans, programs, forecasts, projections, objectives, assumptions, expectations or beliefs of future performance, including statements regarding the suitability of the Properties for mining exploration, future payments, issuance of shares and work commitment funds, entry into of a definitive option agreement respecting the Properties, are “forward-looking statements.” These forward-looking statements reflect the expectations or beliefs of management of the Company based on information currently available to it. Forward-looking statements are subject to a number of risks and uncertainties, including those detailed from time to time in filings made by the Company with securities regulatory authorities, which may cause actual outcomes to differ materially from those discussed in the forward-looking statements. These factors should be considered carefully and readers are cautioned not to place undue reliance on such forward-looking statements. The forward-looking statements and information contained in this news release are made as of the date hereof and the Company undertakes no obligation to update publicly or revise any forward-looking statements or information, whether as a result of new information, future events or otherwise, unless so required by applicable securities laws.
The TSX Venture Exchange and the Canadian Securities Exchange have not reviewed, approved or disapproved the contents of this press release, and do not accept responsibility for the adequacy or accuracy of this release.
F3 Uranium Corp.
750-1620 Dickson Avenue
Kelowna, BC V1Y9Y2
Contact Information
Investor Relations
Telephone: 778 484 8030
Email: ir@f3uranium.com
ON BEHALF OF THE BOARD
“Dev Randhawa”
Dev Randhawa, CEO
To view the source version of this press release, please visit https://www.newsfilecorp.com/release/240184


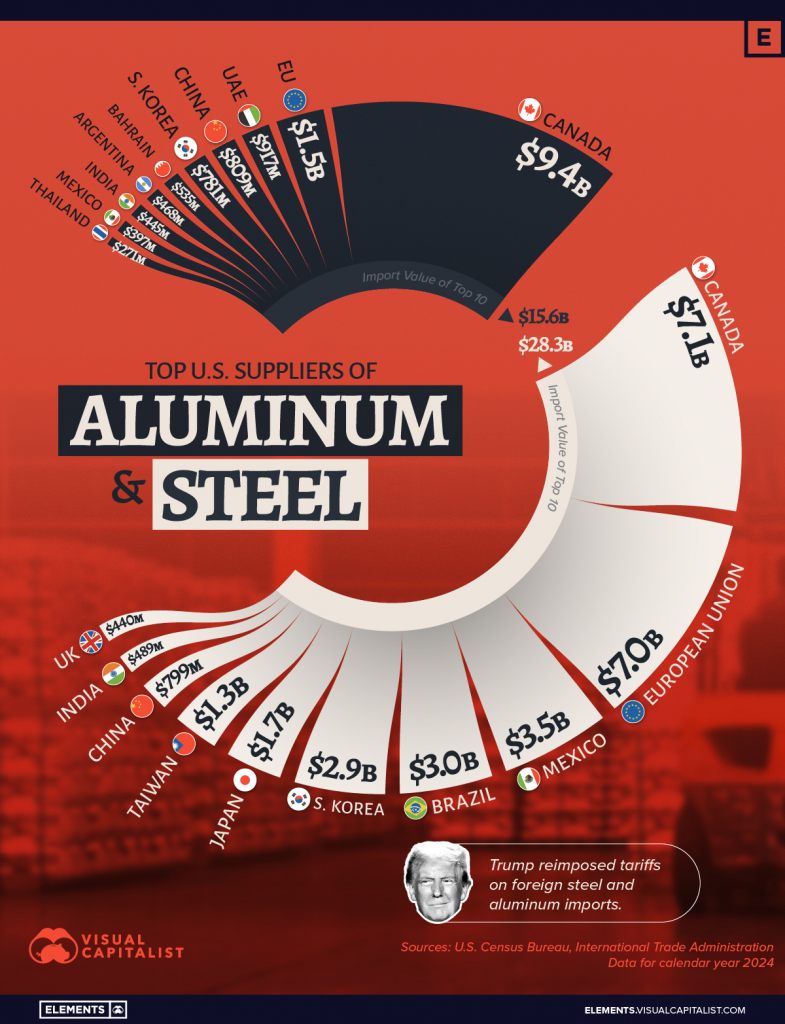
 Canada
 Mexico
 Brazil
 China
China Taiwan
 South Korea
 Germany
 Japan
Japan India
India European Union
 UAE
UAE Bahrain
 Argentina
 Thailand
 UK
UK