Categories
Base Metals Junior Mining Precious Metals Uncategorized

Your Crystal Ball for 2023

No one, has a crystal ball when it comes to the future. But, we wanted to share how you may want to position ourself for the future.

#1 PURCHASE PHYISCAL PRECIOUS METALS

  • Why: As a Savings/Financial Insurance/Protection from Government Stupidity.
  • Where to Buy: Maurice Jackson: https://www.milesfranklin.com/faq-maurice/
  • Frequency: Every 2 Weeks.
  • Percentage of Portfolio: Minimum 10%, but we hold approximately 35% in our portfolio.
Economics in One Lesson, Proven and Probable

GREAT FOUNDATIONAL READINGS:

  • Methodology: Using the Ratio’s.
  • Dow:Gold Ratio is indicating that Gold is on sale relative to the Dow. When the ratio is between 4-5, it is more favorable to be in general equities and real estate. At present the ratio is 1 share of the Dow = 18 oz of Gold.
  • Looking further, Silver and Platinum are on sale relative to Gold.
  • Gold:Silver Ratio At present 1 oz of Gold = 76.5 oz of Silver. When the ratio is between 45-54 trade your Silver in for Gold. Note: Silver Eagles have demanded a significant premium the past 8 months. Which actually reduced the Gold:Silver Ratio inside the 45-54 range.
  • Platinum:Gold Ratio: At present .59 oz of Platinum is = 1 oz of Gold. When the ratio is equal to and or greater than 1, trade your Platinum in for Gold.
  • A great resource on the power of Ratio’s and when to buy and sell is: Bob Moriarty’s: Nobody Knows Anything (Must Read)!
Nobody Knows Anything, Proven and Probable

#2 ROYALTY AND PROJECT GENERATORS

  • Royalty and Project Generators use a unique business model relative to their mining industry peers.
  • Why: They tend to outperform mining exploration companies accretively (Highlighted Below):

ROYALTY COMPANIES: https://www.visualcapitalist.com/sp/how-precious-metals-royalty-and-streaming-companies-create-value

PROJECT GENERATORS: https://www.visualcapitalist.com/project-generators-exploration-risk-lower-cost/

#3 JUNIOR MINING/EXPLORATION COMPANIES

  • These companies are most speculative and offer tremendous upside and conversely a lot of downside. We are biased and are active buyers of our partner/advertisers found (Here). For a deeper dive into the mining/exploration industry: (Must Reads):
  • What Became of the Crow by Bob Moriarty
  • Mineral Exploration and Mining Essentials by Robert Stevens
Mineral Exploration and Mining, Proven and Probable

EXPLORATION COMPANIES: https://www.visualcapitalist.com/mineral-exploration-roadmap/

#4 HOLD YOURSELF ACCOUNTABLE

  • Commit your future to paper. Not having a plan, is a plan. A foolish one, but is a plan. If you don’t have a plan for your savings and investments someone else does. SCHEDULE YOUR PATH.
  • Be willing to study each of the aforementioned. Don’t believe the hype! Don’t get mislead by fancy thumbnails, price predictions, and narratives on manipulation. Is there manipulation? Yes, in every market! Don’t complain about manipulation, learn to leverage manipulation in your favor by realizing you are being offered a discounted price!
  • Be pragmatic, and be patient. Your competition is never patient. They want to price to rise on their schedule, which was yesterday. They will be your best friends, because they have have fast hands and love to sell at the wrong time. If the price goes down, and nothing fundamental has changed with management, the project/s, and or results, there is your buying opportunity!!!
  • Very few investors/speculators are in this space, you don’t have much competition. The best way to beat your competition in this space, is not to follow the herd. Remember, no one get’s it right all the time, you just need to be better than your competition.
Categories
Base Metals Breaking Energy Junior Mining

Copper Is Heading For New Highs- A Bullish Trend In Nevada Copper (NEVDF)

  • Copper corrected from the May record high and made higher lows
  • Four reasons the copper bull will take the price to new highs
  • Impressive price action in the face of Chinese selling
  • Nevada Copper- Three reasons why NEVDF is could outperform percentage gains in the nonferrous metal
  • Bull markets rarely move in straight lines- The next leg for the copper bull has begun

When Goldman Sachs called copper “the new oil” in April 2021, the price was on its way to a new record high at nearly $4.90 on the nearby COMEX futures contract. The world’s most active and liquid copper market on the London Metals Exchange reached a peak at over $10,700 per ton in May. Copper blew through the 2011 $4.6495 previous all-time peak as a hot knife goes through butter.

Even the most aggressive bull markets rarely move in straight lines. Corrections can be brutal when prices accelerate on the upside, reaching unsustainable short-term peaks.

Copper ran out of upside steam before touching the $4.90 per pound level on futures and $10,750 per ton level on LME forwards. The price fell just below the $4 level in August, three months after reaching the high. Copper was still “the new oil” when the price dropped, and the world’s leading copper consumer was hoping it would continue to fall. China has done everything to push copper’s price lower, but the red metal has exhibited remarkable resilience.

Meanwhile, Nevada Copper Corporation (NEVDF) has been working day and night to ramp up production and transform its balance sheet. The market has rewarded the company as the share price has been steadily increasing since the beginning of October.

Mining companies provide investors with leveraged exposure to a commodity as they tend to outperform the price action on the upside and underperform during corrections. Junior mining companies can magnify the leverage. Copper’s recent explosive move suggests that new highs are on the horizon. NEVDF has the potential to do even better on a percentage basis as the company ramps up its production of the red industrial metal.  

Copper corrected from the May record high and made higher lows Copper futures ran out of steam at just below the $4.90 level, with the LME forwards moving the $10,747.50 per ton level for the first time. The May highs led to a substantial correction that briefly took COMEX futures below $4 per pound in August.

Source: CQG The chart shows the decline from $4.8985 in May to a low of $3.9615 in mid-August, a 19.1% correction. COMEX futures made higher lows of $4.0220, $4.0545, and $4.1140 in late September and early October before blasting off on the upside to over the $4.70 level as of October 15.

Source: Barchart

The chart illustrates the decline from $10,747.50 on May 10 to a low of $ 8,740 per ton on August 19 as copper forwards corrected by 18.7%. Copper then made higher lows at $8,810 on September 21 and $8,876.50 on October 1 before exploding higher to the $10,281 level on October 15.

Four reasons the copper bull will take the price to new highs

The four leading factors supporting a continuation of new and higher highs in the copper market are:

  • Rising inflation– CPI rose by 5.4% in September, once again exceeding expectations. While the Fed will likely begin tapering quantitative easing, tapering is not tightening. Moreover, fiscal stimulus continues as the multi-trillion budget will pump more inflationary stimulus into the economy.
  • Building demand– The infrastructure rebuilding package in the US will increase copper requirements for construction projects to rebuild the crumbling roads, bridges, tunnels, airports, schools, and government buildings over the coming years. Moreover, China’s copper requirements will continue to increase as the world’s most populous country builds infrastructure.
  • Decarbonization– Addressing climate change boosts copper demand. As Goldman Sachs said in April, decarbonization does not occur without copper, making the metal “the new oil.” Copper requirements for EVs, wind turbines, and other clean energy projects is a multi-decade affair for the red metal.
  • Supply shortages– Copper mining companies are scrambling to find new supply sources. Production can’t keep pace with demand- It takes eight to ten years to bring new copper mining projects on stream. BHP, a leading global mining company, is in talks with Ivanhoe Mines for participation in the Western Foreland exploration area in the politically dicey Democratic Republic of the Congo.  

Bull markets tend to experience severe selloffs. China has attempted to cool off the bullish copper and other nonferrous metals markets. The world’s leading copper consumer has the most to lose from runaway prices on the upside.

Impressive price action in the face of Chinese selling

On September 1, China auctioned 150,000 tons of copper, aluminum, and zinc from strategic stockpiles, which was the third auction sale since early July, attempting to temper the market’s bullish price action. The market had expected the sales. Copper rallied to the highest level since early August on September 13, with many other base metals following the red metal higher. The price then retreated, but copper made a higher low on September 21. The Chinese auction to cool off the rally put 80,000 tons of copper, 210,00 tons of aluminum, and 130,000 tons of zinc into the market since early July. Since the day of the first auction, copper, aluminum, and zinc prices all posted gains. Imagine where prices might be if China did not sell from its strategic stocks.

In early October, China auctioned the fourth round of base metals, lifting the total sales to 570,000 metric tons. Copper and all the base metals posted explosive gains after the latest auction. China is selling copper, aluminum, and zinc from its strategic stockpiles. The attempt to stem price appreciation makes the Chinese a buyer of the metals on price weakness to replace its stocks. However, the auctions have not had the desired impact on price. The price action has been more than impressive in the face of the sales.

While BHP looks towards the DRC and other regions for new copper supplies, Nevada Copper is making significant headway on its production project in a highly stable political and economic environment in the United States. Moreover, Nevada is a state that continues to encourage mining activity and is rich in red metal reserves.

Nevada Copper- Three reasons why NEVDF has the potential to outperform percentage gains in the nonferrous metal

Nevada Copper (NEVDF) has made great strides over the past weeks and months. A successful junior mining company is positioned best to profit during a bull market in the commodity it extracts from the earth’s crust. Three factors support the price of NEVDF shares as copper has taken off on the upside again:

Factor one: Turing the corner on operations in Q3- On October 6, NEVDF provided an update on operational performance at the company’s underground mine at its Pumpkin Hollow project, noting:

  • Copper in concentrate produced during September increased by 265% compared to August, driven by higher stope production. Approximately 30,386 tons of ore processing yielded 682 tons of copper concentrate at an average grade of 22%, reflecting 150 tons of copper output.
  • Stoping is the process of extracting the desired ore or mineral from an underground mine, leaving open space called a stope. Stoping at Pumpkin Hollow significantly accelerated since mid-August, with the second and third stope panels fully mined and a fourth stope panel currently being mined. Further stopes are planned for October and November, and the high-grade Sugar Cube zone to be mined during the final months of 2021.
  • NEVDF experienced the highest monthly development footage achieved since April 2021 in September, with a 12% increase over August. Approximately 750 lateral equivalent feet were advanced in September.

Outgoing Interim CEO Mike Brown said, “I am very pleased to see the improved trajectory in our production ramp-up and a recovery in productivities. The increased ore production was a key objective for September, and together with the improving productivities on-site, along with the ongoing management strengthening, provide further confidence in the mine ramp-up.”

Randy Buffington, a veteran mining executive with previous management experience at Barrick, Placer Dome, and Cominco, is taking over as President and CEO at Nevada Copper.

Factor two: On October 12, NEVDF announced it had agreed with its senior project lender and concluded a non-binding term sheet with its largest shareholder to provide additional financing and a significant deferral and extension of its debt facilities. The move offers Nevada Copper greater balance sheet flexibility and support for the ramp-up of its underground mining operations and advancement of its open-pit project and broader property exploration targets. The highlights of the more flexible financing arrangement include:

  • Two-year deferral of first loan repayments scheduled to begin in July 2025.
  • Extension of loan amortization with the final maturity pushed to July 2029.
  • Deferral of the formal long stop date for the project as the completion test was deferred to June 2023.
  • All outstanding shareholder loans were consolidated under an amended existing shareholder credit facility.
  • A two-year extension to maturity data until 2026 with no scheduled payments before final maturity.
  • An increase of $41 million in additional liquidity under the amended credit facility.

Randy Buffington, NEVDF’s new CEO, said, “These combined balance sheet improvements provide significant additional runway for the Company as we move forward to complete the ramp-up of our underground operations. The ongoing support of two of our major stakeholders provides further validation of the significant inherent value of our copper operations in Nevada and allows us to continue to pursue the growth potential embedded within our asset base.”

Factor three: NEVDF’s value proposition is compelling when compared to peers. The chart shows NEVDF’s market cap versus its enterprise value compared to other diversified metals and mining companies with similar market caps:

Source: Seeking Alpha

As the chart highlights, the enterprise value is over 2.2 times the current $173.53 million market cap, leading to plenty of upside room for NEVDF shares. There is plenty of room for growth as the enterprise value will rise with output from the underground and open-pit mining operations over the coming months and years. According to data from Seeking Alpha, at 97 cents per share on October 15, NEVDF had a $173.53 million market cap. The average daily volume in the past 15 trading days from all exchanges stood at just over 2,500,000 shares.

Source: Barchart

The chart shows the rise from 38.78 cents on October 1 to a high of 99.2 cents per share on October 14. NEVDF shares closed not far from the high at 96.56 cents on Friday, October 15.

The trend in copper and NEVDF is bullish, and the trend is always your best friend in markets.

Bull markets rarely move in straight lines- The next leg for the copper bull has begun

Bull markets can be bucking broncos as corrections are often downdrafts in prices. Copper’s decline from nearly $4.90 to below $4 and recovery to over $4.70 on October 15 is a bullish sign for the red metal.

Copper’s strength, along with the other base metals in the face of Chinese stockpiling selling, has been more than impressive and is a testament to the bullish factors that are likely to push the price higher. Goldman Sachs expects LME copper forwards to reach the $15,000 per ton level by 2025, putting COMEX futures over $6.80 per pound. Other analysts see the price rising to as high as $20,000 per ton as decarbonization will keep demand outpacing supplies.

Bull markets often take prices far higher than analysts believe possible before they peak. As the world searches for more copper to meet the rising demand, Nevada Copper’s mines are in the most economically and politically stable region of the world. NEVDF shares may have just begun to rally as the price threatens to move over the $1 per share level.

Categories
Base Metals Blog Energy Junior Mining Top Bar

HOT CHILI | Releases Maiden Cortadera Resource Adds 451Mt grading 0.46%CuEq*


Mineral Resource


Corporate Presentation


Hot Chili Drilling

Building a copper super hub in Chile – ASX: HCH

Hot Chili is one of the top ASX listed copper developers with a Leading Global Copper Project with 2.9Mt copper, 2.7Moz gold, 9.9Moz Silver and 64kt molybdenum – Costa Fuego

Hot Chili Limited (ASX.: HCH) ACN 130 955 725
First Floor, 768 Canning Highway, Applecross, Western Australia 6153
PO Box 1725, Applecross, Western Australia 6953
P: +61 8 9315 9009 F: +61 8 9315 5004
www.hotchili.net.au

Categories
Base Metals Energy Exclusive Interviews Junior Mining Precious Metals Top Bar

Find Out Why Rio Tinto just entered into a $45,000,000 Earn-in Agreement with this Explorer

Calibre Mining (TSX: CXB | OTC: CXBMF)


Transcript

In this exclusive interview, Ryan King the VP for Corporate Development and Investor Relations for Calibre Mining shares the value proposition the company presents to the Market. Calibre Mining is a multi-asset gold producer focused on execution and building sustainable value for our shareholders, communities we operate in, and all stakeholders. The company has completed a series of successive accretive transactions for their shareholders which we will address throughout the interview.
First, we will discuss the $45 Million Dollar Earn-In Agreement with Rio Tinto on Calibre’s Borosi Projects which host both gold-silver and copper-gold resources in two areas as well as multiple lesser explored copper-gold skarns, low-sulphidation epithermal gold-silver vein systems and bulk tonnage copper-gold porphyry targets. Second, we will discuss B2Gold And Calibre Mining joininig forces in Nicaragua on the El Limon and La Libertad Gold Mines in addition to completed a CDN$100 Million Equity Financing. Finally, we discuss the expansive, ambitious 40,000 Metre diamond core drilling exploration program that Calibre will be embarking upon on the aforementioned El Limon and La Libertad gold mines. Discover why the value proposition of Calibre Mining is extremely compelling!


Categories
Precious Metals Top Bar

Silver Canadian Maple Leaf Special


NEW YEAR BLOW OUT SPECIALWe Have Silver CANADIAN MAPLES LEAFS On  Special ForONLY $1.99 OVER SPOT BACK DATES SAME DATE PER TUBE OR FULL MINT BOX OF 500 Not Available To Minnesota Residents FREE Domestic Shipping On 500oz Or More Call your Miles Franklin Broker or our Main #855.505.1900


About Miles Franklin Miles Franklin was founded in January, 1990 by David MILES Schectman. David’s son, Andy Schectman, our CEO, joined Miles Franklin in 1991. Miles Franklin’s primary focus from 1990 through 1998 was the Swiss Annuity and we were one of the two top firms in the industry. In November, 2000, we decided to de-emphasize our focus on off-shore investing and moved primarily into gold and silver, which we felt were about to enter into a long-term bull market cycle. Our timing and our new direction proved to be the right thing to do. We are rated A+ by the BBB with zero complaints on our record. We are recommended by many prominent newsletter writers including Doug Casey, Jim Sinclair, David Morgan, Future Money Trends and the SGT Report.

For your protection, regardless of where you live, we are licensed, regulated, bonded and background checked per Minnesota State law.


Miles Franklin801 Twelve Oaks Center DriveSuite 834Wayzata, MN 553911-800-822-8080www.milesfranklin.com

 Copyright © 2019. All Rights Reserved.
Categories
Junior Mining

Ethos Gold Corp. Announces Amended Terms & Increases Size of Flow-Through Financing to Raise $1.5 Million

Ethos Gold

(TSX.V: ECC | OTXQX: ETHOF)

*FOR ACCREDITED INVESTORS ONLY*

Vancouver, British Columbia–(Newsfile Corp. – October 28, 2019) – Ethos Gold Corp. (TSXV:ECC) (“Ethos” or the “Company“) announces that it has revised the terms and size of the non-brokered private placement announced September 20, 2019. Ethos is now proceeding with a flow-through offering to raise gross proceeds of up to $1,512,000 by the issuance of up to 5,600,000 units (each a “FT Unit”) at a price of $0.27 per FT Unit (the “FT Offering”). Each FT Unit will comprise one flow-through common share (a “FT Share”) and one half of one non flow-through common share purchase warrant (each whole warrant, a “Warrant”). Each Warrant will be exercisable at a price of $0.30 into one common share for a period of two years from the date of issuance. The FT Shares will qualify as “flow-through shares” within the meaning of subsection 66(15) of the Income Tax Act (Canada).

For more details click below. If you are qualified and want to participate please reference Proven & Probable and contact the following:

Sherman Dahl

Tel. 250.558.3340

dahl.sherman@pretiumgroup.ca 

Tom Martin
Corporate Communications
Tel: 1-250-516-2455
Email: tmartin@ethosgold.com


Finance Details


Categories
Base Metals Energy Exclusive Interviews Junior Mining

NEVADA COPPER Company on Target to U.S. Copper Production by Q4 2019

Matt Gili the CEO, President, and Director of Nevada Copper (TSX: NCU | OTC: NEVDF) sits down with Maurice Jackson of Proven and Probable to discuss the value proposition of Nevada Copper, which is on target for U.S. production in Q4 2019. Mr. Gili, provides updates on the flagship Pumpkin Hollow Project, which hosts both an underground and open-pit deposits. We provide an overview on the supply an demand fundamentals on Copper, where a prudent speculator may position themselves to take advantage of the copper supply deficit.

VIDEO

AUDIO

TRANSCRIPT

Source: Maurice Jackson for Streetwise Reports  (3/18/19)

Maurice JacksonMatt Gili, CEO of Nevada Copper, talks with Maurice Jackson of Proven and Probable about his company’s progress in beginning copper production by the end of the year.

Pumpkin Hollow

Pumpkin Hollow
Maurice Jackson: Joining us for a conversation is Matt Gili, president, CEO and director of Nevada Copper Corp. (NCU:TSX), which is on target to U.S. copper production by Q4 2019.
Nevada Copper has a number of successes to share with reader. But, before you share the unique value preposition of Nevada Copper, Mr. Gili, for readers who may not be familiar with the supply and demand fundamentals regarding copper, please provide us with a 10,000-foot overview.

Matt Gili: When you look at the copper fundamentals, we see a very steady and predictable increase in demand of copper, modest amount, 1.5% per year. We see the move towards electrification of vehicles consuming more copper. We see other things that are offsetting that, but overall, a steady predictable 1.5% increase in the global demand for copper. Where the story really gets exciting, from the Nevada Copper standpoint, is with regards to the supply for copper. What we’re seeing is a lot of restrictions in future supply. We’re seeing a lot of difficulties on bringing on a future supply and backed up by work done by Wood Mackenzie and others, we’re projecting that by 2025, the world will be in a supply deficit of upwards of 6 million tonnes of copper per year. This just really supports what we’re doing in Nevada Copper in setting up the next copper mine.
Maurice Jackson: Now that we have an overview of the supply and demand fundamentals for copper, Matt, let’s discuss how someone listening may position himself prudently as a beneficiary. For someone new to the story, can you give us a very quick overview of Nevada Copper?

Matt Gili: Certainly. Nevada Copper, who’s Nevada Copper? We have an asset in Nevada called Pumpkin Hollow. This is our chief asset. It consists of two deposits: an underground deposit and an open-pit deposit for copper. We’re currently in the construction phase for the underground project with production from that underground project coming online later this year. I think we’ll talk more about that later. Regarding the open pit, we’re currently in the process of wrapping up the prefeasibility study for the open pit. You’ll see that being published in April of this year. Then, we have a regional land package of well over 15,000 acres that we are looking at really understanding, really unlocking the full value from that land package. That’s really Nevada Copper, building a copper mine coming into production later this year, with a lot of expansion into an open-pit mine, as well as regional exploration.

Maurice Jackson: Let’s provide readers the latest updates on Nevada Copper, as the company has been very proactive on a number of fronts. Please provide us with an update on the construction progress. I would like to begin with the multi-million dollar question, are we on track to enter production in Q4 of this year?
Matt Gili: Yes, Maurice, we are on track to enter production in Q4 of this year. We are very proud of that. The team’s doing a fantastic job. We have construction activities both on surface with Sedgman building the process plants, as well as underground cementation, both sinking shaft and doing lateral development on our main shaft. All that’s coming together very nicely. We are absolutely on track for commissioning of the plant in the fourth quarter of this year.
Maurice Jackson: As Nevada Copper is preparing for production this year, have you increased your staffing to meet the growing demands?
Matt Gili: That’s a really good question and yes, we have. We’ve increased our staffing. It’s an operational readiness question that you’re asking. This is where I want to stress to you and readers that this concept of operational readiness is foremost in our thoughts and how we’re planning for really becoming, not just building a great mine, but operating a great mine. When you look at the staffing, so far, our staffing, by design, is quite modest. We’re looking at a total workforce of Nevada Copper employees of around 30. That is because this is our model, a very lean, efficient operation. We utilize high-quality, expert service providers as necessary, to make sure that we are operating very efficiently.
Maurice Jackson: Is Nevada Copper still actively recruiting and if so, what positions?
Matt Gili: Yes, we are actively recruiting. Most of our positions open are technical and specialist positions, and would be part of the management team. I absolutely encourage anyone interested in what we’re recruiting for to contact the Nevada Copper website. You’ll see the complete listing of opening jobs there, as well as information on how to apply for any of these positions if you’re interested.
Maurice Jackson: Pumpkin Hollow is unique in that you have both an underground and an open-pit mine. Let’s discuss exploration and expansion potential. What initiatives is Nevada Copper taking to optimize the full potential of the Pumpkin Hollow project?

Matt Gili: We are in the process of constructing the underground, which has a large amount of upside potential. We’ll really only explore that upside potential when we’re underground, after we’re in production. We really look forward to updates on that front in 2020, and the reason for that is very simple. It’s just much more efficient to drill out the prospective areas of the underground from the underground; the holes are shorter. It’s just much easier. That’s really where the underground sits right now, in a holding pattern as far as expansion potential. When you look at the open pit, that’s where a lot of great energy is going into expanding the open pit, understanding the open pit better, really getting that ore body knowledge to allow you to build a world-class operation. That is part of the PFS, which is coming out in April of this year.

That PFS will include the drilling campaign that we completed in 2018, the 26 hole drilling campaign. It will include those results in the resource model. That’s going to give you an even better idea of the full potential of the open pit. The real excitement that we have is with regards to the region itself, a large region, relatively unexplored, but with large amounts of historical copper production, as well as great physical outcroppings of copper mineralization. This is really where we’re going to focus our efforts during 2019, to really get a chance, now that we’ve tied up this land package, to understand what we have.
Maurice Jackson: Speaking of the region, there was a regional survey conducted that led you to staking more land. Can you share the results with us?

Matt Gili: We staked a section a land that we refer to as the Teddy Boy Claims. This is about 5,700 acres of land to our northeast. We are very glad to have this in our portfolio. The criteria for that selection was we brought together experts on this region and experts in copper mineralization. They identified that as a really prospective area and where we should be really focused on. We’ve staked that land, secured it for our ability to explore over the next several years.
Maurice Jackson: Does Nevada Copper plan to drill the new area at some point this year?
Matt Gili: We plan on drilling this year. I really haven’t put out the entire drill program for 2019. We’re still pulling that together and analyzing where to best spend the monies we have available for exploration. We would like to drill that this year. Some more prospective holes, really not an in-depth blanket campaign, but probe a few really interesting areas over there and get a better idea for the drill campaign.
Maurice Jackson: It’s one thing to have tonnage and grade, but you must equally have astute business acumen to make the numbers work. Now, Nevada Copper is in discussions regarding an ECA-backed project finance facility to further optimize the balance sheet, as well as lining up a working capital facility and further offtake agreements to improve the economics of Pumpkin Hollow. Please provide us with the details.
Matt Gili: You kind of said it all. I can’t really provide you with any more details, but I can surely stress what you’ve just said, Maurice. We are in discussions with this export, credit agency style backed project financing. This is going to provide us the opportunity to substantially reduce the cost of our debt service, as well as attract strong and robust financial partners for potential future open-pit developments. Something we’re very excited about and it’s part of really creating Nevada Copper as a world-class company.
Maurice Jackson: Let’s get into some numbers. Please share your capital structure.

Matt Gili: The capital structure is well defined. We have $8 million in long-term debt. We have $153 million of cash or cash equivalents. When you look at the financing package specifically for the underground, we’re fully financed, including the working capital facility to take us through operation ramp up. The inputs into that are an equity raise that we did in the middle of last year, as well as a streaming deposit with regards to a stream arrangement on the precious metals strictly from the underground deposit. We also have a $25-million subordinated debt package. Really a standby loan facility that we can use if necessary.
Maurice Jackson: In closing, I have a multilayered question. What is the next unanswered question for Nevada Copper? When can we expect a response? What determines success?
Matt Gili: I would not classify our successful completion of underground construction and bringing them in operation as an unanswered question. That is going to happen, and I’m very proud of the activities that have happened so far. The real unanswered question for the investors out there, is what is the true potential of the open pit? There’s been a lot of great work done, a lot of exploration done, last year. That’s all been incorporated. I’m really going to be excited when the PFS is released and we can share the details of the open pit potential with the public. They are going to be very impressed and they’re going to see the picture. They’re going to see what we see when we get so excited about Nevada Copper.
Maurice Jackson: Speaking of the prefeasibility study, give us a timeline on that, sir.
Matt Gili: We’ll release that in April. I’m being careful. I don’t want to be too specific. It will be in April of this year. Next month.
Maurice Jackson: Mr. Gili, last question. What did I forget to ask?
Matt Gili: Maurice, forget to ask? You’re always very thorough, so I wouldn’t say you forgot to ask anything. What I would say is I want to reiterate something that we at Nevada Copper have been thinking about over the last month. Unfortunately, for the world, the last month has been a month marred with tragedies, with risk and with unexpected events. What we’re really stressing, with Nevada Copper, is the risk management of Nevada Copper. We are an operation that is on private land. We’re not waiting for any permits. We’re not waiting for records of decision. We’re utilizing EPC contractors, who have that fixed price nature, reduced risks. We’re building a dry stack tailing facility. We’ll never have a wet tailing storage facility at Pumpkin Hollow.  We’re doing this all with a proven, experienced team of mine builders and operators. Really wrapping that up, that concept of low risk, risk mitigation. We are going to build and operate the next mine and there’s very little risk to that execution.
Maurice Jackson: Matt, if investors want to get more information about Nevada Copper, please share the website address.
Matt Gili: Absolutely, www.nevadacopper.com. We love to get your input. You’ll see our investor presentationsthere in our latest news. Let us know what you think.
Maurice Jackson: For our audience, we wish to remind you that Nevada Copper trades on the TSX symbol, NCU, and on the OTC symbol NEVDF. For additional inquiries, please contact Richard Matthews at (877) 648-8266 or you may email RMatthews@nevadacopper.com. Nevada Copper is a sponsor and we are proud shareholders for the virtues conveyed in today’s message.
Last but not least, please visit our website, provenandprobable.com, for mining insights and bullion sales. You may reach us at contact@provenandprobable.com.
Matt Gili of Nevada Copper, thank you for joining us today on Proven and Probable.
Maurice Jackson is the founder of Proven and Probable, a site that aims to enrich its subscribers through education in precious metals and junior mining companies that will enrich the world.
Disclosure: 
1) Maurice Jackson: I, or members of my immediate household or family, own shares of the following companies mentioned in this article: Nevada Copper. I personally am, or members of my immediate household or family are, paid by the following companies mentioned in this article: None. My company has a financial relationship with the following companies mentioned in this article: Nevada Copper is a sponsor of Proven and Probable. Proven and Probable disclosures are listed below.
2) The following companies mentioned in this article are billboard sponsors of Streetwise Reports: None. Click herefor important disclosures about sponsor fees.
3) Statements and opinions expressed are the opinions of the author and not of Streetwise Reports or its officers. The author is wholly responsible for the validity of the statements. The author was not paid by Streetwise Reports for this article. Streetwise Reports was not paid by the author to publish or syndicate this article. The information provided above is for informational purposes only and is not a recommendation to buy or sell any security. Streetwise Reports requires contributing authors to disclose any shareholdings in, or economic relationships with, companies that they write about. Streetwise Reports relies upon the authors to accurately provide this information and Streetwise Reports has no means of verifying its accuracy.
4) This article does not constitute investment advice. Each reader is encouraged to consult with his or her individual financial professional and any action a reader takes as a result of information presented here is his or her own responsibility. By opening this page, each reader accepts and agrees to Streetwise Reports’ terms of use and full legal disclaimer. This article is not a solicitation for investment. Streetwise Reports does not render general or specific investment advice and the information on Streetwise Reports should not be considered a recommendation to buy or sell any security. Streetwise Reports does not endorse or recommend the business, products, services or securities of any company mentioned on Streetwise Reports.
5) From time to time, Streetwise Reports LLC and its directors, officers, employees or members of their families, as well as persons interviewed for articles and interviews on the site, may have a long or short position in securities mentioned. Directors, officers, employees or members of their immediate families are prohibited from making purchases and/or sales of those securities in the open market or otherwise from the time of the interview or the decision to write an article until three business days after the publication of the interview or article. The foregoing prohibition does not apply to articles that in substance only restate previously published company releases.
Proven and Probable LLC receives financial compensation from its sponsors. The compensation is used is to fund both sponsor-specific activities and general report activities, website, and general and administrative costs. Sponsor-specific activities may include aggregating content and publishing that content on the Proven and Probable website, creating and maintaining company landing pages, interviewing key management, posting a banner/billboard, and/or issuing press releases. The fees also cover the costs for Proven and Probable to publish sector-specific information on our site, and also to create content by interviewing experts in the sector. Monthly sponsorship fees range from $1,000 to $4,000 per month. Proven and Probable LLC does accept stock for payment of sponsorship fees. Sponsor pages may be considered advertising for the purposes of 18 U.S.C. 1734.
The Information presented in Proven and Probable is provided for educational and informational purposes only, without any express or implied warranty of any kind, including warranties of accuracy, completeness, or fitness for any particular purpose. The Information contained in or provided from or through this forum is not intended to be and does not constitute financial advice, investment advice, trading advice or any other advice. The Information on this forum and provided from or through this forum is general in nature and is not specific to you the User or anyone else. You should not make any decision, financial, investments, trading or otherwise, based on any of the information presented on this forum without undertaking independent due diligence and consultation with a professional broker or competent financial advisor. You understand that you are using any and all Information available on or through this forum at your own risk.
Images provided by the author.
Categories
Base Metals Energy Exclusive Interviews Junior Mining Project Generators

(VIDEO) FISSION 3.0 Prospect Generator in Position for Uranium Turnaround

Ross McElroy the COO and Chief Geologist for Fission 3.0 (TSX.V: FUU | OTCQB: FISOF) sits down with Maurice Jackson of Proven and Probable to discuss the value proposition of Fission 3.0 and their Property Bank. In this interview Mr. McElroy provides the macro economics for uranium and how one may allocate their uranium holdings in a Uranium Project Generator with a Property Bank with projects located in high-grade uranium districts, with proven management and technical team that has a 20 year history of delivering success to shareholders.

VIDEO

AUDIO

TRANSCRIPT


Original Source: https://www.streetwisereports.com/article/2019/03/16/prospect-generator-in-position-for-uranium-turnaround.html
Maurice Jackson: Joining us for a conversation is Ross McElroy, the COO and chief geologist for Fission 3.0 Corp. (FUU:TSX.V; FISOF:OTC.MKTS): A Uranium Project Generator and Property Bank. Ross McElroy, glad to have you back on the program to share the value proposition of Fission 3.0. Before we begin, Ross, I’d like to begin with some basic fundamentals regarding uranium. For someone new to the uranium sector, what is uranium, and where is it used?
Ross McElroy: Uranium is really all about energy. The way we use uranium is for nuclear fuel. That’s basically the fuel that runs reactors.
Globally nuclear power constitutes between 15% and 20% of the electrical requirements. That’s really where the majority of the uranium is used. There is some uranium that’s used for strategic purposes on a country by country basis, more for the Department of Defense reasons. But really, the vast, vast majority of uranium is used to fuel nuclear reactors.
Maurice Jackson: Provide us with some metrics on how abundant uranium is in the Earth’s crust, and correlate that to the average grade that is found versus the grade that is needed to define an ore deposit in a future mine?
Ross McElroy: Well, uranium is actually one of the most abundant elements in the Earth. It’s kind of ubiquitous. You’ll see it throughout the Earth’s crust; there is trace amounts of uranium present primarily in volcanic and igneous rocks and sedimentary rocks.
On a deposit level, there’s actually a number of uranium deposits around the world, in every continent on the planet and in many countries. On a global basis, the average grade of a uranium deposit worldwide is around 0.1 to 0.15% U308.
Now, if you compare that to say, the deposits in Canada, they’re orders of magnitude higher grade in Canada. We’re talking orders of magnitude that are 10 to 20 times that of the global grade.
Although I’ve given you the average grade, most of those deposits at those lower grades, the average grades are really uneconomic deposits. We need grades that are generally much higher than the 0.1%–0.15% if it’s going to be an economic deposit. And that’s what Canada has. Canada has very high-grade deposits, so the economic metrics are just that much more attractive in Canada.
Maurice Jackson: Now that we’ve identified uranium’s utility, what can you share with us from a supply and demand perspective?

Ross McElroy: Well, it’s fairly simple to understand what the demand for nuclear energy is, in other words, uranium. We can just multiply the number of reactors around the world that are currently operating, and the known fuel consumption rate for a 1000 megawatt reactor is just under 500,000 pounds of uranium a year. If we look at the global reactors, there are around 450 reactors around the world. You can see that the need for uranium on an annual basis is around the realm of almost 200 million pounds of uranium.
Maurice Jackson: How does the nuclear plant in Fukushima, Japan, fit into this narrative?
Ross McElroy: Japan historically, up until the Fukushima event in 2011, was one of the main users on a country basis worldwide. Japan I think consumed almost 20% of the world’s nuclear power, in other words, 20% of the world’s annual production of uranium was used to run the Japanese reactors.
In 2011, of course, we had the magnitude 9 earthquake followed by a tsunami, and that’s what damaged the Fukushima facility. Interestingly enough, even with that magnitude of an earthquake and the soon-to-follow tsunami, the reactor still did not breach. The housing that surrounded the reactor was damaged, and this is where some of the radiation leaks came from, but the reactor itself actually held, and so the damage was actually very, very limited and manageable.
What happened is overnight, Japan shut down all of its nuclear reactors, in other words, all 52 reactors I think they had working at that time, went offline. That caused disruption to the supply/demand situation globally.
What’s happened since then is Japan is slowly coming back on. Japan’s alternatives for power are pretty limited as the country doesn’t have very much of its own resources, if any at all. It imports whatever energy that it needs, be it in natural gas now, in nuclear.
It’s important for Japan to be able to operate these factories that they’re running. I mean, it’s an exporting country around the world, so it does have high energy requirements. It also has the requirements for inexpensive power.
Japan is coming back on to the scene as far as nuclear power. There are eight reactors that are currently back up and operating, and 17 reactors that are in the near-term licensing for approval to get them restarted again.
I think the bottom line is, prior to Fukushima, Japan depended on nuclear energy for at least 25% of its electricity demands. I think by the time 2030 approaches, Japan is supposed to be right back up to those same levels. The country is coming back on, it has always been an important major consumer of nuclear power. I think we’ll see it right back to the equation again in the very near future.
Maurice Jackson: Uranium, next to gold, is known as the other yellow metal, and here’s why. Ross, let’s step back to the bull market in uranium. If one was selective with the uranium holdings, they would’ve had generational changes in their portfolio. What was the spot price during the last bull market?

Ross McElroy: Well, in 2002, uranium was around, I don’t know, about $15 a pound. This is on the spot market. That’s what uranium was trading for.
In 2003–2004, we really saw the lift off of the price of uranium. In fact, it peaked at 2007 to around $140 a pound. It went almost a 10-fold increase in the price of the commodity between 2003 and 2007. The peak at 140 didn’t last particularly long, but it had a slower decline until about 2008—2009, it stabilized, and then it peaked back up again.
Really, it was holding steady. I guess this is the point I would want to make, is that we were starting to see a steady state price of between $50 to $70 a pound, and then the Fukushima event hit that we talked about in 2011, and that really threw the whole pricing structure right out the window. We’ve been working on our recovery ever since.
Maurice Jackson: What is the spot price for uranium today?
Ross McElroy: Currently we’re about $28 a pound for uranium. It has recovered; we’re off the bottoms of $17, $18 a pound just a couple of years ago. Uranium is making its way back.
Maybe the important point here to note is we’re still at prices that the majority of mines around the world are not profitable. Even the lowest cost producers are really not operating in an environment where they can make money with uranium prices what they’re at right now.
What we’ve seen is that the supply is starting to be restricted as the producers are taking a lot of that uranium off market; they’re not supplying it to the utilities at this cheap price, because it’s not a working business model to lose money in the long run on the mining of the commodity.
We are seeing an improvement in the price of uranium, and it’s been about a year and a half in the making. It’s gone up from the $18 that I mentioned to about $28 a pound, but it certainly has a lot more room to move upwards even before we can start to get production back online to meaningful levels.
Maurice Jackson: What is that spot price that companies right now, uranium companies I should say, for them to earn their cost of capital? Is the number around $60 for a spot price of uranium?

Ross McElroy: I believe you are correct. We’re seeing prices that globally, they have to be in the $60 to $70 a pound really to bring on any meaningful production.
One of the clues that I look at when we look at the best uranium mines out there, the lowest cost producers, those would be McArthur River deposit in Canada’s Athabasca Basin in Northern Saskatchewan. That is one of the best uranium mines in the world, certainly the largest highest-grade operating mine. Cameco took that offline because of the prices of uranium where they were at, they weren’t making any money on the mining of this deposit.
There are some indications that Cameco won’t turn that mine back on into being a producer until the price of uranium is somewhat north of $40, maybe $45. Something in that realm.
I don’t have an exact number there, but it does tell you that if you’re going to even bring back the best of those deposits, you really need prices that are something of $40 to $45. As we mentioned earlier, the price for many of the other deposits around the world are probably closer to $60 or $70. You can see, there’s still lots of room for improvement.
Maurice Jackson: The current price of uranium does not support the fundamentals. What correlations do you see today that may exceed the returns from the last bull market?
Ross McElroy: Well, it’s sort of an elastic situation. I think that the longer that we keep depressed prices, yet the demand is still there and growing, reactors are being built, the need to fuel these reactors, that’s not stopping.
In fact, it’s growing. You have the primary suppliers of uranium, i.e., the mines that are not supplying it, the longer that the prices are low, the more rapid that climb will be in the price of uranium when it does correct.
I think there’s a possibility, as I’ve heard some analysts call it, a violent reaction upwards to the price of uranium. I think we’re going to see some substantial price increases within some short vision of time, maybe a year or two or three. Something in that realm that I think will be quite meaningful.
We’ll see what happens, but the longer it stays depressed, the more likely and quicker the rise will be when it does come.
Maurice Jackson: Ross, you’ve provided a compelling case on the fundamentals for uranium. I know readers may be asking, how will all of this demand for uranium be met? Mr. McElroy, please introduce us to Fission 3.0.
Ross McElroy: Fission 3.0 is a uranium explorer. This is a company that we spun out of Fission Uranium Corp. (FCU:TSX; FCUUF:OTCQX; 2FU:FSE), our larger company, back in 2014 when we bought out our partner on the Patterson Lake project, and in so doing with that process from that arrangement, we spun out our non-core assets, the more grassroots exploration projects.
We’ve been able to build up an exploration portfolio, primarily focused in the Athabasca Basin. Remember, the Athabasca Basin is Canada’s only producing uranium field. That’s where the McArthur River deposit is, this is where Fission Uranium has the Triple R deposit. There’s some fantastic deposits out there.
That’s what we’re exploring for in Fission 3.0. We’re looking for the next high-grade uranium deposit in the Athabasca Basin.
Maurice Jackson: You referenced that you’re a project generator. There’s a lot of ambiguity regarding project generators. Please share the virtues and why Fission 3.0 took on the project generator business model?
Ross McElroy: Project generators are really all about sharing the risk. In our case, what we do very well is pick ground. We’ve been able to strategically stake ground in the Athabasca Basin, we’ve made discoveries on two of our properties, the first one in the company called Fission Energy that we made the discovery at our Waterbury Lake property, and later on in Fission Uranium Corp on our PLS property.
That have been situations where we’ve had joint-venture partners sharing the risks, sharing the costs with others. To use the model, what we do is we use our brands and other peoples’ money. That’s really what we’re good at, that’s basically the model that we have.
We have a very highly trained technical team that’s exceptional at picking out high-quality projects. We attract other people who are looking to get into the uranium business, looking to partner up with a team such as ours and join us for the ride to make a discovery.
It’s really all about sharing risk. That’s really what the project generator model does. It’s our land, and we partner with good quality people that can fund a project, and that’s how they earn into it as well.
Maurice Jackson: Do you currently have a joint-venture partner? If yes, who and what are the terms of the relationship?
Ross McElroy: We have had joint-venture partners in the past, and very successful ones. As I mentioned earlier on our Waterbury project, we had a partner with the Korean utility called KEPCO. It earned in by spending a certain amount of money on the property each year over the course of a three-year period.
What we did with that, we were able to make a discovery, using the money in that project, we made a discovery, built up the resource estimate on there, and eventually sold that asset. That was how our shareholders were able to take advantage of our monetizing on the property.
I guess we could say the same at the PLS project, which we now own 100% of it, but that was also a partnership. We shared in the risk early on and in the money early on with our partner. We eventually bought them out in 2014. That was another example of a successful joint venture partnership.
Each one of the deals would be a little bit different from each other. It is a model that we think works very well. I will note that in our property down in Peru as well, we have a partnership that we’re still looking to finalize the deal. This is one where another group has approached us, said it’s interested in the potential of a property down in Peru. It will spend a significant amount of money having us as the operator. Hopefully we’ll make a discovery down in Peru as well.
Maurice Jackson: Well, you’ve just alluded to my next question. Fission 3.0 has 18 projects in its project bank. Now, it is strategically located in premier, high-grade uranium districts in Canada and Peru. Mr. McElroy, introduce us to the Fission 3.0 Project Bank (click here).

Ross McElroy: We have 18 properties in the Athabasca Basin. Our properties, we think that everywhere in the Athabasca Basin has the potential to host high-grade uranium projects.
One of the keys that we seek to identify are deposits that will be shallow. In other words, the closer a deposit is to surface, the easier it is to build a case that this could be a project that could go into production. It’s an easier mine to develop the closer it is to the surface.

Really deep deposits are challenging. They still exist, but they’re challenging. Eventually they cost more money to find and cost more money to get out of the ground. They’re just another level of challenge.
If you look at our 18 properties, they’re all in and around the edge of the Athabasca Basin, where we’ve had a great deal of success finding near-surface mineralization.
Our PLS project that hosts the Triple R deposit in Fission Uranium is a great example of a near-surface deposit. The mineralization starts at 50 meters below the surface, so 150 feet below the present-day surface is where the high-grade mineralization starts. That makes it a potentially open-pit deposit, which is generally low cost and gives you a lot of flexibility.
This is the sort of thing that we’re looking for in Fission 3.0. We’ve got very good properties that are in known mining districts, conversely, we have a good portfolio of ground around the southwest side of the basin where our PLS project in Fission Uranium is hosted, and also NexGen’s Arrow deposit, it’s all in that same area. We have the significant land package that surrounds that area.

We also have a good strategic land package in and around the Key Lake area on the southeast side of the basin. This has been, and still currently is the hot bed of uranium mining in Canada right now. This is the side of the basin where the McArthur River and Cigar Lake deposits are located.

McArthur shut down for economic reasons waiting for higher uranium prices. It was an operating mine up until about a year ago, and Cigar still is in operation. You’ve also got the Key Lake mine.
It’s a strategic area to have a good land package. We think there’s lots of opportunities in and around land in that area to make a new discovery.

And probably third for us is the land package that’s up in the northwest side of the basin, in the old uranium city Beaverlodge district where uranium mining in Saskatchewan first got started back in the 1950s and was the going concern back in the ’50s and the ’60s, I think there were about 52 operating mines up in that area, pretty small scale most of them, but still lots of high-grade uranium. That’s an area where we think that there’s still plenty of exploration potential.
Between all those areas, we’re going to be active and we’re going to be looking for the next high-grade uranium deposit in Saskatchewan.
Maurice Jackson: Speaking of being active, is there active drilling going on right now in these projects?
Ross McElroy: There is active drilling. We did drill in the southwest side of the basin. We were drilling in January on our PLN project. That project is just immediately north of Fission Uranium’s PLS project.
You’re really talking about the same area where the latest discoveries have been found, where you’ve got the Triple R deposit, you’ve got NexGen’s Arrow deposit. These are two of the best new deposits that have been found in the Athabasca Basin in the last 15 years.
We have a package around there called PLN, and we did drill six holes in there earlier this year. It has the potential to host another one of these fantastic deposits, so we are going to continue looking there. We see all the signs present that tell us that this is where we’ll make that discovery.
As we’re speaking right now, we’re drilling over in the Key Lake area that I described earlier. This is over on the southeast side of the basin, about 200 kilometers to the east of the PLS drilling. That is a program where we’ll drill probably eight or nine holes, just south of the Key Lake Mill and the old historical Key Lake deposits. There’s areas of activity there. We’ll continue drilling throughout the rest of 2019 on a number of our projects.
Fission 3.0 is active. We were able to raise some significant money early in the year, in late 2018. We’re going to be active. This is how we’ve been successful in the past, is by being aggressive, looking in places where people probably haven’t looked for a while or never even thought to look, and putting our technical team to work. Yes, you’ll see pretty good news flow out of Fission 3 this year.
Maurice Jackson: Ross, let’s expand the narrative on the project bank portfolio and go south into Peru. What can you share with us there?

Ross McElroy: Peru is a really interesting area. Where our projects are is called the Macusani Plateau, located in southern Peru, near the Bolivian border. The Macusani Plateau has shown at least over 100 million pounds in near-surface uranium deposits.

There’s a company down there that’s quite dominant called Plateau Energy. Plateau has been able to stake a lot and consolidate a land package in the area, and consolidated all these old deposits. It has amassed around 100 million pounds of uranium in these uranium deposits.

However, even more significant, Plateau made a discovery of high-grade lithium in the same area, and in fact, that’s within five kilometers of our southern property boundary on our Macusani plains. Not only do we have the potential now to host near-surface uranium deposits, and we have shown in fact that we do have mineralization on our property for uranium, we’ve mapped it, we’ve drilled, we’ve trenched and found high-grade uranium, but now the potential’s there for hosting high-grade lithium.
This is really a new dimension that we have down in that area, that we wouldn’t have had say, two or three years ago when we were last down drilling. You’ve got uranium, and now we have lithium. It’s a very interesting up-and-coming area as well.
Maurice Jackson: Switching gears, Fission 3.0 has the right projects in the right place at the right time. But that’s only part of the story. Equally important are the people that are responsible for increasing shareholder value. Mr. McElroy, please introduce us to your board of directors.
Ross McElroy: Thank you, and I appreciate that. We do have a very successful team. Our founder of Fission 3.0 is also the same CEO and founder of Fission Uranium, and previously Fission Energy before that, and Strathmore.
Dev Randhawa has been involved in this company right from the get-go in its first iteration back in 1996, and also heading up Fission 3.0. Dev is the longest running CEO in the uranium sector.
Myself, I’ve been involved with Dev 12, 13 years now. We’ve had a great successful relationship. We’re able to raise money, raise attention, put that money to work, make discoveries, and basically build shareholder value right from the bottom up.
This is the group that I think, we’ve been able to deliver in the past, and we’re going to be able to deliver shareholder value as we move forward in this much improving uranium sector.
A lot of the same players that we’ve had all the way along, still keep also in the Fission 3 group.
Maurice Jackson: Who is on your management team?

Ross McElroy: The management team is composed of our CEO Dev Randhawa and chairman. I am the chief operating officer, and also the chief geologist. We have maintained the same structure that we have in Fission Uranium, is the same that we have in Fission 3.0. It’s a fairly lean team. Phil Morehouse is president of Fission 3.0. We kept a pretty lean mean machine in Fission 3.
Don’t forget, we’ve had up until just recently in the last six months, it’s been a very quiet company, there hasn’t been a lot of exploration activities in the uranium sector. I think as we start to ramp up, with our level of activity increasing, we’ll start to draw more and more people into roles and developing roles within the company as we begin to be active, get out and start marketing the story more, get on the ground and back that up with real results, we’re going to continue to build our team.
Maurice Jackson: Before we move on to your impressive technical team, in the natural resource basis, why is it wise to follow proven winners? Ross, you alluded to it earlier, you and CEO Dev Randhawa have a proven pedigree of success. How were shareholders rewarded as far as returns for their loyalty to sticking with your team?
Ross McElroy: Well, if you owned the original company at the beginning, which would’ve been Strathmore Minerals, and you’d held on it to all the way throughout, over the last 20 years since about 1996, 97, you’d probably own about five different companies right now.
What’s happened is we’ve moved on to a new phase, we’ve made discoveries, advanced projects, sold different projects to different groups. What we’ve been able to do is form new companies, split off new companies in what they call a butterfly transaction.
You have shares in the new company, still maintain your shares in the old company, so you would’ve received essentially what would look like dividends in the way of different shares for five different companies since that time. The shareholders that have been loyal and sticking with us would’ve succeeded quite handsomely all the way along.
Maurice Jackson: Your technical team is exceptional. I had an opportunity to meet them in the summer of 2016 at the site visit there. Please, introduce us to them.
Ross McElroy: We’re very, very proud of this group. This has been the team we’ve had, the same core group of people with us since 2010. With that same group, we were able to make our discovery on the Waterbury Lake project, and then followed up in 2012 with the discovery of PLS. It’s the same group that is very core and important to us in Fission 3.0.
I do head up the team and the technical group, so I would be the team leader or chief geologist for the technical team. My right hand guy is Raymond Ashley, he’s the VP of exploration. Ray is an excellent geoscientist who I’ve had the pleasure to work with for over 30 years in this sector, so we’ve been working pretty close together. Definitely a proven mine finder.
We’ve basically held the same group of people together on the project managers, all the structural scientists, geochemists. We’ve kept the same core group together over the last almost 10 years or so.
To me, that’s really the key. You want a team that works together well, good chemistry with each other, the ability and the environment to think outside of the box. Really, the goal for each and every one of us is to responsibly make world-class discoveries. That’s what we’re all about.
We’ve got an excellent team. All the key people are listed on the website. You’ll be able to go there and see the roles of the various groups there in the technical team, but there’s about seven or eight of us that have been able to be what I consider the core team for the last decade or so.
Maurice Jackson: Let’s get into some numbers. Please share your capital structure.

Ross McElroy: In Fission 3.0, we have 142 million shares outstanding. We were able to raise a significant amount. We have just under $7 million in the treasury right now, that’ll allow us to be active over the next two years or so.
Maurice Jackson: What is your burn rate?
Ross McElroy: The burn rate, because it’s exploration, it’s pretty discretionary spending. We have $7 million that we have in the treasury right now, that’ll certainly carry us over the next two to three years of pretty aggressive exploration spending on our key projects. We can dial that kind of number up, and we can dial it back as conditions warrant. That’s the benefit of being in exploration.
The burn rate is actually pretty minimal. In other words, we run a pretty lean shop as far as the number of management and corporate costs. Really, the majority of the costs are exploration spending, which is really entirely discretionary.
Maurice Jackson: How much debt do you have?
Ross McElroy: We have no debt. We’ve not taken on any debt. Basically, the money that we raise have been through equity share offerings. No debt in Fission 3.0.
Maurice Jackson: Who are your major shareholders? What is their level of commitment?
Ross McElroy: When we spun off Fission 3.0 back in December of 2014, it was the same shareholders that were shareholders of Fission Uranium, were the same shareholders in Fission 3.0. We would’ve had a lot of the same loyal, large shareholders, including JP Morgan, even investment from others that we’ve had along the way. It’s been the same loyal group.
We have significant new shareholders now with the financing that we did back in 2018, which was led by the Sprott Global Resources Group out of California. I think we have some new players back to the game, but we have a lot of shareholders that have been with us over the long haul.
These are people that have a good vision of the uranium sector. They know that the good times are around the corner. It’s a point that we believe really strongly, and we think that the sector is improving a great deal.
This is how our loyal shareholders are going to be rewarded, by being a much better market with an aggressive team like Fission 3.0, and the new shareholders will probably be long term loyal shareholders too if we’re successful and able to build value for them as well.
Maurice Jackson: What is the float?
Ross McElroy: Fully diluted, we have 227 million shares. We’ve got shares outstanding, we’ve got options and warrants that we’re a part of financing as well, so 227 million shares out in total. We trade around 240,000 shares a day, I think that’s our average volume.
Maurice Jackson: Multi-layered question. What is the next unanswered question for Fission 3.0? When can we expect a response? What determines success?
Ross McElroy: Well, we are going to be successful through work. We know that a better market should buoy the price up of everybody involved in the nuclear sector. They’re starting to get some life back in the exploration world.
Really, we’ve always built value by our success. We’ve been successful with making discoveries. We now have the money, we have the team, we’re putting them to work. I would look to us as being one of the most dynamic uranium explorers out there. That’s something that I think people can follow, they can see our news release cycle, they’ll see how we’re marketing our story, and just look at the results. I think they’ll speak for themselves.
We’re looking at our projects, we’ll be active throughout the calendar year. I think the news flow will be very strong and steady. People that are interested in following the company will always see that there’s a continuing narrative out there. We want to take advantage of this and improve the uranium market, the fact that we are well financed, and we have the properties that we want to explore. I think there’s a very good opportunity for readers to look at Fission 3.0 as a sector leader in the uranium exploration business.
Maurice Jackson: Mr. McElroy, last question. What did I forget to ask?
Ross McElroy: I think we’ve covered a lot of ground here, and a lot of important ground. One of the takeaways that I want readers to know is we really do believe in the nuclear sector. We think that we have turned the corner and that conditions are improving.
If people are looking to invest in the uranium sector, I think it’s important for them to look at a group that has done it before. Your track record is very indicative of what your future has the potential to look like. I always find myself, when I’m investing, I like to back teams with a proven track record.
We have that in our group. We’ve got an exceptional management team. We’ve done it before. We’ve been able to capitalize on our discoveries by selling assets. We have a unique technical team that has the ability to make discoveries.
So better sector, very good team. Strong management. Those are the ingredients we need to be successful.
Maurice Jackson: Ross, for someone listening that wants to get more information about Fission 3.0, please share the website address.
Ross McElroy: Our website address is www.fission3corp.com.
Maurice Jackson: For direct queries email ir@fission3corp.com, or you may call (778) 484-8030. Fission 3.0 trades on the TSX:V, symbol FUU, and on the OTC, symbol FISOF.
For audience, we’ve been proud shareholders of Fission 3.0 since 2014. Last but not least, please visit our website, provenandprobable.com, for mining insights and bullion sales. You may reach us at contact@provenandprobable.com.
Ross McElroy of Fission 3.0, thank you for joining us today on Proven and Probable.
Maurice Jackson is the founder of Proven and Probable, a site that aims to enrich its subscribers through education in precious metals and junior mining companies that will enrich the world.
Disclosure: 
1) Maurice Jackson: I, or members of my immediate household or family, own shares of the following companies mentioned in this article: Fission 3.0. I personally am, or members of my immediate household or family are, paid by the following companies mentioned in this article: None. My company has a financial relationship with the following companies mentioned in this article: None. Proven and Probable disclosures are listed below.
2) The following companies mentioned in this article are billboard sponsors of Streetwise Reports: None. Click herefor important disclosures about sponsor fees.
3) Statements and opinions expressed are the opinions of the author and not of Streetwise Reports or its officers. The author is wholly responsible for the validity of the statements. The author was not paid by Streetwise Reports for this article. Streetwise Reports was not paid by the author to publish or syndicate this article. The information provided above is for informational purposes only and is not a recommendation to buy or sell any security. Streetwise Reports requires contributing authors to disclose any shareholdings in, or economic relationships with, companies that they write about. Streetwise Reports relies upon the authors to accurately provide this information and Streetwise Reports has no means of verifying its accuracy.
4) This article does not constitute investment advice. Each reader is encouraged to consult with his or her individual financial professional and any action a reader takes as a result of information presented here is his or her own responsibility. By opening this page, each reader accepts and agrees to Streetwise Reports’ terms of use and full legal disclaimer. This article is not a solicitation for investment. Streetwise Reports does not render general or specific investment advice and the information on Streetwise Reports should not be considered a recommendation to buy or sell any security. Streetwise Reports does not endorse or recommend the business, products, services or securities of any company mentioned on Streetwise Reports.
5) From time to time, Streetwise Reports LLC and its directors, officers, employees or members of their families, as well as persons interviewed for articles and interviews on the site, may have a long or short position in securities mentioned. Directors, officers, employees or members of their immediate families are prohibited from making purchases and/or sales of those securities in the open market or otherwise from the time of the interview or the decision to write an article until three business days after the publication of the interview or article. The foregoing prohibition does not apply to articles that in substance only restate previously published company releases.
Proven and Probable LLC receives financial compensation from its sponsors. The compensation is used is to fund both sponsor-specific activities and general report activities, website, and general and administrative costs. Sponsor-specific activities may include aggregating content and publishing that content on the Proven and Probable website, creating and maintaining company landing pages, interviewing key management, posting a banner/billboard, and/or issuing press releases. The fees also cover the costs for Proven and Probable to publish sector-specific information on our site, and also to create content by interviewing experts in the sector. Monthly sponsorship fees range from $1,000 to $4,000 per month. Proven and Probable LLC does accept stock for payment of sponsorship fees. Sponsor pages may be considered advertising for the purposes of 18 U.S.C. 1734.
The Information presented in Proven and Probable is provided for educational and informational purposes only, without any express or implied warranty of any kind, including warranties of accuracy, completeness, or fitness for any particular purpose. The Information contained in or provided from or through this forum is not intended to be and does not constitute financial advice, investment advice, trading advice or any other advice. The Information on this forum and provided from or through this forum is general in nature and is not specific to you the User or anyone else. You should not make any decision, financial, investments, trading or otherwise, based on any of the information presented on this forum without undertaking independent due diligence and consultation with a professional broker or competent financial advisor. You understand that you are using any and all Information available on or through this forum at your own risk.
Images provided by the author.

Categories
Junior Mining Precious Metals

ROVER METALS | Firm Advancing Gold Exploration in the Northwest Territories


Judson Culter the CEO and Director of Rover Metals (TSX.V: ROVR | OTCQB: ROVMF) sits down with Maurice Jackson of Proven and Probable to discuss the value proposition of the Cabin Lake Property. In this interview Mr. Culter will provide important updates on the Uptown Gold Property, Cabin Lake Project, and Slemon Lake. Rover Metals is a natural resource exploration company specialized in Canadian precious metal resources (specifically gold). In this interview we will discuss the recent accomplishments of Rover Metals. Ranging from IPO and the implementation of a methodical process of building an exploration company that is positioning itself for success from land acquisitions, permit approval, OTC listing, option agreements and completed the first phase of the 2018 exploration program.

VIDEO

AUDIO

TRANSCRIPT

Original Source: https://www.streetwisereports.com/article/2019/03/10/firm-advancing-gold-exploration-in-the-northwest-territories.html

Firm Advancing Gold Exploration in the Northwest Territories Contributed Opinion

Source: Maurice Jackson for Streetwise Reports  (3/10/19)

Maurice Jackson

Judson Culter, CEO of Rover Metals, speaks with Maurice Jackson of Proven and Probable about historical exploration on his company’s properties, as well as current exploration plans.

Gold exploration
Maurice Jackson: Welcome to Proven and Probable. I’m your host, Maurice Jackson, and joining us for our conversation is Judson Culter, the CEO and director of Rover Metals Corp. (ROVR:TSX.V; ROVMF:OTCQB). Mr. Culter, welcome to the show.
Judson Culter: Thanks for having me, Maurice.
Maurice Jackson: Glad to have you back on the program. We last spoke in January of 2018, and since then Rover Metals has completed its IPO and implemented a methodical process of building an exploration company that is positioning itself for success from land acquisitions, permit approval, OTC listing, option agreements and completed the first phase of the 2018 exploration program. But before we begin, Mr. Culter, for first time listeners, who is Rover Metals?
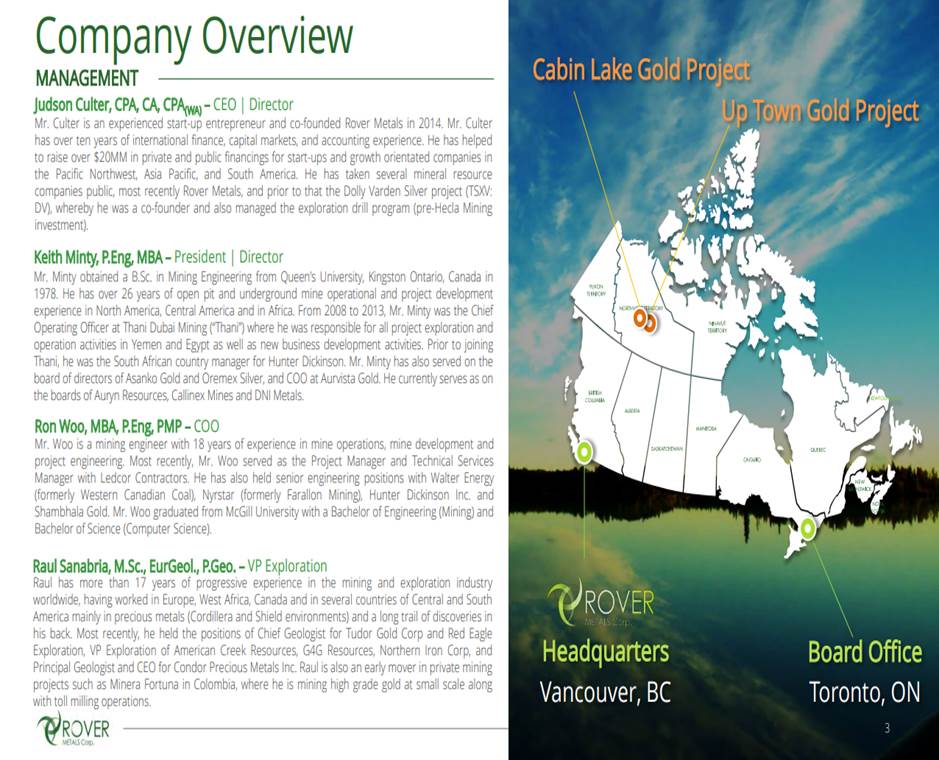
Judson Culter: Rover Metals, we are a precious metal exploration company, specifically gold is our focus currently. We’re co-listed in the United States OTCQB: ROVMF, as well as Canada on the TSX.V ROVR. Our project portfolio is concentrated in and around Yellowknife’s Northwest Territories, one of the most mining friendly jurisdictions in Canada and for North America for that matter. I say that just because that’s where our (Canada’s) diamond mines are. That’s historically where several of our gold mines have been. It’s really the primary employer in the Northwest Territories. Outside of government, mining is it.
Maurice Jackson: Why has Rover Metals received so much interest here of lately?
Judson Culter: I think that’s a two pronged answer. First is just credibility. Going back to 2017 on call with you, Maurice, if one listens to that interview, we talked about how we were going to go public, and how we were going to drill our resources, and how we were going to look to add new resources in the similar area code of Yellowknife.
We’ve successfully accomplished all those tasks. I believe we have strong foundational base in our existing shareholders. We’ve got a lot of credibility with them. We get a lot of word of mouth. I think that goes a long way in a market that can be a little bit over saturated in the junior mining space with which projects or which management teams do you back. I think really that we’ve gotten recognition for that now, which is really helping to drive our current success.

The second prong answer speaks to the projects themselves. Rover has the Cabin Lake Project, which is really what the market is asking for, and that’s why we bought it. When we receive the results from our drilling, we believe we will a high-grade gold historical resource that will contain super high grades that the market wants to see as confirmation that this really could be the next gold mine in the Yellowknife, Northwest Territories.

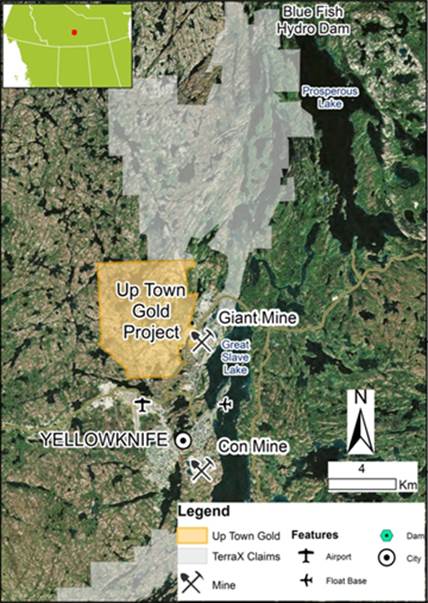
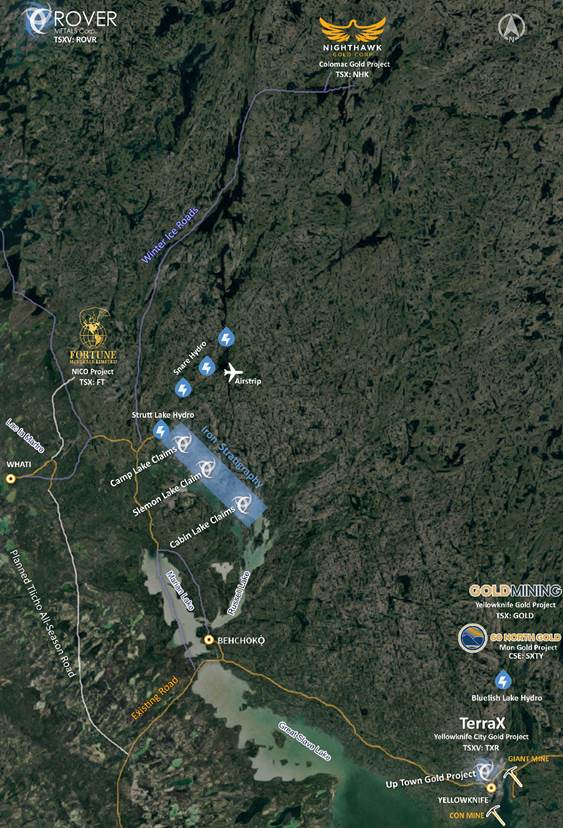
Not to mention this project itself has all the merits a speculator wants. We have solid infrastructure, the Blue Fish Hydro Dam, roads, all the accessibility and proven area of past producers. The market is beginning to recognize the credibility of the management team and the assets. Also, the awareness that we are near drilling in the not-too-distant future has investors’ attention as well.
Maurice Jackson: Justin, what is the driving thesis for Rover Metals in regards to the Kevin Lake gold project?
Judson Culter: The driving thesis has not changed. It’s the same thesis as in the late 1980s. There’s a project called the Lupin Gold Mine that produced from 1983 to 2003 in the north, which is an iron formation, super high-grade gold. The thought at the time was to go and find another one, and that’s what they thought they had here. This is when Cominco and Freeport McMoRan and then Aber Resources, that’s what they thought they had here. They drove 7,500 meters of at or near-surface iron hosted high-grade gold. The only reason they stopped is because somebody found kimberlites a few years after, and the diamond boom in the Territories began.
This project just kind of sat on the back burner as a result of that. Aber Resources, the owner of the time, of course, went on to find the kimberlites. That’s some historical context on this project and why it’s just now coming back to life.
Maurice Jackson: Talk to us about the business acumen here. When and how was Rover Metals able to acquire the Cabin Lake gold project in such a highly contested and sought out district?
Judson Culter: It wasn’t easy; when we looked at the business case, we figured that with a little bit of just rolling up our sleeves, and getting up there, and meeting the right stakeholders, and just recognizing that this is an area that needs new mines and new projects.
I didn’t think it would be like other areas in British Columbia, for example where BC, trying to get First Nation endorsement can be very difficult. There’s so many competing industries that people can really make a way of life in a jurisdiction like British Columbia, whereas knowing a little bit about the Northwest Territories, mining is a big deal up there. People want to see projects succeed.
When we went into the Cabin Lake project, we knew we had to get a couple of things there to get permits. We knew we had to get our neighbors, Tlicho First Nations, on board. We also did our homework and knew that the Tlicho First Nations had previously worked with Fortune Minerals, as well as Nighthawk Gold. When we got to it, there was a framework in place. There was a government that had been formed.
The Tlicho government and the land use formal plan to work within, for application permits, and applications. So, once we got to it, it ended up only being four months to get it permitted. I think it seemed to keep getting easier for us, and it ended up being a decision that looks like it was the right one to make.
Maurice Jackson: Regarding mineral rights in your project portfolio, are there any reversionary interests?
Judson Culter: There’s a 1.5% NSR that we’ve got viable down to a half percentage point for CA$250,000 per quarter percentage.
Maurice Jackson: And does Rover Metals own the mineral rights outright 100%?
Judson Culter: That’s correct. Yes, not just at Cabin Lake, but at the Cabin Lake group of projects. The claims themselves are 10 kilometers apart; so there’s three of them. For the entire group of projects, yes, we have 100% mineral right interest.
Maurice Jackson: Let’s fast forward to 2018 and discuss your exploration program. What were the results from that program and how has that improved the confidence in the gold project?
Judson Culter: It helped us to better track the iron information. So what we did was we spent the six months from March, when we acquired the project, into October, really to digitize all the historical records. At the time in the 1980s, that was meticulously kept, and it was handwritten. We digitize seven banker boxes of data, as well as three map boxes. Then, we put that in a GPS, and tag the colors and everything else.
Then what we wanted to do to follow on with that data was to run a current, modern-day geophysical program. There were a lot of options to us to do it, but in a really economical manner, but also to do it in a very detailed type formation using a drone. Because the mineralization occurs at or near surface, as well as the iron information itself being at or near surface, it really showed up well on the magnetic survey that we flew over the property. So by interlaying the drill results, as well as the mag survey, our geologist was able to get a better interpretation of the iron formation throughout the project. Really, that really set the stage for where we are going to put the drill when we get to drilling this year in 2019.
Beyond just the iron information, what we also realized about the project is the outcropping on either side is quartz. Historically, the quartz had never been tested for mineralization. So we also did a geochemistry program in October. What that showed us is that the PPM and PPB reading of gold from the quartz outcrop area suggest that it’s also very likely to be a host for gold on this project. It’s never been tested historically. That’s the excitement of 2018 and what’s led into the 2019 drill program, which was always trying to be between March and the end of April. We’re still trying to hold on to that deadline.
We’ve got the collars is ready to go. Right now, we believe what we need to do to start drilling is conduct a small financing that we’ll probably release in the coming week or two here.
Maurice Jackson: So to review the value proposition we had before. This is potentially an open-pitable, early-stage brownfield exploration gold project with historical high-grade resource next to a new cobalt-gold mine, is that correct?
Judson Culter: Yes, and that’s one thing I didn’t touch on is the actual historical resource itself. That’s 85,000 ounces unconfirmed in terms of what our current standards allow us to document as a historical resource. What we’re allowed to document in press releases and everything else is 50,000 ounces of roughly 10 to 12 grams gold per ton. The rest of that 35,000 ounces was never signed off by a Qualified Person, but it is in the NORMIN database in the Northwest Territories. It’s in the areas of the Andrew zone, which we’ve documented. Rover will do the work we need to do under 43-101 standards to take that other 35,000 ounces and get it compliant.
From our side internally, we see it as an 85,000 ounce of resource of 12 grams per ton gold on average. When we talk about it publicly, we have to say, 50,000 from a historical resource perspective, but you’re absolutely right that we’re 20 kilometers away from what’s looking to be Canada’s first cobalt mine. The reason I say that is this project’s been 20 years in the making; it’s at the feasibility stage. I believe they’re really just looking to raise the capital to get to work. It’s an open-pitable cobalt mine. The good news is it’s actually a cobalt gold bismuth. So there is a gold processor that’s going to be built 20 kilometers from us. What better news can you possibly have when you’re developing an at-surface resource?
Maurice Jackson: The location in of itself makes the opportunity quite interesting, but to have open pit to me is icing on the cake. Is the goal to sell the project or develop into a commercial scale mine?
Judson Culter: Definitely the goal is to sell it within the next three years, and so I want to put $10 million in the ground, and let’s get this wrapped up and sold. End of story.
Maurice Jackson: What can you share with us regarding the infrastructure?
Judson Culter: So what you see in Yellowknife right now is what’s going to be coming in the pipeline in the next two to three years in the Pine Point Zinc mine is going back into production and that’s Osisko. Part of that is twining the costs in Taltson Hydro Dam and bringing that into Yellowknife itself, as well as Hay River. There’s going to be federal funding allocated, as well as territorial, to do an environmental study that should be announced through fairly short order this year.
After there is a federally funded environmental study to evaluate the twinning of the Taltson Hydro Dam, a successful outcome will lead into a hydro power upgrade to Yellowknife. When Yellowknife is upgraded, that will free up excess hydro power at the Snare and Strutt Lake hydro dams, located approximately 5km away from Camp Lake, one of our claims that’s part of the Cabin Lake group. That power becomes excess power. All of a sudden that frees up for the future the viability of really selling the project because now you’ve got excess power sitting right there, five kilometers away. How good is that?
Maurice Jackson: Switching gears. Rover Metals’ board of directors and advisors consists of the following people:
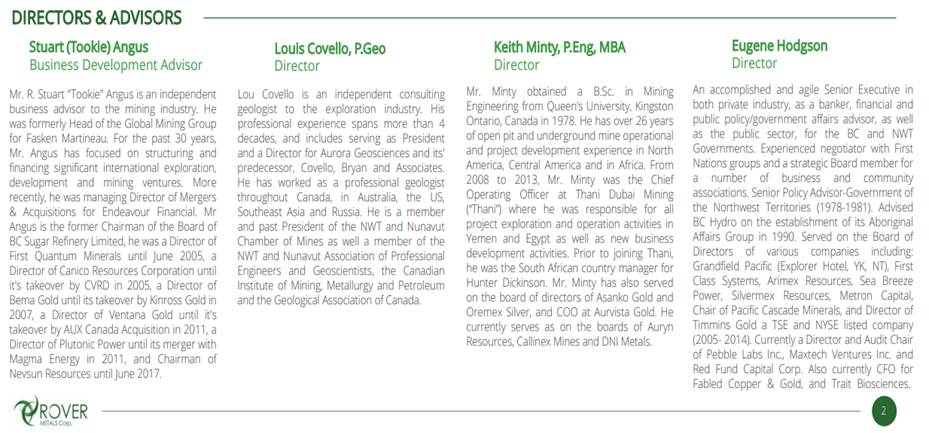
Maurice Jackson: Bios for the management time are below:

Maurice Jackson: Let’s discuss some numbers. Please share your capital structure.
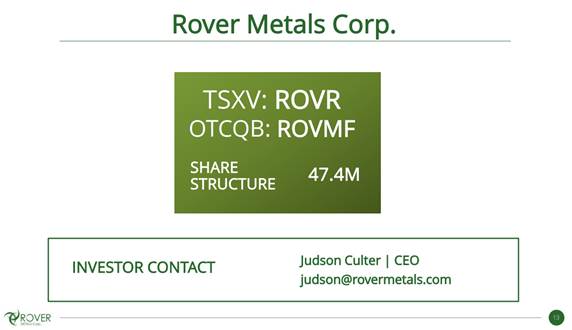
Judson Culter: We’ve got 47 million shares out today. That’s our issued and outstanding common shares. There are warrants out there. We have 10 million warrants at $0.20 cents, and 10 million warrants at $0.25 cents.
Maurice Jackson: How much cash and cash equivalents do you have?
Judson Culter: Treasury is sitting today around CA$450,000. Then, there’s been some prepayments for upcoming work commitments regarding our exploration plans for this year, as well as I mentioned, we’re doing a lot of our growth in terms of our marketing and our shareholder base in the United States. I think our prepaid balance, if you were to look at that today, should be around CA$200,000, just in terms of for events, as well as I mentioned, exploration planning. If you add that back to our cash position, we’re around CA$650,000 in current assets.
Maurice Jackson: What is your burn rate?
Judson Culter: Our burn rate’s about CA$30,000 a month, and that just includes all in. We purposely don’t carry an office in this market. We’re a bootstrap company. We have home offices, and then we’re on the road a lot. We’ve got an exploration office that is free from our exploration partner, Aurora Geosciences. That’s really where a lot of the hard work gets done. Then, there’s just no corporate office. I don’t feel the need for that, so that helps.
Maurice Jackson: How much debt do you have?
Judson Culter: We have some trade payables of, I think it’s roughly CA$40,000 that we’re going to settle in shares. Outside of that, we’ve got CA$25,000 in payables on top of that, that we’re going to pay in cash. That’s just some exploration legacy from last year.
Maurice Jackson: Who is financing the project, and what is their level of commitment?
Judson Culter: Just sophisticated mining investors. It’s been high net worth, accredited investors to this point. That will continue until we become a $10 million market cap company plus, because we’re just still not able to access institutional funds, and that’s fine. If Rover does everything that we hope to accomplish in the next drilling phase, which we hope is in the next 60 to 90 day window here, we should be a $10 million market cap plus company; and well on our way to institutional money.
Maurice Jackson: Who are the major shareholders?
Judson Culter: I’m a major shareholder. I’ve been seeding Rover not just with time, but my own money; since really inception in 2014. Tookie Angus, who is an advisor, is currently our third largest shareholder. Then, it really starts to break down to smaller tranches, but there is a notable name on the list: Ashwath Mehra, the chairman of GT Gold; he’s a relatively large shareholder.
Management, including Ron Woo. Ron’s also seeded this company. I think Ron’s probably fourth largest shareholder. Keith Minty’s a large shareholder; 38% of our outstanding shares are owned by insiders, management, board. That’s a good thing because that means our shares are tied up for three years.
Maurice Jackson: Judson, based on the data available, what type of value proposition do we have in comparing?
Judson Culter: Well, the market price, let’s just say, I think it should be $8.5 million, just on what we set out today. That’s my personal opinion. I think later value that, that’s just the reality of reserve stocks in North America. We’re going to do what we need to do to take that historical resource and bring it up to current standards, as well as to just extend where they stopped drilling, and just show them this really is a multimillion ounce potential asset.
I think we can get there with the drill program that we’re planning. We’re planning roughly a thousand meter program. I think the value proposition is we’re in a $3.5 million market cap today. I think we’re going to take it to $10 to 15 million in the next six months. Hold me to that.
Maurice Jackson: I certainly will, sir. Multi-layered question here: what is the next unanswered question for Rover Metals? When can we expect the response? How much will the response cost? What determines success?
Judson Culter: That’s going to be our Q1 or Q2 exploration drill campaign. I was going to caveat that, that is subject to the future success of our financing effort (click here), which we hope to announce in roughly two weeks’ time.
That will lead into confirmation of the historical high-grade gold results, such as the open-pit economics, expand upon the known mineralization in the iron formation, as well as to prove up a larger area play and this is more Q2/Q3 work, for the Slemon Lake, and Camp Lake claims, which are located 10 kilometers northwest from Cabin Lake, and we’ll fly that with an aerial B10 survey. What that will show is that the drilling we’ve done at Cabin Lake in the iron formation really just, those other two claims, or districts, an extension of the same geology, which everything that we’ve read historically shows us it is.
Maurice Jackson: Mr. Culter, please share the contact details for Rover Metals.

Judson Culter: Please visit our website www.RoverMetals.com. On there, you’ll find our social media links, which are LinkedInTwitter, our Facebook page and CEO.ca.
Our social media channels really have daily content. We’re press releasing every couple of weeks, but a lot of our investors like really the daily updates on what’s going on in the Northwest Territory. That’s the best place to stay tuned.
You can also submit to our mailing list. We typically will do an email update every two weeks as well. If you go to the bottom of the homepage on the website, and just submit your email, that subscribes you to our email mailing list.
Maurice Jackson: And last but not least, please visit our website, provenandprobable.com, for mining insights and bullion sales. You may reach us at contact@provenandprobable.com.
Judson Culter of Rover Metals, thank you for joining us today on Proven and Probable.
Maurice Jackson is the founder of Proven and Probable, a site that aims to enrich its subscribers through education in precious metals and junior mining companies that will enrich the world.

Like this article? Sign up to receive the FREE Streetwise Reports’ newsletter.
 Newsletter Sign-Up

Disclosure: 
1) Maurice Jackson: I, or members of my immediate household or family, own shares of the following companies mentioned in this article: Rover Metals. I personally am, or members of my immediate household or family are, paid by the following companies mentioned in this article: None. My company has a financial relationship with the following companies mentioned in this article: None. Proven and Probable disclosures are listed below.
2) The following companies mentioned in this article are billboard sponsors of Streetwise Reports: None. Click herefor important disclosures about sponsor fees.
3) Statements and opinions expressed are the opinions of the author and not of Streetwise Reports or its officers. The author is wholly responsible for the validity of the statements. The author was not paid by Streetwise Reports for this article. Streetwise Reports was not paid by the author to publish or syndicate this article. The information provided above is for informational purposes only and is not a recommendation to buy or sell any security. Streetwise Reports requires contributing authors to disclose any shareholdings in, or economic relationships with, companies that they write about. Streetwise Reports relies upon the authors to accurately provide this information and Streetwise Reports has no means of verifying its accuracy.
4) This article does not constitute investment advice. Each reader is encouraged to consult with his or her individual financial professional and any action a reader takes as a result of information presented here is his or her own responsibility. By opening this page, each reader accepts and agrees to Streetwise Reports’ terms of use and full legal disclaimer. This article is not a solicitation for investment. Streetwise Reports does not render general or specific investment advice and the information on Streetwise Reports should not be considered a recommendation to buy or sell any security. Streetwise Reports does not endorse or recommend the business, products, services or securities of any company mentioned on Streetwise Reports.
5) From time to time, Streetwise Reports LLC and its directors, officers, employees or members of their families, as well as persons interviewed for articles and interviews on the site, may have a long or short position in securities mentioned. Directors, officers, employees or members of their immediate families are prohibited from making purchases and/or sales of those securities in the open market or otherwise from the time of the interview or the decision to write an article until three business days after the publication of the interview or article. The foregoing prohibition does not apply to articles that in substance only restate previously published company releases.
Proven and Probable LLC receives financial compensation from its sponsors. The compensation is used is to fund both sponsor-specific activities and general report activities, website, and general and administrative costs. Sponsor-specific activities may include aggregating content and publishing that content on the Proven and Probable website, creating and maintaining company landing pages, interviewing key management, posting a banner/billboard, and/or issuing press releases. The fees also cover the costs for Proven and Probable to publish sector-specific information on our site, and also to create content by interviewing experts in the sector. Monthly sponsorship fees range from $1,000 to $4,000 per month. Proven and Probable LLC does accept stock for payment of sponsorship fees. Sponsor pages may be considered advertising for the purposes of 18 U.S.C. 1734.
The Information presented in Proven and Probable is provided for educational and informational purposes only, without any express or implied warranty of any kind, including warranties of accuracy, completeness, or fitness for any particular purpose. The Information contained in or provided from or through this forum is not intended to be and does not constitute financial advice, investment advice, trading advice or any other advice. The Information on this forum and provided from or through this forum is general in nature and is not specific to you the User or anyone else. You should not make any decision, financial, investments, trading or otherwise, based on any of the information presented on this forum without undertaking independent due diligence and consultation with a professional broker or competent financial advisor. You understand that you are using any and all Information available on or through this forum at your own risk.
Images provided by the author.

Categories
Blog

ROVER METALS Announces Private Placement Financing

VANCOUVER , March 4, 2019 /CNW/ – Rover Metals Corp. (ROVR.V) (ROVMF(“Rover Metals” or the “Company“) is pleased to announce its intention to complete a non-brokered private placement of units (the “Units“) at a purchase price of $0.08 per Unit, for aggregate gross proceeds of up to CAD$1,250,000 (the “Offering“). Each Unit shall consist of one common share in the capital of the Company (a “Common Share“) and one Common Share purchase warrant (a “Warrant“).  Each Warrant shall entitle the holder to acquire an additional Common Share at a price of $0.15 per share for a period of 24 months following the date of issuance.

Rover Metals anticipates using 80% of the proceeds of the Offering to finance exploration activities at the Cabin Lake Gold Project and remaining use of proceeds for general and administrative expenses.

The Company may pay finder’s fees in accordance with the policies of the TSX Venture Exchange in connection with the Offering.

Rover Metals anticipates relying, in part, on the exemption from the prospectus requirements provided in BC Instrument 45-534 – Exemption From Prospectus Requirement For Certain Trades to Existing Security Holders (the “Existing Shareholder Exemption“).  The Company may also rely on other available prospectus exemptions.

Rover Metals has set March 1, 2019 as the record date for determining shareholders entitled to participate in the Offering in reliance on the Existing Shareholder Exemption. If the Offering is over-subscribed, Units will be allotted on a first come first served basis. Qualifying investors who wish to participate in the Offering should contact the Company using the contact information set forth below. It is anticipated that the Offering will close in one or more tranches commencing on or about March 15, 2019 .

All securities issued under the Offering will be subject to a hold period of four months and a day from the distribution date, in accordance with applicable securities laws.  Completion of the Offering is subject to the receipt of all applicable approvals, including the approval of the TSX Venture Exchange.

About Rover Metals
Rover Metals is a natural resource exploration company specialized in gold that is currently focused on the Northwest Territories of Canada , one of the most mining friendly jurisdictions in North America . The Cabin Lake Group of High Grade Gold Projects are located within 20km of Fortune Minerals’ (FT.TO) planned NICO Project gold processor.

You can follow Rover Metals on its social media channels Twitter: https://twitter.com/rovermetals, LinkedIn: https://www.linkedin.com/company/rover-metals/, Facebook: https://www.facebook.com/RoverMetals/, and CEO.ca: https://ceo.ca/rovr for daily company updates and industry news.

ON BEHALF OF THE BOARD OF DIRECTORS OF ROVER METALS
“Judson Culter”
Chief Executive Officer and Director

Statement Regarding Forward-Looking Information

This news release contains statements that constitute “forward-looking statements.” Such forward-looking statements involve known and unknown risks, uncertainties and other factors that may cause Rover’s actual results, performance or achievements, or developments in the industry to differ materially from the anticipated results, performance or achievements expressed or implied by such forward-looking statements. Forward looking statements are statements that are not historical facts and are generally, but not always, identified by the words “expects,” “plans,” “anticipates,” “believes,” “intends,” “estimates,” “projects,” “potential” and similar expressions, or that events or conditions “will,” “would,” “may,” “could” or “should” occur.  Forward-looking statements in this document include statements regarding Rover’s expectations regarding the issuance of Units and receipt of regulatory approval therefor and the use of proceeds from the Offering. There can be no assurance that such statements will prove to be accurate. Actual results and future events could differ materially from those anticipated in such statements, and readers are cautioned not to place undue reliance on these forward-looking statements. Any factor could cause actual results to differ materially from Rover’s expectations. Rover undertakes no obligation to update these forward-looking statements in the event that management’s beliefs, estimates or opinions, or other factors, should change.

THE FORWARD-LOOKING INFORMATION CONTAINED IN THIS NEWS RELEASE REPRESENTS THE EXPECTATIONS OF THE COMPANY AS OF THE DATE OF THIS NEWS RELEASE AND, ACCORDINGLY, IS SUBJECT TO CHANGE AFTER SUCH DATE. READERS SHOULD NOT PLACE UNDUE IMPORTANCE ON FORWARD-LOOKING INFORMATION AND SHOULD NOT RELY UPON THIS INFORMATION AS OF ANY OTHER DATE.  WHILE THE COMPANY MAY ELECT TO, IT DOES NOT UNDERTAKE TO UPDATE THIS INFORMATION AT ANY PARTICULAR TIME EXCEPT AS REQUIRED IN ACCORDANCE WITH APPLICABLE LAWS.

NEITHER THE TSX VENTURE EXCHANGE NOR ITS REGULATION PROVIDER (AS THAT TERM IS DEFINED IN THE POLICIES OF THE TSX VENTURE EXCHANGE) ACCEPTS RESPONSIBILITY FOR THE ADEQUACY OF THIS RELEASE

View original content:http://www.prnewswire.com/news-releases/rover-metals-corp-announces-non-brokered-private-placement-of-up-to-cad1-250-000–300805708.html

Categories
Base Metals Energy Junior Mining Precious Metals

Minaurum Drills High-Grade Silver in 250 m Step-Out at Alamos Silver Project: 12.35 m of 408 g/t AgEq, including 3.20 m of 1,277 g/t AgEq

Vancouver, British Columbia–(Newsfile Corp. – February 10, 2026) – Minaurum Silver Inc. (TSXV: MGG) (OTCQX: MMRGF) (“Minaurum”) is pleased to report results from the first holes of its Phase 2, 50,000-meter resource-expansion drill program at the Alamos Silver Project (“Alamos”) in Sonora, Mexico. The program is targeting the Europa, Promontorio, and Travesia vein zones and has returned multiple high-grade silver intersections (Table 1, Figures 1-4).

Highlights include:

  • 12.35 m of 408 g/t silver equivalent (“AgEq”), including 3.20 m of 1,277 g/t AgEq (Hole AL25-163)
  • 2.35 m of 374 g/t AgEq (Hole AL25-153)

“Hole AL25-163 confirms the continuity of high-grade silver mineralization well beyond the current inferred resource in the Europa Vein Zone,” said Darrell Rader, President and CEO of Minaurum Silver. “Stepping out 250 metres and intersecting strong grades and widths demonstrates the scale of the system. With the mineralization remaining open both down dip and along strike, these results support our strategy to significantly expand the Alamos resource with continued drilling.”

Europa Vein Zone

The defined resource of the Europa vein zone occupies about 1 km of its surface-traced 3-km strike length. Recent assay results extend high-grade mineralization along strike, particularly the 1 km extension to the south at Europa. Hole AL25-163 intersected a significant wide interval of 12.35 m zone averaging 408 g/t AgEq, including 3.20 m of 1,277 g/t AgEq (1,032 g/t Ag, 0.278 g/t Au, 0.692% Cu, 5.477% Pb, 2.379% Zn). Hole AL25-154 returned 1.05 m of 231 g/t AgEq, including 0.25 m of 700 g/t AgEq (355 g/t Ag, 1.86 g/t Au, 1.45% Cu, 0.77% Pb, 1.89% Zn) (See Table 1, Figures 2 and 3).

Figure 1. Plan view showing locations of Travesia, Quintera, Promontorio, and Europa vein zones. Click to enlarge.

To view an enhanced version of this graphic, please visit:
https://images.newsfilecorp.com/files/3455/283231_figure%201%20-%20plan%20view%20vein%20zones.png

Figure 2. Longitudinal section of Europa vein zone, showing locations of highlighted mineralized intersections. Click to enlarge.

To view an enhanced version of this graphic, please visit:
https://images.newsfilecorp.com/files/3455/283231_96b44d1b04e0a91d_004full.jpg

Figure 3. Cross section of Europa and Nueva Europa vein zones, showing hole AL25-163. EV=volcanic rocks, CZ=marble and skarn, GR=granodiorite. Click to enlarge.

To view an enhanced version of this graphic, please visit:
https://images.newsfilecorp.com/files/3455/283231_figure%203%20-%20cross%20section%20europa.png

Table 1. Assay Highlights for Europa Vein Zone – Europe Sur, Europa and Europa Norte. Hole locations are shown in Figure 2 and 3.

Weight-averaged silver-equivalent grades are based on 1) October 1, 2025 Long-term CIBC Global Mining Group Analyst Consensus Commodity Price Forecast: Ag $29.73/tr oz, Au $2,646/tr oz, Cu $4.34/lb, Pb $0.92/lb, Zn $1.21/lb; 2) Metallurgical recovery assumptions:88.3% for Ag, 88.5% for Au, 75.5% for Cu, 83% for Pb, and 75% for Zn; and 3) Refinery payable assumptions: 95% for Ag, 95% for Au, 96.5% for Cu, 95% for Pb, and 85% for Zn.

EUROPA SUR
HoleFrom
(m)
To
(m)
Interval
(m)
Ag
g/t
Au
g/t
Cu
%
Pb
%
Zn
%
AgEq
g/t
AL25-15499.50100.651.15950.010.190.321.11143
131.55131.750.203490.050.310.481.58425
220.20221.251.051320.450.440.250.69231
including
220.20220.450.253551.861.450.671.89700
263.70265.201.5040.870.010.020.2089
AL25-155174.25175.351.10570.090.120.741.59125
AL25-156440.30441.000.70350.000.090.401.1375
AL25-157245.10248.453.35430.020.110.300.9080
including
247.15248.100.951070.070.160.892.22193
AL25-15845.7547.301.55410.000.020.120.1149
AL25-163280.20292.5512.353180.090.351.600.90408
including
280.20287.207.005230.140.442.781.36659
which includes
280.20283.403.2010320.270.695.472.371277
and
285.80287.201.401490.050.380.900.68220
and
289.80292.552.75850.020.390.050.42132
AL25-164121.45123.001.5541.20.000.020.080.0346
AL25-166255.35255.700.3546.40.000.230.471.19102
280.30281.351.051100.050.850.140.36199
including
281.00281.350.351550.122.410.310.92402
AL25-167289.40289.750.35640.020.180.100.75101
298.35298.850.502360.050.270.781.77318
EUROPA
HoleFrom
(m)
To
(m)
Interval
(m)
Ag
g/t
Au
g/t
Cu
%
Pb
%
Zn
%
AgEq
g/t
AL25-150368370.252.251070.020.201.611.55193
including
368.5369.050.552720.030.264.721.84432
AL25-152161.5166.14.6770.070.320.391.15144
including
164.5165.450.95900.110.630.491.74202
AL25-153129.05131.42.352400.060.701.761.46374
including
130.85131.40.554870.160.954.252.09714
AL25-164121.45123.001.5541.20.000.020.080.0346
EUROPA NORTE
HoleIDFrom
(m)
To
(m)
Interval
(m)
Ag
g/t
Au
g/t
Cu
%
Pb
%
Zn
%
AgEq
g/t
AL25-162450.00450.400.40480.010.170.470.6888

Promontorio Vein Zone

The 1 km-long Promontorio vein zone consists of multiple veins including the Veta Grande and Veta Las Guijas veins. Drilling to date at Promontorio and Promontorio Sur has intersected mineralization in epithermal vein-hosted cutting volcanic and intrusive rocks in addition to skarn/carbonate-replacement (CRD) mineralization hosted by limestone in the footwall of the vein zones. Hole AL25-159 continued mineralization and intersected 4.40 m of 154 g/t AgEq including 1.35 m of 189 g/t AgEq in an epithermal vein (Table 2, Figure 4).

Travesia – La Quintera Vein Zones

The Travesia vein zone lies to the north of the Promontorio zone and continues north in the hanging wall of the La Quintera vein zone. Hole AL25-165 aimed at the Travesia and La Quintera vein zones in the northern part of the Travesia-Quintera zone, and intersected narrow but encouraging mineralization of 0.95 m of 148 g/t AgEq, including 0.40 m of 221 g/t AgEq in the extension of the Travesia vein.


Figure 4. Longitudinal section of Travesia-Promontorio vein zones, showing locations of highlighted mineralized intersections. Click to enlarge.

To view an enhanced version of this graphic, please visit:
https://images.newsfilecorp.com/files/3455/283231_figure%204%20-%20traves%C3%ADa-promontorio%20long%20section.png

Table 2. Assay Highlights for Travesia-Promontorio Vein Zone. Hole locations are shown in Figure 4.

Weight-averaged silver-equivalent grades are based on October 1, 2025 Long-term CIBC Global Mining Group Analyst Consensus Commodity Price Forecast: Ag $29.73/tr oz, Au $2,646/tr oz, Cu $4.34/lb, Pb $0.92/lb, Zn $1.21/lb. Metallurgical recovery assumptions applied are 88.3% for Ag, 88.5% for Au, 75.5% for Cu, 83% for Pb, and 75% for Zn. Refinery payable assumptions applied are 95% for Ag, 95% for Au, 96.5% for Cu, 95% for Pb, and 85% for Zn.

PROMONTORIO
HoleFrom
(m)
To
(m)
Interval
(m)
Ag
g/t
Au
g/t
Cu
%
Pb
%
Zn
%
AgEq
g/t
AL25-151390.85391.350.5320.000.030.230.0240
AL25-159102.35106.754.40280.040.321.033.43154
including
104.60105.951.35350.030.371.014.62189
AL25-161182.30182.800.5096.30.160.180.220.63145
AL25-162450.00450.400.40480.010.170.470.6888
TRAVESIA
HoleFrom
(m)
To
(m)
Interval
(m)
Ag
g/t
Au
g/t
Cu
%
Pb
%
Zn
%
AgEq
g/t
AL25-16572.8073.750.951050.000.370.230.24148

Share Issuance Update

The Company wishes to clarify its news release filed on December 11, 2025 and material change report filed on December 18, 2025. The aggregate number of units issued pursuant to the Company’s brokered private placement which closed on December 11, 2025 was understated by one unit and the Company now wishes to correct this disclosure to reference a total of 69,444,443 units (previously disclosed as 69,444,442 units). In addition, insider participation was understated by one unit and should be corrected to a total of 191,223 units (previously disclosed as 191,222 units). Please refer to the Company’s December 11, 2025 news release for additional details relating to the private placement.

Follow us and stay updated:

YouTube: @MinaurumSilver
X: @MinaurumSilver
LinkedIn: MinaurumSilverInc
Subscribe to our email list at www.minaurum.com

Minaurum Silver Inc. (TSXV: MGG) (OTCQX: MMRGF) (FSE: 78M) is focused on advancing and expanding its high-grade, 100% owned, production-permitted Alamos Silver Project in southern Sonora, Mexico. The Alamos Project hosts a National Instrument 43-101-compliant inferred mineral resource of 55 million ounces of silver equivalent, grading 320 g/t AgEq. Led by a team of proven silver-mine builders with a track record of advancing projects from discovery through development, Minaurum has assembled a strong pipeline of exploration and development assets across Mexico and the United States.

ON BEHALF OF THE BOARD

Darrell A. Rader

Darrell A. Rader
President and CEO

For more information, please contact:
Sunny Pannu – Investor Relations and Corporate Development Manager
(778) 330 0994 or via email at pannu@minaurum.com

The TSX Venture Exchange does not accept responsibility for the adequacy or accuracy of this news release.

1570– 200 Burrard Street 
Vancouver, BC V6C 3L6    

Telephone: 1 778 330-0994
www.minaurum.com    
info@minaurum.com

Data review and verification: Stephen R. Maynard, Vice President of Exploration of Minaurum and a Qualified Person (QP) as defined by National Instrument 43-101, reviewed and verified the assay data, and has approved the disclosure in this News Release. Verification was done by visual inspection of core samples and comparison to assay results. Assay results have not been checked by re-analysis. No factors were identified that could materially affect the accuracy or reliability of the data presented in this news release.

Analytical Procedures and Quality Assurance/Quality Control: Preparation and assaying of drilling samples from Minaurum’s Alamos project are done with strict adherence to a Quality Assurance/Quality Control (QA/QC) protocol. Core samples are sawed in half and then bagged in a secure facility near the site and then shipped either by a licensed courieror by Company personnel to ALS Minerals’ preparation facility in Hermosillo, Sonora, Mexico. ALS prepares the samples, crushing them to 70% less than 2mm, splitting off 250g, and pulverizing the split to more than 85% passing 75 microns. The resulting sample pulps are prepared in Hermosillo, and then shipped to Vancouver for chemical analysis by ALS Minerals. In Vancouver, the pulps are analyzed for gold by fire assay and ICP/AES on a 30-gram charge. In addition, analyses are done for silver, copper, lead, and zinc using 4-acid digestion and ICP analysis. Samples with silver values greater than 100 g/t; and copper, lead, or zinc values greater than 10,000 ppm (1%) are re-analyzed using 4-acid digestion and atomic absorption spectrometry (AAS).

Quality-control (QC) samples are inserted in the sample stream every 20 samples on average, and thus represent 5% of the total samples. QC samples include standards, blanks, and duplicate samples. Standards are pulps that have been prepared by a third-party laboratory; they have gold, silver, and base-metal values that are established by an extensive analytical process in which several commercial labs (including ALS Minerals) participate. Standards test the calibration of the analytical equipment. Blanks are rock material known from prior sampling to contain less than 0.005 ppm gold; they test the sample preparation procedure for cross-sample contamination. In the case of duplicates, the sample interval is cut in half and then quartered. The first quarter is the original sample, the second becomes the duplicate. Duplicate samples provide a test of the reproducibility of assays in the same drilled interval. When final assays are received, QC sample results are inspected for deviation from accepted values. To date, QC sample analytical results have fallen in acceptable ranges on the Alamos project.

When final assays are received, QC sample results are inspected for deviation from accepted values by the QP. To date, QC sample analytical results have fallen in acceptable ranges on the Alamos project.

ALS Minerals is independent of Minaurum Silver and is independent of the Qualified Person.

Cautionary Note Regarding Forward-Looking Information: This news release contains “forward-looking information” within the meaning of applicable Canadian securities legislation. “Forward-looking information” includes, but is not limited to, statements with respect to activities, events or developments that the Company expects or anticipates will or may occur in the future. Generally, but not always, forward-looking information and statements can be identified by the use of words such as “plans”, “expects”, “is expected”, “budget”, “scheduled”, “estimates”, “forecasts”, “intends”, “anticipates”, or “believes” or the negative connotation thereof or variations of such words and phrases or state that certain actions, events or results “may”, “could”, “would”, “might” or “will be taken”, “occur” or “be achieved” or the negative connotation thereof.

In making the forward-looking information in this release, Minaurum has applied certain factors and assumptions that are based on Minaurum’s current beliefs as well as assumptions made by and information currently available to Minaurum. Although Minaurum considers these assumptions to be reasonable based on information currently available to it, they may prove to be incorrect, and the forward-looking information in this release are subject to numerous risks, uncertainties and other factors that may cause future results to differ materially from those expressed or implied in such forward-looking information.

Readers are cautioned not to place undue reliance on forward-looking information. Minaurum does not intend, and expressly disclaims any intention or obligation to, update or revise any forward-looking information whether as a result of new information, future events or otherwise, except as required by law.

To view the source version of this press release, please visit https://www.newsfilecorp.com/release/283231

Categories
Base Metals Energy Junior Mining Precious Metals

Grizzly Mobilizes IP Crew to the Sappho Critical Minerals Target Greenwood, British Columbia Precious and Battery Metals Project

Edmonton, Alberta–(Newsfile Corp. – February 4, 2026) – Grizzly Discoveries Inc. (TSXV: GZD) (FSE: G6H) (OTCQB: GZDIF) (“Grizzly” or the “Company”) is pleased to announce that a crew from Peter E. Walcott and Associates has mobilized to Greenwood to commence an Induced Polarization (IP) program in early 2026 to follow up excellent prior results from both surface sampling and historical drilling at the Sappho Critical Minerals Target (Figure 1). In light of the current escalating metal prices for critical minerals/metals including copper (Cu), platinum (Pt), palladium (Pd), gold (Au) and silver (Ag), the Sappho Skarn/Porphyry Target warrants follow-up exploration including drilling. Three lines of IP are planned prior to the commencement of drilling. The drilling is slated to begin approximately mid-February.

Highlights

  • The Geological Setting is the East Fault Contact of the Toroda Graben with numerous pyroxenite-monzonite-diorite (older) and younger QFP-diorite (Tertiary) intrusions into intermediate-mafic volcanics along with a complex magnetic feature at the Sappho CG area (Figure 1).
  • The East and West Faults of the Toroda Graben likely played a role in controlling the Au-Ag mineralization for the Buckhorn Skarn and Mine to the southwest and the Cu-Au-Ag mineralization for the Motherlode/Greyhound skarns to the north (Figure 2).
  • Skarn and porphyry style alteration and mineralization along with Cu-PGE’s-Au-Ag are observed in outcrop and drill core along with a complex magnetic signature in the Main Sappho CG area.
  • Five (5) new sulphide showings were discovered during 2022 field work, with 4 of the 5 showings yielding rock grab samples with >1% copper (Cu) up to as high as 7.25% Cu (Figure 1 and see Grizzly news release dated November 3rd, 2022).
  • A total of 17 rock grab samples returned values >1% Cu up to 9.06% Cu, many also with anomalous gold (Au), silver (Ag), platinum (Pt) and palladium (Pd).
  • A total of 11 samples have yielded >500 parts per billion (ppb) Pt and Pd up to 4.64 grams per tonne (g/t) Pt and up to 2.28 g/t Pd.

The Sappho area is being targeted for copper-gold skarn and porphyry type targets associated with a Jurassic alkalic intrusive complex and several younger diorite intrusions (Figure 1). A total of five new showings of copper oxide mineralization were found during the 2022 program (Figure 1). Previous surface sampling and drilling by Grizzly has yielded significant anomalous copper, gold, silver along with platinum and palladium. Numerous historical and new rock grab samples have yielded greater than 1% Cu, 1 g/t Au, 1 g/t Ag, 1 g/t Pt and 1 g/t Pd (Figure 1).

Historical 2010 drilling by the Company (4 core holes) yielded up to 0.31% Cu, 0.75 g/t Au, 0.34 g/t Pt, 0.39 g/t Pd and 6.57 g/t Ag over 6.5 m core length in skarn at Sappho (in hole 10SP03), including a 1 m core length intersections of 3.82 g/t Au and 199 g/t Ag, and in a separate sample 1.83 g/t Pt and 2.09 g/t Pd across 1 m – these results all are associated with >1% Cu in those samples. These higher grade zones were contained within a 63.5 m core length zone logged as a pyroxene – sulphide skarn with a grade approaching 0.7% copper equivalent derived from current metal prices for Cu, Au, Ag, Pt and Pd. Drillhole 10SP03 targeted a magnetic anomaly and had no indications of surface mineralization at the time of drilling. One of the new 2022 showings has been found proximal to drillhole 10SP03 and the targeted magnetic anomaly.

Figure 1: Sappho Rock Sampling Summary 2026 and Planned IP and Drillhole Locations.

To view an enhanced version of this graphic, please visit:
https://images.newsfilecorp.com/files/4488/282613_843ca3c1c4fdaa19_002full.jpg

Brian “Griz” Testo, President & CEO of Grizzly Discoveries, states, “New results are providing significant targets indicated by high-grade copper samples at surface. Anomalous ground magnetics has also outlined multiple new targets across the Sappho Project. I am excited to see what IP might indicate – Grizzly will continue to refine these targets to the drill ready stage for anticipated drilling in the next month and potentially identifying some new discoveries.”

The Company is continuing with surface exploration in the Greenwood area. Crews from APEX Geoscience Ltd. completed soil and rock sampling in August through to October and the exploration work is ongoing. Work including prospecting, rock and soil sampling has been conducted at targets in the Rock Creek area, the Midway area, the Copper Mountain area, the Overlander-Attwood area and the Sappho area to date (Figure 2). Additional groundwork including ground geophysical surveys are being planned and will comprise IP, magnetics and Loupe electromagnetics (EM) for the Sappho, the Midway and Motherlode areas (Figure 2).

Rock (>200 samples) and soil sampling results from the 2025 fieldwork are pending and will be released as they are received.

Figure 2: Exploration Targets 2026.

To view an enhanced version of this graphic, please visit:
https://images.newsfilecorp.com/files/4488/282613_843ca3c1c4fdaa19_003full.jpg

ABOUT GRIZZLY DISCOVERIES INC.

Grizzly is a diversified Canadian mineral exploration company with its primary listing on the TSX Venture Exchange focused on developing its approximately 72,700 ha (approximately 180,000 acres) of precious and base metals properties in southeastern British Columbia. Grizzly is run by a highly experienced junior resource sector management team, who have a track record of advancing exploration projects from early exploration stage through to feasibility stage.

QUALIFIED PERSON STATEMENT

The technical content of this news release and the Company’s technical disclosure has been reviewed and approved by Michael B. Dufresne, M. Sc., P. Geol., P.Geo., who is a non-independent Qualified Person as defined by National Instrument 43-101 Standards of Disclosure for Mineral Projects.

On behalf of the Board,

GRIZZLY DISCOVERIES INC.
Brian Testo, CEO, President

Suite 363-9768 170 Street NW
Edmonton, Alberta T5T 5L4

For further information, please visit our website at www.grizzlydiscoveries.com or contact:

Nancy Massicotte
Corporate Development
Tel: 604-507-3377
Email: nancy@grizzlydiscoveries.com

Neither the TSX Venture Exchange nor its Regulation Services Provider (as that term is defined in the policies of the TSX Venture Exchange) accepts responsibility for the adequacy or accuracy of this release.

Caution concerning forward-looking information

This press release contains “forward-looking information” and “forward-looking statements” within the meaning of applicable securities laws. This information and statements address future activities, events, plans, developments and projections. All statements, other than statements of historical fact, constitute forward-looking statements or forward-looking information. Such forward-looking information and statements are frequently identified by words such as “may,” “will,” “should,” “anticipate,” “plan,” “expect,” “believe,” “estimate,” “intend” and similar terminology, and reflect assumptions, estimates, opinions and analysis made by management of Grizzly in light of its experience, current conditions, expectations of future developments and other factors which it believes to be reasonable and relevant. Forward-looking information and statements involve known and unknown risks and uncertainties that may cause Grizzly’s actual results, performance and achievements to differ materially from those expressed or implied by the forward-looking information and statements and accordingly, undue reliance should not be placed thereon.

Risks and uncertainties that may cause actual results to vary include but are not limited to the availability of financing; fluctuations in commodity prices; changes to and compliance with applicable laws and regulations, including environmental laws and obtaining requisite permits; political, economic and other risks; as well as other risks and uncertainties which are more fully described in our annual and quarterly Management’s Discussion and Analysis and in other filings made by us with Canadian securities regulatory authorities and available at www.sedarplus.ca. Grizzly disclaims any obligation to update or revise any forward-looking information or statements except as may be required by law.

To view the source version of this press release, please visit https://www.newsfilecorp.com/release/282613

Categories
Base Metals Energy Junior Mining Precious Metals

Apollo Silver Accepted into U.S. Defense Industrial Base Consortium

Vancouver, British Columbia, February 02, 2026 – Apollo Silver Corp. (“Apollo Silver” or the “Company”) (TSX.V:APGO, OTCQB:APGOF, Frankfurt:6ZF) is pleased to announce that it has received acceptance into the U.S. Defense Industrial Base Consortium (“DIBC”), a U.S. Department of Defense-supported initiative designed to support collaboration across industry, academia, and government in advancing solutions relevant to U.S. defense and national security priorities.

The DIBC focuses on strategic and critical materials and technologies essential to U.S. national security, including initiatives to improve the resilience and security of domestic critical mineral supply chains that support defense and industrial applications[1].

Apollo Silver’s U.S.-based Calico Project hosts significant silver mineralization alongside barite and zinc, which are classified as critical minerals on the USGS List of Critical Minerals and play important roles in industrial, infrastructure, and defense-related applications.

As a member of the DIBC, Apollo Silver joins a network of traditional and non-traditional defense contractors, research institutions, and federal agencies working to advance innovation at speed. Membership provides the Company with opportunities to engage in federally sponsored initiatives related to critical materials supply chains, including the mining and processing of silver, zinc, and barite.

“Apollo Silver’s acceptance into the DIBC reflects the growing strategic importance of U.S.-based critical mineral assets, including silver, following its inclusion on the USGS List of Critical Minerals in November 2025,” said Ross McElroy, President and CEO of Apollo Silver. “With one of the largest undeveloped primary silver assets in the United States and meaningful exposure to industrial critical minerals such as barite and zinc, we believe Apollo Silver is well positioned to align with U.S. priorities focused on supply-chain security, industrial resilience, and national defense.”

About Apollo Silver Corp.

Apollo Silver is advancing the second largest undeveloped primary silver projects in the US. The Calico Project hosts a large, bulk minable silver deposit with significant barite and zinc credits – recognized as critical minerals essential to the U.S. energy, industrial and medical sectors. The Company also holds an option on the Cinco de Mayo Project in Chihuahua, Mexico, which is host to a major carbonate replacement (CRD) deposit that is both high-grade and large tonnage. Led by an experienced and award-winning management team, Apollo is well positioned to advance the assets and deliver value through exploration and development.

Please visit www.apollosilver.com for further information.

ON BEHALF OF THE BOARD OF DIRECTORS

Ross McElroy

President and CEO

For further information, please contact:

Email: info@apollosilver.com

Telephone: +1 (604) 428-6128

Neither the TSX Venture Exchange nor its Regulation Services Provider (as that term is defined in the policies of the TSX Venture Exchange) accepts responsibility for the adequacy or accuracy of this release.

Cautionary Statement Regarding “Forward-Looking” Information

This news release includes “forward-looking statements” and “forward-looking information” within the meaning of Canadian securities legislation. All statements included in this news release, other than statements of historical fact, are forward-looking statements including, without limitation, statements with respect to the expected benefits of the Company’s acceptance into the U.S. Defense Industrial Base Consortium (“DIBC”), the Company’s ability to maintain its membership in the DIBC and pursue opportunities arising therefrom, and the advancement and development potential of the Company’s projects, including the Calico Project and the Cinco de Mayo Project. Forward-looking statements include predictions, projections and forecasts and are often, but not always, identified by the use of words such as “anticipate”, “believe”, “plan”, “estimate”, “expect”, “potential”, “target”, “budget” and “intend” and statements that an event or result “may”, “will”, “should”, “could” or “might” occur or be achieved and other similar expressions and includes the negatives thereof.

Forward-looking statements are based on the reasonable assumptions, estimates, analysis, and opinions of the management of the Company made in light of its experience and its perception of trends, current conditions and expected developments, as well as other factors that management of the Company believes to be relevant and reasonable in the circumstances at the date that such statements are made. Forward-looking information is based on reasonable assumptions that have been made by the Company as at the date of such information and is subject to known and unknown risks, uncertainties and other factors that may have caused actual results, level of activity, performance or achievements of the Company to be materially different from those expressed or implied by such forward-looking information, including but not limited to: risks associated with the Company’s ability to maintain DIBC membership and realize anticipated benefits therefrom; changes in government priorities, programs, funding or procurement processes; the risk that membership in the DIBC does not result in any specific contracts, funding, or other opportunities; risks associated with mineral exploration and development; metal and mineral prices; availability of capital; accuracy of the Company’s projections and estimates; realization of mineral resource estimates, interest and exchange rates; competition; stock price fluctuations; availability of drilling equipment and access; actual results of current exploration activities; government regulation; political or economic developments; environmental risks; insurance risks; capital expenditures; operating or technical difficulties in connection with development activities; personnel relations; and changes in Project parameters as plans continue to be refined. Forward-looking statements are based on assumptions management believes to be reasonable, including but not limited to the price of silver, gold and barite; the demand for silver, gold and barite; the ability to carry on exploration and development activities; the timely receipt of any required approvals; the ability to obtain qualified personnel, equipment and services in a timely and cost-efficient manner; the ability to operate in a safe, efficient and effective matter; and the regulatory framework regarding environmental matters, and such other assumptions and factors as set out herein. Although the Company has attempted to identify important factors that could cause actual results to differ materially from those contained in forward-looking information, there may be other factors that cause results not to be as anticipated, estimated or intended. There can be no assurance that forward-looking statements will prove to be accurate and actual results, and future events could differ materially from those anticipated in such statements. Accordingly, readers should not place undue reliance on forward looking information contained herein, except in accordance with applicable securities laws. The forward-looking information contained herein is presented for the purpose of assisting investors in understanding the Company’s expected financial and operational performance and the Company’s plans and objectives and may not be appropriate for other purposes. The Company does not undertake to update any forward-looking information, except in accordance with applicable securities laws.

[1] https://www.dibconsortium.org/

Categories
Base Metals Energy Exclusive Interviews Junior Mining Precious Metals

Apollo Silver Raises $27.5M | Eric Sprott, Jupiter Back a U.S. Silver & Critical Minerals Powerhouse

Apollo Silver: Capitalized, Strategically Backed, and Positioned for the Next Silver Cycle

In a recent episode of Proven and Probable, host Maurice Jackson spoke with Ross McElroy President and CEO of Apollo Silver, to discuss the company’s latest financing, strategic shareholder support, and its growth strategy amid a strengthening silver market.

Apollo Silver recently completed a $27.5 million financing, increasing its treasury to nearly $60 million. The raise was led primarily by strategic investors and insiders, most notably Eric Sprott and Jupiter Asset Management, Apollo Silver’s two largest shareholders. Their continued participation and increased ownership underscore strong institutional confidence in the company’s assets, leadership, and execution capability.

The majority of the capital will be deployed at Apollo Silver’s Calico Project in San Bernardino County, California, one of the largest primary silver deposits in the United States. Calico hosts an updated mineral resource totaling approximately 125 million ounces of silver in the Measured and Indicated category, with an additional 58 million ounces inferred. Planned work includes advanced metallurgical testing, geotechnical studies, recovery optimization, mine planning, and exploration across an expanded land package.

Mr. McElroy addressed investor concerns regarding California as a mining jurisdiction, emphasizing that San Bernardino County is mining-friendly, with a long history of active mining operations and strong local support for responsible resource development.

In addition to Calico, Apollo Silver controls the Cinco de Mayo Project in Chihuahua, Mexico, a high-grade carbonate replacement deposit originally discovered by MAG Silver. The project hosts a substantial historic resource and significant expansion potential. Should Apollo Silver secure a long-term access agreement with the local community, Cinco de Mayo has the potential to become a company-making flagship asset, given its scale, grade, and jurisdiction.

The conversation also explored silver’s evolving role as both a precious and industrial metal, particularly following its designation as a U.S. critical mineral. With rising demand from solar energy, electronics, defense applications, and persistent global supply deficits, Apollo Silver is positioning itself to benefit from favorable long-term market fundamentals.

With a strong balance sheet, top-tier shareholders, two world-class silver assets in stable jurisdictions, and an experienced management team, Apollo Silver enters the coming year with multiple catalysts and a clear path forward.


Company Information

Apollo Silver Corp.
🌐 https://apollosilver.com
📊 TSX-V: APGO | OTCQB: APGOF

Categories
Base Metals Energy Junior Mining Precious Metals

This Hong Kong billionaire invests 25% of his wealth in gold: ‘If you have the physical gold … nobody owes you anything’

Hong Kong billionaire Cheah Cheng Hye has quietly turned a quarter of his fortune into gold, betting that in an era of sanctions, seizures, and geopolitical shocks, nothing beats metal you can touch.

“If you have the physical gold in the warehouse or in your bank safe, nobody owes you anything,” he told Bloomberg News last week.

While he didn’t confirm his family office’s performance and holdings, a source told Bloomberg that precious metals make up about 25% of the $1.4 billion portfolio.

The 71-year-old Cheah, who built Value Partners Group into a multibillion-dollar Hong Kong asset manager, is an outlier in the world of ultrahigh-net-worth investing, with the UBS Global Family Office Report 2025 putting the average allocation to gold and other precious metals at just 2% in 2024. Nevertheless, the billionaire urged investors to rethink their mix altogether, advocating a portfolio split of 60% equities, 20% bonds, and 20% precious metals, led by gold.​

Cheah’s interview with Bloomberg took place after the gold boom of 2025, when a series of geopolitical shocks encouraged investors to seek safety in the yellow bars, but before gold set another new record, rocketing past $5,000 per ounce for the first time ever on Jan. 24.

As Fortune’s Jim Edwards noted shortly before this new milestone, the Trump “TACO trade” has been driving up the price of gold as central banks hoard bullion to hedge against the dollar. JPMorgan analysts wrote in mid-2025 that more gold increases could be coming if—and when—foreign investors continue shifting away from Treasury bonds.

cheah
Hong Kong billionaire Cheah Cheng Hye

‘Vault flight’ and distrust of the West

Behind the gold rush is Cheah’s conviction that global finance has entered what he calls a period of massive “vault flight.” The freezing of Russian assets after the 2022 invasion of Ukraine, and more recent tensions involving Venezuela and Iran, have convinced him that politically exposed money is safer closer to home. Wealthy Asian families, he argued, are increasingly repatriating funds to insulate themselves from U.S. sanctions or potential asset seizures.​

For those investors, he said, physical bullion is the preferred refuge. Cheah’s holdings are backed by gold stored in a Hong Kong government warehouse at the city’s airport, and he insists Asia‑based wealth should favor metal in vaults over “paper gold” such as purely synthetic products. His mantra—that nobody owes you anything if you hold the metal yourself—captures both skepticism about Western financial plumbing and a deeply conservative instinct about security.​

Cheah’s gold pivot is also institutional. Frustrated by Western vault arrangements after he began buying in 2008, he helped launch the Value Gold ETF in 2010, designed to store physical bullion at Hong Kong’s airport facility. He remains the fund’s largest holder, with a stake worth about 1.3 billion Hong Kong dollars, or roughly $167 million, people familiar with the matter told Bloomberg.​

Cheah’s bullish stance has been buttressed by markets. Entering 2026, gold, silver, copper, and tin have all hit record highs, buoyed by expectations of Federal Reserve easing, political pressure from President Donald Trump’s administration, and persistent geopolitical tensions. Silver, which he also favors, has roughly tripled over the past year, far outpacing even gold’s gains.​

While Cheah may be an outlier among ultrahigh-net-worth investors, more big names in finance are coming around to his viewpoint as well. JPMorgan CEO Jamie Dimon, for instance, told Fortune in November that it was “semi-rational” for the first time in his life to have gold in one’s portfolio. That same month, “bond king” Jeffrey Gundlach said that gold had become a “real asset class” that was no longer limited to “survivalists” or “crazy speculators.” Instead, he said, people were allocating “real money because it’s real value.” Gundlach suggested maintaining an allocation, perhaps around 15% of a portfolio, because it was consolidating somewhat.

Cheah began his career as a financial journalist with the Asian Wall Street Journal and Far Eastern Economic Review, before establishing the Hong Kong/China equities research department at Morgan Grenfell Group in Hong Kong, where he was also head of research and a proprietary trader.

Source: https://www.yahoo.com/finance/news/hong-kong-billionaire-invests-25-185023322.html

Categories
Base Metals Energy Junior Mining Precious Metals

Minaurum Announces Initial Resource Estimate at Alamos Silver Project of 55 Million Ounces AgEq Grading 320 g/t AgEq

Vancouver, British Columbia–(Newsfile Corp. – January 28, 2026) – Minaurum Silver Inc. (TSXV: MGG) (OTCQX: MMRGF) (“Minaurum” or the “Company”) is pleased to announce the completion of an Inferred Mineral Resource Estimate (“Resource Estimate”) at its 100%-owned Alamos Silver Project (“Alamos”) located in Sonora, Mexico.

Highlights:

  • High Grade Inferred Mineral Resource: Resource Estimate of 5.37 million tonnes (Mt) grading 202 g/t silver0.21 g/t gold0.43% copper0.97% lead, and 2.01% zinc, or 320 g/t silver equivalent (“AgEq“) and containing 34.8 million ounces (“Moz”) of silver; 35,640 ounces of gold; 51.0 million pounds of copper; 115 million pounds of lead; and 238 million pounds of zinc; or 55.2 Moz AgEq (Table 1).
  • Conservative Assumptions Showcase Robust Mineralization: Calculations include smelter and processing deductions typically associated with more advanced resource estimates. Sensitivity analysis further indicates that the resource remains resilient at higher cut-off grades than 150 g/t AgEq, emphasizing the high-grade nature of the mineralization. (Table 2).
  • Growth Potential: The Resource Estimate encompasses portions of the Promontorio, Travesia, and Europa vein zones-three of the twenty-six vein zones identified at Alamos. The resource is open along strike and at depth, offering significant potential for expansion through the ongoing Phase II 50,000 m resource expansion drill program.
  • The Resource Estimate, completed by Independent Mining Consultants, Inc., is based on a total database of 104 drill holes, totaling 35,888.15 metres and 10,194 samples. The Resource Estimate is classified as an Inferred Mineral Resource in accordance with CIM Definition Standards, with an effective date of January 8, 2026.

“Our inferred resource estimate of 55 million ounces of AgEq, defined across portions of just three of the 26 identified vein zones at Alamos, represents a major milestone for Minaurum,” stated Darrell Rader, President and CEO of Minaurum Silver. “The estimate establishes Alamos as a high-grade silver district with a rare combination of grade and width, with each of the vein zones included remaining open for expansion. Our next step is to aggressively grow the resource through the ongoing Phase II 50,000-metre resource expansion drilling program. I would like to thank the entire Minaurum team, along with our contractors and local communities, for their contributions to this achievement.”

Table 1. Alamos Silver Project – Inferred Mineral Resource Estimate Summary (150 g/t AgEq cut-off)

Inferred Mineral 
Resource:
Average GradeMetal Content
MassAgEqAgAuCuPbZnAgEqAgAuCuPbZn
Ktonnes(g/t)(g/t)(g/t)(%)(%)(%)(koz)(koz)(koz)(klbs)(klbs)(klbs)
Vein
Promontorio/
Veta Grande1,8352811380.310.401.112.8016,6028,14217.9916,06044,904113,272
Veta Guijas124202920.170.450.891.828063650.671,2302,4334,975
Vela El Cien5612991360.490.421.692.345,3882,4488.775,18220,90228,941
Vela El Cien HW1522831590.070.321.362.981,3817770.331,0594,5579,986
Veta Oeste1863792180.450.231.473.372,2661,3022.709556,02813,819
Travesia3731871250.120.360.520.492,2471,4991.392,9444,2764,029
Total3,2312761400.310.391.172.4628,69114,53231.8627,43183,100175,023
Europa/
Europa1,4264023060.060.540.751.4118,43514,0062.5716,88223,57844,327
Europa HW4093512740.070.480.381.034,6213,6040.874,3553,4269,287
Europa HW2512421670.020.410.721.103962740.034628101,237
Europa HW3453082440.010.370.640.884463530.01370635873
Europa HW4326675020.020.262.054.696865170.021841,4463,309
Nuevas Europa534283580.030.390.620.987296110.054567241,145
Nuevas Europa HW1193002380.060.320.400.991,1499090.248451,0492,597
Total2,1353862950.060.500.671.3326,46320,2743.7823,55431,66962,775
Grand Total5,3663202020.210.430.972.0155,15434,80635.6450,985114,769237,798

Notes:

  1. The Resource Estimate conforms with the requirements of NI 43-101 – Standards of Disclosure for Mineral Projects (“NI 43-101”) and the CIM Definition Standards for Mineral Resources and Mineral Reserves (2014). The Resource Estimate is entirely classified as Inferred Mineral Resources. Inferred Mineral Resources have been estimated from geological evidence and limited sampling and have a lower level of confidence than Measured and Indicated Mineral Resources and must not be converted to Mineral Reserves. There is no certainty that Inferred Mineral Resources will be converted to Measured or Indicated Mineral Resources.
  2. Weight-averaged silver-equivalent (“AgEq”) grades are based on the October 1, 2025 long-term CIBC Global Mining Group Analyst Consensus Commodity Price Forecast, using metal prices of US$29.73/oz Ag, US$2,646/oz Au, US$4.34/lb Cu, US$0.92/lb Pb, and US$1.21/lb Zn. Metal recovery assumptions, based on comparable projects, are 88.3% Ag, 75.0% Au, 75.5% Cu, 83.1% Pb, and 75.5% Zn. Assumed refinery payables are 95% Ag, 95% Au, 96.5% Cu, 95% Pb, and 85% Zn.
  3. The Resource Estimate is reported at a cut-off grade of 150 g/t AgEq.
  4. Unit cost assumptions are $50/t mining, $30.22/t for processing and G&A, and $19.50/t for smelting and refining.
  5. Bulk density values applied are 2.72 t/m³ for the Promontorio and Travesía zone veins and 2.63 t/m³ for the Europa zone veins.
  6. The Resource Estimate is reported on a 100% project basis and reflects reasonable prospects for eventual economic extraction.
  7. The effective date of the Resource Estimate is January 8, 2026.
  8. There are no known legal, political, environmental, or other risks that, to the knowledge of the Qualified Persons, could materially affect the potential development of the Mineral Resources.
  9. All figures are rounded to reflect the relative accuracy of the Resource Estimate. Totals may not sum exactly due to rounding.

Table 2. Alamos Silver Project – Inferred Mineral Resource Estimate Sensitivity Table

 Average GradeMetal Content
 MassAgEqAgAuCuPbZnAgEqAgAuCuPbZn
 Resource CaseKtonnes(g/t)(g/t)(g/t)(%)(%)(%)(koz)(koz)(koz)(klbs)(klbs)(klbs)
    
Case 1. 115 g/t Equivalent Silver Cutoff
 Promontorio4,6082331180.260.330.942.0734,45017,48738.3933,35295,877210,519
 Europa2,4593532690.050.470.621.2427,88921,2953.9225,29533,37567,030
 Total7,0672741710.190.380.831.7862,33938,78242.3158,647129,252277,549
 
Case 2. 125 g/t Equivalent Silver Cutoff
 Promontorio4,0312491260.280.351.022.2032,20416,29036.2731,41490,843195,348
 Europa2,4183572730.050.470.621.2527,72121,1823.8825,09933,09166,607
 Total6,4492891810.190.400.871.8459,92537,47240.1656,513123,933261,955
               
Case 3. 140 g/t Equivalent Silver Cutoff      
 Promontorio3,5202661340.300.371.112.3630,04315,19133.5729,00786,480183,041
 Europa2,2483732860.050.490.651.2926,98820,6883.8024,07932,16463,718
 Total5,7683081940.200.420.931.9457,03135,87937.3853,087118,644246,759
   
Case 4. 150 g/t Equivalent Silver Cutoff
 Promontorio3,2312761400.310.391.172.4628,69114,53231.8627,43183,100175,023
 Europa2,1353862950.060.500.671.3326,46320,2743.7823,55431,66962,775
 Total5,3663202020.210.430.972.0155,15434,80635.6450,985114,769237,798
   
Case 5. 165 g/t Equivalent Silver Cutoff
 Promontorio2,7442971520.330.411.252.6026,23813,42028.8924,94975,663157,356
 Europa2,0353973040.060.510.691.3625,95919,9103.7123,02431,12861,127
 Total4,7793402170.210.461.012.0752,19733,33032.6047,973106,791218,483
  
Case 6. 175 g/t Equivalent Silver Cutoff
 Promontorio2,5183091580.340.431.302.7124,99312,79127.4823,64372,378150,307
 Europa1,9824033090.060.520.701.3825,66219,6933.6822,73130,66160,331
 Total4,5003502250.220.471.042.1250,65632,48431.1646,375103,039210,638

The Resource Estimate lies in portions of the 3 veins of the 26 identified veins in the Alamos district, roughly 2 kilometres of approximately 30 known kilometres of cumulative vein strike length (Figures 1-3).

Figure 1. Alamos Silver Project Vein Zones – 55.2 Moz AgEq grading 320 g/t AgEq lies on Promontorio, Travesia, and Europa vein zones located within the black boxed outlines.

To view an enhanced version of this graphic, please visit:
https://images.newsfilecorp.com/files/3455/281507_image1.jpg

Drill hole spacing within the modeled vein domains averages approximately 80 metres, with locally tighter spacing in higher-grade portions of the Promontorio vein zone. Most of the resource occurs in unmined zones, with partially mined-out areas in the Promontorio vein zone. Interpreted void volumes associated with historical mining have been deducted from the Resource Estimate based on interpretations of historical longitudinal sections, mine maps, and drill hole data. The resource remains open in along strike and down dip on both the Promontorio and Europa vein zones. Multiple other veins in the district have high-grade intercepts that await potential resource definition.

Figure 2. Travesia-Promontorio vein zone longitudinal section. Dotted line indicates the outline of the geological model used in calculating resources. This vein zone comprises 28.7 Moz AgEq grading 276 g/t AgEq. Click to enlarge.

To view an enhanced version of this graphic, please visit:
https://images.newsfilecorp.com/files/3455/281507_image2.jpg

Figure 3. Europa vein zone longitudinal section. Dotted line indicates the outline of the geological model used in calculating resources. This vein zone comprises 26.5 Moz AgEq grading 386 g/t AgEq. Click to enlarge.

To view an enhanced version of this graphic, please visit:
https://images.newsfilecorp.com/files/3455/281507_image3.jpg

The Alamos Project Resource Estimate is based on the following key assumptions and parameters: specific gravity values of 2.72 for the Promontorio and Travesia veins and 2.63 for the Europa vein, derived from Minaurum’s test work based on 151 wax-coated density measurements; vein domains were modelled to reflect the interpreted vein geology, including vein continuity, thickness, and structural controls; all assays were composited to 1 metre, and grade capping was applied on a vein-by-vein basis, with silver grades capped at up to 3,000 g/t; a 5 m along strike × 1 m across strike × 2.5 m high block size was selected based on geological constraints and potential future mining methods; and block grades for gold, silver, copper, lead, and zinc were estimated using inverse distance squared interpolation; mineral resources were classified as Inferred in accordance with CIM Definition Standards, based on geological confidence, drill hole spacing, sample support, and search criteria. Additional details of the estimation methodology and classification criteria will be provided in the supporting technical report to be filed on the Company’s profile on SEDAR+.

A technical report prepared by IMC in accordance with NI 43-101 will be filed on the Company’s profile at www.sedarplus.ca within 45 days of the date of this press release.

Phase II – Resource Expansion Drill Program
Minaurum is currently conducting a 50,000-metre core drilling program aimed at expanding the resource at Europa and Promontorio-Travesia, while also completing step-out and in-fill drilling to further evaluate high-grade intercepts in additional vein zones across the Alamos district, including at San Jose, Quintera, Promontorio Sur, Pulpito-Cotera, and Minas Nuevas.

Minaurum intends to provide an updated resource estimate in the second half of 2026. There is no certainty that the Inferred Mineral Resources will be converted to the Measured and Indicated categories through further drilling.

National Instrument 43-101 Disclosure
Qualified Assurance Program and Quality Control Measures (“QA/QC”)

Minaurum has implemented QA/QC protocols including insertion of duplicate, blank and standard samples in all drill holes and underground sampling. Ninety-two percent of drill samples were submitted directly to the ALS Chemex in Hermosillo, Mexico, for preparation and sent to ALS Chemex in North Vancouver, BC, Canada, for analysis. During 2024, the Company sent drill samples to ActLabs’ facility in Zacatecas, Mexico, for preparation and analysis there, amounting to 8% of the total drill samples. Additional duplicate test work has been conducted on mineralized samples to assess variability of coarse reject and pulp samples. An IMC independent qualified person visited the Alamos project on 2 occasions, the 3-5th of September 2024, and the 18th of November 2025. IMC has reviewed the QA/QC work completed by Minaurum and believes the database is reliable for estimating Mineral Resources.

Qualified Person
The Mineral Resources for the Alamos Project disclosed in this news release have been estimated by Michael G. Hester, FAusIMMVice President of Independent Mining Consultants, Inc. and independent of Minaurum. Mr. Hester is a Qualified Person as defined in NI 43-101. The Mineral Resources have been classified in accordance with CIM Definition Standards for Mineral Resources and Mineral Reserves, adopted by CIM council, as amended. Mr. Hester has read and approved the contents of this press release as it pertains to the disclosed mineral resource estimate.

Follow us and stay updated:

YouTube: @MinaurumSilver
X: @MinaurumSilver
LinkedIn: Minaurum Silver Inc
Subscribe to our email list at www.minaurum.com

Minaurum Silver Inc. (TSXV: MGG) (OTCQX: MMRGF) (FSE: 78M) is an Americas-focused explorer concentrating on the high-grade 100% owned, production-permitted Alamos silver project in southern Sonora, Mexico and the Lone Mountain CRD Project in Nevada, USA. Minaurum is managed by one of the strongest technical and finance teams and will continue its founders’ legacy of creating shareholder value by acquiring and developing a pipeline of Tier-One precious-and base metal projects.

ON BEHALF OF THE BOARD

Darrell A. Rader

Darrell A. Rader
President and CEO

For more information, please contact:
Sunny Pannu – Investor Relations and Corporate Development Manager
(778) 330 0994 or via email at pannu@minaurum.com

The TSX Venture Exchange does not accept responsibility for the adequacy or accuracy of this news release.

Data review and verification: Stephen R. Maynard, Vice President of Exploration of Minaurum and a Qualified Person (QP) as defined by National Instrument 43-101, reviewed and verified the assay data, and has approved the disclosure in this news release. Verification was done by visual inspection of core samples and comparison to assay results. Assay results have not been checked by re-analysis. No factors were identified that could materially affect the accuracy or reliability of the data presented in this news release.

Analytical Procedures and Quality Assurance/Quality Control: Preparation and assaying of drilling samples from Minaurum’s Alamos project are done with strict adherence to a Quality Assurance/Quality Control (QA/QC) protocol. Core samples are sawed in half and then bagged in a secure facility near the site and then shipped either by a licensed courior by Company personnel to ALS Minerals’ preparation facility in Hermosillo, Sonora, Mexico. ALS prepares the samples, crushing them to 70% less than 2mm, splitting off 250g, and pulverizing the split to more than 85% passing 75 microns. The resulting sample pulps are prepared in Hermosillo and then shipped to Vancouver for chemical analysis by ALS Minerals. In Vancouver, the pulps are analyzed for gold by fire assay and ICP/AES on a 30-gram charge. In addition, analyses are done for silver, copper, lead, and zinc using 4-acid digestion and ICP analysis. Samples with silver values greater than 100 g/t; and copper, lead, or zinc values greater than 10,000 ppm (1%) are re-analyzed using 4-acid digestion and atomic absorption spectrometry (AAS).

Quality-control (QC) samples are inserted in the sample stream every 20 samples on average, and thus represent 5% of the total samples. QC samples include standards, blanks, and duplicate samples. Standards are pulps that have been prepared by a third-party laboratory; they have gold, silver, and base-metal values that are established by an extensive analytical process in which several commercial labs (including ALS Minerals) participate. Standards test the calibration of the analytical equipment. Blanks are rock material known from prior sampling to contain less than 0.005 ppm gold; they test the sample preparation procedure for cross-sample contamination. In the case of duplicates, the sample interval is cut in half and then quartered. The first quarter is the original sample, the second becomes the duplicate. Duplicate samples provide a test of the reproducibility of assays in the same drilled interval. When final assays are received, QC sample results are inspected for deviation from accepted values. To date, QC sample analytical results have fallen in acceptable ranges on the Alamos project.

When final assays are received, QC sample results are inspected for deviation from accepted values by the QP. To date, QC sample analytical results have fallen in acceptable ranges on the Alamos project.

ALS Minerals is independent of Minaurum Silver and is independent of the Qualified Person.

Cautionary Note Regarding Forward Looking Information: This news release contains “forward-looking information” within the meaning of applicable Canadian securities legislation. “Forward-looking information” includes, but is not limited to, statements with respect to the activities, events or developments that the Company expects or anticipates will or may occur in the future, including the Resource Estimate; the ongoing Phase II 50,000 m resource expansion drill program; and the completion of an updated resource estimate in the second half of 2026. Generally, but not always, forward-looking information and statements can be identified by the use of words such as “plans”, “expects”, “is expected”, “budget”, “scheduled”, “estimates”, “forecasts”, “intends”, “anticipates”, or “believes” or the negative connotation thereof or variations of such words and phrases or state that certain actions, events or results “may”, “could”, “would”, “might” or “will be taken”, “occur” or “be achieved” or the negative connotation thereof.

In making the forward-looking information in this release, Minaurum has applied certain factors and assumptions that are based on Minaurum’s current beliefs as well as assumptions made by and information currently available to Minaurum, including that Minaurum will be able to obtain all necessary permits and approvals for planned exploration and drilling activities; that Minaurum’s planned drilling and exploration activities will be completed on the expected timeline, or at all; that the results of the drilling and exploration activities will be as expected; that Minaurum will be able to complete the updated mineral resource estimate on the timelines expected, or at all; and that Minaurum will have the financial resources to complete its ongoing drill program and anticipated updated mineral resource estimate. Although Minaurum considers these assumptions to be reasonable based on information currently available to it, they may prove to be incorrect, and the forward-looking information in this release are subject to numerous risks, uncertainties and other factors that may cause future results to differ materially from those expressed or implied in such forward-looking information.

In making the forward-looking information in this release, Minaurum has applied certain factors and assumptions that are based on Minaurum’s current beliefs as well as assumptions made by and information currently available to Minaurum. Although Minaurum considers these assumptions to be reasonable based on information currently available to it, they may prove to be incorrect, and the forward-looking information in this release are subject to numerous risks, uncertainties and other factors that may cause future results to differ materially from those expressed or implied in such forward-looking information, including risks relating to the actual results of drilling or exploration activities, fluctuating silver prices, possibility of equipment breakdowns and delays, drilling or exploration cost overruns, availability of capital and financing, general economic, market or business conditions, regulatory changes and timeliness of government or regulatory approvals.

Readers are cautioned not to place undue reliance on forward-looking information. Minaurum does not intend, and expressly disclaims any intention or obligation to, update or revise any forward-looking information whether as a result of new information, future events or otherwise, except as required by law.

To view the source version of this press release, please visit https://www.newsfilecorp.com/release/281507

Categories
Base Metals Energy Junior Mining Precious Metals

Apollo Silver Closes Second and Final Tranche of $27.5 Million Private Placement Offering, with a $12.5 Million Investment from Jupiter Asset Management

VANCOUVER, British Columbia, Jan. 28, 2026 (GLOBE NEWSWIRE) — Apollo Silver Corp. (“Apollo Silver” or the “Company”) (TSX.V:APGO, OTCQB:APGOF, Frankfurt:6ZF0) is pleased to announce that it has closed the second and final tranche of its previously announced upsized non-brokered private placement (the “Offering”), previously announced on January 21, 2026. Pursuant to the closing of the second and final tranche of the Offering, the Company issued an aggregate of 2,500,000 units (the “Units”) at a price of $5.00 per Unit for aggregate gross proceeds of $12,500,000. With the completion of this tranche, the Offering is now fully subscribed for total gross proceeds of $27,500,000.

A fund managed by Jupiter Asset Management (the “Jupiter Fund”) subscribed for all of the Units under the second and final tranche of the Offering.

As a result of closing the second and final tranche of the Offering, the Jupiter Fund now beneficially owns and controls 7,452,456 common shares and 3,807,200 common share purchase warrants of the Company, representing approximately 11.9% of the Company’s outstanding common shares on a non-diluted basis and approximately 16.9% on a partially diluted basis, assuming exercise of such warrants.

“We welcome and appreciate the continued participation of Jupiter Fund, as a key shareholder of Apollo Silver,” said Ross McElroy, President and CEO of Apollo Silver. “Jupiter Fund’s commitment is a strong statement of support as we continue to advance our large scale, high quality silver assets in stable jurisdictions.”

Each Unit issued pursuant to the Offering consists of one common share (a “Share”) in the capital of the Company and one common Share purchase warrant (a “Warrant”). Each Warrant entitles the holder thereof to purchase one Share at an exercise price of $7.00 for a period of 24 months from the closing date of the Offering.

Closing of the Offering remains subject to final acceptance of the TSX Venture Exchange.

In connection with subscriptions received in the second and final tranche of the Offering, the Company paid aggregate finder’s fees totaling $312,500 to BMO Capital Markets.

The securities issued under the second and final tranche of the Offering are subject to a four-month hold period from the date of closing. The Company intends to use the net proceeds from the Offering to continue advancing the Calico Silver Project in San Bernardino, California; support community relations initiatives at the Cinco de Mayo Silver Project in Chihuahua, Mexico; cover ongoing property maintenance costs at both projects; and for general corporate purposes.

The Shares have not been, and will not be, registered under the United States Securities Act of 1933, as amended (the “U.S. Securities Act”), or any U.S. state securities laws, and may not be offered or sold in the United States without registration under the U.S. Securities Act and all applicable state securities laws or compliance with the requirements of an applicable exemption therefrom. This news release shall not constitute an offer to sell or the solicitation of an offer to buy securities in the United States, nor shall there be any sale of these securities in any jurisdiction in which such offer, solicitation or sale would be unlawful.

About Apollo Silver Corp.

Apollo Silver is advancing one of the largest undeveloped primary silver projects in the US. The Calico project hosts a large, bulk minable silver deposit with significant barite and zinc credits – recognized as critical minerals essential to the US energy and medical sectors. The Company also holds an option on the Cinco de Mayo Project in Chihuahua, Mexico, which is host to a major carbonate replacement (CRD) deposit that is both high-grade and large tonnage. Led by an experienced and award-winning management team, Apollo Silver is well positioned to advance the assets and deliver value through exploration and development.

Please visit www.apollosilver.com for further information.

ON BEHALF OF THE BOARD OF DIRECTORS

Ross McElroy
President and CEO

For further information, please contact:

Email: info@apollosilver.com

Telephone: +1 (604) 428-6128

Neither the TSX Venture Exchange nor its Regulation Services Provider (as that term is defined in the policies of the TSX Venture Exchange) accepts responsibility for the adequacy or accuracy of this release.

Cautionary Statement Regarding “Forward-Looking” Information

This news release includes “forward-looking statements” and “forward-looking information” within the meaning of Canadian securities legislation. All statements included in this news release, other than statements of historical fact, are forward-looking statements including, without limitation, statements with respect to the final acceptance of the Offering by the TSXV, and the intended use of proceeds from the Offering. Forward-looking statements include predictions, projections and forecasts and are often, but not always, identified by the use of words such as “anticipate”, “believe”, “plan”, “estimate”, “expect”, “potential”, “target”, “budget” and “intend” and statements that an event or result “may”, “will”, “should”, “could” or “might” occur or be achieved and other similar expressions and includes the negatives thereof.

Forward-looking statements are based on the reasonable assumptions, estimates, analysis, and opinions of the management of the Company made in light of its experience and its perception of trends, current conditions and expected developments, as well as other factors that management of the Company believes to be relevant and reasonable in the circumstances at the date that such statements are made. Forward-looking information is based on reasonable assumptions that have been made by the Company as at the date of such information and is subject to known and unknown risks, uncertainties and other factors that may have caused actual results, level of activity, performance or achievements of the Company to be materially different from those expressed or implied by such forward-looking information, including but not limited to: risks associated with mineral exploration and development; metal and mineral prices; availability of capital; accuracy of the Company’s projections and estimates; realization of mineral resource estimates, interest and exchange rates; competition; stock price fluctuations; availability of drilling equipment and access; actual results of current exploration activities; government regulation; political or economic developments; environmental risks; insurance risks; capital expenditures; operating or technical difficulties in connection with development activities; personnel relations; and changes in Project parameters as plans continue to be refined. Forward-looking statements are based on assumptions management believes to be reasonable, including but not limited to the price of silver, gold and barite; the demand for silver, gold and barite; the ability to carry on exploration and development activities; the timely receipt of any required approvals; the ability to obtain qualified personnel, equipment and services in a timely and cost-efficient manner; the ability to operate in a safe, efficient and effective matter; and the regulatory framework regarding environmental matters, and such other assumptions and factors as set out herein. Although the Company has attempted to identify important factors that could cause actual results to differ materially from those contained in forward-looking information, there may be other factors that cause results not to be as anticipated, estimated or intended. There can be no assurance that forward-looking statements will prove to be accurate and actual results, and future events could differ materially from those anticipated in such statements. Accordingly, readers should not place undue reliance on forward looking information contained herein, except in accordance with applicable securities laws. The forward-looking information contained herein is presented for the purpose of assisting investors in understanding the Company’s expected financial and operational performance and the Company’s plans and objectives and may not be appropriate for other purposes. The Company does not undertake to update any forward-looking information, except in accordance with applicable securities laws.

Categories
Base Metals Energy Junior Mining Precious Metals

Copper’s Momentum: Key Catalysts to Watch in 2026

Key Takeaways

  • Record Copper Prices: Copper hit all-time highs as supply disruptions and structural deficits drove strong repricing.
  • Tight Inventories: Regional stockpiling and policy uncertainty are tightening supply outside the U.S.
  • Supply Shocks: Major mine outages and collapsing treatment charges signal severe upstream stress.
  • Strategic Demand: AI, defense and grid modernization are making copper demand more durable.
  • Key Catalysts: Section 232 tariff risk and rising M&A activity support a constructive 2026 outlook.

Performance as of December 31, 2025

 Metric1 MO*3 MO*1 YR3 YR5 YR
Copper Spot Price110.86%21.79%43.93%14.19%9.95%
Copper Mining Equities (Nasdaq Sprott Copper Miners Index TR)216.49%26.28%74.59%28.53%18.76%
Copper Junior Mining Equities (Nasdaq Sprott Junior Copper Miners Index TR)316.17%34.77%132.42%43.42%26.45%
Broad Commodities (BCOM Index)4-0.65%4.84%11.07%-0.93%7.04%
U.S. Equities (S&P 500 TR Index)50.06%2.65%17.88%22.98%14.42%

*Performance for periods under one year is not annualized.
Source: Bloomberg as of 12/31/2025. You cannot invest directly in an index. Past performance is no guarantee of future results.

Performance Overview: Copper Price Hits All-Time Highs

Copper is in a powerful breakout, coming off a blockbuster 2025 and pushing deeper into record territory as tight supply and trade-driven dislocation keep the market on a scarcity footing.

Copper rose 43.93% in 2025, capping a strong year that reshaped market expectations for both price and the supply-demand balance. Copper’s strength has carried into early 2026, with the copper price continuing to attain all-time highs, reaching $13,273.81 per metric ton as of this writing. Notably, this is not a typical cyclical upswing. Copper is being repriced amid tightening fundamentals. Major supply disruptions have pushed the market into a deficit sooner than expected, while long-term demand growth continues to outstrip supply, increasing the likelihood of deeper shortages ahead. Copper’s momentum has been further reinforced by the broader strength of hard assets, as deglobalization and de-dollarization are increasing the strategic premium investors assign to essential critical materials like copper.

Copper is breaking records, driven by tight supply, structural market shifts and surging demand.

Copper’s strength is also being reinforced by a structural shift in the mobility of copper inventories. In a more open system, before 2025, exchange stocks and arbitrage help move metal to where it is most needed, smoothing regional imbalances. Today, that mechanism is increasingly constrained by trade frictions and policy uncertainty, which are encouraging stockpiling behavior and redirecting deliverable inventory to specific jurisdictions. This has left U.S. inventories elevated, while availability outside the U.S. is tighter than global headline inventories imply, providing support for the copper market. The result is a copper market where location, deliverability and policy risk can heighten the impact of the traditional supply-demand balance, particularly when the supply chain is already strained, and deficits are developing earlier than many expected. In effect, copper’s inventory buffer is behaving more like a set of regional pools than a single global reservoir, which helps explain why tightness can persist even when headline inventories do not look extreme.

Copper miners were the primary beneficiaries of rising copper prices in 2025. Copper miners gained 74.59% and junior copper miners rose 132.42%, underscoring how copper mining equities can deliver operating leverage to a higher copper price. For junior copper miners, the outperformance also reflects a rising probability that projects move from optionality to execution as higher prices improve economics and financing viability. That dynamic has been especially important for U.S.-linked projects, where government actions have increased confidence that domestic copper supply can be accelerated through faster permitting and broader support mechanisms, such as a direct equity stake in one junior developer.

Looking at longer-term performance, copper and copper miners have meaningfully outpaced equities and broader commodity benchmarks, respectively, over the past five years (Figure 1).

Figure 1. Physical Copper and Copper Stocks Have Outperformed Other Asset Classes Over the Past Five Years (12/31/2020-12/31/2025)

Physical Copper and Copper Stocks Have Outperformed Other Asset Classes Over the Past Five Years
Source: Bloomberg and Sprott Asset Management. Data as of 12/31/2025. Copper Miners are measured by the Nasdaq Sprott Copper Miners™ Index (NSCOPPT index); Junior Copper Miners are measured by the Nasdaq Sprott Junior Copper Miners™ Index (NSCOPJT index); U.S. Equities are measured by the S&P 500 TR Index; the Copper Spot Price is measured by LMCADY Comdty; and Commodities are measured by the Bloomberg Commodity Index (BCOM). Definitions of the indices are provided in the footnotes. You cannot invest directly in an index. Past performance is no guarantee of future results.

Market DriversEmpty heading

Supply Disruptions Force Market Tightness

Copper’s rally has been driven by an abrupt shift into a supply deficit after a cluster of major disruptions forced the market to reprice faster than expected. The most significant was the September shutdown at Grasberg, where an estimated 800,000 metric tons of mud flooded the mine. Lost output through December 2026 is expected to exceed Collahuasi’s entire annual production, effectively removing the world’s third-largest mine from the market and tightening conditions overnight. The disruption was compounded by a string of setbacks across the industry. The Kamoa-Kakula complex faced flooding-related output cuts estimated at roughly 300 thousand metric tons, Teck revised guidance lower by about 60,000 metric tons across multiple operations, Codelco’s El Teniente reduced expected output by 33 thousand metric tons after an accident, and the ongoing shutdown of Cobre Panama continues to represent a loss of over 300 thousand metric tons of supply.

Major disruptions forced the copper market to reprice faster than expected.

The market impact of these disruptions is amplified by a broader truth about copper: supply reliability has always been fragile. Historically, unplanned outages average about 5% of global supply. In prior years, this could have been absorbed more easily. Today, however, it comes at a time when inventories are fragmented, and the market has less flexibility to balance regional tightness, raising the odds that even incremental disruptions push prices higher. This is why industry-wide constraints matter so much in 2026. Years of underinvestment, long development timelines and declining ore grades have slowed the industry’s ability to respond, leaving the market increasingly exposed when disruptions occur. As a result, the market is more likely to reprice the forward deficit path rather than dismiss disruptions as short-term noise. With demand growing faster than expected and supply relatively flat, the outlook now points to larger deficits ahead (Figure 2).

Figure 2. Copper Supply and Demand Imbalance May Likely Grow

Copper Supply and Demand Imbalance May Likely Grow
Source: BloombergNEF Transition Metals Outlook 2025. The line represents demand and the shaded area

Treatment Charges Flash Red

One of the clearest signs of stress in copper right now is the concentrate market, where smelters are increasingly competing for the mined feedstock that becomes refined copper. That competition shows up directly in treatment costs (TCs), the fee smelters earn for processing copper concentrate. There are two prices to watch. The annual TC benchmark is the reference level that anchors many long-term contracts for the year. It reset to $0 for 2026, down from $21.25 in 2025, which was already considered exceptionally low versus historical norms that were often in the $80s.6 The spot TCs are the day-to-day marginal price for concentrate and it has been even more extreme, falling deeper into negative territory and pushing to fresh all-time lows (Figure 3).

These TCs matter because they signal extreme stress and scarcity in mined copper. When TCs collapse, it means concentrate is in short supply relative to processing demand, and the whole chain becomes more vulnerable. In a market already tightening, that kind of upstream stress can ultimately pressure the price of refined copper higher, because the system has less flexibility to absorb disruptions or delays. It can also boost copper miners’ earnings power, as sustained tightness in concentrate typically reflects strong demand for mined copper.

Figure 3. Treatment Costs Are the Canary in Copper’s Supply Chain (2021-2025)

Treatment Costs Are the Canary in Copper’s Supply Chain
Source: Bloomberg. Data as of 12/31/2025. Includes inventories on the LME, SHFE, and COMEX. Included for illustrative purposes only.

Section 232 Copper Tariff Risk Remains

The July 30, 2025, Section 2327 copper proclamation imposed universal 50% tariffs on semi‑finished copper products and copper‑intensive derivative products, effective August 1, 2025. Contrary to Trump’s initial messaging and the market expectations that followed, it did not result in a tariff on refined copper. That swing, from an almost 50% tariff being priced into refined copper to 0%, created a premium for U.S. copper over the rest of the world that the market had never seen before, and participants raced to ship copper into the U.S. When refined copper was ultimately exempted, that premium fell back toward normal levels. Even so, inventories have remained concentrated in the U.S. (Figure 4), and the administration outlined a clear pathway for introducing refined copper tariffs later. The outcome could have just as profound implications for the copper spot price in 2026.

Section 232 keeps U.S. copper markets on edge, with tariff risk still unresolved.

By June 30, 2026, the U.S. Secretary of Commerce will provide President Trump with an update on domestic copper markets, so that he can determine whether imposing a phased universal import duty on refined copper is warranted. The duty path contemplated is 15% starting January 1, 2027, increasing to 30% starting January 1, 2028.

While the U.S. chose in January 2026 to forgo proposing tariffs on most critical minerals in favor of negotiating critical mineral agreements, copper remains a notable outlier given its separate treatment. Moreover, the legal environment prevents this risk from fading; if the Supreme Court constrains broader tariff strategies, the Trump administration is likely to lean more heavily on Section 232 tariffs. The practical takeaway is that Section 232 risk remains unresolved. It is evolving, and it continues to fragment inventory systems in a copper market already tightened by supply disruptions and concentrate constraints.

Figure 4. Trapped Copper in the U.S. (COMEX) (2015-2025)

Trapped Copper in the U.S. (COMEX)
Source: Bloomberg. Data as of 12/31/2025. Includes inventories on the LME, SHFE, and COMEX. Included for illustrative purposes only.

De-Dollarization Buoys Critical Materials and Precious Metals

Copper is increasingly traded as a critical material rather than an economic gauge, as markets place greater weight on policy credibility and de-dollarization. Headlines about a criminal investigation involving Federal Reserve Chair Jerome Powell and the rising political pressure on the Federal Reserve have sharpened concerns about Fed independence, reinforcing de-dollarization dynamics and supporting the broader metals complex. That same backdrop helped underpin broad strength across metals in 2025 (Figure 5), and it remains a credible tailwind into 2026, particularly for critical materials like copper that sit at the intersection of electrification, industrial security and strategic supply-chain priorities.

De-dollarization is supporting copper and critical materials performance. 

Rate expectations add another layer. Markets have been focused on the likelihood of lower rates over time, including the potential for a more dovish policy stance as President Trump appoints a successor at the Fed. A lower-rate trajectory is typically supportive for commodities through both financing conditions and currency dynamics, and it can reinforce investor demand for critical materials assets. When that tailwind converges with a market already contending with multiple others, it can keep copper well supported and raise the probability that the upside pressure extends through 2026.

Figure 5. Metals Post Strong Returns in 2025

Metals Post Strong Returns in 2025
Source: Bloomberg. Data as of 12/31/2025. Gold is measured by the Gold Spot Price; Silver is measured by the Silver Spot Price; Platinum is measured by the Platinum Spot Price; Palladium is measured by the Palladium Spot Price; Copper is measured by the LME Copper Spot Price; Lithium is measured by the China Lithium Carbonate 99.5%; Nickel is measured by the LME Nickel Spot Price; the U3O8 uranium spot price is measured by a proprietary composite of U3O8 spot prices from TradeTech, UxC, S&P Platts and Numerco; the S&P 500 TR is measured by the S&P 500 Total Return Index; Bonds are measured by the Bloomberg Barclays US Agg Total Return Value Unhedged USD (LBUSTRUU Index).

Copper Demand Is Shifting Toward Strategic, Less Price‑Sensitive End Uses

Copper is increasingly being pulled by structural, strategic demand that is less price-sensitive, tied to the buildout of critical infrastructure rather than the traditional industrial cycle. Copper still faces exposure to cyclical segments, including construction-related demand, which can be influenced by China’s property downturn and uneven global growth. The difference today is that the marginal demand driver is steadily shifting toward the world’s most critical sectors, helping copper stay well supported even as parts of the conventional growth picture appear mixed.

This shift was visible in 2025. Despite China’s property slowdown and persistent concerns around global growth, copper still delivered its strongest performance in 16 years, reinforcing that the market is increasingly pricing copper on critical end uses and constrained supply responsiveness rather than on the traditional economic cycle alone. Finally, copper has further evidenced this by decisively outperforming and breaking free of its correlation with Chinese equities since 2021 (Figure 6).

Figure 6. Copper Breaks Away from Chinese Equities (2015-2025)

Source: Bloomberg as of 12/31/2025. Chinese equities measured by the MXCN Index. Copper measured by LMCADY Comdty.

Copper’s break from its historical correlation with Chinese equities is clearest in three demand segments that are expanding simultaneously. First, AI and data-center deployments are driving a step-change in electricity consumption, along with the copper-heavy power systems, cooling capacity, and connectivity networks required to support that load. Second, defense spending is building a more persistent layer of demand that is less sensitive to economic cycles and more aligned with national-security priorities. Third, the electricity grid is entering a long-duration modernization cycle, driven by accelerating load growth, aging infrastructure, and heightened reliability concerns.

These shifts have meaningfully reshaped copper’s demand profile. Electrical infrastructure surpassed construction as copper’s leading demand source, rising from 24% of total usage in 2020 to 30% in 2025, with further gains expected (Figure 7). A similar pattern is visible within China itself: construction-linked demand has weakened with the property downturn, yet investment in electrical infrastructure continues to more than offset this, sustaining overall demand growth. Together, these trends are linking copper more directly to strategic procurement across critical industries, supporting a constructive outlook for 2026 and amplifying upward pressure amid tight supply conditions.

Figure 7. Electrical Infrastructure Takes Over Global Copper Demand (2020-2030E)

Electrical Infrastructure Takes Over Global Copper Demand
Source: Benchmark Mineral Intelligence, December 2025.

Looking Ahead: Copper’s Critical Catalysts

The copper market enters 2026 with several high-impact catalysts that should keep the outlook constructive. The most significant scheduled milestone is policy-related: under the Section 232 framework, the next key decision date is June 30, 2026, when the U.S. Commerce Secretary is expected to deliver an updated assessment of domestic copper markets.

Constrained supply and essential demand underpin copper’s strength.

Beyond policy, the market remains anchored by a supply chain that has shown how quickly it can tighten when disruptions hit and how slowly it can normalize when baseline supply growth is constrained. The key takeaway for 2026 is that the system continues to operate with limited flexibility, which supports a higher critical premium when participants compete for reliable units.

Copper demand continues to look increasingly durable because the marginal driver is shifting toward critical end uses that are harder to defer. The global push to expand and modernize electricity grids, the buildout of AI-related power infrastructure, and strategic industrial priorities are reinforcing copper’s role in essential systems. That demand mix is supportive in its own right, and it becomes even more powerful when paired with constrained supply responsiveness.

A final catalyst to watch is capital allocation across the mining industry. Mergers and acquisitions have increasingly reflected a strategic pivot toward copper, and the market is now openly entertaining transactions that could rival or exceed prior landmark deals (i.e., confirmed Rio Tinto and Glencore merger talks that would surpass the multibillion-dollar Anglo-Teck merger of 2025). Increased M&A reinforces the premium being placed on long-duration copper exposure and signals that the largest miners are likely to keep orienting portfolios toward copper, which tends to support sentiment across the copper complex.

Taken together, these catalysts leave copper’s move to all-time highs looking well grounded (Figure 8). With policy risk still active, supply responsiveness constrained, strategic demand tailwinds strengthening, and major miners continuing to reorient toward copper, the copper price can remain well supported near record territory through 2026.

Figure 8. Copper Hits All-Time Highs (2000-2025)

Copper Hits All-Time Highs
Source: Bloomberg as of 12/31/2025. Copper is measured by LMCADY Comdty. Past performance is not indicative of future results.

Footnotes

1The copper spot price is measured by the LME Copper Cash ($), Bloomberg ticker LMCADY.
2The Nasdaq Sprott Copper Miners™ Index (NSCOPP™) is designed to track the performance of a selection of global securities in the copper industry; the Index was co-developed by Nasdaq® and Sprott Asset Management LP.
3Nasdaq Sprott Junior Copper Miners™ Index (NSCOPJ™) is designed to track the performance of mid-, small- and micro-cap companies in copper-mining related businesses; the Index was co-developed by Nasdaq® and Sprott Asset Management LP.
4The Bloomberg Commodity Index (BCOM) is a broadly diversified commodity price index that tracks prices of futures contracts on physical commodities and is designed to minimize concentration in any one commodity or sector. It currently has 23 commodity futures in six sectors.
5The S&P 500 or Standard & Poor’s 500 Index is a market-capitalization-weighted index of the 500 largest U.S. publicly traded companies.
6Source: Benchmark, Chinese smelter reportedly agrees to record low copper concentrate TC/RCs.
7Section 232 refers to a provision in the Trade Expansion Act of 1962 that allows the U.S. President to impose tariffs or other trade restrictions on imported goods if the Secretary of Commerce finds they threaten national security, initiating investigations into product imports.

More Insights from Sprott

Image features stacked copper bars on a wooden cart, with text promoting the Sprott Physical Copper Trust and options to explore.
Sprott Copper Miners ETF

Subscribe to Insights

First Name*

Last Name*

Email Address*

Investor Type*                                  Asset Manager                 Financial Advisor                 Individual Investor                 Institutional Investor                 Other               

Country*                                  United States                 Canada                 Argentina                 Australia                 Austria                 Belgium                 Brazil                 China                 Denmark                 Finland                 France                 Germany                 India                 Ireland                 Italy                 Japan                 Netherlands                 New Zealand                 Norway                 South Africa                 Spain                 Sweden                 Switzerland                 United Kingdom                 Other               

I am not a robot.

Please slide to unlock.

I consent to Sprott Inc. and its subsidiaries sending me newsletters, fund information and other electronic messages (E-Communications)*

Please refer to our Privacy Policy or Contact Us for more information.

*Required

Investment Risks and Important Disclosure

Relative to other sectors, precious metals and natural resources investments have higher headline risk and are more sensitive to changes in economic data, political or regulatory events, and underlying commodity price fluctuations. Risks related to extraction, storage and liquidity should also be considered.

Gold and precious metals are referred to with terms of art like “store of value,” “safe haven” and “safe asset.” These terms should not be construed to guarantee any form of investment safety. While “safe” assets like gold, Treasuries, money market funds and cash generally do not carry a high risk of loss relative to other asset classes, any asset may lose value, which may involve the complete loss of invested principal.

Past performance is no guarantee of future results. You cannot invest directly in an index. Investments, commentary and opinions are unique and may not be reflective of any other Sprott entity or affiliate. Forward-looking language should not be construed as predictive. While third-party sources are believed to be reliable, Sprott makes no guarantee as to their accuracy or timeliness. This information does not constitute an offer or solicitation and may not be relied upon or considered to be the rendering of tax, legal, accounting or professional advice. 

Categories
Base Metals Junior Mining Precious Metals

Metalsource Mining Inc. Provides Drilling Update at Silver Hill Project

Vancouver, British Columbia–(Newsfile Corp. – January 22, 2026) – Metalsource Mining Inc. (CSE: MSM) (OTCQB: SFRIF) (FSE: E9Z) is pleased to provide an update on its ongoing diamond drilling program at the Silver Hill Project, which is located approximately 15km south of Lexington, NC.

Two recently completed drill holes, SH26-07 and SH26-08 (currently in progress), have intersected multiple intervals of sulphide mineralization at depth, located proximal to historic underground workings but within areas that have not been previously drill tested. Mineralization is hosted in tuffaceous argilites and rhyolitic volcaniclastics and massive flows.

Hole SH26-07 intersected a broad zone of mineralization between approximately 129.85m and 155.45m downhole, comprising multiple discrete intervals of semi-massive to massive sulphides with associated quartz veining, silicification, and sulphide mineralization comprised of sphalerite, galena, and pyrite.

Drilling of hole SH26-08 has now intersected sulphide mineralization beginning at approximately 185m to 191m, for an apparent thickness of 6m and an estimated true thickness of 4m. This interval occurs at depth, south of the termination of historic underground workings, within a zone that has not previously been drilled.

Drill Hole IDEasting mENorthing mNElevation mAzimuthDipTotal Depth m
SH25-015724083951597224110-65108.81
SH25-025724083951597224110-87101.19
SH25-035724103951751236100-45304.71
SH25-045724103951751236100-9099.67
SH25-055722803951624262135-75199.03
SH26-065722803951624262135-50108.81
SH26-075722803951624262135-90199.64
SH25-085722803951624262195-78In progress

The Company notes that visual identification of sulphide mineralization intervals do not indicate metal grades or economic significance. Core processing is ongoing with logging, sampling, and submittal for labratory analysis underway.

The current drilling continues to test down-dip and along-strike extensions of the Silver Hill mineralized system, with step-out drilling planned to evaluate continuity and scale.

The exploration results described herein are preliminary in nature and are insufficient to define a mineral resource. Further drilling is required to determine the continuity, geometry, and grade distribution of the mineralization. At the time of this release, analytical results are still pending, the reported intervals are based on geological logging only.

Qualified Person

All scientific and technical information, has been reviewed and approved by Rory Kutluoglu, B.Sc., P.Geo., a “Qualified Person” as defined under NI 43-101 – Standards of Disclosure for Mineral Projects. Mr. Kutluoglu is an independent consultant of the company within the meaning of NI 43-101.

Silver Hill Project

Located in the Carolina Terrane, the property is underlain by volcaniclastic and volcano-sedimentary rocks predominantly of Neoproterozoic and Cambrian age. This terrane has been suggested to be an extension of the Avalon Terrane. The property is 1,128 acres located in Davidson County, North Carolina. As the first significant discovery and first silver-producing mine in America, there is an extensive drillhole database, underground mapping, historic dumps and underground chip samples which comprise the historic dataset. This mineralization is currently known to extend to 550m from surface, in a steeply trending series of lenses, which remain open in multiple directions. Bolstering these historic records, recent surface sampling contained results including SH25-003 containing 444g/t Ag, 17.7 g/t Au, 8.61% Pb and 0.507% Zn.

Byrd-Pilot Mountain Project

Located in central North Carolina, within the Carolina Terrane. Early USGS work in the 1980s flagged the area as possibly hosting a porphyry gold-copper system, subsequent work demonstrated broad gold mineralization in soils, trenches, and shallow RC drilling, coincident with strong self-potential anomalies. Geology shows intense quartz-sericite-pyrite alteration, high-sulfidation signatures, and high-alumina minerals (like Haile and Brewer deposits to the south), suggesting potential for a large epithermal or porphyry-related gold system. Geologic modelling indicates east-west trend to the identified mineralization, open in multiple directions, with oxidation noted down to a depth of 30m. No drilling has tested the Meridian discovery zone since those 1980s campaigns, leaving potential for significant resource expansion through work commitments of the agreement.

All scientific and technical information in this news release has been reviewed and prepared under the supervision of Rory Kutluoglu, P.Geo., a Qualified Person as defined in National Instrument 43-101 – Standards of Disclosure for Mineral Projects (“NI 43-101”).

About Metalsource Mining Inc.

Metalsource Mining Inc. is a Canadian mineral exploration company focused on advancing high-potential mineral assets through modern, systematic exploration and value-driven discovery.

For further information, please contact:
Joe Cullen CEO – Metalsource Mining Inc.
Tel: (778) 919-8615
Email: jcullen@metalsourcemining.com

This news release contains forward-looking statements and forward-looking information within the meaning of Canadian securities legislation (collectively, “forward-looking statements”) that relate to the Company’s current expectations and views of future events. Any statements that express, or involve discussions as to, expectations, beliefs, plans, objectives, assumptions or future events or performance (often, but not always, through the use of words or phrases such as “will likely result”, “are expected to”, “expects”, “will continue”, “is anticipated”, “anticipates”, “believes”, “estimated”, “intends”, “plans”, “forecast”, “projection”, “strategy”, “objective” and “outlook”) are not historical facts and may be forward-looking statements and may involve estimates, assumptions and uncertainties which could cause actual results or outcomes to differ materially from those expressed in such forward-looking statements. No assurance can be given that these expectations will prove to be correct and such forward-looking statements included in this material change report should not be unduly relied upon. These statements speak only as of the date they are made.

Forward-looking statements are based on a number of assumptions and are subject to a number of risks and uncertainties, many of which are beyond the Company’s control, which could cause actual results and events to differ materially from those that are disclosed in or implied by such forward-looking statements. The Company undertakes no obligation to update or revise any forward-looking statements, whether as a result of new information, future events or otherwise, except as may be required by law. New factors emerge from time to time, and it is not possible for the Company to predict all of them or assess the impact of each such factor or the extent to which any factor, or combination of factors, may cause results to differ materially from those contained in any forward-looking statement. Any forward-looking statements contained in this presentation are expressly qualified in their entirety by this cautionary statement.

To view the source version of this press release, please visit https://www.newsfilecorp.com/release/281223