Edmonton, Alberta–(Newsfile Corp. – December 13, 2023) – Grizzly Discoveries Inc. (TSXV: GZD) (FSE: G6H) (OTCQB: GZDIF) (“Grizzly” or the “Company”) is pleased to announce the first assay results for rock samples collected from the newly acquired and staked mineral claims in the Westbridge area of the Greenwood District. These are some of the first results from work conducted in the Westbridge to Beaverdell target areas within the Greenwood Precious and Battery Metals Project. In addition, results will also be forthcoming from additional prospecting and sampling in the Greenwood area and from recent work conducted at the Robocop Property following up on copper-cobalt anomalous soils identified in work over the last two years.
Highlights:
- A total of 51 rock grab samples were collected from outcrop and mineralized dump material across the Colby and Enterprise claims acquired in early 2023 (Figures 1 & 2).
- Additional staking has been conducted to expand and firm up the land position in the area.
- Rock grab samples (40) from showings and mineralized dumps in the Colby area returned 13 samples with >1.0 gram per tonne (g/t) (0.029 ounces per ton [opt]) gold (Au) and 8 samples with >5.0 g/t (0.146 opt) Au up to 26.2 g/t (0.764 opt) Au including 12 grab samples with >30.0 g/t (0.875 opt) silver (Ag) up to 460 g/t (13.42 opt) Ag.
- The high Au and Ag values are often accompanied by high lead and zinc in the 0.1 – 1% range. The high values are associated with gossanous pyritic material in quartz veins and breccia in what appears to be quartzite in contact with a diorite or felsic porphyry (Figures 3 & 4).
- A total of 11 selected rock grab samples from the Enterprise showing and historical workings yielded 3 grab samples with >1.0 g/t (0.029 opt) Au up to 32.0 g/t (0.933 opt) Au including 3 grab samples with >30.0 g/t (0.875 opt) Ag up to 187 g/t (5.45 opt) Ag (Figures 1 and 2).
- Sulphide mineralization at the Colby and Enterprise historical workings is associated with quartz veins, breccia and skarnified/silicified sedimentary rocks and intrusions. The alteration patterns are consistent with intermediate sulphidation epithermal mineralization.
Brian Testo, President and CEO of Grizzly Discoveries, stated, “We are excited with the new results to date from the new Westbridge mineral claims and we are planning follow-up exploration including extensive soil and rock sampling programs along with ground geophysical surveys. Much of newly acquired ground has seen little exploration and evaluation since the 1980’s. We also are looking forward to pursuing a number of high grade gold – silver – copper showings and historical mines with drilling in the New Year along with additional exploration for significant battery metal prospects in our current 165,000+ acre land holdings in the Greenwood District. We have barely scratched the surface in terms of exploration!“

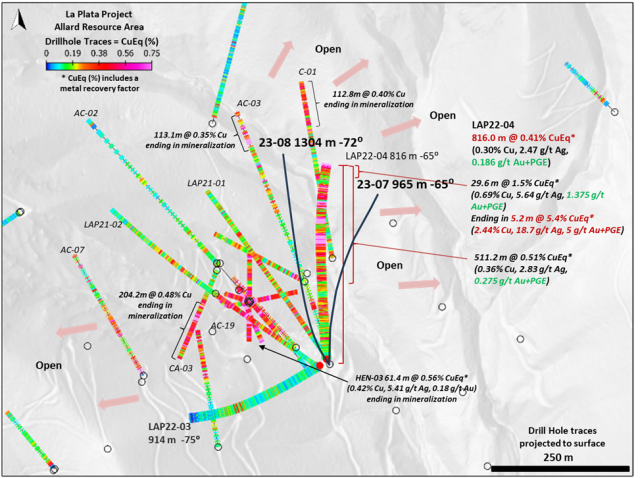
Figure 1: Initial Gold Results Rock Sampling 2023 – Westbridge Area, Greenwood Project.
To view an enhanced version of this graphic, please visit:
https://images.newsfilecorp.com/files/4488/190834_a0e9cf7b949439e3_002full.jpg

Figure 2: Initial Silver Results Rock Sampling 2023 – Westbridge Area, Greenwood Project.
To view an enhanced version of this graphic, please visit:
https://images.newsfilecorp.com/files/4488/190834_a0e9cf7b949439e3_003full.jpg

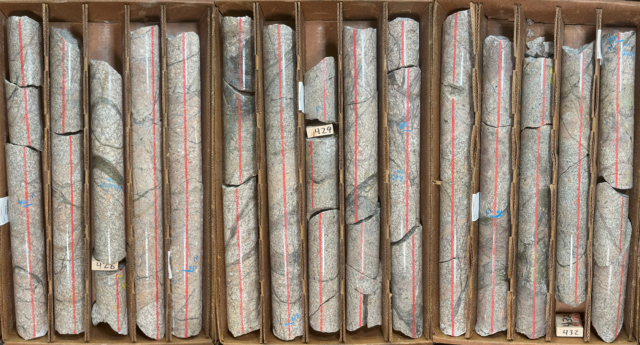
Figure 3. Gossanous sulphide mineralization from vein outcrop Colby Claim.
To view an enhanced version of this graphic, please visit:
https://images.newsfilecorp.com/files/4488/190834_a0e9cf7b949439e3_004full.jpg

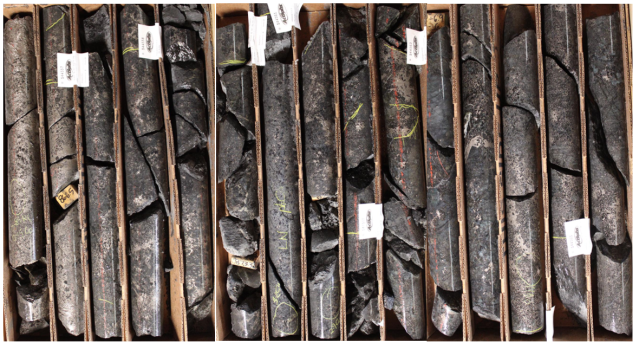
Figure 4. Main adit quartz vein, sulphides and brecciated quartzite Colby Claim.
To view an enhanced version of this graphic, please visit:
https://images.newsfilecorp.com/files/4488/190834_a0e9cf7b949439e3_005_006full.jpg
As the Company awaits drilling permits from the BC Government, significant ground based prospecting and sampling programs have been executed at the newly staked Marshall Lake claims as well as at a number of other exploration target areas including Midway, Imperial, Sappho-West Lexington and Beaverdell areas (Figure 5). A total of more than 800 rock samples and 3,800 soil samples have been collected during the 2023 field season. Results will be announced as they are received and interpreted over the coming weeks.
Update on Drilling:
Drilling will initially be focused at the historical Midway Mine (Figure 5) but the intent is that eventually the Company will complete new drilling in 2024 at Midway, Imperial, Copper Mountain (Mable Jenny, Coronation and Prince of Wales targets), and potentially the Sappho areas, depending upon the timing of the receipt of drill permits, additional funding and weather permitting. We eagerly await drilling permits from the BC Ministry of Energy Mines and Petroleum Resources. The permit applications were submitted initially in January-February of this year and the Company is now awaiting final comments and any required conditions or changes resulting from the recently completed 30 day notification periods. Archaeological and biological surveys are being conducted where required.

Figure 5: Grizzly active exploration target areas 2023.
To view an enhanced version of this graphic, please visit:
https://images.newsfilecorp.com/files/4488/190834_a0e9cf7b949439e3_007full.jpg
Summary of 2023 Exploration at Greenwood:
An extensive rock and soil sampling program along with new geological mapping during 2023 has been conducted in preparation for drilling. The work has yielded two new showings identified near the historical Midway Mine including up 5.64 g/t (0.165 opt) Au from a showing 400 m to the north of the Midway Mine and a second showing along an apparent fault structure with 4.19 g/t (0.122 opt) Au from a grab sample collected about 375 m to the west of the Midway Mine. At least 6 new areas with anomalous gold (> 100 ppb Au), silver or copper in soils have been identified across the Midway Mine Property with the results from follow up exploration in progress (See Company News Release Dated October 12, 2023). A summary of all the Midway results will be provided once all the results are received.
To date, gold-silver-base metal mineralization appears to be related to veins and stockworks at contacts between altered ultramafic-carbonate rocks (listwanites) in contact with diorite intrusions in a complex structural setting, with the intersections of structures playing a key role in the localization of alteration.
At the historical Imperial Mine area, a total of 50 new rock grab and rock chip samples were collected from the Imperial showing area, with 6 samples returning greater than 1 g/t(0.029 opt) Au up to 12.1 g/t (0.353 opt) Au and 8 samples retuning greater than 40 g/t (1.167 opt) Ag up to 469 g/t (13.68 opt) Ag (Figure 5). The samples define a targeted north – south strike length of over 170 m for future drilling. The samples show significant amounts of lead (Pb), zinc (Zn) and Cu with several samples yielding greater than 2% combined base metals (See Company News Release Dated October 12, 2023). Geological mapping is in progress and ground geophysical surveys are planned prior to conducting drilling at this target.
The Copper Mountain area continues to yield excellent results from a number of showings including the Coronation and Prince of Wales historical mines along with the Mabel Jenny area (Figure 5). A total of 9 of 14 rock grab and chip samples collected this year from a new zone discovered late in 2022 has yielded greater than 1 g/t (0.039 opt) Au up to 13.75 g/t (0.40 opt) Au (along with up to 61.9 g/t (1.81 opt) Ag) and up to 0.475% Cu and 2.93% Zn (See Company News Release Dated October 12, 2023). The discovery was made along a new logging road cut late in 2022 and appears to demonstrate quartz vein stockwork mineralization in an altered diorite over a strike length of more than 400 m when combined with anomalous samples from 2022.
Geological and prospecting crews have concluded prospecting, geological mapping, rock and soil sampling within the Greenwood Project area and have conducted an initial pass at the new mineral claim area staked August 1, 2023 (See Company News Release dated September 7, 2023). A number of existing showings and parts or extensions to known showings have been acquired with the staking of the new mineral claims including but not limited to Marshall Lake, Sylvester K, the Great Laxey, Eholt and lands adjacent to and surrounding the historical Phoenix Mine. Results from the initial sampling programs on these new claims will be released as they are received (Figure 5).
The geological and prospecting crew has made several discoveries of sulphide, quartz vein zones and skarn on the new claims (Figure 5). Sulphide showings associated with skarn at Marshall Lake hosted in Triassic Brooklyn Formation sedimentary rocks including limestone that has been intruded by diorite. The showings have been trenched and bulk sampled in the past (1960’s to 1970’s) yielding significant copper, silver and gold. Little to no modern exploration has been performed at the Marshall Lake target as well as a number of other showings in the Brooklyn sequence such as the Great Laxey.
The goal is to have a pipeline of high priority precious metal and battery metal targets that are all permitted and ready for a long 2024 drilling campaign in order to prioritize these assets into those that can deliver future mineral resources with additional drilling, eventually leading to some form of economic studies and scenarios that might be able to take advantage of local toll treating opportunities that exist in the Greenwood – Republic region.
Quality Assurance and Control
Rock and soil samples were analyzed at ALS Global Laboratories (Geochemistry Division) in Vancouver, Canada (an ISO/IEC 17025:2017 accredited facility). Gold was assayed using a fire assay with atomic emission spectrometry and gravimetric finish when required (+10 g/t Au). Rock grab and rock chip samples from outcrop/bedrock are selective by nature and may not be representative of the mineralization hosted on the project.
The sampling program was undertaken by Company personnel under the direction of Michael B. Dufresne, M.Sc., P.Geol., P.Geo. A secure chain of custody is maintained in transporting and storing of all samples.
The technical content of this news release and the Company’s technical disclosure has been reviewed and approved by Michael B. Dufresne, M. Sc., P. Geol., P.Geo., who is the Qualified Person as defined by National Instrument 43-101 Standards of Disclosure for Mineral Projects.
ABOUT GRIZZLY DISCOVERIES INC.
Grizzly is a diversified Canadian mineral exploration company with its primary listing on the TSX Venture Exchange focused on developing its approximately 72,700 ha (approximately 180,000 acres) of precious and base metals properties in southeastern British Columbia. Grizzly is run by a highly experienced junior resource sector management team, who have a track record of advancing exploration projects from early exploration stage through to feasibility stage.
On behalf of the Board,
GRIZZLY DISCOVERIES INC.
Brian Testo, CEO, President
Suite 363-9768 170 Street NW
Edmonton, Alberta T5T 5L4
For further information, please visit our website at www.grizzlydiscoveries.com or contact:
Nancy Massicotte
Corporate Development
Tel: 604-507-3377
Email: nancy@grizzlydiscoveries.com
Neither the TSX Venture Exchange nor its Regulation Services Provider (as that term is defined in the policies of the TSX Venture Exchange) accepts responsibility for the adequacy or accuracy of this release.
Caution concerning forward-looking information
This press release contains “forward-looking information” and “forward-looking statements” within the meaning of applicable securities laws. This information and statements address future activities, events, plans, developments and projections. All statements, other than statements of historical fact, constitute forward-looking statements or forward-looking information. Such forward-looking information and statements are frequently identified by words such as “may,” “will,” “should,” “anticipate,” “plan,” “expect,” “believe,” “estimate,” “intend” and similar terminology, and reflect assumptions, estimates, opinions and analysis made by management of Grizzly in light of its experience, current conditions, expectations of future developments and other factors which it believes to be reasonable and relevant. Forward-looking information and statements involve known and unknown risks and uncertainties that may cause Grizzly’s actual results, performance and achievements to differ materially from those expressed or implied by the forward-looking information and statements and accordingly, undue reliance should not be placed thereon.
Risks and uncertainties that may cause actual results to vary include but are not limited to the availability of financing; fluctuations in commodity prices; changes to and compliance with applicable laws and regulations, including environmental laws and obtaining requisite permits; political, economic and other risks; as well as other risks and uncertainties which are more fully described in our annual and quarterly Management’s Discussion and Analysis and in other filings made by us with Canadian securities regulatory authorities and available at www.sedar.com. Grizzly disclaims any obligation to update or revise any forward-looking information or statements except as may be required by law.

To view the source version of this press release, please visit https://www.newsfilecorp.com/release/190834