(Bloomberg) — President-elect Donald Trump nominated Chris Wright, who runs a Colorado-based oil and natural gas fracking services company, to lead the Energy Department.
Wright, the chief executive officer of Liberty Energy Inc., has no previous Washington experience. He’s made a name for himself as a vocal proponent of oil and gas, saying fossil fuels are crucial for spreading prosperity and lifting people from poverty. The threat of global warming, he has said, is exaggerated.
“Chris has been a leading technologist and entrepreneur in Energy,” Trump said in a statement Saturday. “He has worked in Nuclear, Solar, Geothermal, and Oil and Gas. Most significantly, Chris was one of the pioneers who helped launch the American Shale Revolution that fueled American Energy Independence, and transformed the Global Energy Markets and Geopolitics.”
Trump said Wright, if confirmed, would also sit on the newly formed Council of National Energy that will be chaired by Doug Burgum, Trump’s nominee to lead the Interior Department.
The Energy Department has a disparate mission that includes helping to maintain the nation’s nuclear warheads, studying supercomputers and maintaining the US’s several hundred million-barrel stockpile of crude oil.
It also plays a key role in approving projects to export liquefied natural gas, something that was paused during Biden’s administration. Trump has vowed to undo the pause.
While the department has little authority over oil and gas development, Wright will play a leading role in helping Trump carry out his energy priorities.
Trump’s selection of Wright, whose company is among the largest providers of fracking services globally, is a show of support for the hot-button oil and gas extraction method that Trump frequently touted during the campaign to attack his Democratic opponent Kamala Harris.
Harris said she’d consider banning the technique during her 2020 primary run and reversed course in her 2024 campaign.
‘No Climate Crisis’
Wright’s company published a 180-page paper this year that concluded climate change “is far from the world’s greatest threat to human life,” and that “hydrocarbons are essential to improving the wealth, health, and life opportunities for the less energized.”
“There is no climate crisis. And we are not in the midst of an energy transition either,” Wright said in a video posted on his LinkedIn page. “Humans, and all complex life on earth, is simply impossible without carbon dioxide — hence the term carbon pollution is outrageous.”
Wright holds engineering degrees from the Massachusetts Institute of Technology and the University of California at Berkeley. He describes himself on his Denver-based company’s website as a “tech nerd turned entrepreneur and a dedicated humanitarian.”
While Wright has warned that subsidies for wind and solar drive up power prices and increase grid instability, he does support alternative energy. He serves on the board of small modular reactor developer Oklo Inc., and his company is an investor in geothermal energy and sodium-ion battery technology.
“I’m not here to protect market share for oil gas,” he said during a 2022 interview with Bloomberg Television. “We should do credible things, mostly driven by market forces. But shoveling subsidies at wind and solar, which are 3% of global energy, that’s not meaningfully going to change greenhouse gas emissions. But it is going to drive electricity prices up.”
Wright is also on the board EMX Royalty Corp., a global mining royalties firm, according to his company bio.
Trump named Wright with backing from Continental Resources Chairman Harold Hamm, a Trump energy adviser and donor. Hamm said in an interview with the Houston-based trade publication Hart Energy that Wright was his choice for the job.
If confirmed by Congress, Wright would play a leading role in Trump carrying out his campaign pledge to declare a national emergency on energy. Trump has cast such a declaration as helping increase domestic energy production — including for electricity — which he says is needed to help meet booming power needs for artificial intelligence.
Under the first Trump administration, the Energy Department played a critical role in the president-elect’s efforts to revive US coal power, an initiative he’s hinted he may attempt again.
Wright would also oversee Trump’s promise to refill the nation’s emergency cache of crude oil. The Strategic Petroleum Reserve, which has a capacity of more than 700 million barrels, reached lows not seen since the 1980s following the Biden administration’s unprecedented drawdown of a record 180 million barrels in the wake of Russia’s invasion of Ukraine.
Trump’s first energy secretary, former Texas Governor Rick Perry, called for eliminating the agency entirely during a run for president in the 2012 cycle. He later apologized and vowed to defend the agency “after being briefed on so many of the vital functions” it plays.
He ran for president in 2020 on a climate-friendly agenda, which was followed by his opponents in the Democratic primary solidifying their climate proposals. Since then, he’s founded Galvanize Climate Solutions, an investment firm focused on climate impact, which former Secretary of State John Kerry recently joined as co-executive chair.
Given that context, you’d think Steyer would be nervous about the next four years with the election of Donald Trump, who is likely to exit the Paris Climate Agreement again.
But in an interview at Yahoo Finance’s Invest conference, Steyer stated, “To a very large extent, it doesn’t matter” who is in the White House. As he sees it, climate solutions will win in the free market.
Steyer pointed to the energy transition that’s already taking place in “deep red states” across the country. Texas, for instance, is the biggest wind energy producer in the United States despite state legislation that excludes wind projects from tax breaks and favors fossil fuels.
“Why are they doing that? Because of the money,” Steyer said. “This is business. This is economics. Nobody gets to get away from the rules of markets and prices.”
Steyer’s comments mirror Apollo (APO) CEO Marc Rowan’s view that the US needs to get on board with the energy transition or it risks getting left behind, which is part of why Rowan is “incredibly optimistic” about four more years under Trump. (Disclosure: Yahoo Finance is owned by Apollo Global Management.)
“Those countries that build power, that support data, that support advanced data, advanced AI, advanced power are going to win,” Rowan said. “Those that don’t are going to be left behind. This is going to be table stakes.”
Innovation fueling change in government is part of the thesis behind Steyer’s latest book, “Cheaper, Faster, Better.” In the book, the billionaire argues that consumer demand for climate-related innovations, which are often cheaper as well, will drive adoption.
One example is electric vehicles. Kelley Blue Book reported that EVs now make up about 9% of the car market in the US, nearing a critical 10% adoption threshold. The falling cost of EV ownership has contributed to this trend.
Since this data came out, however, the incoming Trump administration announced it plans to roll back EV tax credits from the Inflation Reduction Act, which could reverse this trend.
Democratic presidential candidate Tom Steyer speaks at “Our Rights, Our Courts” forum New Hampshire Technical Institute’s Concord Community College, Saturday, Feb. 8, 2020, in Concord, N.H. (AP Photo/Andrew Harnik) · ASSOCIATED PRESS
The next wave of climate investments
For investors who want high impact and high returns, Steyer said to stick with the fundamentals.
“People think that the breakthroughs in the technologies are going be gadgets … electric vehicles, batteries, things you can touch,” Steyer said. “I think there’s going be a whole other part of this economy absolutely relevant to climate where returns are going to be really good.”
Some areas of investment Steyer is bullish on include real estate, credit, carbon sequestration, and agriculture. Steyer’s firm has a real estate fund that focuses on optimizing properties for energy efficiency savings to increase the underlying property value, which fits Steyer’s interest in investments that can solve problems in the next decade rather than over the long term.
One such solution that’s getting a lot of attention and investment in the tech world is nuclear energy, with Microsoft (MSFT), Amazon (AMZN), and Google (GOOG) all pouring hundreds of millions of dollars into the space.
But Steyer doesn’t see a bull case there yet.
“Just being part of the energy transition doesn’t necessarily mean that it’s a good investment,” he said, adding, “You’d have to be awfully aggressive” to see nuclear fusion energy scale in the next decade. Even nuclear fission, the form of nuclear energy deployed in power plants today, has risks that should be evaluated closely.
The success of longer-term bets like nuclear energy may depend on investments from Big Tech, which has been willing to take on riskier investments, since the future of its business depends on energy usage.
“Microsoft is definitely really serious about their responsibilities in terms of emissions and climate,” Steyer said. “So they’re willing to go and try something that’s difficult to do and maybe controversial to do.”
Regardless of which climate solution wins or who sits in the Oval Office, Steyer believes the momentum toward solving the climate crisis is clear.
“In my mind, from the standpoint as an American, I would like to see us continue to be a world leader, both from a business standpoint, an economic standpoint, and also a value standpoint,” he said.
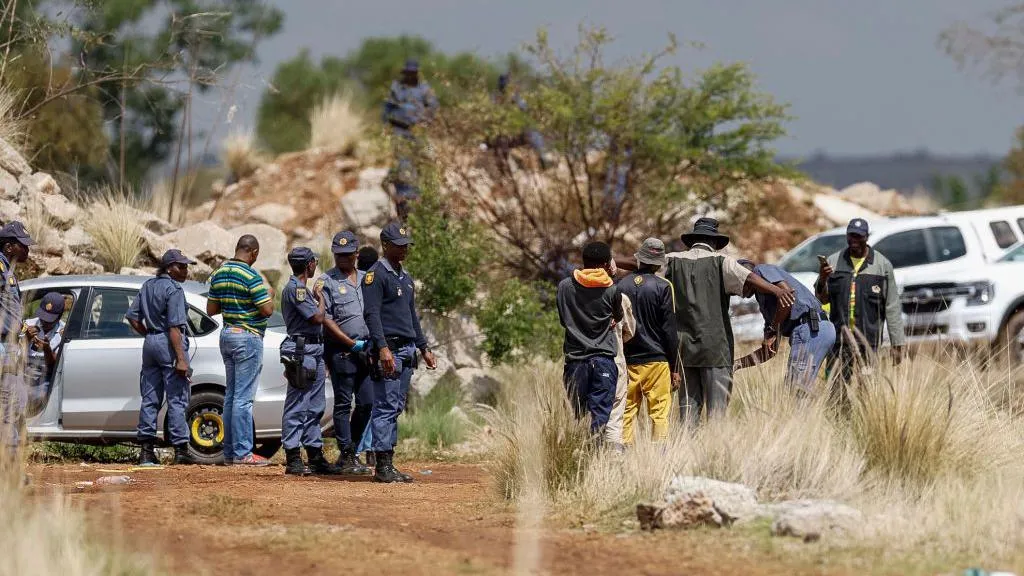
About 1,000 gold miners have already been arrested and the army and police are waiting for the rest
An estimated 4,000 illegal gold miners are hiding underground in South Africa after the government cut off food and water in an effort to “smoke them out” and arrest them.
The miners have been in a mineshaft in Stilfontein, in the North West province, for about a month.
They have refused to cooperate with authorities as some are undocumented – coming from neighbouring countries like Lesotho and Mozambique – and fear being deported.
Illegal miners are called “zama zama” (“take a chance” in Zulu) and operate in abandoned mines in the mineral-rich country. Illegal mining costs the South African government hundreds of millions of dollars in lost sales each year.
Many South African mines have closed down in recent years and workers have been sacked.
To survive, the miners and undocumented migrants go beneath the surface to escape poverty and dig up gold to sell it on the black market.
Some spend months underground – there is even a small economy of people selling food, cigarettes and cooked meals to the miners.
Local residents have pleaded with the authorities to assist the miners, but they have refused.
“We are going to smoke them out. They will come out. We are not sending help to criminals. Criminals are not to be helped – they are to be persecuted [sic],” said Minister in the Presidency Khumbudzo Ntshavheni on Wednesday.
Police are hesitant to go into the mine as some of those underground may be armed.
Some are part of criminal syndicates or “recruited” to be in one, Busi Thabane, from Benchmarks Foundation, a charity which monitors corporations in South Africa, told the BBC’s NewsDay programme.
Without any access to supplies, conditions underground are said to be dire.
“It is no longer about illegal miners – this is a humanitarian crisis,” said Ms Thabane.
On Thursday, community leader Thembile Botman told the BBC that volunteers had used ropes and seat belts to pull a body out of the mine.
“The stench of decomposing bodies has left the volunteers traumatised,” he said.
It’s not clear how the person died.
Although the authorities have been blocking food and water, they have temporarily allowed local residents to send some supplies down by rope.
Mr Botman said they had been communicating with the miners by notes written on pieces of paper.
Police have blocked off entrances and exits in an effort to compel the miners to come out.
This is part of the Vala Umgodi, or “Close the Hole”, operation to curb illegal mining.
Five miners were pulled out on Wednesday by rope, but they were frail and weak. Paramedics attended to them, and then they were taken into police custody.
In the last week, 1,000 miners have emerged and been arrested.
Police and the army are still at the scene waiting to detain those who are not in need of medical care after resurfacing.
“It’s not as easy as the police make it seem – some of them are fearing for their lives,” said Ms Thabane.
Many miners spend months underground in unsafe conditions to provide for their families.
“For many of them it’s the only way they know how to put food on the table,” said Ms Thabane.
Local residents wait near the mineshaft in Stilfontein
Local residents have also attempted to convince the miners to come out of the mineshaft.
“Those people must come out because we have brothers there, we have sons there, the fathers of our kids are there, our children are struggling,” local resident Emily Photsoa told AFP.
The South African Human Rights Commission says it will investigate the police for depriving the miners of food and water.
It said there is concern that the government’s operation could have an impact on the right to life.
Minister Ntshavheni’s remarks have provoked mixed reaction from South Africans, with some praising the government’s unyielding approach.
“I love this. Finally, our government is not tiptoeing on these serious matters. Decisiveness will help this country,” one person wrote on X.
While others felt the stance was inhumane.
“In my view, this kind of talk from the Minister in the Presidency is disgraceful and dangerous hate speech,” one user said.
Another wrote: “They are criminals but they have rights too.”
Illegal mining is a lucrative business across many of South Africa’s mining towns.
Since December last year, nearly 400 high-calibre firearms, thousands of bullets, uncut diamonds and money have been confiscated from illegal miners.
This is part of an intensive police and military operation to stop the practice that has severe environmental implications.
Vancouver, British Columbia–(Newsfile Corp. – November 14, 2024) – Emperor Metals Inc. (CSE: AUOZ) (OTCQB: EMAUF) (FSE: 9NH), an innovative Canadian mineral exploration company, is thrilled to announce its participation at the highly anticipated 2024 New Orleans Investment Conference, held from November 20-23 at the Hilton New Orleans Riverside.
Celebrating its 50th year, the New Orleans Investment Conference remains one of the most influential gatherings for resource investors and industry leaders. Emperor Metals will showcase its flagship Duquesne West Gold Project located in the Abitibi Greenstone Belt of Rouyn-Noranda, Quebec. The project boasts a 2011 historical resource of 727,000 ounces of gold at 5.42 g/t and an average thickness of 5.71 meters.
Since the property acquisition in 2022, the company has used advanced AI-driven 3D geological modeling. These efforts have laid the groundwork for adapting the traditional underground mine model to a more dynamic and cost-effective open pit mining concept, significantly enhancing the project’s scale and potential.
In 2024, Emperor Metals built on its Phase II drilling program momentum by completing over 8,000 meters of drilling. This program aimed to further delineate resources and enhance the open-pit model. Notably, in October 2024, the company announced the expansion of near-surface mineralization at the Duquesne West Gold Deposit, intersecting 52.1 meters of 0.8 g/t Au, underscoring the project’s potential for significant resource growth. See the Oct. 29, 2024, Press Release for full details.
“The New Orleans Investment Conference offers a unique platform to connect with forward-thinking investors and partners who share our passion for exploration and growth,” said John Florek, President and CEO of Emperor Metals. “With AI and modern geological modeling, we’re transforming data into actionable insights that expand our resource potential. We’re excited to share our journey and discuss what lies ahead as we redefine our growth trajectory.”
Sunrise Presentation
CEO John Florek will present during the event on Thursday, Nov 21, at 7:15 a.m. in Churchill C1, second floor. Investors are invited to join and learn about the company’s innovative approach, recent discoveries, and strategic roadmap for building a sustainable, high-impact gold resource portfolio. Attendees are also invited to meet the Emperor team at booth 226. For further information and registration for the conference, please visit neworleansconference.com.
About Emperor Metals Inc.
Emperor Metals Inc. is a forward-thinking Canadian mineral exploration company dedicated to advancing high-grade gold properties in Canada’s most promising geological regions. With a focus on integrating advanced technology and sustainable practices, Emperor Metals is well-positioned to create significant shareholder value while responsibly developing resources. Visit emperormetals.com for more information.
This release contains forward-looking statements, reflecting current management expectations on future events. These statements are subject to risks and uncertainties; actual outcomes may differ significantly.
Vancouver, British Columbia–(Newsfile Corp. – November 14, 2024) – Riverside Resources Inc.(TSXV: RRI) (OTCQB: RVSDF) (FSE: 5YY) (“Riverside” or the “Company”), is pleased to announce the completed transfer of its three key Ontario gold properties: Pichette, Oakes, and Duc to its wholly-owned subsidiary, Blue Jay Resources Inc (“Blue Jay”). This move lays the groundwork for Riverside’s strategic plan to advance its Ontario portfolio by establishing Blue Jay as a standalone exploration company. Blue Jay can fully focus on the exploration, discovery, and value-creation potential that these assets deserve. This structure provides Riverside shareholders with exposure to potential gains, while also paving the way for capital investment aimed at unlocking value in these properties.
This approach is similar to Riverside’s past strategy with Capitan Silver Corp. (“CAPT”), where Riverside shareholders received shares of CAPT, which gained value as exploration progressed successfully. Now, Blue Jay offers another opportunity to further unlock shareholder value, while Riverside retains a 2% NSR on each project.
Blue Jay is led by Geordie Mark as Chief Executive Officer, with the company in the final stages of appointing its Chairman, John-Mark Staude, along with a strong lineup of board of directors. Geordie brings extensive experience in the mining industry, with leadership roles spanning exploration, academia, and financial markets. He has spent over 15 years as a mining analyst on both the buy and sell sides in North American equity markets. Under Geordie’s leadership, Blue Jay will leverage Riverside’s Ontario-based gold assets and is already working on an exploration strategy, with plans to initiate a targeted drill campaign during H1 2025.
“We are excited to see Blue Jay Resources rapidly progress towards becoming a focused exploration company, dedicated to advancing this quality portfolio of Ontario gold assets. This spinout provides our shareholders with exposure to a new vehicle for value creation, while Riverside retains upside through a 2% net smelter royalty (NSR) on the projects,” said Dr. John-Mark Staude, CEO of Riverside Resources. “Our goal is to unlock the inherent value of these properties for our shareholders through the potential share spinout.”
Geordie Mark, CEO of Blue Jay Resources, stated, “I’m thrilled by the opportunity to lead Blue Jay as we explore Ontario’s well-established Beardmore-Geraldton greenstone belt, especially in such a proactive mining jurisdiction. Both the Pichette and Oakes projects are strategically positioned near the Equinox Gold Greenstone Gold project, Canada’s 4th largest open pit gold mine, which emphasizes the potential of this area. Our team is committed to realizing the value of these assets through a focused exploration strategy, and we’re eager to expand our work.”
The proposed spinout structure includes Riverside potentially issuing shares of Blue Jay to Riverside shareholders, allowing them direct ownership in the new exploration-focused entity. While terms of the spinout are under consideration and have not been finalized, Riverside’s intention is to ensure shareholders can benefit from the success of both Riverside and Blue Jay Resources and provide positive upside for the growth of both companies.
About the Projects:
Pichette Project The Pichette Gold Project, covering approximately 1190 hectares, is situated in the prolific Geraldton-Beardmore Greenstone Belt of Northwestern Ontario, a renowned gold-producing region in Canada. This 100%-owned project is strategically positioned near Equinox Gold’s Greenstone Gold Project, Canada’s newest large-scale mine and immediately east of Beardmore mining camp that produced from high grade veins similar to some of the targets found at Pichette.
Historical drilling at Pichette, primarily conducted in the 1950s, intersected shallow high-grade gold mineralization, including notable intercepts such as 3.4 meters at 16.7 g/t Au and 3.2 meters at 4.8 g/t Au, associated with banded iron formations (“BIF”). These BIF structures, which span over 15 kilometers of interpreted trend across the project, remain largely untested at depth, with gold mineralization open along strike. Positioned for efficient exploration, Pichette has road access via the Trans-Canada Highway and benefits from existing regional infrastructure. The assay information is historic in nature and will be retested as part of the planned work for Blue Jay to carry out in 2025.
Oakes Project The Oakes Gold Project, located within the productive Geraldton-Beardmore Greenstone Belt in Northwestern Ontario, sits 20km east of the Equinox Gold’s Greenstone Gold Mine. The project is approximately 5200 hectares in size and hosts a series of parallel favorable geology and shear zones with gold mineralization identified along its length. Historical drilling and recent surface sampling have returned high-grade gold values, with drill intercepts of up to 8 g/t Au and surface assays over 30 g/t Au. Geophysical surveys, including magnetics and induced polarization, have mapped several fault zones and structural features aligned with known geological units, offering significant exploration potential.
The project is accessible with robust local infrastructure, including roads, train line and power, which supports low-cost exploration efforts. The future exploration program could expand on previous findings by further testing mineralized zones along strike and at depth, positioning Oakes as a strong candidate for additional high-grade gold discoveries in a historically productive district.
Duc Project The Duc Project is located in the Porcupine Mining Division, approximately 50 km southwest of Kapuskasing, Ontario. Covering 580 hectares, it sits within the highly prospective Kapuskasing Structural Zone, near the open-pit phosphate mine of Agrium Ltd. The property is underlain by a mix of metasedimentary and metavolcanic rocks, with potential for gold and rare earth element (REE) mineralization. Recent exploration, including a 2023 helicopter magnetics survey, has confirmed key structural elements and identified promising areas for follow-up targeting work.
The Company is leading exploration efforts at Duc, focusing on gold mineralization and potential platinum group metals (PGMs). Historical drilling and geophysical data suggest significant gold and nickel potential, while current geophysical surveys have highlighted new targets. Planned work includes further integration of the new geophysical surveys, geochemical analysis, and then drilling to refine these targets and advance the project towards more detailed exploration.
Qualified Person & QA/QC: The scientific and technical data contained in this news release was reviewed and approved by Freeman Smith, P.Geo, a non-independent qualified person to Riverside Resources who is responsible for ensuring that the information provided in this news release is accurate and who acts as a “qualified person” under National Instrument 43-101 Standards of Disclosure for Mineral Projects.
About Riverside Resources Inc.: Riverside is a well-funded exploration company driven by value generation and discovery. The Company has over $5M in cash, no debt and less than 75M shares outstanding with a strong portfolio of gold-silver and copper assets and royalties in North America. Riverside has extensive experience and knowledge operating in Mexico and Canada and leverages its large database to generate a portfolio of prospective mineral properties. In addition to Riverside’s own exploration spending, the Company also strives to diversify risk by securing joint-venture and spin-out partnerships to advance multiple assets simultaneously and create more chances for discovery. Riverside has properties available for option, with information available on the Company’s website at www.rivres.com.
ON BEHALF OF RIVERSIDE RESOURCES INC.
“John-Mark Staude”
Dr. John-Mark Staude, President & CEO
For additional information contact:
John-Mark Staude President, CEO Riverside Resources Inc. info@rivres.com Phone: (778) 327-6671 Fax: (778) 327-6675 Web: www.rivres.com
Eric Negraeff Investor Relations Riverside Resources Inc. Phone: (778) 327-6671 TF: (877) RIV-RES1 Web: www.rivres.com
Certain statements in this press release may be considered forward-looking information. These statements can be identified by the use of forward-looking terminology (e.g., “expect”,” estimates”, “intends”, “anticipates”, “believes”, “plans”). Such information involves known and unknown risks — including the availability of funds, the results of financing and exploration activities, the interpretation of exploration results and other geological data, or unanticipated costs and expenses and other risks identified by Riverside in its public securities filings that may cause actual events to differ materially from current expectations. Readers are cautioned not to place undue reliance on these forward-looking statements, which speak only as of the date of this press release.
Neither the TSX Venture Exchange nor its Regulation Services Provider (as that term is defined in the policies of the TSX Venture Exchange) accepts responsibility for the adequacy or accuracy of this release.
October’s Consumer Price Index (CPI) will serve as the latest test of whether an inflation resurgence is a risk to the US economy as the Federal Reserve debates its next interest rate decision after cutting rates by a quarter percentage point last week.
The report, set for release at 8:30 a.m. ET on Wednesday, is expected to show headline inflation of 2.6%, a slight uptick from September’s 2.4% annual gain in prices, which marked the lowest annual headline reading since February 2021. Consumer prices are expected to have risen 0.2% over the prior month, matching the monthly increase seen in September.
On a “core” basis, which strips out the more volatile costs of food and gas, prices in October are expected to have risen 3.3% over last year for the third consecutive month. Economists expect monthly core price increases to also match the prior month’s reading of 0.3%, according to Bloomberg data.
“The October CPI report will likely support the notion that the last mile of inflation’s journey back to target will be the hardest,” Wells Fargo’s lead economist Jay Bryson wrote in a note to clients on Friday.
Bank of America economists Stephen Juneau and Jeseo Park agreed, writing in a preview note on Monday that “inflation [is] unlikely to show much progress” and that the upcoming CPI print will likely show inflation “moving sideways after a period of substantial disinflation.”
Although inflation has been slowing, it has remained above the Federal Reserve’s 2% target on an annual basis.
Compared to the current Biden administration, Trump and his proposed policies have been viewed as potentially more inflationary due to the president-elect’s campaign promises of high tariffs on imported goods, tax cuts for corporations, and curbs on immigration.
In a press conference following the latest rate cut, Federal Reserve Chair Jerome Powell said the central bank does not and will not make decisions based on expected policy changes from a new administration.
“In the near term, the election will have no effect on our policy decisions,” he said at the time. “We don’t know what the timing and substance of any policy changes will be. We, therefore, don’t know what the effects on the economy would be, specifically whether and to what extent those policies would matter for the achievement of our goal variables: maximum employment and price stability.”
Federal Reserve Board Chairman Jerome Powell speaks during a news conference at the Federal Reserve in Washington, Thursday, Nov. 7, 2024. (AP Photo/Mark Schiefelbein) · ASSOCIATED PRESS
As of Tuesday, markets continued to price in another 25 basis point cut in December, although the probability investors put on the central bank holding rates steady increased to roughly 35% compared to 22% one week ago, per the CME FedWatch Tool.
“Given Chair Powell’s remarks last week, we believe that would keep the Fed on track to cut rates again by 25 basis points at its December meeting,” BofA’s Juneau and Park wrote. “That said, the shift in risks around inflation, coupled with the resilience of the US economy, has increased uncertainty over the medium-term policy outlook.”
“While economic fundamentals suggest inflation should continue to moderate, policy changes pose an upside risk to the outlook,” the duo added.
Alexandra Canal is a Senior Reporter at Yahoo Finance. Follow her on X @allie_canal, LinkedIn, and email her at alexandra.canal@yahoofinance.com.
Vancouver, British Columbia–(Newsfile Corp. – November 12, 2024) – Silver47 Exploration Corp. (TSXV: AGA) (“Silver47” or the “Company), is pleased to announce the commencement of trading on the TSX Venture Exchange (the “TSXV“) under the new symbol “AGA“, effective at the open of trading on November 14, 2024.
Silver47’s listing on the TSXV marks a major milestone for the Company as it advances its strategy to continue to develop its exploration projects, including its flagship Red Mountain VMS project located in central Alaska, USA. The Red Mountain VMS project is detailed in the technical report titled “Technical Report on the Red Mountain VMS Property, Bonnifield Mining District, Alaska, USA” commissioned by the Company and completed by Apex Geoscience Ltd. and has been filed on the Company’s SEDAR+ profile at www.sedarplus.ca and is available on the Company’s website www.silver47.ca . Additional information about the Company can be found in Silver47’s long form prospectus dated October 25, 2024 available at www.sedarplus.ca.
Gary R. Thompson, Chief Executive Officer, commented:“We are excited to bring Silver47 to the market at a time when silver and gold prices have made tremendous moves higher this year. Silver47 is well positioned to capitalize on this rising demand trend in metals. The objective of the Company is to rapidly grow its resource base toward a milestone development decision while generating new discoveries.”
This news release does not constitute an offer to sell or a solicitation of an offer to buy any of the securities in the United States. The securities have not been and will not be registered under the United States Securities Act of 1933, as amended (the “U.S. Securities Act“) or any state securities laws and may not be offered or sold within the United States unless registered under the U.S. Securities Act and applicable state securities laws or an exemption from such registration is available.
About Silver47 Exploration Corp. Silver47 is a Canadian exploration company focused on advancing its mining projects. Silver47 wholly-owns three exploration projects: the flagship Red Mountain VMS silver-zinc-lead-copper-gold project located in south central Alaska, USA; the Adams Plateau silver-zinc-lead-copper Project located in southern British Columbia; and the Michelle silver-lead-zinc-gallium-antimony Project located in the Yukon Territory. For more information about Silver47, please visit our website at www.silver47.ca.
On Behalf of the Board of Directors Mr. Gary R. Thompson, Director and CEO info@silver47.ca
No securities regulatory authority has either approved or disapproved of the contents of this release. Neither the TSXV nor its Regulation Services Provider (as that term is defined in the policies of the TSXV) accepts responsibility for the adequacy or accuracy of this release.
FORWARD-LOOKING STATEMENTS
Information set forth in this news release may involve forward-looking statements under applicable securities laws. Forward-looking statements are statements that relate to future, not past, events. In this context, forward-looking statements often address expected future business and financial performance, and often contain words such as “anticipate”, “believe”, “plan”, “estimate”, “expect”, and “intend”, statements that an action or event “may”, “might”, “could”, “should”, or “will” be taken or occur, including statements relating to the Company, its future plans and strategy relating to its properties or other similar expressions, the market for gold and silver and the Company’s ability to capitalize on same, the Company’s objectives, and all statements, other than statements of historical fact included herein including, without limitation, statements regarding the securities herein. By their nature, forward-looking statements involve known and unknown risks, uncertainties and other factors which may cause our actual results, performance or achievements, or other future events, to be materially different from any future results, performance or achievements expressed or implied by such forward-looking statements. Such factors include, among others, the following risks: the need for additional financing; operational risks associated with mineral exploration; regulatory risks; fluctuations in commodity prices; title matters; and the additional risks identified in the Company’s disclosure filed under its issuer profile on SEDAR+ or other reports and filings with the TSXV and applicable Canadian securities regulators. Forward-looking statements are made based on management’s beliefs, estimates and opinions on the date that statements are made and the Company undertakes no obligation to update forward-looking statements if these beliefs, estimates and opinions or other circumstances should change, except as required by applicable securities laws. Investors are cautioned against attributing undue certainty to forward-looking statements.
NOT FOR DISTRIBUTION TO U.S. NEWSWIRE SERVICES OR FOR DISTRIBUTION OR DISSEMINATION IN OR INTO THE U.S.
Initial Bulk Sample Returns 11.6 g/t Gold from 861 Tonnes
North Vancouver, British Columbia–(Newsfile Corp. – November 12, 2024) – Lion One Metals Limited (TSXV: LIO) (OTCQX: LOMLF) (“Lion One” or the “Company”) is pleased to report that the development of a new high-grade near-surface roscoelite zone has commenced at the company’s 100% owned Tuvatu high-grade alkaline gold mine on the island of Viti Levu in Fiji.
Lion One CEO Walter Berukoff stated, “Quartz-roscoelite veining is the most economically significant mineral assemblage at several world class alkaline gold deposits that are similar to Tuvatu. Roscoelite is a defining characteristic of these alkaline systems and it is directly associated with high-grade gold. An initial bulk sample of the near-surface roscoelite zone at Tuvatu has returned 11.6 g/t gold from 861 tonnes of material mined at full mining widths. We are now enhancing our mine plan with this gold-rich roscoelite material, which is already being processed through the pilot plant”.
Roscoelite veining is directly related to high-grade mineralization at the nearby Vatukoula gold mine in Fiji where over 7 million ounces of gold have been produced over the last 85 years. Roscoelite is also observed in association with gold mineralization at the Porgera gold mine in PNG, which has been a top ten ranked gold mine globally and which has produced over 25 million ounces of gold.
At Porgera, the most economically significant veins are the Stage II quartz-roscoelite-pyrite veins with native gold, found in the Roamane fault zone.1 At Tuvatu the high-grade Stage II veins also ubiquitously occur with roscoelite – a rare dark green to black vanadium rich mica mineral.2 This same mineral assemblage is observed in the near-surface roscoelite zone at Tuvatu, which consists of a series of intersecting flat and sub-vertical banded veins composed primarily of low-temperature chalcedonic quartz intergrown with roscoelite, pyrite, lesser sphalerite and galena, and native gold. This same mineral assemblage is also observed at the high-grade Zone 500 at 500m depth in Tuvatu, at the West Zone near-mine expansion target 300 m to the West of Tuvatu, as well as in drill core throughout the Tuvatu deposit (Figure 1). See news releases: Lion One drills 20.86 g/t Au over 75.9 m from Zone 500, June 6, 2022, and Lion One drills 105.2 g/t Au over 2.1 m from near-mine exploration at the West Zone, October 1, 2024.
Tuvatu is optimally located on Fiji’s Viti Levu lineament, with a tectonic history and structural setting that created ideal conditions for the vertical ascent of deep alkalic magmas and the formation of the Navilawa volcanic caldera. Within the caldera, the precipitation of metals from hydrothemal fluids occurred through episodic phases of boiling, mixing and cooling. The presence of roscoelite in direct association with high-grade gold mineralization reflects a rare combination of criteria, shared by other notable world-class alkaline gold deposits, thus underscoring the enormous potential for Tuvatu as part of a potentially much larger high-grade alkaline gold system within Fiji’s Navilawa Caldera.
Figure 1. Example high-grade mineralization from Porgera3 (left), the new near-surface roscoelite zone at Tuvatu (center), and Zone 500 at Tuvatu (right; TUG-141 drill core, 492.5 m depth, 25.23 g/t Au). High grade mineralization at Porgera, Zone 500, and the new near-surface roscoelite zone at Tuvatu all consist of veins composed of quartz-roscoelite-pyrite with native gold.
Figure 2. Location of the new roscoelite zone in relation to underground developments. The new roscoelite zone is in Zone 2 of Tuvatu, in the northwest part of the deposit, approximately 65 m below surface. Preliminary evidence indicates that the zone extends to additional levels below the current underground workings.
Figure 3. Location of the new roscoelite zone in relation to Zone 500. Mineralization observed in the new near-surface roscoelite zone is like that observed in the high-grade Zone 500, which is approximately 350 m below the current underground workings.
The near-surface roscoelite zone at Tuvatu is located 65 m below surface and consists of a series of flat-lying and vertical veins. The strongest gold mineralization occurs in blow-out zones at the intersection of these structures (Figure 4). The primary vertical structures in this zone consist of quartz vein arrays with roscoelite and minor base metal sulfides, while the primary flat-lying structures consist of low-temperature quartz-roscoelite-pyrite veins. Both sets of veins contain high-grade gold. This is a very similar scenario to that observed at the Porgera gold mine, wherein there are high-grade ore shoots formed at the intersection of early Stage I base metal veins with later Stage II quartz-roscoelite-pyrite veins, with both sets of veins containing gold.1,4 In the near surface roscoelite zone at Tuvatu there is evidence of multiple stacked flat-lying quartz-roscoelite-pyrite veins, which would produce multiple stacked shoots of high-grade mineralization at the intersection of vertical structures below the current underground workings.
Figure 4. Simplified conceptual illustration of intersecting structures in the near-surface roscoelite zone. Multiple flat-lying quartz-roscoelite-pyrite veins have been observed underground.
1. Ronacher, E. (2002). The Porgera gold deposit: Fluid characteristics, ore deposition processes, and duration of the ore forming event. [Doctoral Thesis, University of Alberta]. p 55. Link to report 2. Schmidt, D. (2023). Petrographic Characterization and Evolution of the Alkalic-Type Epithermal Tuvatu Au-Te Deposit, Fiji. [Masters Thesis, Colorado School of Mines]. P50. Link to report 3. Supplied image of Porgera rock sample. 4. Cameron, G. (1998). The Hydrothermal Evolution and Genesis of the Porgera Gold Deposit, Papua New Guinea. [Doctoral Thesis, Australian National University]. p 53. Link to report
Competent Persons Statement The information in this report that relates to mineral exploration at the Tuvatu Gold Project is based on information compiled by the Lion One team and reviewed by Melvyn Levrel, who is the company’s Senior Geologist. Mr Levrel is a Member of the Australian Institute of Geoscientists and has sufficient experience that is relevant to the style of mineralisation and type of deposit under consideration, and to the activity being undertaken, to qualify as a Competent Person as defined in the 2012 edition of the ‘Australasian Code for Reporting of Exploration Results, Mineral Resources and Ore Reserves’ (JORC code). Mr Levrel consents to the inclusion in this report of the matters based on the information in the form and context in which it appears.
Lion One Laboratories / QAQC Lion One adheres to rigorous QAQC procedures above and beyond basic regulatory guidelines in conducting its drilling, sampling, testing, and analyses. The Company operates its own geochemical assay laboratory and its own fleet of diamond drill rigs using PQ, HQ and NQ sized drill rods.
Diamond drill core samples are logged and split by Lion One personnel on site and delivered to the Lion One Laboratory for preparation and analysis. All samples are pulverized at the Lion One lab to 85% passing through 75 microns and gold analysis is carried out using fire assay with an AA finish. Samples that return grades greater than 10.00 g/t Au are re-analyzed by gravimetric method, which is considered more accurate for very high-grade samples.
Duplicates of 5% of samples with grades above 0.5 g/t Au are delivered to ALS Global Laboratories in Australia for check assay determinations using the same methods (Au-AA26 and Au-GRA22 where applicable). ALS also analyses 33 pathfinder elements by HF-HNO3-HClO4 acid digestion, HCl leach and ICP-AES (method ME-ICP61). The Lion One lab can test a range of up to 71 elements through Inductively Coupled Plasma Optical Emission Spectrometry (ICP-OES), but currently focuses on a suite of 23 important pathfinder elements with an aqua regia digest and ICP-OES finish.
About Lion One Metals Limited Lion One Metals is an emerging Canadian gold producer headquartered in North Vancouver BC, with new operations established in late 2023 at its 100% owned Tuvatu Alkaline Gold Project in Fiji. The Tuvatu project comprises the high-grade Tuvatu Alkaline Gold Deposit, the Underground Gold Mine, the Pilot Plant, and the Assay Lab. The Company also has an extensive exploration license covering the entire Navilawa Caldera, which is host to multiple mineralized zones and highly prospective exploration targets.
On behalf of the Board of Directors, Walter Berukoff, Chairman & CEO
Neither the TSX-V nor its Regulation Service Provider accepts responsibility or the adequacy or accuracy of this release
This press release may contain statements that may be deemed to be “forward-looking statements” within the meaning of applicable Canadian securities legislation. All statements, other than statements of historical fact, included herein are forward-looking information. Generally, forward-looking information may be identified by the use of forward-looking terminology such as “plans”, “expects” or “does not expect”, “proposed”, “is expected”, “budget”, “scheduled”, “estimates”, “forecasts”, “intends”, “anticipates” or “does not anticipate”, or “believes”, or variations of such words and phrases, or by the use of words or phrases which state that certain actions, events or results may, could, would, or might occur or be achieved. This forward-looking information reflects Lion One Metals Limited’s current beliefs and is based on information currently available to Lion One Metals Limited and on assumptions Lion One Metals Limited believes are reasonable. These assumptions include, but are not limited to, the actual results of exploration projects being equivalent to or better than estimated results in technical reports, assessment reports, and other geological reports or prior exploration results. Forward-looking information is subject to known and unknown risks, uncertainties and other factors that may cause the actual results, level of activity, performance, or achievements of Lion One Metals Limited or its subsidiaries to be materially different from those expressed or implied by such forward-looking information. Such risks and other factors may include, but are not limited to: the stage development of Lion One Metals Limited, general business, economic, competitive, political and social uncertainties; the actual results of current research and development or operational activities; competition; uncertainty as to patent applications and intellectual property rights; product liability and lack of insurance; delay or failure to receive board or regulatory approvals; changes in legislation, including environmental legislation, affecting mining, timing and availability of external financing on acceptable terms; not realizing on the potential benefits of technology; conclusions of economic evaluations; and lack of qualified, skilled labor or loss of key individuals. Although Lion One Metals Limited has attempted to identify important factors that could cause actual results to differ materially from those contained in forward-looking information, there may be other factors that cause results not to be as anticipated, estimated, or intended. Accordingly, readers should not place undue reliance on forward-looking information. Lion One Metals Limited does not undertake to update any forward-looking information, except in accordance with applicable securities laws.
TORONTO, Ontario – (NewMediaWire) – November 11, 2024 – Silver Crown Royalties Inc. (“Silver Crown”, “SCRi”, the “Corporation”, or the “Company”) (Cboe:SCRI; OTCQX:SLCRF; FRA:QS0) is pleased to announce financial results and MD&A for the third quarter ended September 30, 2024 are being filed on SEDAR+ and our website today.
In the third quarter, SCRi received payments on 4,245 silver ounces (C$164,425). This compares favorably to the prior quarter ended June 30, 2024 of 2,880 ounces (C$107,875) and last year’s third quarter ended September 30, 2023 of 1,500 ounces (C$42,627).
Peter Bures, Silver Crown’s Chief Executive Officer, commented, “We’re very proud to note that over the last year, we were able to increase silver delivery payments by 183%. Further, we increased revenues by almost 300% while the silver price increased 40% over the same timeframe. With our robust pipeline of opportunities, we continue to target aggressive silver delivery growth into next year and beyond.”
Summary of Quarterly Results:
Three months ended 30-Sep-24
Three months ended 30-Jun-24
Three months ended 30-Sep-23
Attributable Silver Deliveries
4,245
2,880
1,500
% change (Q/Q and Y/Y)
47%
183%
Revenue
164,425
107,785
42,627
% change (Q/Q and Y/Y)
52%
286%
ABOUT SILVER CROWN ROYALTIES INC.
Founded by industry veterans, Silver Crown is a publicly traded, silver royalty company. SCRi currently has four silver royalties of which two are revenue-generating. Its business model presents investors with precious metals exposure allowing for a natural hedge against currency devaluation while minimizing the negative impact of cost inflation associated with production. SCRi endeavors to minimize the economic impact on mining projects while maximizing returns for shareholders.
This release contains certain “forward-looking statements” and certain “forward-looking information” as defined under applicable Canadian and U.S. securities laws. Forward-looking statements and information can generally be identified by the use of forward-looking terminology such as “may”, “will”, “should”, “expect”, “intend”, “estimate”, “anticipate”, “believe”, “continue”, “plans” or similar terminology. The forward-looking information contained herein is provided for the purpose of assisting readers in understanding management’s current expectations and plans relating to the future. Readers are cautioned that such information may not be appropriate for other purposes. Forward-looking statements and information include but are not limited to statements with respect to our robust pipeline of opportunities, we continue to target aggressive silver delivery growth into next year and beyond. Forward-looking statements and information are based on forecasts of future results, estimates of amounts not yet determinable and assumptions that, while believed by management to be reasonable, are inherently subject to significant business, economic and competitive uncertainties and contingencies. Forward-looking information is subject to known and unknown risks, uncertainties and other factors that may cause the actual actions, events or results to be materially different from those expressed or implied by such forward-looking information, including but not limited to: the impact of general business and economic conditions; the absence of control over mining operations from which SCRi will purchase gold and other metals or from which it will receive royalty payments and risks related to those mining operations, including risks related to international operations, government and environmental regulation, delays in mine construction and operations, actual results of mining and current exploration activities, conclusions of economic evaluations and changes in project parameters as plans continue to be refined; accidents, equipment breakdowns, title matters, labor disputes or other unanticipated difficulties or interruptions in operations; SCRi’s ability to enter into definitive agreements and close proposed royalty transactions; the inherent uncertainties related to the valuations ascribed by SCRi to its royalty interests; problems inherent to the marketability of gold and other metals; the inherent uncertainty of production and cost estimates and the potential for unexpected costs and expenses; industry conditions, including fluctuations in the price of the primary commodities mined at such operations, fluctuations in foreign exchange rates and fluctuations in interest rates; government entities interpreting existing tax legislation or enacting new tax legislation in a way which adversely affects SCRi; stock market volatility; regulatory restrictions; liability, competition, the potential impact of epidemics, pandemics or other public health crises on SCRi’s business, operations and financial condition, loss of key employees. SCRi has attempted to identify important factors that could cause actual results to differ materially from those contained in forward-looking statements, there may be other factors that cause results not to be as anticipated, estimated or intended. There can be no assurance that such statements will prove to be accurate, as actual results and future events could differ materially from those anticipated in such statements. Accordingly, readers are advised not to place undue reliance on forward-looking statements or information. SCRi undertakes no obligation to update forward-looking information except as required by applicable law. Such forward-looking information represents management’s best judgment based on information currently available.
This document does not constitute an offer to sell, or a solicitation of an offer to buy, securities of the Company in Canada, the United States or any other jurisdiction. Any such offer to sell or solicitation of an offer to buy the securities described herein will be made only pursuant to subscription documentation between the Company and prospective purchasers. Any such offering will be made in reliance upon exemptions from the prospectus and registration requirements under applicable securities laws, pursuant to a subscription agreement to be entered into by the Company and prospective investors. There can be no assurance that forward-looking statements will prove to be accurate, as actual results and future events could differ materially from those anticipated in such statements. Accordingly, the reader is cautioned not to place undue reliance on forward-looking statements.
CBOE CANADA DOES NOT ACCEPT RESPONSIBILITY FOR THE ADEQUACY OR ACCURACY OF THIS NEWS RELEASE.
Sign up to Stay Up to Date on News and Progress from Page