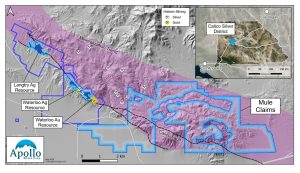
Vancouver, British Columbia, May 20, 2025 – Apollo Silver Corp. (“Apollo” or the “Company”) (TSX.V: APGO, OTCQB: APGOF, Frankfurt: 6ZF0) is pleased to announce it has acquired 2,215 hectares (“ha”) of highly prospective claims contiguous to its Waterloo property at its Calico Silver Project (“Calico” or “Calico Project”). The newly acquired claims herein referred to as the Mule claims comprise 415 lode mining claims, and have been acquired from LAC Exploration LLC (“LAC”), a wholly-owned subsidiary of Lithium Americas Corp. (TSX: LAC; NYSE: LAC), who were the previous operators of the property. Preliminary mapping and sampling conducted by the prior operator of the Mule claims identified several high-grade silver targets, which will be evaluated as part of Apollo’s future exploration planning.
In addition, a mapping and sampling program was recently completed at the Burcham gold prospect area in the southwest region of the Waterloo property (see news release dated February 12, 2025). This program confirmed the importance of the Calico fault system with respect to controls on the silver (“Ag)” and gold (“Au”) mineralization in the area and has identified the potential for copper (“Cu”), zinc (“Zn”) and lead (“Pb”) mineralization associated with stratabound and mantos lenses.
Highlights:
- Mule claims expand the Calico Project land package by over 285%, from 1,194 ha to 3,409 ha of contiguous claims.
- Mule claims trend along the mineralized Calico Fault System responsible for mineralization seen at Calico.
- Reports from the prior operator indicate that there are several strongly anomalous silver values on the property, which Apollo will attempt to ground-truth in the coming exploration programs.
- Sampling done across the Mule claims by previous operator has identified a large Ag anomaly associated with the same suite of host rocks at the Waterloo property.
- Exploration at the Burcham prospect at Waterloo included assays from 27 surface samples:
- Assay peaks up to 14.10 g/t Au, 20.70 g/t Ag, 0.17% Cu, 22.80% Zn and 5.74 % Pb from various samples (see Table 1).
- Identification of strata-bound lenses and mantos that show strong potential for Cu, Zn and Pb mineralization.
Ross McElroy, President and CEO of Apollo, commented, “The addition of the Mule claims substantially enhances the Calico Project. Calico already hosts 3 discrete drill delineated zones with resource estimates along a 4km long trend, along the Calico fault zone. The Mule claims increase the overall land area of the Calico project by more than 2.5x. The new claims are strategically located to the east along the very prolific Calico mineralized corridor and represent a great opportunity for further discoveries. Apollo is committed to continuing to unlock value in California for our shareholders.”
Mule Claims Acquisition
The Mule claims are composed of 415 lode mining claims administered by the Bureau of Land Management. Mapping and sampling conducted by the previous operators across the Mule claims has identified a continuation of the mineralized Calico Fault System. The sedimentary rocks of the Barstow formation which hosts the Waterloo silver deposit, as well as the volcanic Pickhandle formation are pronounced all over the acquired claims. The contact between the Barstow and Pickhandle formation has demonstrated potential for gold mineralization as is seen at Waterloo. Sampling across the Mule claims has identified several strong Ag and Au anomalies. Apollo plans to conduct its own follow up exploration program on the Mule claims to better develop its own exploration targets and delineate where this highly prospective contact is exposed.
Details of the Transaction
The Mule claims were acquired by Apollo’s wholly owned U.S. subsidiary, Stronghold Silver USA Corp. (“Stronghold”), from LAC. As consideration for the acquisition, Apollo paid US$250,000 in cash, and LAC retains a 2.0% net smelter return royalty (the “Royalty”) on the Mule claims.
Apollo, through Stronghold, retains the right to buy back 1.0% of the Royalty at any time on or before the date that is thirty (30) days from the date of commencement of commercial production, for a payment of US$1,000,000.
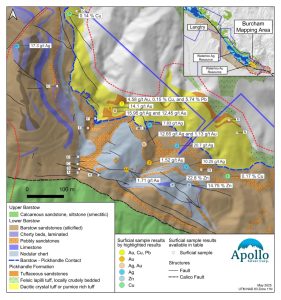
Figure 1: Map of Calico Project in San Bernardino, California
2025 Burcham Exploration Program
The Company has completed its previously announced surface exploration work at its Burcham prospect (see news release dated February 12, 2025). The work completed consisted of detailed mapping, sample collection and target generation, with the aim to follow up with future drilling.
The exploration team has completed some of the most detailed mapping to date at the Calico Project, including previous programs at Langtry and Waterloo. Structures dominating at Burcham are similar to those at Waterloo with the system being dominated by the Calico Fault, a sinuous moderately plunging reverse fault that dips steeply to the north. Potential for Au mineralization is strong along the contact of the Burcham and Pickhandle formations. Previously unrecognised, stratiform mantos and lenses occupying fold flexures show strong potential for Cu mineralization. This type of mantos have been historically mined on the north side of the Waterloo deposit, and occur near the contact between the Pickhandle Formation and the overlying Barstow Formation. Historic mining on the North side of Waterloo Deposit targeted a manto about 1.5 m thick. Copper mineralization is associated with strong hydrothermal alteration which is seen to diminish as you move eastward along the property. Assays of the sample results are presented in Table 1.
Figure 2: Summary Map of Burcham Exploration Program
Table 1: Location and Assay Results of Samples Collected
Sampling and Quality Assurance/Quality Control
Grab samples were collected in the field and a 2 kg representative sample was sent for analysis. Rock samples are catalogued and securely stored in a warehouse facility in Barstow, California until they are ready for secure shipment to ALS Global Geochemistry in Reno, Nevada (“ALS Reno”) for sample preparation and gold analysis. After preparation, splits of prepared pulps are securely shipped to ALS Vancouver, British Columbia for analysis.
Samples were prepared at ALS Reno (Prep-31 package) with each sample crushed to better than 70% passing a 2 mm (Tyler 9 mesh, U.S. Std. No. 10) screen. A split of 250 g is taken and pulverized to better than 85% passing a 75-micron (Tyler 200 mesh, U.S Std. No 200) screen. Surface samples were analyzed using complete characterization via the CCP-PK05 methods, which include whole rock analysis (ME-ICP06), ME-MS61, single element trace method using aqua regia digestion and ICP-MS (ME-MS42) and rare earth elements using the method ME-ME81, which consists of lithium borate fusion followed by ICP-MS. All surface samples were submitted for gold analysis by fire assay (Au-AA23). Over-range samples analyzed for copper, lead and zinc were re-submitted for analysis using a four-acid digestion and ICP-AES finish (method OG62) with a range of 0.001-50% for copper, 0.001-20% for lead, and 0.001-30% for zinc. Gold was analyzed by fire assay with atomic absorption finish (method Au-AA25) with a reportable range of 0.01-100 ppm Au. All analyses were completed at ALS Vancouver except for gold by fire assay, which was completed at ALS Reno.
Apollo’s QA/QC program includes ongoing auditing of all results from the laboratories. The Company’s Qualified Person is of the opinion that the sample preparation, analytical, and security procedures followed are sufficient and reliable. The Company is not aware of any sampling issues or other factors that could materially affect the accuracy or reliability of the data reported herein.
2025 Marketing Initiatives
The Company also announces that it has engaged Creative Direct Marketing Group, Inc. (“CDMG”), an arm’s-length service provider, to provide creative services in accordance with the policies of the TSX Venture Exchange (“TSXV”) and applicable securities laws. Based in Nashville, Tennessee, CDMG specializes in marketing, advertising, and public awareness across various sectors, including mining and metals.
Pursuant to a work order dated May 16, 2025 (the “Agreement”), the Company has retained CDMG’s for a one-time fee of approximately US$129,800. The Agreement represents a creative budget for marketing and advertising services (the “Services”), enabling CDMG to begin preparing content that may be used in future campaigns. No specific marketing campaign has been prepared, approved, or scheduled at this time. The engagement is subject to the approval of the TSX Venture Exchange.
Qualified Person
The scientific and technical data contained in this news release was reviewed and approved by Isabelle Lépine, M.Sc., P.Geo., Apollo’s Director, Mineral Resources. Ms. Lépine is a registered professional geologist in British Columbia and a QP as defined by NI 43-101 and is not an independent of the Company.
About Apollo Silver
Apollo Silver has assembled an experienced and technically strong leadership team who have joined to advance quality precious metals projects in sought after jurisdictions. The Company is focused on advancing its portfolio of two prospective silver exploration and resource development projects, the Calico Project, in San Bernardino County, California and the Cinco de Mayo Project, in Chihuahua, Mexico.
Please visit www.apollosilver.com for further information.
ON BEHALF OF THE BOARD OF DIRECTORS
Ross McElroy, President and CEO
For further information, please contact:
Amandip Singh, VP Corporate Development
Telephone: +1 (604) 428-6128
Email: info@apollosilver.com
Neither the TSX Venture Exchange nor its Regulation Services Provider (as that term is defined in the policies of the TSX Venture Exchange) accepts responsibility for the adequacy or accuracy of this release.
Cautionary Statement Regarding “Forward-Looking” Information
This news release includes “forward-looking statements” and “forward-looking information” within the meaning of Canadian securities legislation. All statements included in this news release, other than statements of historical fact, are forward-looking statements including, without limitation the expected benefits and strategic rationale of the Mule claims acquisition; the timing, scope, and success of planned exploration activities, including mapping, sampling, and drilling at the Burcham prospect; the potential for silver, gold, and copper mineralization; and the Company’s ability to advance, develop, and permit the Calico Project. Forward-looking statements include predictions, projections and forecasts and are often, but not always, identified by the use of words such as “anticipate”, “believe”, “plan”, “estimate”, “expect”, “potential”, “target”, “budget” and “intend” and statements that an event or result “may”, “will”, “should”, “could” or “might” occur or be achieved and other similar expressions and includes the negatives thereof.
Forward-looking statements are based on the reasonable assumptions, estimates, analysis, and opinions of the management of the Company made in light of its experience and its perception of trends, current conditions and expected developments, as well as other factors that management of the Company believes to be relevant and reasonable in the circumstances at the date that such statements are made. Forward-looking information is based on reasonable assumptions that have been made by the Company as at the date of such information and is subject to known and unknown risks, uncertainties and other factors that may have caused actual results, level of activity, performance or achievements of the Company to be materially different from those expressed or implied by such forward-looking information, including but not limited to: risks associated with mineral exploration and development; metal and mineral prices; availability of capital; accuracy of the Company’s projections and estimates; realization of mineral resource estimates, interest and exchange rates; competition; stock price fluctuations; availability of drilling equipment and access; actual results of current exploration activities; government regulation; political or economic developments; environmental risks; insurance risks; capital expenditures; operating or technical difficulties in connection with development activities; personnel relations; and changes in Project parameters as plans continue to be refined. Forward-looking statements are based on assumptions management believes to be reasonable, including but not limited to the price of silver, gold and Ba; the demand for silver, gold and Ba; the ability to carry on exploration and development activities; the timely receipt of any required approvals; the ability to obtain qualified personnel, equipment and services in a timely and cost-efficient manner; the ability to operate in a safe, efficient and effective matter; and the regulatory framework regarding environmental matters, and such other assumptions and factors as set out herein. Although the Company has attempted to identify important factors that could cause actual results to differ materially from those contained in forward-looking information, there may be other factors that cause results not to be as anticipated, estimated or intended. There can be no assurance that forward-looking statements will prove to be accurate and actual results, and future events could differ materially from those anticipated in such statements. Accordingly, readers should not place undue reliance on forward looking information contained herein, except in accordance with applicable securities laws. The forward-looking information contained herein is presented for the purpose of assisting investors in understanding the Company’s expected financial and operational performance and the Company’s plans and objectives and may not be appropriate for other purposes. The Company does not undertake to update any forward-looking information, except in accordance with applicable securities laws.