Vancouver, British Columbia–(Newsfile Corp. – July 30, 2024) – Goldshore Resources Inc. (TSXV: GSHR) (OTCQB: GSHRF) (FSE: 8X00) (“Goldshore” or the “Company“) is pleased to announce that it has secured funding of CAD $4,875,000 through the 100% early exercise of 37,500,000 common share purchase warrants. These warrants were issued at an exercise price of CAD $0.13 per share, with a 36 month term, in connection with the Company’s non-brokered private placement, which closed on November 17, 2023.
Michael Henrichsen, CEO of Goldshore commented, “The exercise of these warrants provides a significant boost to our treasury, securing funding through the completion of the Preliminary Economic Assessment (“PEA”) expected in Q1 2025 and supporting the acceleration of our strategic plan to unlock the full value and potential of the Moss Gold Deposit. I would like to extend my sincere thanks to members of the SAF Group, insiders, and all close associates that participated in this warrant exercise for their continued support.”
Issuance of RSUs
The Company has also issued 150,000 restricted share units (“RSUs“) to Shawn Khunkhun, a director of the Company. The RSUs will fully vest on July 29, 2025, one year from the date of grant. Once vested, each RSU represents the right to receive one Common Share, the equivalent cash value thereof, or a combination of the two, at the Company’s discretion. The issuance of RSUs have been made in accordance with the Company’s Omnibus Incentive Plan (the “Plan“) that was approved by the Company’s shareholders on January 23, 2024.
About Goldshore
Goldshore is a growth-oriented gold company focused on delivering long-term shareholder and stakeholder value through the acquisition and advancement of primary gold assets in tier-one jurisdictions. It is led by the ex-global head of structural geology for the world’s largest gold company and backed by one of Canada’s pre-eminent private equity firms. The Company’s current focus is the advanced stage 100% owned Moss Gold Project which is positioned in Ontario, Canada, with direct access from the Trans-Canada Highway, hydroelectric power near site, supportive local communities and skilled workforce. The Company has invested over $60 million of new capital and completed approximately 80,000 meters of drilling on the Moss Gold Project, which, in aggregate, has had over 235,000 meters of drilling. The 2024 updated NI 43-101 mineral resource estimate (“MRE”) has expanded to 1.54 million ounces of Indicated gold resources at 1.23 g/t Au and 5.20 million ounces of Inferred gold resources at 1.11 g/t Au. The MRE only encompasses 3.6 kilometers of the 35+ kilometer mineralized trend, remains open at depth and along strike and is one of the few remaining major Canadian gold deposits positioned for fast track through this development cycle. For more information, please visit SEDAR+ (www.sedarplus.ca) and the Company’s website (www.goldshoreresources.com).
For More Information – Please Contact:
Michael Henrichsen President, Chief Executive Officer and Director Goldshore Resources Inc.
Neither the TSXV nor its Regulation Services Provider (as that term is defined in the policies of the TSXV) accepts responsibility for the adequacy or accuracy of this release.
This news release contains statements that constitute “forward-looking statements.” Such forward looking statements involve known and unknown risks, uncertainties and other factors that may cause the Company’s actual results, performance or achievements, or developments to differ materially from the anticipated results, performance or achievements expressed or implied by such forward-looking statements. Forward looking statements are statements that are not historical facts and are generally, but not always, identified by the words “expects,” “plans,” “anticipates,” “believes,” “intends,” “estimates,” “projects,” “potential” and similar expressions, or that events or conditions “will,” “would,” “may,” “could” or “should” occur.
Forward-looking statements in this news release include, among others, statements relating to expectations regarding the exploration and development of the Moss Gold Project, the timing of completion and release of an updated preliminary economic assessment, the timing and completion of a strategic permitting plan and other statements that are not historical facts. By their nature, forward-looking statements involve known and unknown risks, uncertainties and other factors which may cause our actual results, performance or achievements, or other future events, to be materially different from any future results, performance or achievements expressed or implied by such forward-looking statements. Such factors and risks include, among others: the Company may require additional financing from time to time in order to continue its operations which may not be available when needed or on acceptable terms and conditions acceptable; compliance with extensive government regulation; domestic and foreign laws and regulations could adversely affect the Company’s business and results of operations; the stock markets have experienced volatility that often has been unrelated to the performance of companies and these fluctuations may adversely affect the price of the Company’s securities, regardless of its operating performance; and the impact of COVID-19.
The forward-looking information contained in this news release represents the expectations of the Company as of the date of this news release and, accordingly, is subject to change after such date. Readers should not place undue importance on forward-looking information and should not rely upon this information as of any other date. The Company undertakes no obligation to update these forward-looking statements in the event that management’s beliefs, estimates or opinions, or other factors, should change.
VANCOUVER, BC, July 30, 2024 /CNW/ – Nations Royalty Corp. (“Nations Royalty” or the “Company“) (TSXV: NRC) is pleased to be informed that the British Columbia Provincial Government has granted ‘Substantially Started’ designation for Seabridge Gold Inc.’s (“Seabridge“) KSM Project, located in the Golden Triangle of northwest British Columbia.
The Substantially Started designation allows for the KSM Project’s Provincial Environmental Assessment Certificate (“EAC“) to be valid in perpetuity over the life of the KSM Project and is no longer subject to expiry. With this designation, KSM is the largest, permitted copper-gold development project in the world. The deposit hosts 47.3M ounces of Au and 7.3B pounds of Cu in Proven and Probable Reserves1. According to Seabridge’s news release dated July 26, 2024, Seabridge has spent over $800 million to advance the KSM Project since the EAC was issued. Development completed to date includes significant work such as road and power infrastructure, as well as camp construction.
Nations Royalty holds the right to receive an annual benefit payment entitlement on the KSM Project that is calculated by reference to the amount of tax payable by the project operator under the Mineral Tax Act (British Columbia) for the life of the KSM Project (the “KSM Payment Entitlement“). The KSM Payment Entitlement was negotiated by the Nisga’a Nation and recently contributed to Nations Royalty as part of a royalty portfolio (see the Company’s news release dated June 20, 2024). The Nisga’a Nation is a founder and the major shareholder of Nations Royalty.
“Nations Royalty wishes to congratulate Seabridge and acknowledge the work completed by the Government of British Columbia, as well as the thorough consultation with Indigenous Groups and nearby communities, including Nisga’a and Tahltan,” said Kody Penner, Vice President of Corporate Development for Nations Royalty. “We look forward to all groups continuing to work together to advance the KSM Project and fruitful outcomes to Seabridge’s joint venture discussions. Our Payment Entitlement, on the large, long-life copper-gold-silver-molybdenum Deposit, is a core piece of the foundation for the future success of Nations Royalty.”
KSM Project Proven and Probable Mineral Reserves as of May 26, 20221
Diluted Grades
Contained Metal
Ore (Mt)
Au(g/t)
Cu (%)
Ag (g/t)
Mo (ppm)
Au (Moz)
Cu (Mlb)
Ag (Moz)
Mo (Mlb)
Proven
1,297
0.71
0.15
2.4
75
29.6
4,203
98
215
Probable
995
0.55
0.14
1.9
77
17.7
3,116
62
170
Total Proven & Probable
2,292
0.64
0.14
2.2
76
47.3
7,320
160
385
1.
Source KSM (Kerr-Sulphurets-Mitchell) Prefeasibility Study and Preliminary Economic Assessment, Prepared for Seabridge Gold Inc. August 8, 2022. The Mineral Reserve Estimates were reviewed by Jim Gray, P.Eng. (who is also the Independent Qualified Person for these Mineral Reserve Estimates) reported using the 2014 CIM Definition Standards and 2019 CIM Estimation of Mineral Resources and Mineral Reserves Best Practice Guidelines and have an effective date of May 26, 2022.
About Nations Royalty Corp.
The Company’s vision is to unite First Nations and Indigenous groups across Canada, welcoming external investors to join the Company as shareholders. Together, they will combine royalties, income and commodity streams and annual benefit payment entitlements from resource projects, tapping into the growth, diversification and value potential typical of publicly traded royalty companies. As a leader in the spirit of economic reconciliation, Nations Royalty’s mission includes capacity building of Indigenous People in public companies and capital markets.
Nations Royalty’s foundation begins with the right to receive five annual payment entitlements in place in respect of the following properties in Canada:
The high-grade Brucejack gold mine operated by Pretium Resources Inc., a wholly-owned indirect subsidiary of Newmont Corporation, a large underground gold mine;
The KSM Copper-Gold-Silver-Molybdenum deposit, currently in development by Seabridge Gold Inc.;
The Premier Gold Project, currently being commissioned by Ascot Resources Ltd. with first gold pour completed in April 2024;
The Red Mountain Gold Deposit, owned by Ascot Resources Ltd.; and
The Kitsault Molybdenum Deposit, a large, fully permitted brownfield site owned and being actively advanced by New Moly LLC, majority-owned by Resource Capital Fund VI L.P.
Qualified Person
Andrew Hamilton, P.Geo, a “qualified person” within the meaning of National Instrument 43-101 Standards of Disclosure for Mineral Projects and has reviewed and approved the technical disclosure in this press release.
On behalf of the Board of Directors of Nations Royalty Corp.
“Robert McLeod” Chief Executive Officer
Neither the TSX Venture Exchange nor its Regulation Services Provider (as that term is defined in the policies of the TSX Venture Exchange) accepts responsibility for the adequacy or accuracy of this release.
Technical and Third-Party Information
Except where otherwise stated, the disclosure in this news release relating to the KSM Project is based on information publicly disclosed by the owners or operators of this property and information/data available in the public domain as at the date hereof and none of this information has been independently verified by Nations Royalty or its qualified person. Specifically, as the holder of the KSM Payment Entitlement, Nations Royalty has limited, if any, access to the KSM Project. Although Nations Royalty does not have any knowledge that such information may not be accurate, there can be no assurance that such third-party information is complete or accurate.
Cautionary Statement Regarding Forward-Looking Information
Except for the statements of historical fact, this news release contains “forward-looking information” within the meaning of applicable Canadian securities legislation. When used in this news release, the words “estimate”, “project”, “belief”, “anticipate”, “intend”, “expect”, “plan”, “predict”, “may” or “should” and the negative of these words, or variations thereon or comparable terminology are intended to identify forward-looking statements and information. The forward-looking statements and information in this news release include information relating to: the business plans, mineral reserves, objectives and expected outcomes of Nations Royalty and the projects in which Nations’ Royalty holds an interest, including the advancement of the KSM Project. Such forward-looking information is based on the Company’s expectations, estimates and projections as at the date of this news release.
By their nature, forward-looking statements involve known and unknown risks, uncertainties and other factors, which may cause actual results, performance or achievements to differ materially from those expressed or implied by such statements, including but not limited to: the potential inability of the Company to continue as a going concern, risks associated with potential governmental and/or regulatory action with respect to the Company’s operations and the potential inability of the Company to implement its business plan going forward, risks of mineral reserve estimates not being accurate, risks related to the absence of control over mining operations from which Nations Royalty will receive annual benefit payments and risks related to those mining operations, with respect to the KSM Project, the risk that the opportunities for the advancement of the KSM Project may not materialize, the KSM Project does not ultimately go into production, and potential joint venture partners not favourably concluding joint venture discussions, and the other risks and uncertainties applicable to the Company’s business as set forth in the Company’s management discussion and analysis and its Filing Statement dated June 14, 2024, both of which are available for viewing under the Company’s profile at www.sedarplus.ca. Such statements and information reflect the current view of the Company and are based on information currently available to the Company. In connection with the forward-looking information contained in this news release, the Company has made assumptions about the advancement of the KSM Project and receipt of the annual benefit payment. The Company has also assumed that no significant events will occur outside the Company’s normal course of business. Although the Company believes that the assumptions inherent in the forward-looking information are reasonable, forward-looking information is not a guarantee of future performance and accordingly undue reliance should not be put on such information due to the inherent uncertainty therein.
Any forward-looking information speaks only as of the date on which it is made and, except as may be required by applicable securities laws, the Company disclaims any intent or obligation to update any forward-looking information, whether as a result of new information, future events or results or otherwise.
Kelowna, British Columbia–(Newsfile Corp. – July 30, 2024) – F3 Uranium Corp(TSXV: FUU) (OTCQB: FUUFF) (“F3” or “the Company“) is pleased to announce final assay results from the winter 2024 drill program, including PLN24-137 which was cored in the JR Zone (see NR April 16, 2024) and which returned 15.0m of 3.2% U3O8, including a high grade 2.5m interval averaging 18.6% U3O8, further including the ultra-high grade core with 1.5m of 30.3% U3O8.
Exploration geochemistry for the continuing summer drill program has also been received up to hole PLN24-152 which focused on drill testing both the A1 main shear, as well as a related fault splay termed the “North Horse” grid south of the cross-cutting Harrison Fault, a significant structure corresponding to a vertical offset of approximately 130m. Two radioactive intervals (see NR June 12, 2024) corresponding to the main A1 and North Horse structures respectively yielded the strongest exploration geochemistry results outside of JR Zone to date, with the main A1 intersect assaying 0.045% U3O8, and the North Horse intersect assaying 0.014% U3O8 over 7 meters including 0.051% U3O8 over 0.5m (see Photo 1).
A series of shorter exploration drill holes have been completed on the main A1 shear infilling gaps, and although there are multiple areas warranting follow up, exploration drilling in the near term will focus on the areas near Harrison Fault, and to the southeast.
Sam Hartmann, Vice President Exploration, commented:
“We are very pleased with these ongoing results. Drillhole PLN24-152 stands out with the strongest geochemistry signatures to date outside of the JR Zone and represents one of the highest priority exploration targets for follow up. This hole targeted the intersect of the Harrison Fault and the A1 Main shear zone just south of the Harrison Fault. Targeting in this area now includes the Harrison Fault itself, and the areas of shear intersections with it. We are persistent in our efforts to hone in on potential high-grade mineralization indicated by encouraging results from our systematic drilling in this area.”
Table 1. Drill Hole Summary and Uranium Assay Results
Collar Information
Assay Results
Hole ID
Grid Line
Easting
Northing
Elevation
Az
Dip
From (m)
To (m)
Interval (m)
U3O8 weight %
PLN24-132
090S
587708.0
6410637.5
545.6
55.0
-58.1
no mineralization >0.05
PLN24-133
2850S
589506.9
6408515.5
529.3
55.0
-71.7
B1 Exploration; no mineralization >0.05
PLN24-134
435S
587868.1
6410326.1
530.7
53.6
-64.6
B1 Exploration; no mineralization >0.05
PLN24-135
3240S
589630.4
6408142.8
535.4
52.1
-70.3
B1 Exploration; no mineralization >0.05
PLN24-136
630S
588165.6
6410302.3
536.3
54.4
-58.7
A1 Exploration; no mineralization >0.05
PLN24-137
040S
587780.2
6410753.3
545.6
55.4
-75.0
202.50
214.00
11.50
0.13
214.00
216.50
2.50
18.61
incl
214.50
216.00
1.50
30.27
216.50
217.50
1.50
0.26
PLN24-138
2850S
589493.8
6408505.0
530.1
51.8
-76
B1 Exploration; no mineralization >0.05
PLN24-139
795S
588289.3
6410186.5
532.6
54
-59
A1 Exploration; no mineralization >0.05
PLN24-140
2325S
589060.2
6408857.6
543.9
55.7
-60
A1 Exploration; no mineralization >0.05
PLN24-141
3240S
589622.4
6408136.8
535.5
57.7
-73
B1 Exploration; no mineralization >0.05
PLN24-142
2850S
589560.6
6408554.7
530.5
53.5
-76
B1 Exploration; no mineralization >0.05
PLN24-143
2325S
589059.0
6408856.8
543.9
54.7
-67
B1 Exploration; no mineralization >0.05
PLN24-144
2820S
589485.3
6408554.4
529.6
54.1
-75
B1 Exploration; no mineralization >0.05
PLN24-145
2325S
589095.3
6408883.2
543.9
52.9
-66
A1 Exploration; no mineralization >0.05
PLN24-146
2850S
589424.5
6408454.7
533.3
50.7
-78
B1 Exploration; no mineralization >0.05
PLN24-147
2370S
589105.9
6408835.4
543.7
56.9
-70
A1 Exploration; no mineralization >0.05
PLN24-148
2280S
589072.1
6408921.7
543.9
55.5
-74
A1 Exploration; no mineralization >0.05
PLN24-149
795S
588316.1
6410208.7
530.8
53.9
-59
A1 Exploration; no mineralization >0.05
PLN24-150
1125S
588460.1
6409904.8
533.3
58.1
-70
A1 Exploration; no mineralization >0.05
PLN24-151
1530S
588676.0
6409561.0
544.5
54.1
-70
A1 Exploration; no mineralization >0.05
PLN24-152
2850S
589259.2
6408356.8
537.2
53.1
-68
440.5
441
0.5
0.051
Assay composite parameters:
1: Minimum Thickness of 0.5 m 2: Assay Grade Cut-Off: 0.05% U3O8 (weight %) 3. Maximum Internal Dilution: 2.0 m
Natural gamma radiation in the drill core that is reported in this news release was measured in counts per second (cps) using a handheld Radiation Solutions RS-125 scintillometer. The Company considers greater than 300 cps on the handheld spectrometer as anomalous, >10,000 cps as high grade and greater than 65,535 cps as off-scale. The reader is cautioned that scintillometer readings are not directly or uniformly related to uranium grades of the rock sample measured and should be used only as a preliminary indication of the presence of radioactive materials.
Composited weight % U3O8 mineralized intervals are summarized in Table 1. Samples from the drill core are split into half sections on site. Where possible, samples are standardized at 0.5m down-hole intervals. One-half of the split sample is sent to SRC Geoanalytical Laboratories (an SCC ISO/IEC 17025: 2005 Accredited Facility) in Saskatoon, SK while the other half remains on site for reference. Analysis includes a 63 element suite including boron by ICP-OES, uranium by ICP-MS and gold analysis by ICP-OES and/or AAS.
The Company considers uranium mineralization with assay results of greater than 1.0 weight % U3O8 as “high grade” and results greater than 20.0 weight % U3O8 as “ultra-high grade”.
All depth measurements reported are down-hole and true thickness are yet to be determined.
About Patterson Lake North:
The Company’s 4,078-hectare 100% owned Patterson Lake North property (PLN) is located just within the south-western edge of the Athabasca Basin in proximity to Fission Uranium’s Triple R and NexGen Energy’s Arrow high-grade world class uranium deposits which is poised to become the next major area of development for new uranium operations in northern Saskatchewan. PLN is accessed by Provincial Highway 955, which transects the property, and the new JR Zone uranium discovery is located 23km northwest of Fission Uranium’s Triple R deposit.
Qualified Person:
The technical information in this news release has been prepare in accordance with the Canadian regulatory requirements set out in National Instrument 43-101 and approved on behalf of the company by Raymond Ashley, P.Geo., President & COO of F3 Uranium Corp, a Qualified Person. Mr. Ashley has verified the data disclosed.
About F3 Uranium Corp.:
F3 Uranium is a uranium project generator and exploration company, focusing on projects in the Athabasca Basin, home to some of the world’s largest high grade uranium discoveries. F3 Uranium currently has 20 projects in the Athabasca Basin. Several of F3’s projects are near large uranium discoveries including Triple R, Arrow and Hurricane. F3 has announced a transaction pursuant to which it will transfer 17 of its prospective uranium exploration properties to F4 in exchange for common shares of F4 which will be distributed to F3 shareholders on the basis of one F4 Share for every common share of F3 held; the F4 shares will then be rolled back at a rate of 10 to 1. F3 will retain the PLN Project consisting of the PLN, Misto and Broach properties. The Broach property incorporates the PW property which it obtained from CanAlaska as the result of a property swap.
This news release contains certain forward-looking statements within the meaning of applicable securities laws. All statements that are not historical facts, including without limitation, statements regarding future estimates, plans, programs, forecasts, projections, objectives, assumptions, expectations or beliefs of future performance, including statements regarding the suitability of the Properties for mining exploration, future payments, issuance of shares and work commitment funds, entry into of a definitive option agreement respecting the Properties, are “forward-looking statements.” These forward-looking statements reflect the expectations or beliefs of management of the Company based on information currently available to it. Forward-looking statements are subject to a number of risks and uncertainties, including those detailed from time to time in filings made by the Company with securities regulatory authorities, which may cause actual outcomes to differ materially from those discussed in the forward-looking statements. These factors should be considered carefully and readers are cautioned not to place undue reliance on such forward-looking statements. The forward-looking statements and information contained in this news release are made as of the date hereof and the Company undertakes no obligation to update publicly or revise any forward-looking statements or information, whether as a result of new information, future events or otherwise, unless so required by applicable securities laws.
The TSX Venture Exchange and the Canadian Securities Exchange have not reviewed, approved or disapproved the contents of this press release, and do not accept responsibility for the adequacy or accuracy of this release.
F3 Uranium Corp. 750-1620 Dickson Avenue Kelowna, BC V1Y9Y2
Contact Information Investor Relations Telephone: 778 484 8030 Email: ir@f3uranium.com
ON BEHALF OF THE BOARD “Dev Randhawa” Dev Randhawa, CEO
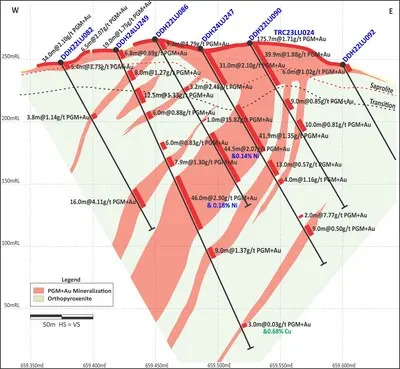
Highlights include 69m at 3.8g/t PGM+Au including 5m at 25.4g/t PGM+Au, 45m at 5.0g/t PGM+Au, and 24.9m at 5.9g/t PGM+Au, 0.12% Ni
VANCOUVER, BC, July 29, 2024 /CNW/ – Bravo Mining Corp. (TSXV: BRVO) (OTCQX: BRVMF), (“Bravo” or the “Company“) has received assay results from fifteen diamond drill holes (“DDH”) from the North Sector at its 100% owned Luanga palladium + platinum + rhodium + gold + nickel deposit (“Luanga deposit” or “Luanga PGM+Au+Ni deposit“), located in the Carajás Mineral Province, state of Pará, Brazil.
“The numerous thick high-grade drill intercepts from the North Sector of the Luanga deposit has significantly enhanced the resource potential in this area, thus establishing a second centre of gravity for the Luanga deposit,” said Luis Azevedo, Chairman and CEO. “In the Luanga deposit mineral resource estimate (“MRE”. See press release October 22, 2023), the Central Sector was seen to host a large proportion of the mineral resources, largely due to the concentration of historical holes and Bravo drilling. In contrast, the North Sector had only seen limited drilling at the time of the MRE. However, Bravo’s recent drilling, has consistently intercepted thicker zones of higher-grade mineralization within 150m of surface, as illustrated by the sections in this press release.”
Highlights Include:
Drilling in the North Sector continues to show improvements in both grade and thickness compared to historic drilling in this sector.
Mineralization intersected to date (see Sections 1 and 2) lies within 150m of surface and is open to further extension at depth.
The North Sector at the Luanga deposit is now recognised as a second centre of gravity of multiple thick high grade mineralized zones.
The current round of BHEM (bore-hole electromagnetic) surveying is close to completion. Drilling has recommencing at T5, testing new conductors along strike defined by this work. This will be followed by drilling at new and re-evaluated HeliTEM targets.
HOLE-ID
From
To
Thickness(m)
Pd
Pt
Rh
Au
PGM + Au
Ni* (%)Sulphide
TYPE
(m)
(m)
(g/t)
(g/t)
(g/t)
(g/t)
(g/t)
DDH24LU245
3.00
72.40
69.40
1.63
1.82
0.23
0.08
3.77
NA
FR/LS
including
9.20
14.20
5.00
8.81
14.99
1.62
0.01
25.42
NA
FR/LS
Also including
44.05
72.40
28.35
1.76
0.94
0.14
0.18
3.01
0.25
FR
And
115.00
143.00
28.00
1.58
1.28
0.19
0.04
3.10
0.02
FR
DDH24LU247
0.00
31.00
31.00
1.05
0.81
0.22
0.01
2.10
NA
Ox
DDH24LU248
45.40
70.30
24.90
2.31
3.27
0.27
0.03
5.88
0.12
FR/LS
including
45.40
55.40
10.00
4.48
7.36
0.58
0.04
12.46
0.08
FR/LS
DDH24LU249
111.40
157.40
46.00
1.41
0.69
0.14
0.06
2.30
0.18
FR
DDH24LU250
111.50
117.50
6.00
4.18
2.92
0.49
0.32
7.91
0.11
FR
And
124.50
131.50
7.00
2.25
1.85
0.34
0.08
4.52
0.08
FR
And
66.80
67.80
1.00
156.45
158.25
>10.0
2.16
326.85
0.06
FR
DDH24LU252
0.00
152.30
152.30
0.40
0.75
0.04
<0.01
1.20
NA
Ox/FR
DDH24LU254
84.50
92.50
8.00
2.76
1.28
0.24
0.19
4.47
0.15
FR
And
21.35
64.70
43.35
1.52
0.80
0.13
0.22
2.67
0.20
FR
DDH24LU258
0.00
45.60
45.60
2.48
1.85
0.34
0.34
5.01
NA
Ox
DDH24LU259
8.60
10.60
2.00
12.76
42.15
4.79
2.59
62.28
NA
Ox
Notes: All ‘From’, ‘To’ depths, and ‘Thicknesses’ are downhole. ‘NA’ Not applicable for Oxide material. Given orientation of drilling and mineralization, intercepts are estimated at 125% to 140% of true thickness in the North Sector. Type: Ox = Oxide. FR = Fresh Rock. LS = Low Sulphide. Recovery methods and results will differ based on the type of mineralization. *Bravo’s nickel grades are sulphide nickel, and do not include non-recoverable silicate nickel, unlike historical total nickel assays.
Luanga Drilling Update
Results from fifteen diamond drill holes have been received from the North Sector of the Luanga PGM+Au+Ni deposit. All the drill holes reported herein are angled holes (-60 degrees), towards an azimuth of 090°. Together, this set of drill holes comprise a total of 3,212.45 metres of diamond drilling.
Section 1 (Figure 1) in the North Sector shows infill and step-out drilling, with DDH24LU249 being the deepest drill hole on the section, exhibiting a wide zone of mineralization, open at depth, within 150m from surface, and consistently increasing in grade from DDH22LU090 to DDH24LU247 to DDH22LU086 to DDH24LU249. Trenching (TR23LU024) in this area also demonstrates the significant volume of near surface oxide mineralization. These results continue to bode well for potential future MRE updates. In comparison, the Central Sector has been defined to depths of up to 400m below surface, more than twice the depth of current drilling in the North Sector. The addition of a second centre of gravity for the Luanga PGM+Au+Ni deposit has potential to enhance future project economics, as and when demonstrated, mineralization could potentially be extracted from shallower depths for longer periods.
Figure 1: North Sector (Section 1 on Figure 3). High-grade and thick mineralization near surface and continuing at depth. (CNW Group/Bravo Mining Corp.)
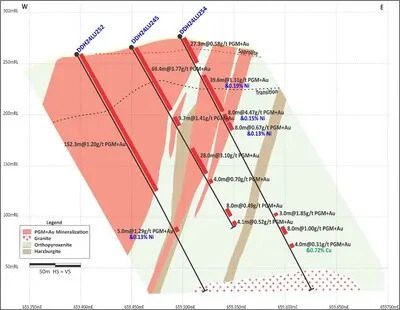
Section 2 (Figure 2) is an infill section in the North Sector. Drilling also shows evidence of increasing thickness at depth, again with mineralization defined to date less than 150m from surface and still open at depth. As with Section 1 and in comparison, to the Central Sector, there is still significant potential to extend mineralization to depth while remaining potentially amenable to open pit exploitation, subject to future economic studies. Furthermore, Section 2 shows high volumes of mineralization in comparison to the volume of unmineralized material, demonstrating the potential for relatively low strip ratios in these areas.
Figure 2: North Sector (Section 2 on Figure 3). Wide zones of mineralization with low proportions of unmineralized material. (CNW Group/Bravo Mining Corp.)
HeliTEM (Helicopter borne EM) and Copper/Gold Exploration Update
Exploration is progressing on both BHEM targets and HeliTEM targets. The current round of BHEM surveying is close to completion. Drilling has recommencing at T5, testing new conductors defined along strike by this work. BHEM is currently in progress at T11. Following the new holes planned at T5, drilling will move to T11, followed by initial testing of new and re-evaluated HeliTEM targets.
Drill Results Status Update
A total of 311 drill holes have been completed by Bravo to date, for 66,366 metres, including 8 metallurgical holes (not subject to routine assaying). Results have been reported for 267 Bravo drill holes to date. Assay results for 36 Bravo drill holes that have been completed are currently outstanding (excluding the metallurgical holes).
Complete Table of Recent Intercepts.
HOLE-ID
From
To
Thickness(m)
Pd
Pt
Rh
Au
PGM + Au
Ni* (%)Sulphide
Cu (%)Sulphide
TYPE
(m)
(m)
(g/t)
(g/t)
(g/t)
(g/t)
(g/t)
DDH24LU243
162.45
169.45
7.00
0.22
0.73
0.04
<0.01
0.99
0.01
FR
DDH24LU245
3.00
72.40
69.40
1.63
1.82
0.23
0.08
3.77
NA
FR/LS
including
9.20
14.20
5.00
8.81
14.99
1.62
0.01
25.42
NA
FR/LS
Also including
44.05
72.40
28.35
1.76
0.94
0.14
0.18
3.01
0.25
FR
And
79.70
89.40
9.70
0.65
0.55
0.09
0.12
1.41
0.09
FR
And
115.00
143.00
28.00
1.58
1.28
0.19
0.04
3.10
0.02
FR
And
150.00
154.00
4.00
0.46
0.19
0.04
0.01
0.70
0.05
FR
And
182.00
190.00
8.00
0.34
0.11
0.02
0.02
0.49
0.07
FR
And
197.00
201.05
4.05
0.40
0.10
0.02
<0.01
0.52
0.05
FR
DDH24LU247
0.00
31.00
31.00
1.05
0.81
0.22
0.01
2.10
NA
Ox
And
51.65
93.50
41.85
0.84
0.41
0.09
0.01
1.35
0.11
FR
including
60.65
76.50
15.85
1.15
0.55
0.12
0.01
1.84
0.13
FR
And
102.50
115.50
13.00
0.27
0.25
0.04
<0.01
0.57
0.03
FR
And
119.50
123.50
4.00
0.77
0.34
0.05
0.01
1.16
0.05
FR
And
151.50
153.50
2.00
5.06
2.49
0.21
0.01
7.77
0.10
FR
And
162.50
171.50
9.00
0.36
0.13
0.01
0.01
0.50
0.06
FR
DDH24LU248
0.00
3.91
3.91
0.79
0.44
0.08
0.01
1.32
NA
Ox
And
45.40
70.30
24.90
2.31
3.27
0.27
0.03
5.88
0.12
FR/LS
including
45.40
55.40
10.00
4.48
7.36
0.58
0.04
12.46
0.08
FR/LS
And
75.90
79.90
4.00
0.86
0.41
0.06
0.02
1.35
0.26
FR
And
96.15
100.30
4.15
0.57
0.31
0.03
0.02
0.93
0.14
FR
DDH24LU249
0.00
6.80
6.80
0.30
0.32
0.06
0.01
0.69
NA
Ox
And
18.00
26.00
8.00
0.27
0.77
0.22
<0.01
1.27
NA
FR/LS
And
33.90
46.35
12.45
0.51
0.77
0.04
0.01
1.33
0.01
FR
And
54.35
60.35
6.00
0.51
0.30
0.06
0.01
0.88
0.06
FR
And
181.10
187.10
6.00
0.25
0.51
0.07
<0.01
0.83
0.01
FR
And
94.10
102.00
7.90
0.36
0.82
0.11
0.02
1.30
0.02
FR
And
111.40
157.40
46.00
1.41
0.69
0.14
0.06
2.30
0.18
FR
And
173.90
182.90
9.00
0.79
0.41
0.09
0.09
1.37
0.14
FR
And
241.00
244.00
3.00
<0.01
<0.01
0.01
0.02
0.03
0.01
0.68
FR
DDH24LU250
111.50
117.50
6.00
4.18
2.92
0.49
0.32
7.91
0.11
FR
And
124.50
131.50
7.00
2.25
1.85
0.34
0.08
4.52
0.08
FR
DDH24LU251
0.00
3.30
3.30
0.36
0.30
0.07
0.01
0.74
NA
Ox
And
66.80
67.80
1.00
156.45
158.25
>10.0
2.16
326.85
0.06
FR
DDH24LU252
0.00
152.30
152.30
0.40
0.75
0.04
<0.01
1.20
NA
Ox/FR
including
0.00
27.45
27.45
0.56
1.41
0.03
0.01
2.00
NA
Ox
And
192.50
197.50
5.00
0.84
0.28
0.04
0.13
1.29
0.13
FR
DDH24LU253
0.00
28.50
28.50
0.36
0.70
0.03
0.01
1.09
NA
Ox
And
120.30
123.30
3.00
0.61
0.28
0.02
<0.01
0.92
0.03
FR
DDH24LU254
0.00
27.30
27.30
0.38
0.12
0.01
0.08
0.58
NA
Ox
And
41.30
80.90
39.60
0.75
0.37
0.06
0.12
1.31
0.19
FR
And
84.50
92.50
8.00
2.76
1.28
0.24
0.19
4.47
0.15
FR
And
93.50
101.50
8.00
0.39
0.21
0.02
0.05
0.67
0.13
FR
And
193.00
196.00
3.00
0.39
1.06
0.39
0.01
1.85
0.05
FR
And
208.00
216.00
8.00
0.55
0.36
0.07
0.01
1.00
0.01
FR
And
227.00
231.00
4.00
0.18
0.06
0.02
0.05
0.31
0.07
0.72
FR
DDH24LU255
0.00
1.84
1.84
1.30
1.28
0.23
0.04
2.85
NA
Ox
And
60.60
63.60
3.00
0.71
0.45
0.06
0.01
1.23
0.02
FR
And
77.60
90.60
13.00
1.08
0.97
0.19
0.01
2.26
0.02
FR
And
152.30
164.30
12.00
0.42
0.21
0.03
0.02
0.68
0.08
FR
And
185.05
185.85
0.80
0.41
0.14
0.05
<0.01
0.60
2.11
FR
DDH24LU256
0.00
8.35
8.35
1.39
0.55
0.10
0.10
2.14
NA
Ox
And
21.35
64.70
43.35
1.52
0.80
0.13
0.22
2.67
0.20
FR
And
71.70
72.70
1.00
8.56
8.86
1.50
0.53
19.40
0.01
FR
And
85.60
89.60
4.00
0.72
0.35
0.04
0.03
1.14
0.06
FR
And
131.60
166.60
35.00
0.61
0.35
0.06
0.05
1.07
0.10
FR
DDH24LU257
0.00
18.80
18.80
0.35
0.62
0.09
0.01
1.07
NA
Ox
DDH24LU258
0.00
45.60
45.60
2.48
1.85
0.34
0.34
5.01
NA
Ox
And
88.60
90.60
2.00
2.18
9.91
2.19
0.15
14.43
0.01
FR/LS
And
99.60
104.60
5.00
0.26
0.28
0.08
0.01
0.62
0.01
FR
And
162.60
180.60
18.00
0.30
0.18
0.03
0.03
0.53
0.03
FR
DDH24LU259
8.60
10.60
2.00
12.76
42.15
4.79
2.59
62.28
NA
Ox
And
13.60
73.90
60.30
0.31
0.54
0.05
<0.01
0.91
0.01
Ox/FR
And
77.90
78.90
1.00
0.66
13.98
3.03
<0.01
17.67
0.01
FR/LS
And
134.45
172.70
38.25
0.41
0.40
0.06
0.01
0.88
0.05
FR
Notes: All ‘From’, ‘To’ depths, and ‘Thicknesses’ are downhole. ‘NA’ Not applicable for Oxide material.
Given orientation of drilling and mineralization, intercepts are estimated at 125% to 140% of true thickness in the North Sector.
Type: Ox = Oxide. FR = Fresh Rock. LS = Low Sulphide. Recovery methods and results will differ based on the type of mineralization.
* Bravo’s nickel grades are sulphide nickel, and do not include non-recoverable silicate nickel, unlike historical total nickel assays
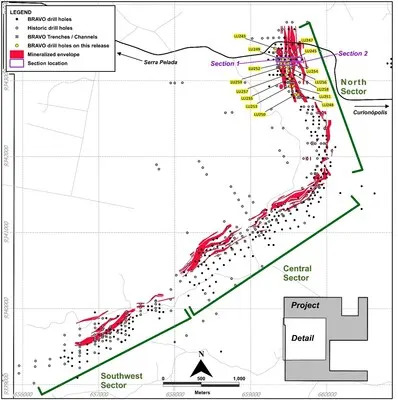
Figure 3: Location of Bravo Drilling and Sections Reported in this News Release (CNW Group/Bravo Mining Corp.)
About Bravo Mining Corp.
Bravo is a Canadian and Brazil-based mineral exploration and development company focused on advancing its Luanga PGM+Au+Ni Project in the world-class Carajás Mineral Province of Brazil.
The Luanga Project is situated on mature freehold farming land and benefits from being in a location close to operating mines and a mining-experienced workforce, with excellent access and proximity to existing infrastructure, including road, rail, and clean renewable hydro grid power. A fully funded 63,000m infill, step out and exploration drilling and trenching program is well advanced for 2024. Bravo’s current Environmental, Social and Governance activities includes planting more than 30,000 high-value trees in the project area, hiring and contracting locally, and ensuring protection of the environment during its exploration activities.
Technical Disclosure
Technical information in this news release has been reviewed and approved by Simon Mottram, F.AusIMM (Fellow Australia Institute of Mining and Metallurgy), President of Bravo Mining Corp. who serves as the Company’s “qualified person” as defined in National Instrument 43-101 Standards of Disclosure for Mineral Projects (“NI 43-101“). Mr. Mottram has verified the technical data and opinions contained in this news release.
This news release contains forward-looking information which is not comprised of historical facts. Forward-looking information is characterized by words such as “thick”, “high-grade”, “centre of gravity”, “numerous”, “significantly”, “enhanced”, “potential”, “concentration”, “consistently”, “improvement”, “extension”, “centre of gravity”, “numerous”, “bodes well”, variants of these words and other similar words, phrases, or statements that certain events or conditions “may” or “will” occur. This news release contains forward-looking information pertaining to the Company’s ongoing drill program and the results thereof; comparisons to historical and/or prior Bravo drilling; the potential for extensions to mineralization at depth; the potential for greater thicknesses and/or higher grades at depth; the impact of current and future drilling on future mineral resource estimates, after taking into account other modifying factors; whether or not the mineralization is amenable to open pit mining and, if so, to what extent; the potential for a second centre of gravity for the Luanga deposit; potential economic outcomes, including strip ratios, in future economic studies; and the Company’s plans in respect thereof. Forward-looking information involves risks, uncertainties and other factors that could cause actual events, results, and opportunities to differ materially from those expressed or implied by such forward-looking information. Factors that could cause actual results to differ materially from such forward-looking information include, but are not limited to, unexpected results from exploration programs, changes in the state of equity and debt markets, fluctuations in commodity prices, delays in obtaining required regulatory or governmental approvals, environmental risks, limitations on insurance coverage; and other risks and uncertainties involved in the mineral exploration and development industry. Forward-looking information in this news release is based on the opinions and assumptions of management considered reasonable as of the date hereof, including, but not limited to, the assumption that the assay results confirm that the interpreted mineralization contains significant values of nickel, PGMs and Au; that the mineralization remains open to depth, that PGM and/or Ni grades and mineralized thicknesses are improving to depth; that final drill and assay results will be in line with management’s expectations; that activities will not be adversely disrupted or impeded by regulatory, political, community, economic, environmental and/or healthy and safety risks; that the Luanga Project will not be materially affected by potential supply chain disruptions; and general business and economic conditions will not change in a materially adverse manner. Although the Company believes that the assumptions and factors used in preparing the forward-looking information in this news release are reasonable, undue reliance should not be placed on such information. The Company disclaims any intention or obligation to update or revise any forward-looking information, other than as required by applicable securities laws.
Schedule 1: Drill Hole Collar Details
HOLE-ID
Company
East (m)
North (m)
RL (m)
Datum
Depth(m)
Azimuth
Dip
Sector
DDH24LU243
Bravo
659320.296
9343423.067
234.075
SIRGAS2000_UTM_22S
180.35
90.00
-60.00
North
DDH24LU245
Bravo
659449.908
9343222.998
265.789
SIRGAS2000_UTM_22S
201.05
90.00
-60.00
North
DDH24LU247
Bravo
659487.730
9343274.466
255.947
SIRGAS2000_UTM_22S
195.85
90.00
-60.00
North
DDH24LU248
Bravo
659629.167
9342814.033
287.632
SIRGAS2000_UTM_22S
115.25
90.00
-60.00
North
DDH24LU249
Bravo
659418.889
9343274.468
256.112
SIRGAS2000_UTM_22S
260.65
90.00
-65.00
North
DDH24LU250
Bravo
659586.252
9342814.013
279.501
SIRGAS2000_UTM_22S
150.80
90.00
-60.00
North
DDH24LU251
Bravo
659558.654
9342926.032
280.623
SIRGAS2000_UTM_22S
136.25
90.00
-60.00
North
DDH24LU252
Bravo
659397.252
9343223.012
257.381
SIRGAS2000_UTM_22S
260.75
90.00
-60.00
North
DDH24LU253
Bravo
659511.538
9342926.040
274.883
SIRGAS2000_UTM_22S
195.70
90.00
-60.00
North
DDH24LU254
Bravo
659498.123
9343222.968
273.546
SIRGAS2000_UTM_22S
275.25
90.00
-60.00
North
DDH24LU255
Bravo
659511.241
9343022.997
273.370
SIRGAS2000_UTM_22S
260.15
90.00
-60.00
North
DDH24LU256
Bravo
659492.743
9343174.490
275.190
SIRGAS2000_UTM_22S
280.80
90.00
-60.00
North
DDH24LU257
Bravo
659462.439
9343074.444
260.638
SIRGAS2000_UTM_22S
160.25
90.00
-60.00
North
DDH24LU258
Bravo
659498.366
9343123.980
266.226
SIRGAS2000_UTM_22S
278.55
90.00
-60.00
North
DDH24LU259
Bravo
659399.385
9343174.526
254.921
SIRGAS2000_UTM_22S
260.80
90.00
-60.00
North
Schedule 2: Assay Methodologies and QAQC
Samples follow a chain of custody between collection, processing, and delivery to the SGS Geosol laboratory in Parauapebas, state of Pará, Brazil. The drill core is delivered to the core shack at Bravo’s Luanga site facilities and processed by geologists who insert certified reference materials, blanks, and duplicates into the sampling sequence. Drill core is half cut and placed in secured polyurethane bags, then in security-sealed sacks before being delivered directly from the Luanga site facilities to the Parauapebas SGS Geosol laboratory by Bravo staff. Additional information about the methodology can be found on the SGS Geosol website (SGS) in their analytical guides. Information regarding preparation and analysis of historic drill core is also presented in the table below, where the information is known.
Quality Assurance and Quality Control (“QAQC“) is maintained internally at the lab through rigorous use of internal certified reference materials, blanks, and duplicates. An additional QAQC program is administered by Bravo using certified reference materials, duplicate samples and blank samples that are blindly inserted into the sample batch. If a QAQC sample returns an unacceptable value an investigation into the results is triggered and when deemed necessary, the samples that were tested in the batch with the failed QAQC sample are re-tested.
Bravo SGS Geosol
Preparation
Method
Method
Method
Method
For All Elements
Pt, Pd, Au
Rh
Sulphide Ni, Cu
Trace Elements
PRPCLI (85% at 200#)
FAI515
FAI30V
AA04B
ICP40B
Bravo Mining Corp. Logo (CNW Group/Bravo Mining Corp.)
NOT FOR DISTRIBUTION TO U.S. NEWSWIRE SERVICES OR DISSEMINATION IN THE U.S.
VANCOUVER, BC / ACCESSWIRE / July 29, 2024 / Rover Critical Minerals Corp. (TSXV:ROVR)(OTCQB:ROVMF)(FSE:4XO) (“Rover” or the “Company“) is pleased to announce a non-brokered private placement financing for a minimum of $175,000 and a maximum of $500,000. The Company will issue $0.03 units. Each unit is priced at $0.03 and is comprised of one common share and one common share purchase warrant (the “$.03 Units“). The warrants on the Units have an exercise price of $0.05 per warrant share, with a life of two years. Assuming the financing is fully subscribed, there will be up to 16,666,667 common shares and 16,666,667 common share purchase warrants issued in connection with this financing, plus any finder’s commission warrants.
The Company anticipates multiple closings of the $0.03 Unit financing. An updating release will be provided once the Company has completed any future closings of the $0.03 Unit financing.
Use of Proceeds
The proceeds from the first closing of the $0.03 Unit financing will be used to finance ongoing permitting work, claim renewal fees, and exploration work at the Company’s Let’s Go Lithium project located in the Amargosa Valley of Nevada, USA. Additional secondary, and future closings, will go towards general and administrative expenses, as well as towards the closing costs related to the Company’s recently announced letter of intent to acquire the new Silicon Valley project in Golden, BC, Canada.
Judson Culter, CEO at Rover, states: “Please reach out to me if you have interest in participating on our $0.03 Unit financing. My contact details are below.”
Rover is a publicly traded junior mining company that trades on the TSXV under symbol ROVR, on the OTCQB under symbol ROVMF, and on the FSE under symbol 4XO. The Company is focussed on the permitting and exploration of the LGL project, a claystone lithium project in the Amargosa Valley of Nevada, USA, as well as the acquisition of the Silicon Valley project, located in Golden, BC, Canada.
You can follow Rover on its social media channels:
VANCOUVER, BC / ACCESSWIRE / July 24, 2024 / Rover Critical Minerals Corp. (TSXV:ROVR)(OTCQB:ROVMF)(FSE:4XO) (“Rover” or the “Company“) is pleased to announce that it has entered into a non-binding letter of intent to acquire a 100% interest in the Silicon Valley Silica Project, near Golden, British Columbia (the “Transaction“) Orichalcum Holdings Inc. (the “Vendor“).
The 1,760-hectare (4,349-acre) Silicon Valley Silica Project, located adjacent to the town of Golden, B.C. and the Sinova Quartz silica quarry, hosts approximately 12 kilometers of regionally mapped strike length of the high-purity quartzite beds of the Ordovician Mount Wilson Formation. Sampling in 2017 encountered up to 99.9% SiO2 and an average of 99.6% SiO2 along a traverse of approximately 190 metres, along strike with the adjacent Sinova Quartz silica quarry. Deleterious elements were found to be very low, with an average of 0.03% Fe2O3, 0.02% CaO, 0.02% MgO, 0.01% P2O5, and 0.10% Al2O3. Details of the Project are outlined below.
As the demand for renewable energy sources like solar power grows, driven by global initiatives to combat climate change, the market for high-purity silica (also known as high-purity quartz, or HPQ) is poised to expand significantly. With the acquisition of Silicon Valley Silica Project, Rover is poised to gain a strategic position in the rapidly expanding critical minerals market.
Judson Culter, CEO of Rover states, “On June 10th, the Government of Canada announced that silicon metal had been added to Canada’s Critical Minerals List, in addition to announcing additional funding for the semiconductor and chip manufacturing industry. The U.S. Government also has silicon on its critical minerals list, therefore making the project potentially eligible for DoD or DoE funding through the Defense Production Act Investment (DPAI) program. Through this Transaction, Rover is gaining a strategic and timely position in what is becoming one of the most sought-after high-purity silica districts in Canada with a project located adjacent to one of the largest high-purity silica producers in the country. Silica, despite being the second most abundant mineral in the Earth’s crust, is rare in its purest form, and is in increasingly high demand as a crucial element in the production of photovoltaics (PV) and semiconductors. Management closely follows industry trends, evident from companies like Intel, which is on track to build the world’s largest chip-making complex in Ohio, with $20 billion invested by the company to date. Factoring in macro-economic demand for chips in AI applications, along with the geopolitical risks of Taiwan holding current market share of the chip industry, this deal has a bright future.”
Paddy J. Moylan, Rover’s President and Director, comments, “Silicon Valley is a deal we have been working on for some time. Silicon Valley is special. It is transformational for our company and investors. This project has huge potential. We already have boots on the ground within a short walk to a world-class asset, which is exciting! I will be on site as work progresses. Importantly, from an ESG point of view, it ticks many boxes. I look forward to finalising the definitive agreement imminently. Rover has formed a terrific working relationship in the area, and I am thrilled that Case Lewis, will join us as our exploration manager. I have come to know Case well and he will be a strong advocate for Rover and Silicon Valley. We will keep investors informed of progress at all material times as we advance towards positive news flow.”
About High Purity Silica
Silicon, which is derived from high-purity silica, is the primary material in the majority of solar panels, also called photovoltaic (PV) cells. Silicon metal is essential to the manufacture of computer chips and semiconductors, used in almost any and everything electronic. It is also used in aluminum production for aerospace applications, as well as anodes in emergent next-generation lithium-ion batteries. Although silica is abundant in the Earth’s crust, silica deposits with a high degree of purity and volume – those which are in economic demand – particularly in excess of 99% SiO2, are a relatively rare occurrence, especially in Canada and the U.S.
About Canada’s Critical Minerals List June 10 Update
The Critical Minerals List was first released in 2021 and consisted of 31 minerals which were deemed essential to Canada’s green and digital economies. On June 10, 2024, the Government of Canada released an updated Critical Minerals List which increased the number of critical minerals to 34, now including silicon metal.
To be included in the Critical Minerals List, the Government of Canada must consider that: (1) the supply chain of the material is threatened; (2) there is a reasonable chance of the mineral being produced by Canada and; (3) the mineral is considered to be one of the following:
essential to Canada’s economic or national security; or
required for the national transition to a sustainable low-carbon and digital economy; or
positions Canada as a sustainable and strategic partner within global supply chains.
Project Highlights – Silicon Valley Project, Golden, B.C.
1,760 hectares (4,349 acres) adjacent to the town of Golden, B.C., and less than 1km from the Canadian Pacific Railway Golden Rail Yard with easy year-round access. (Figure 1)
High-purity quartzite of the Ordovician Mount Wilson Formation with up to 12 km of regionally mapped strike length on the property and up to 300 metres apparent width at surface. Bedding strikes 120 to 140º and dips from 60 to 75º.
On the same lithological unit and close to both Sinova Global’s Sinova Quartz quarry pit (500m to south) and the Moberly Silica Mine (9.0 km to north). Sinova Quartz has been permitted for over 1,000,000 tonnes of annual silica production. (1)
The HCJ MINFILE occurrence on the Project was first reported in 1972 by Dr. L.B. Halferdahl, who characterized the quartzite unit as containing sequences with thicknesses of 30 metres or more of very white to grey high grade silica material, with no impurities being visible with examination even with a 20x hand lens and thus having the potential for ferrosilicon-grade material. The quartzite silica bed at the Silicon Valley Project was mapped to extend at least from the HCJ MINFILE occurrence at the north end of the current Property, to the Sinova Quartz quarry at the south end of the Property. (2)
2018 sampling extending from 50 metres from the boundary of the adjacent Sinova Quartz quarry tenure encountered up to 99.9% SiO2 and an average of 99.6% SiO2 from 7 grab samples taken over a traverse of approximately 190 metres, along strike from the Sinova Quartz quarry. Deleterious elements were found to be very low, with an average of 0.03% Fe2O3, 0.02% CaO, 0.02% MgO, 0.01% P2O5, and 0.10% Al2O3. Grab samples in the northern area of the Property yielded grades up to 99.1% SiO2. (Figure 2) (3) *
Also in 2018, 92 Resources Corp (now Patriot Battery Metals Inc (TSX:PMET)), the former owner of the majority of the Silicon Valley Project area, encountered grades of 99.11, 98.56 and 98.28% SiO2 from grab samples in the northern area of the Property. (Figure 3) (4) *
According to Sinova Global’s website, regarding their expansion at Sinova Quartz:
Quartz from this deposit requires very limited processing relative to material from other quartz operations. With high-purity silica and correspondingly low levels of impurities such as boron, iron, phosphorus and aluminum, the Sinova Quartz operation creates minimal by-products and requires less energy to process.
A tailings management facility is not necessary to mitigate environmental impacts. Only primary crushing will be done on-site then it will be stockpiled and hauled offsite to be processed.
No wastewater will be treated at the Sinova Quartz project as minimal water will be used in processing for dust control, and no tailings facilities will be constructed. (1)
Figure 1. Silicon Valley Project Map
Figure 2. Silicon Valley Project Map – South Sampling Area
Figure 3. Silicon Valley Project Map – North Sampling Area and HCJ MINFILE Location
Transaction Terms
The Company has entered into the Transaction with Orichalcum Holdings Inc., dated July 19, 2024, an arm’s length party. The terms of the option agreement are set forth below:
In order to exercise the Option and acquire a 100% interest in the Property, the Company is required to:
incur at least $1,020,000 in exploration expenditures over 24 months from the signing of a definitive agreement. A minimum of $20,000 is to be incurred in the first three months.
issue common shares to the Vendor as follows:
2,000,000 common shares of the Company (“Common Shares“) on or before ninety (90) days after the date of execution of the Definitive Agreement;
such number of Common Shares having an aggregate value of $50,000, on or before the 6-month anniversary of the execution date of the Definitive Agreement, calculated based on the 10-day VWAP;
such number of Common Shares having an aggregate value of $100,000, on or before the 12-month anniversary of the execution date of the Definitive Agreement, calculated based on the 10-day VWAP;
such number of Common Shares having an aggregate value of $200,000, on or before the 24-month anniversary of the execution date of the Definitive Agreement, calculated based on the 10-day VWAP;
such number of Common Shares having an aggregate value of $200,000, on or before the earlier of the 36-month anniversary of the execution date of the Definitive Agreement or the issuance of a mining or quarry permit for the Property, calculated based on the 10-day VWAP;
such number of Common Shares having an aggregate value of $250,000, on or before the earlier of the 48-month anniversary of the execution date of the Definitive Agreement or the commencement of commercial production on the Property, calculated based on the 10-day VWAP.
make cash payments to the Vendor in the aggregate amount of $855,000 as follows:
$10,000 on signing of the Definitive Agreement;
$15,000 within 10 weeks of signing the Definitive Agreement;
$80,000 on or before the 12-month anniversary of signing the Definitive Agreement;
$200,000 on or before the 24-month anniversary of signing the Definitive Agreement;
$200,000 on or before the earlier of the 36-month anniversary of signing the Definitive Agreement or the issuance of an extraction permit for the Property;
$350,000 on or before the earlier of the 48-month anniversary of signing the Definitive Agreement or the commencement of commercial production on the Property.
If the Buyer fails to satisfy the payment terms and conditions of the Option, Buyer’s option to acquire the Property will terminate, and the Property shall automatically become the sole possession of the Vendor. Buyer must ensure the claims will be in good standing for at least 12 months following the date of termination.
The Vendor will retain a 2% Gross Overriding Royalty (“GORR“) on the Property. For so long as the Company holds an interest in the Property the Company shall have the right to purchase, at any time prior to production, 0.5% of the Vendor’s GORR (for cancellation) for purchase price of $500,000, and an additional 0.5% for an additional $500,000.
The Property shall be surrounded by a specified area of interest in which any claims staked within this area by the Vendor or the Buyer shall automatically be included in the Definitive Agreement.
Buyer to maintain all claims in good standing until the exercise of the Option.
Additional Technical Details on the Silicon Valley Project, B.C.
The property is underlain by thick sequences of extremely pure quartzite of the Ordovician Mount Wilson Formation, occurring as north-northwest striking, usually steeply east-dipping thrust panels.
Locally, quartzite of the Mount Wilson Formation occurs as friable sandstone, grading deeper to well cemented quartzite. Several faulted and displaced segments of the Mount Wilson quartzite unit occur on the Property, totaling approximately 12 kilometres of strike length at an average apparent width of 250-300 metres at surface. Structurally repeated segments of the same lithological unit host the Moberly Silica Mine (9.0 kilometres to the north), which previously produced up to 150,000 tonnes of silica sand annually, and the Sinova Quartz silica quarry (500 metres to the south), which produced up to 90,000 tonnes of silica annually, both of which exhibit economic grade silica greater than 99.6% SiO2 purity. (5)(6)
The quartzite can be described as frosty white, sedimentary quartzite with a clastic texture containing fine, well-rounded polished grains 1/8 – 1/4 mm in diameter. Very competent bonding allows breaking to occur through the quartz grains.
* Cautionary Note
The reader is cautioned that grab samples are selective by nature and may not represent the true grade or style of mineralization across the property.
Further to the Company’s release of July 3, 2024, the Company $0.03/unit financing (the “Private Placement“) is now closed. Rover received total orders of $327,344 resulting in the issuance of 10,911,467 common shares, and 10,911,467 common share purchase warrants. No finders’ commissions will be paid in connection with the Private Placement. The closing is subject to final acceptance and approval by the TSX Venture Exchange. It is expected that a new financing will be announced later this month as a result of the Transaction disclosed in this release.
Related Party Transaction
The Private Placement constitutes a “related party transaction” as such term is defined under Multilateral Instrument 61-101 Protection of Minority Security Holders in Special Transactions (“MI 61-101“) as an investment by a director of the Company has participated in the financing, acquiring aggregate of 10,000,000units for aggregate consideration of $300,000. The Company has relied on exemptions from the formal valuation and minority shareholder approval requirements of MI 61-101 contained in sections 5.5(b) and 5.7(1)(a) of MI 61-101 in respect of related party participation in the Private Placement as the Company is not listed on a specified market and neither the fair market value (as determined under MI 61-101) of the subject matter of, nor the fair market value of the consideration for, the transaction, insofar as it involved the related party, exceeded 25% of the Company’s market capitalization (as determined under MI 61-101). A material change report was not filed in connection with the related party participation in the Private Placement less than 21 days in advance of closing of the Private Placement as approval of the Private Placement occurred less than 21 days prior to closing. The Private Placement was approved by the board of directors of the Company with the conflicted director abstaining.
Qualified Person (QP) Statement
Technical information in this news release has been reviewed and approved by Case Lewis, P.Geo., a “Qualified Person” as defined under NI 43-101 Standards of Disclosure for Mineral Projects and a director of the Silicon Valley Project vendor company, Orichalcum Holdings Inc.
About Rover Critical Minerals
Rover is a publicly traded junior mining company that trades on the TSXV under symbol ROVR, on the OTCQB under symbol ROVMF, and on the FSE under symbol 4XO.
ON BEHALF OF THE BOARD OF DIRECTORS, “Judson Culter” Chief Executive Officer and Director
Neither the TSX Venture Exchange nor its regulation provider (as that term is defined in the policies of the TSX Venture Exchange) accepts responsibility for the adequacy of this release.
Statement Regarding Forward-Looking Information
This news release contains statements that constitute “forward-looking statements.” Such forward-looking statements involve known and unknown risks, uncertainties, and other factors that may cause Rover’s actual results, performance, achievements, or developments in the industry to differ materially from the anticipated results, performance, or achievements expressed or implied by such forward-looking statements. Forward-looking statements are statements that are not historical facts and are generally, but not always, identified by the words “expects,” “plans,” “anticipates,” “believes,” “intends,” “estimates,” “projects,” “potential” and similar expressions, or that events or conditions “will,” “would,” “may,” “could” or “should” occur.
The forward-looking statements and information in this press release include information relating to the Transaction, the Company’s intention to complete a private placement and all other statements that are not historical in nature. Such statements and information reflect the current view of Rover. Risks and uncertainties that may cause actual results to differ materially from those contemplated in those forward-looking statements and information.
There can be no assurance that such statements prove to be accurate. Actual results and future events could differ materially from those anticipated in such statements, and readers are cautioned not to place undue reliance on these forward-looking statements. Any factor could cause actual results to differ materially from Rover’s expectations. Rover undertakes no obligation to update these forward-looking statements in the event that management’s beliefs, estimates, opinions, or other factors, should change.
THE FORWARD-LOOKING INFORMATION CONTAINED IN THIS NEWS RELEASE REPRESENTS THE EXPECTATIONS OF THE COMPANY AS OF THE DATE OF THIS NEWS RELEASE AND, ACCORDINGLY, IS SUBJECT TO CHANGE AFTER SUCH DATE. READERS SHOULD NOT PLACE UNDUE IMPORTANCE ON FORWARD-LOOKING INFORMATION AND SHOULD NOT RELY UPON THIS INFORMATION AS OF ANY OTHER DATE. WHILE THE COMPANY MAY ELECT TO, IT DOES NOT UNDERTAKE TO UPDATE THIS INFORMATION AT ANY PARTICULAR TIME EXCEPT AS REQUIRED IN ACCORDANCE WITH APPLICABLE LAWS.
In this interview on Proven and Probable, Maurice Jackson speaks with David Talbot, Managing Director and Head of Equity Research at Red Cloud Securities, about the uranium sector’s value proposition and current state. Talbot, with over a decade of experience in the uranium industry, discusses the importance of uranium-fueled nuclear energy, which generates around 10% of global electricity, with the U.S. at 18.6% and Canada at just under 14%.
Talbot highlights the attractiveness of nuclear power: no greenhouse gas emissions during operations, mitigation of climate change impact, base load power provision, long reactor life, stable operating costs, energy security, and abundant uranium availability. The global demand for nuclear energy is growing at approximately 3.6% annually, with significant growth in China, India, Russia, and Turkey. China, in particular, is expanding its reactor fleet and aims to surpass the U.S. in nuclear capacity within the next decade.
Rumble
Despite the increasing demand, uranium supply faces challenges. The current supply-demand gap sees reactors needing 180 million pounds of uranium annually, while mines produce only 145 million pounds. Talbot notes that uranium prices have surged, influenced by factors such as production cuts, geopolitical concerns, and increased buying by entities like the Sprott Physical Uranium Trust.
Geopolitical factors, including the U.S. ban on Russian uranium imports and the Advanced Act Bill boosting nuclear reactor deployment, are significant drivers of uranium prices. The ban, effective in 2028, will force the U.S. to source uranium from friendly countries, while the Advanced Act aims to streamline nuclear project permitting and support the nuclear sector’s growth.
Talbot also touches on Kazakhstan’s mineral extraction tax increase, which could discourage production expansion. He believes that while some events are priced into the current uranium market, the U.S. uranium production could rise, benefiting from higher prices and supportive policies.
David A. Talbot is a mining analyst with Red Cloud Securities. He spent nearly a decade as a geologist in the gold industry, working with Placer Dome, Franco-Nevada, and Newmont Capital. Talbot joined Dundee’s (now Eight Capital) research department in May 2003, and in the summer of 2007, he took over the role of analyzing the fast-growing uranium sector. Since then, he has expanded his expertise to include lithium, graphite, cobalt, and iron ore. Talbot is a member of the Prospectors and Developers Association of Canada (PDAC) and serves on the PDAC Convention’s selection committee for the Corporate Presentation Forum for Investors. He has been featured on BNN, CNBC, and in The Economist, among various other media publications. He has also chaired several investment sessions. Talbot graduated with distinction from the University of Western Ontario, earning an Honours B.Sc. degree in geology.
Kelowna, British Columbia–(Newsfile Corp. – July 22, 2024) – F3 Uranium Corp. (TSXV: FUU) (OTCQB: FUUFF) (“F3” or the “Company“) is pleased to announce that summer drilling has commenced to test conductors on the Clearwater West property which is located 13km to the south of Fission Uranium’s Triple R uranium deposit (see F3 news release dated June 18, 2024).
SKRR Exploration Inc. (TSXV: SKRR) has an option to acquire up to a 70% interest in the Clearwater West Property (see F3 news release dated May 26, 2023, and SKRR news release dated Jan 22, 2023) by making cash payments and issuing shares to F3 and funding exploration work, with F3 serving as the operator during the earn-in period.
Clearwater West is an early-stage exploration project prospective for uranium mineralization. The uranium mineralization model for the Clearwater West property is basement hosted and structurally controlled Athabasca Basin unconformity related deposits.
Summary of the Clearwater West Property:
The Clearwater West Project is located ~20 km outside the edge and in the south-west area of the Athabasca Basin, which is poised to become the next area for the development of major uranium mines in Saskatchewan. It is 13 km south of Fission Uranium’s Triple R deposit, located 7 km outside the basin edge on its PLS Property, where a Feasibility Study was recently completed, and 17 km south of NexGen’s Arrow deposit. The Clearwater West property is comprised of 3 contiguous mineral claims totaling 11,786 hectares which are immediately south and adjacent to Fission Uranium’s PLS property.
Basement hosted Athabasca unconformity related deposits often feature unique characteristics that can be identified by various geophysical surveys. A VTEM survey flown over the property in early 2014 defined electromagnetic (EM) conductors, some of which are interpreted to be possible extensions of the EM conductors identified on the PLS property immediately to the north.
F3’s experienced and successful management and technical team, with a track record of three major high-grade uranium discoveries in the Athabasca Basin region since 2010 (Waterbury Lake project J Zone, PLS Triple R deposit and most recently the PLN JR Zone) will operate and manage Clearwater West. F3 currently holds a 100% interest in Clearwater West.
Qualified Person:
The technical content of this news release has been prepared in accordance with the Canadian regulatory requirements set out in National Instrument 43-101 and approved on behalf of the company by Raymond Ashley, P.Geo., President & COO of F3 Uranium Corp., a Qualified Person. Mr. Ashley has verified the data disclosed. The information provides an indication of the exploration potential of the company’s properties but may not be representative of expected results.
About F3 Uranium Corp:
F3 is a uranium project generator and exploration company, focusing on projects in the Athabasca Basin, home of some of the world’s largest high grade uranium discoveries. F3 currently has 20 projects in the Athabasca Basin. Several of F3’s projects are located near large uranium discoveries including Triple R, Arrow and Hurricane.
Contact Information
F3 Uranium Corp. 750-1620 Dickson Avenue Kelowna, BC V1Y9Y2
The TSX Venture Exchange has not reviewed, approved or disapproved the contents of this press release, and does not accept responsibility for the adequacy or accuracy of this release.
Forward Looking Statements
This news release contains certain forward-looking statements within the meaning of applicable securities laws. All statements that are not historical facts, including without limitation, statements regarding future estimates, plans, programs, forecasts, projections, objectives, assumptions, expectations or beliefs of future performance, including statements regarding the suitability of the Properties for mining exploration, future payments, issuance of shares and work commitment funds, entry into of a definitive option agreement respecting the Properties, are “forward-looking statements.” These forward-looking statements reflect the expectations or beliefs of management of the Company based on information currently available to it. Forward-looking statements are subject to a number of risks and uncertainties, including those detailed from time to time in filings made by the Company with securities regulatory authorities, which may cause actual outcomes to differ materially from those discussed in the forward-looking statements. These factors should be considered carefully and readers are cautioned not to place undue reliance on such forward-looking statements. The forward-looking statements and information contained in this news release are made as of the date hereof and the Company undertakes no obligation to update publicly or revise any forward-looking statements or information, whether as a result of new information, future events or otherwise, unless so required by applicable securities laws.
Edmonton, Alberta–(Newsfile Corp. – July 19, 2024) – Grizzly Discoveries Inc. (TSXV: GZD) (FSE: G6H) (OTCQB: GZDIF) (“Grizzly” or the “Company”) announces an extension to the private placement (the “Offering”) of Units and Flow-Through Units originally announced on June 20, 2024. The Offering is for aggregate gross proceeds of $1,000,000 if fully subscribed. The Offering consists of up to 16,666,668 Units and up to an additional 16,666,668 in any combination of Units or Flow-Through Units, at a price of $0.03 per Unit and Flow-Through Unit (each as defined below).
Each Unit shall consist of one common share of the Company (“Common Share”) and one non-transferrable common share purchase warrant (“Warrant”) entitling the warrant holder to purchase an additional Common Share for $0.05 and expiring on the earlier of a) 30 days following written notice by the Company to the warrant holder that the volume-weighted average trading price of the Common Shares on the TSX Venture Exchange is at or greater than CA$0.10 per Common Share for 10 consecutive trading days; and (b) 24 months from the date of issuance. Each Flow-Through Unit shall consist of one Common Share and one half of one Warrant, each of which shall be issued as a “flow through share” for the purposes of the Income Tax Act (Canada). The Offering is being offered to qualified subscribers in the Provinces of Alberta, British Columbia and Ontario and in other jurisdictions as the Company may in its discretion determine, in reliance upon exemptions from the registration and prospectus requirements of applicable securities legislation.
The Company intends to use the proceeds of the Offering, if fully subscribed, as follows:
Mineral Property Exploration
Drill Exploration Program
$ 500,000
Other
$ 100,000
$ 600,000
Mineral Rights and Permits
$ 105,000
Corporate Overhead
Management fees to Officers
$ 72,000
(6 months)
Other Corporate Overhead
$ 213,000
$ 285,000
General working capital
$ 10,000
$ 1,000,000
There is no minimum to the Offering. If the Company closes on less than the maximum proceeds, the use of proceeds will be adjusted. In the case that the Offering is over-subscribed, the Company may increase the size of the Offering by an additional 10%, with any remaining over-subscribed amount allocated pro-rata to all subscribers.
In connection with the Offering, the Company may pay finders fees payable in any combination of cash and warrants with terms equivalent to the Warrants, to registered broker dealers, limited market dealers or arm’s length persons in accordance with the policies of the TSX Venture Exchange (the “Exchange”) and applicable securities legislation and regulations. The Common Shares and any Common Shares issued on exercise of the Warrants are subject to restrictions on trading until four months and one day from the date of issuance in accordance with the policies of the Exchange. The Offering is subject to acceptance by the Exchange.
ABOUT GRIZZLY DISCOVERIES INC.
Grizzly is a diversified Canadian mineral exploration company with its primary listing on the TSX Venture Exchange focused on developing its approximately 72,700 ha (approximately 180,000 acres) of precious and base metals properties in southeastern British Columbia. Grizzly is run by a highly experienced junior resource sector management team, who have a track record of advancing exploration projects from early exploration stage through to feasibility stage.
On behalf of the Board,
GRIZZLY DISCOVERIES INC. Brian Testo, CEO, President
Neither the TSX Venture Exchange nor its Regulation Services Provider (as that term is defined in the policies of the TSX Venture Exchange) accepts responsibility for the adequacy or accuracy of this release.
Caution concerning forward-looking information
This press release contains “forward-looking information” and “forward-looking statements” within the meaning of applicable securities laws. This information and statements address future activities, events, plans, developments and projections. All statements, other than statements of historical fact, constitute forward-looking statements or forward-looking information. Such forward-looking information and statements are frequently identified by words such as “may,” “will,” “should,” “anticipate,” “plan,” “expect,” “believe,” “estimate,” “intend” and similar terminology, and reflect assumptions, estimates, opinions and analysis made by management of Grizzly in light of its experience, current conditions, expectations of future developments and other factors which it believes to be reasonable and relevant. Forward-looking information and statements involve known and unknown risks and uncertainties that may cause Grizzly’s actual results, performance and achievements to differ materially from those expressed or implied by the forward-looking information and statements and accordingly, undue reliance should not be placed thereon.
Risks and uncertainties that may cause actual results to vary include but are not limited to the availability of financing; fluctuations in commodity prices; changes to and compliance with applicable laws and regulations, including environmental laws and obtaining requisite permits; political, economic and other risks; as well as other risks and uncertainties which are more fully described in our annual and quarterly Management’s Discussion and Analysis and in other filings made by us with Canadian securities regulatory authorities and available under the Company’s SEDAR+ profile at www.sedarplus.ca. Grizzly disclaims any obligation to update or revise any forward-looking information or statements except as may be required by law.
NOT FOR DISSEMINATION IN THE UNITED STATES OR FOR DISTRIBUTION TO U.S. NEWSWIRE SERVICES AND DOES NOT CONSTITUTE AN OFFER OF THE SECURITIES DESCRIBED HEREIN
That’s a debt load that now represents over 120% of GDP. Earlier this year, the cost of interest payments alone passed the cost of defense spending.
The psychologically important $35 trillion milestone will likely be crossed sometime between this week’s Republican National Convention and when the Democrats gather in a few weeks’ time in Chicago — if debt continues to grow by an average of about $8 billion a day.
Yet a Yahoo Finance review of this week’s flood of political commentary — both Republicans in Milwaukee and Biden on the campaign trail — underlines a political reality of this election season: This historic debt is simply not a front-burner issue.
“We stand for fiscal sanity, for low taxes, and for reduced debt,” said Florida Gov. Ron DeSantis as he endorsed Republican nominee Donald Trump on Tuesday night.
What the line contained in snappiness it perhaps lacked in internal consistency. Lowering taxes is likely to increase deficits and debt.
“Our government sold us a false bill of goods with the Iraq war and the 2008 financial crisis loading up our national debt that falls on our generation’s shoulders,” added former presidential candidate Vivek Ramaswamy during his speech.
The debt rose by nearly $8 trillion during Trump’s time in office. Biden is on pace to oversee a similar rise. In total, the national debt has ballooned by more than 70% over the last 7.5 years, fueled by a flood of new spending as well as these obligations stretching back decades.
Former President Donald Trump is displayed on a screen during the second day of the 2024 Republican National Convention in Milwaukee. (PEDRO UGARTE/AFP via Getty Images) (PEDRO UGARTE via Getty Images)
All told, the vast majority of the major convention speeches so far this week haven’t brought up debt or deficits at all, according to a review of transcripts and videos. The Republican platform offers promises to cut “wasteful government spending” but doesn’t discuss debt or deficits directly.
It’s a notable shift for the Republicans who in years past campaigned on ideas like a balanced budget amendment and fielded major candidates who rose through the ranks as members of the deficit hawk wing of the party.
That wing of the party still exists but was far from prominent this week.
“The fiscal warning signs are really just so bright, so loud, and it’s as though nobody who’s running for office is paying attention,” said Maya MacGuineas, the president of the Committee for a Responsible Federal Budget, in a recent Yahoo Finance interview.
Few mentions from Biden as well
The same has been true to a certain extent on the other side of the aisle this week.
Before cutting his trip short after a positive COVID test, he said that his plan to make billionaires have to pay a minimum tax of 25% will generate $500 billion over the next decade, “allowing us to do more for childcare, eldercare, bring down the federal deficit, and so much more.”
But it’s a plan unlikely to pass Congress, even if Biden wins a second term.
Gallup recently found that federal spending and the budget deficit are collectively something 51% of respondents worry “a great deal” about, the sixth highest issue on the list.
But that issue hasn’t translated into a campaign focus for either side.
President Joe Biden arrives at Harry Reid International Airport in Las Vegas for a campaign swing this week. (AP Photo/Susan Walsh) (ASSOCIATED PRESS)
Another positive trend is that debt as a percentage of GDP has stabilized and even declined slightly in recent years.
Tax cuts that could make it worse
The lack of focus on debt also comes as there is massive focus on another issue that could make the problem worse: taxes.
These rates will be a top-tier issue in 2025, with major individual provisions of the 2017 Trump tax cuts set to expire at the end of the year. That means taxpayers could face a significant effective tax hike if Washington doesn’t act.
The plans from both sides at the moment could add trillions more red ink in the years ahead.
Biden’s plan is to extend the cuts for those making under $400,000 a year. That could still cost over $2 trillion.
Biden has offered detailed plans to offset at least some of these costs with tax increases elsewhere, like his effort to put a minimum tax of 25% on billionaires.
Trump has offered far less detail when confronted with questions about the national debt and said he could take care of it with drilling for oil — which he calls “liquid gold” — without elaborating on exactly how that would work.
“There is literally a pit in my stomach,” MacGuineas said, discussing the potential trillions of dollars in costs of these cuts. “There’s a pit in my stomach right now just talking about it with you.”
Ben Werschkul is Washington correspondent for Yahoo Finance. Akiko Fujita contributed reporting.