Chief Revenue Officer Ken Leith to present on Tuesday, October 20, at 4:30 p.m. Pacific Time
HAGERSTOWN, MD / ACCESS Newswire / October 15, 2026 / First Breach Inc. (NASDAQ:FBDT) (“First Breach” or the “Company”), an American-made defense technologies company focused on vertically integrated ammunition production and next-generation unmanned aerial systems, today announced that Chief Revenue Officer Ken Leith will present at the 20th Annual LD Micro Main Event, taking place October 19-21, 2026, at the Luxe Sunset Boulevard Hotel in Los Angeles, California.
Mr. Leith will also be available for one-on-one investor meetings on Tuesday, October 20. Investors interested in meeting with First Breach can request a meeting through LD Micro or contact the Company’s investor relations representative below.
Presentation Details Event: LD Micro Main Event XX Presenter: Ken Leith, Chief Revenue Officer Date: Tuesday, October 20, 2026 Time: 4:30 p.m. Pacific Time Location: Luxe Sunset Boulevard Hotel, Los Angeles, California Webcast: LD Micro Webcast
About the LD Micro Main Event XX
The 20th Annual LD Micro Main Event will take place October 19-21, 2026, at the Luxe Sunset Boulevard Hotel in Los Angeles. The conference brings together public companies and investors for company presentations, private meetings, and networking opportunities. To register to attend the event or for webcasts, use the following link: LD Micro Webcast.
About First Breach
First Breach Inc. is an ISO 9001:2015 certified, American-made defense technologies company focused on manufacturing match-grade ammunition components, finished ammunition, and developing next-generation unmanned aerial systems for commercial, law enforcement, and military markets. The Company manufactures its products in-house at its Hagerstown, Maryland facility, where it produces brass cups, casings, projectiles, lead cores, lead wire, and completed ammunition with rigorous quality control standards. First Breach is also advancing its drone strategy through the development of U.S.-made unmanned systems, leveraging advanced engineering, robotics, ISR and sensor technologies, and precision manufacturing capabilities to address evolving defense, homeland security, law enforcement, and commercial requirements across domestic and international markets.
This press release contains forward-looking statements within the meaning of the Private Securities Litigation Reform Act of 1995. Forward-looking statements are not historical facts and include statements regarding the Company’s expectations, beliefs, plans, objectives, strategies, future events, future performance, business prospects, growth initiatives, acquisitions, market opportunities, capital resources, operational objectives, and other statements that are predictive in nature. Forward-looking statements may be identified by the use of words such as “anticipate,” “believe,” “continue,” “could,” “estimate,” “expect,” “forecast,” “intend,” “may,” “plan,” “potential,” “predict,” “project,” “seek,” “should,” “target,” “will,” “would,” and similar expressions, although not all forward-looking statements contain these identifying words.
Forward-looking statements are based on management’s current expectations, assumptions, and beliefs regarding future developments and their potential effect on the Company. These statements are not guarantees of future performance and involve known and unknown risks, uncertainties, assumptions, and other factors that may cause actual results, performance, or achievements to differ materially from those expressed or implied by such forward-looking statements.
Factors that could cause actual results to differ materially from those expressed or implied by forward-looking statements include, but are not limited to, changes in economic, business, market, competitive, regulatory, technological, legal, and geopolitical conditions; the Company’s ability to execute its business strategy; access to capital and financing; customer demand; industry developments; and other risks and uncertainties described from time to time in the Company’s filings with the U.S. Securities and Exchange Commission, which are available for review at www.sec.gov.
Readers are cautioned not to place undue reliance on forward-looking statements, which speak only as of the date they are made. Except as required by applicable law, the Company undertakes no obligation to update, revise, or publicly disclose any revisions to any forward-looking statements to reflect events, circumstances, or changes in expectations occurring after the date of this press release.
Vancouver, British Columbia and Salt Lake City, Utah–(Newsfile Corp. – October 13, 2026) – Sage Potash Corp. (TSXV: SAGE) (OTCQB: SGPTF) (“Sage Potash” or the “Company”) is pleased to report positive results from hydrogeological testing completed at the Peterson 1 well at its flagship Sage Plain Potash Project in southeast Utah. Testing confirmed two saline, non-potable water bearing zones within the project area, with preliminary results supporting their potential use as future process water for solution mining operations.
The results represent an important step in advancing Sage’s water strategy, with the identified zones occurring at depths consistent with the Company’s existing water right and providing potential sources of process water that would not compete with potable municipal or agricultural supplies.
HYDROGEOLOGICAL PROGRAM HIGHLIGHTS
Two water-bearing zones confirmed at Peterson 1, providing potential sources of process water within the Sage Plain Project area.
Non-potable saline water has been confirmed, with water chemistry considered adequate for future processing and solution mining applications.
Results align with Sage’s existing water right, which authorizes up to 185,000 cubic meters of brackish groundwater annually for processing and solution mining.
An additional high permeability zone was identified in the Honaker Trail Formation, providing another target for future groundwater evaluation.
Results will now be incorporated into the Company’s ongoing engineering studies alongside the updated NI 43-101 resource estimate.
As previously announced on June 24, 2026, the Peterson 1 drill program included a hydrogeological assessment designed to conduct targeted Drill Stem Tests (“DSTs”) in formations exhibiting water flow. The DSTs are field screening tools used to evaluate yield rates and water quality, primarily targeting saline, non-potable aquifers, for future solution mining operations.
“Peterson 1 continues to deliver important results for the Sage Plain Project. In addition to the strong potash grades and thicknesses we recently reported, we have now identified multiple potential sources of non-potable process water within the project area,” said Patricio Varas, CEO of Sage Potash. “Water is a critical component of solution mining, and these results provide another important piece of the development picture. Importantly, the water identified is saline and non-petpotable, and the tested horizons align with our existing water right. We view this as another meaningful step in de-risking Sage Plain as we advance the project into its next phase of engineering.”
DRILL STEM TEST PROGRAM
Northstar Drillstem Testers Inc. conducted three inflate-straddle DSTs, each over a 38-meter (125-foot) interval of the 8¾ inch hole, between July 17 and July 19, 2026. The tests were designed to measure formation pressure, estimate permeability and inflow rates, and collect downhole fluid samples for water quality analyses.
DST 1 was completed with three flow periods and two shut-in periods. The test recovered 663 m (2,175 feet) of formation water, approximately 2.8 cubic meters (17.5 barrels), and recorded consistent shut-in pressures of 1,068 pound per square inch gauge (“psig”)and 1,061 psig, indicating a pressurized, water-bearing horizon. Downhole temperature was 41°C (105°F).
DST 2 recorded a shut-in pressure of 1,345 psig but produced negligible inflow during a single 16-minute flow period, indicating a low-permeability interval. The fluid recovered consisted predominantly of drilling fluid. The sample was submitted for laboratory analysis, which confirmed it was not representative of formation water, and it has been excluded from the water chemistry summary.
DST 3 was completed with three flow periods and two shut-in periods. The test recovered 610 m (2,000 feet), approximately 2.5 cubic meters (16 barrels), of formation water and recorded shut-in pressures of 1,434 psig and 1,419 psig, confirming a second, deeper water-bearing horizon.
DSTs are short-duration tests that primarily characterize the formation immediately surrounding the wellbore. Yields estimated from DST data are preliminary and may not be representative of sustained, long-term production rates. Additional testing will be completed to further characterize the anticipated available water volumes.
PRELIMINARY YIELD ESTIMATES
The Company engaged RESPEC LLC (“RESPEC”), which completed the Company’s September 8, 2025 NI 43-101 resource estimate, to review the DST data. RESPEC’s preliminary estimates assume a pumping well with the same length and diameter as each tested interval.
Erik Hemstad, PE, MBA, of RESPEC, commented: “From DST 1, preliminary estimates indicate a water volume yield of 7 m³/h (75 gpm), and from DST 3,- 4.5 m³/h (20 gpm). Moreover, DSTs are excellent for measuring formation pressures. While the results can also be used to estimate hydraulic conductivity, these tests are inherently short in duration and therefore primarily characterize the formation immediately surrounding the borehole.”
WATER CHEMISTRY AND ALIGNMENT WITH WATER PERMIT
Fluid samples from all three DSTs were submitted to ACZ Laboratories, Inc. in Steamboat Springs, Colorado, a NELAC-accredited laboratory, for comprehensive inorganic analysis. Results for DST 1 and DST 3 are summarized in Table 2 (Appendix).
Both samples are sodium-chloride type waters. The DST 1 (Cutler) sample has a calculated dissolved solids content of 32,400 mg/L. The DST 3 (Lower Cutler/Rico) sample has a calculated dissolved solids content of 79,600 mg/L. Both waters are non-potable and unsuitable for agricultural or irrigation or domestic use.
Solution mining recovers potash by dissolving it with injected water or brine. Sodium-chloride concentrations in recovered water samples are well below salt saturation and therefore retain substantial dissolving capacity. The Company therefore considers the quality of these waters adequate for processing and solution mining. Specific process design requirements will be addressed in future engineering studies.
Importantly, these findings validate the Company’s existing water permitting framework. In July 2023, the Utah Division of Water Rights approved the Company’s 20-year Fixed-Time Application (Water Right 09-2684, Application F83735) authorizing the withdrawal of up to 150 acre-feet annually, of brackish water to support processing and solution mining cavern operations. The permit specifically contemplated sourcing brackish water from an underground aquifer at an approximate depth of 1,200 meters (3,950 feet)-a target depth directly validated by the productive horizons confirmed in DST 1 (1,033 – 1,071 m; 3,390 – 3,515 feet) and DST 3 (1,295 – 1,334 m; 4,250 – 4,375 feet).
HONAKER TRAIL FORMATION
While drilling the Peterson 1 hole, the well encountered an anticipated lost-circulation zone in the Honaker Trail Formation. Approximately 12.7 cubic meters (80 barrels) of drilling fluid were lost between 1,408 and 1,445 m (4,620 and 4,740 feet) (1,408 – 1,445 m) despite lost circulation material already present in the mud system. Continued fluid losses of approximately 1.6 cubic meters (10 barrels) per hour persisted to 1,509 m (4,950 feet). In order to protect wellbore integrity, the Company elected not to run a DST or sample this interval.
The Company believes the rapid rate and volume of fluid loss indicates a highly permeable, high-transmissivity horizon capable of supplying significant water volumes, representing a compelling target for future hydrogeological evaluation. Regional studies of the Paradox Basin report that formation-water salinity generally increases with depth toward the Paradox evaporites (Hanshaw and Hill, 1969). Consistent with this regional trend and the increasing salinity observed from DST 1 to DST 3 at Peterson 1, the Company expects Honaker Trail formation fluids to be similarly saline and non-potable.
NEXT STEPS
The hydrogeological results will be incorporated into the Company’s ongoing and future engineering studies.
Qualified Person
The scientific and technical information contained in this news release has been reviewed and approved by Greg Vogelsang, P.Geo., P.Eng., the Qualified Person as defined by National Instrument 43-101 Standards of Disclosure for Mineral Projects. Mr. Vogelsang is Vice President, Project Development for the Company.
About Sage Potash Corp.
Sage Potash Corp. (TSXV: SAGE) (OTCQB: SGPTF) is dedicated to developing its flagship Sage Plain Potash Project, located in the Paradox Basin in Utah. With a large, high-grade resource base, the Company is advancing toward its goal of establishing a secure and sustainable domestic potash production platform in the United States. Sage Potash is committed to food security, environmental stewardship, and creating value for shareholders and stakeholders.
Neither the TSX Venture Exchange nor its Regulation Services Provider (as that term is defined in the policies of the TSX Venture Exchange) accepts responsibility for the adequacy or accuracy of this release.
This news release contains “forward-looking information” and “forward-looking statements” within the meaning of applicable securities legislation. The forward-looking statements herein are made as of the date of this news release only, and the Company does not assume any obligation to update or revise them to reflect new information, estimates or opinions, future events or results or otherwise, except as required by applicable law. Often, but not always, forward-looking statements can be identified by the use of words such as “plans”, “expects”, “is expected”, “budgets”, “scheduled”, “estimates”, “forecasts”, “predicts”, “projects”, “intends”, “targets”, “aims”, “anticipates” or “believes” or variations (including negative variations) of such words and phrases or may be identified by statements to the effect that certain actions “may”, “could”, “should”, “would”, “might” or “will” be taken, occur or be achieved. Forward-looking information in this news release includes, but is not limited to, statements with respect to: estimated potential water yields from the Cutler and Lower Cutler/Rico formations; the adequacy of the formation waters for processing and solution mining; the potential of the Honaker Trail Formation to supply significant volumes of water and the expected salinity of its formation waters; future evaluation of the Honaker Trail Formation; and the incorporation of the hydrogeological results into future engineering studies and the updated resource estimate. Forward-looking statements and information are subject to various known and unknown risks and uncertainties, many of which are beyond the ability of the Company to control or predict, that may cause the Company’s actual results, performance or achievements to be materially different from those expressed or implied thereby, and are developed based on assumptions about such risks, uncertainties and other factors set out herein, including, but not limited to, the risk factors set out under the heading “Risk Factors and Uncertainties” in the Company’s Management’s Discussion & Analysis available for review under the Company’s profile at www.sedarplus.ca. Such forward-looking information represents management’s best judgement based on information currently available. No forward-looking statement can be guaranteed and actual future results may vary materially. Accordingly, readers are advised not to place undue reliance on forward-looking statements or information.
I first wrote about a new advertiser named Sage Potash last June. In that piece I wanted to make the point that having a single country potentially controlling a substantial flow of major commodities such as oil and oil related products was especially dangerous for the world economy. It doesn’t make any difference if that country is considered a friend or foe.
That’s exactly the situation Trump has dragged the US into to pay for and fight a war against a country not our enemy. But Israel controls Congress, they control the Senate, now the military and certainly own Donald J. Trump. It’s a war for Israel, not a war the US stands to gain anything. But Israel hates all their neighbors and whines on a constant basis about how they, Israel, are the victims. They are not.
Countries of the world need to be thinking seriously about a Plan B. Anything energy related needs to be considered. Having an alternative source of supply could easily mean issues of life and death. We are going to understand that better this winter when foolish energy decisions such as that of Germany allowing the US military to blow up 75% of the four Nord Stream pipelines cause Europeans to freeze and potentially starve due to the cost and availability of energy and energy products.
Fertilizer is a perfect example. Many of the inputs to fertilizer are produced as a byproduct of refining crude oil such as sulfur. Due to this incredibly stupid and pointless war, the costs of farming such as diesel fuel and urea or sulfur have shot through the roof.
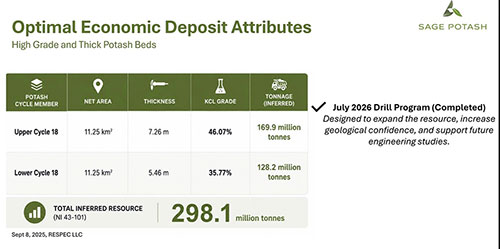
A tiny company in Utah heard a knock on the door and found to their great pleasure that it was opportunity knocking. Sage Potash (SAGE-V) owns a 345 square km potash property in a basin in Utah. Based on the first drill hole they put down named Johnson 1 the company has an existing 43-101 inferred resource of 298.1 million tonnes of high-grade potash. Obviously right from the start it is going to be difficult for potential investors to understand what value the company offers so I am going to lead you through how to determine that.
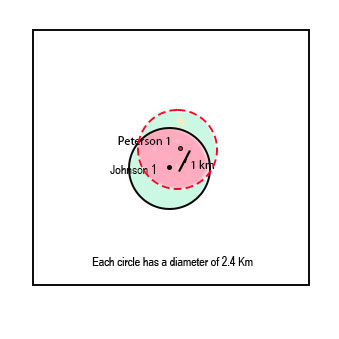
With some flat lying sedimentary minerals such as coal and potash even a single hole can generate an inferred resource. The theory being that since it is a flat deposit of sedimentary material even a single hole will suggest similar material surrounding the hole. In the case of the first hole, named Johnson 1, the QP used a circle around the hole with a diameter of 2.4 km. The QP concluded the grade of the hole and thickness justified an inferred resource of 298.1 million tonnes at an average of about 40% potash.
The potash market has been relatively stable for the last couple of years because potash doesn’t come from natural gas or crude oil. The value of a tonne of potash in the markets the Utah based Sage would serve would be about $472.50. If you multiply the resource of 298.1 million tonnes by an average grade of about 40% and factor in the current price of $472.50 the theoretical value of the potash in the ground would be about $56 billion in USD.
Here is where it gets very interesting. I have looked at the capex and Opex of other potash companies and it looks to me as if the company could in theory net about $300 a tonne and produce between one and two million tonnes a year. The Capex is not cheap, it could be in the $1 to $2 billion range.
The real news beyond the excellent drill results from Hole 2, named Peterson 1 released on September 28th and promptly ignored by investors is just how it will affect the 43-101 numbers.
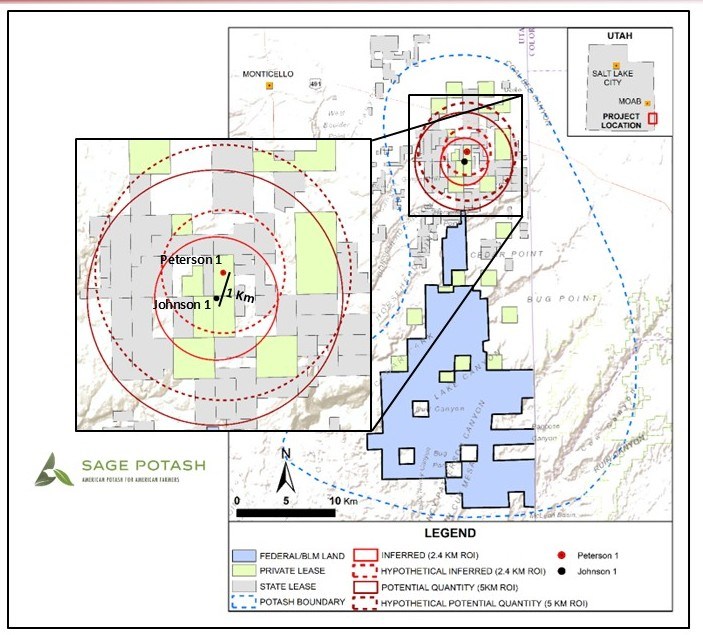
If you look at the chart we prepared below. The black circle reflects the 298.1 million tonnes with the resource derived from the Johnson 1 hole. And now the company has drilled the Peterson 1 hole just 1 km to the NE. That hole is surrounded by a 2.4 km diameter dashed line. If the QP shows that in the 43-101 coming in about a month, the red area in between Johnson and Peterson will almost certainly qualify as Measured and Indicated. The green quarter moons above and below the holes will almost certainly be Inferred. So it looks to me as if the resource will only grow perhaps 25% but the high-grade resource shown in red will be about 50% of the total. That’s a giant move higher in confidence and should draw the attention of majors.
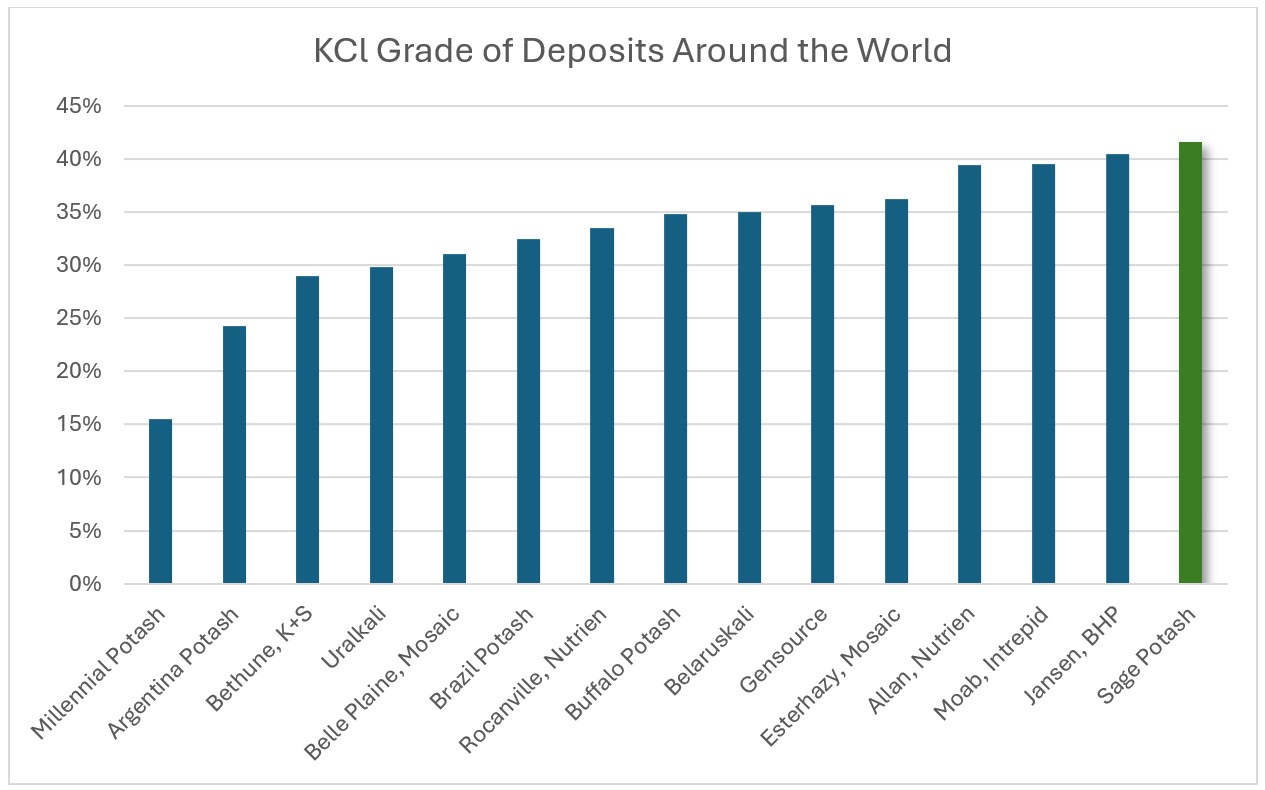
The grade of the potash shown in both holes is exceptional and is among the highest grade in the world. It certainly looks to me as if this will be put into production. The US needs to control the inputs to its own agriculture industry.
Sage is an advertiser and I have bought shares in the open market. Naturally I am biased so do your own due diligence. Their only problem is a lack of visibility.
Sage Potash Corp SAGE-V $.13 Oct 01, 2026 SGPTF-OTCQB 171 million shares Sage Potash website
Vancouver, British Columbia–(Newsfile Corp. – October 1, 2026) – West Point Gold Corp. (TSXV: WPG) (OTCQX: WPGCF) (FSE: LRA0) (“West Point Gold” or the “Company”) is pleased to report that following the receipt of permits and the completion of bonding, Kinross Gold U.S.A., Inc. (“Kinross”), a wholly owned subsidiary of Kinross Gold Corporation, has commenced drilling at West Point Gold’s Jefferson Canyon project in Nye County, Nevada.
Highlights
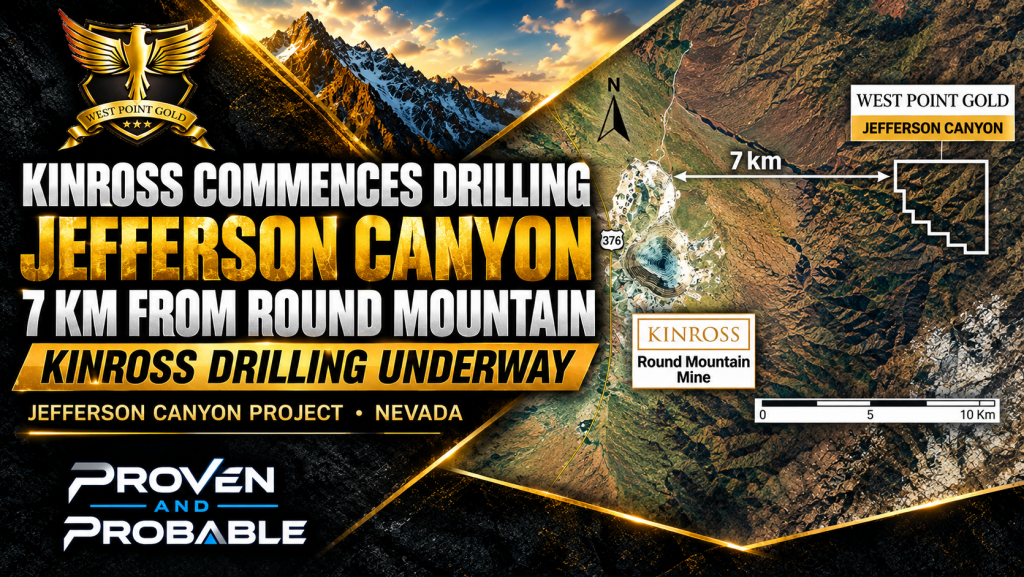
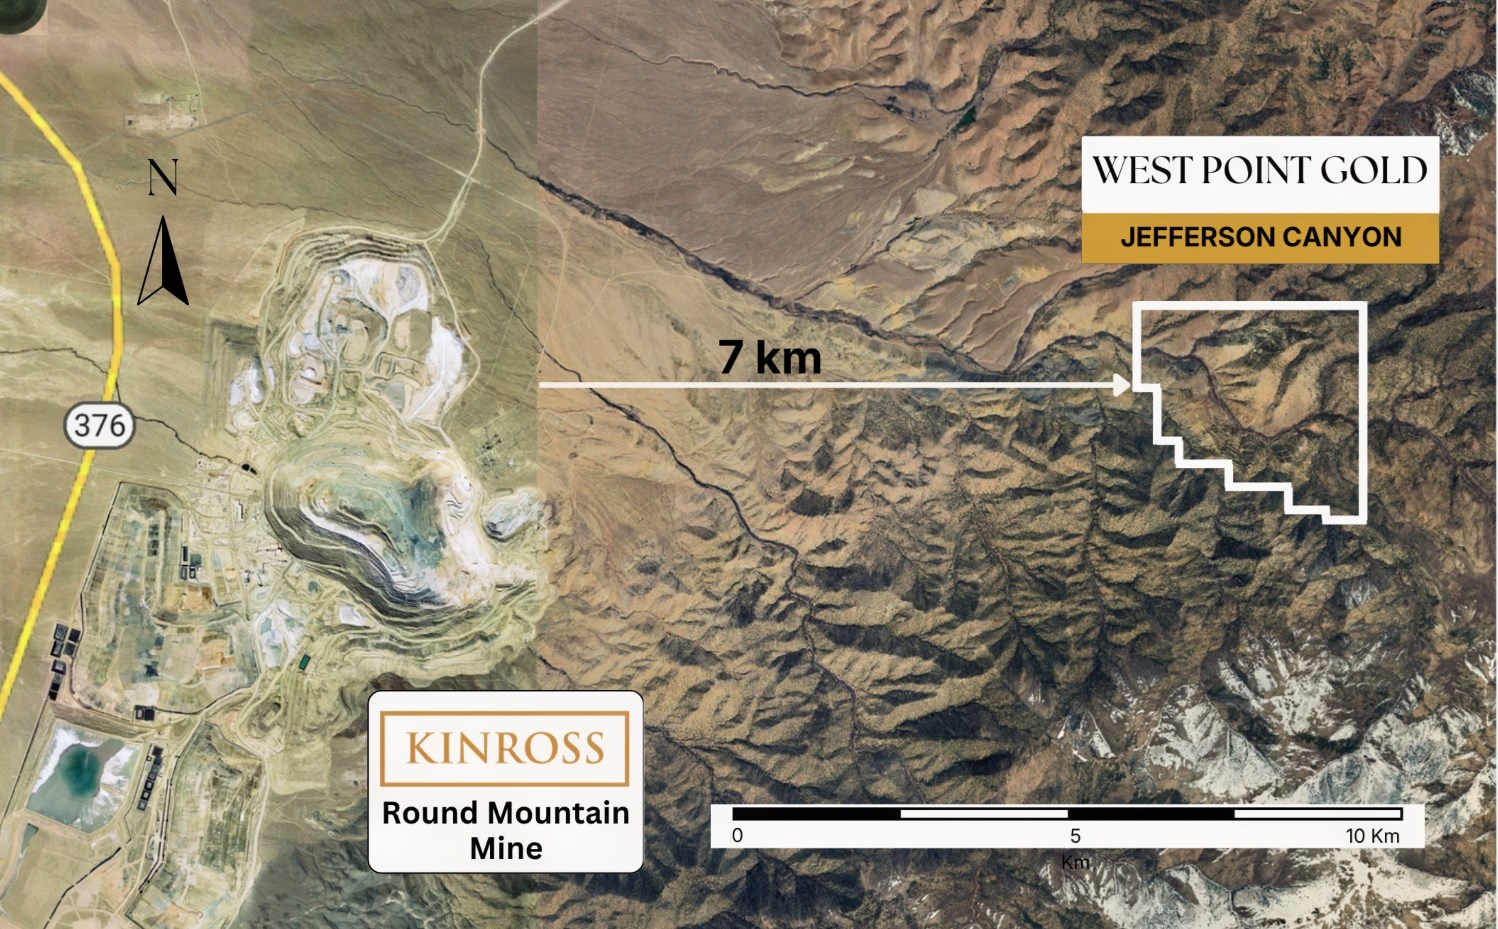
Kinross has commenced drilling on September 23, 2026, at West Point Gold’s Jefferson Canyon, located approximately 7 kilometres from its Round Mountain operations.
Partner-funded exploration allows West Point Gold to retain exposure to Jefferson Canyon while allowing the Company to remain focused on its flagship Gold Chain Project.
Permits were received August 19, 2026, starting the four-year option period laid out in the 2022 Exploration and Option Agreement (the “Agreement”).
The Agreement provides for the potential of up to US$10 million in future option payments.
West Point Gold retains meaningful long-term exposure to Jefferson Canyon, including a 20% project interest if both Kinross options are exercised and royalty protection should its interest subsequently be diluted below 10%.
“We are excited that drilling has begun at West Point Gold’s Jefferson Canyon project. The historical drilling and work we previously completed suggest this project has the potential to deliver a significant deposit. Given the project’s proximity to Kinross’s Round Mountain mine and our partnership on the Jefferson Canyon project with Kinross, we believe the hurdle rate to define a mineable deposit is relatively low,” stated Derek Macpherson, President & CEO.
Jefferson Canyon Project, Nevada The Jefferson Canyon project in Nye County, Nevada is located 7 kilometres from Kinross’s Round Mountain operations (Figure 1). The project has 145 historical drill holes, including 41.2m at 6.4 g/t gold and 402 g/t silver (GJ-81). In 2022, West Point Gold entered into an Exploration and Option Agreement with Kinross (the “Agreement”). Kinross has made all the required payments associated with the agreement to date.
Figure 1: Jefferson Canyon Project Relative to Round Mountain
The Jefferson Canyon project contains a large volcanic-hosted epithermal Au-Ag system that is essentially the same age as the nearby Round Mountain deposit, a world-class low-sulfidation (LS) epithermal deposit. Both are hosted in felsic ash-flow tuffs along the margins of calderas and both contain a strong northwest-trending and north-south structural control to veins. Both areas contain low-grade disseminated and high-grade vein or replacement-type mineralization.
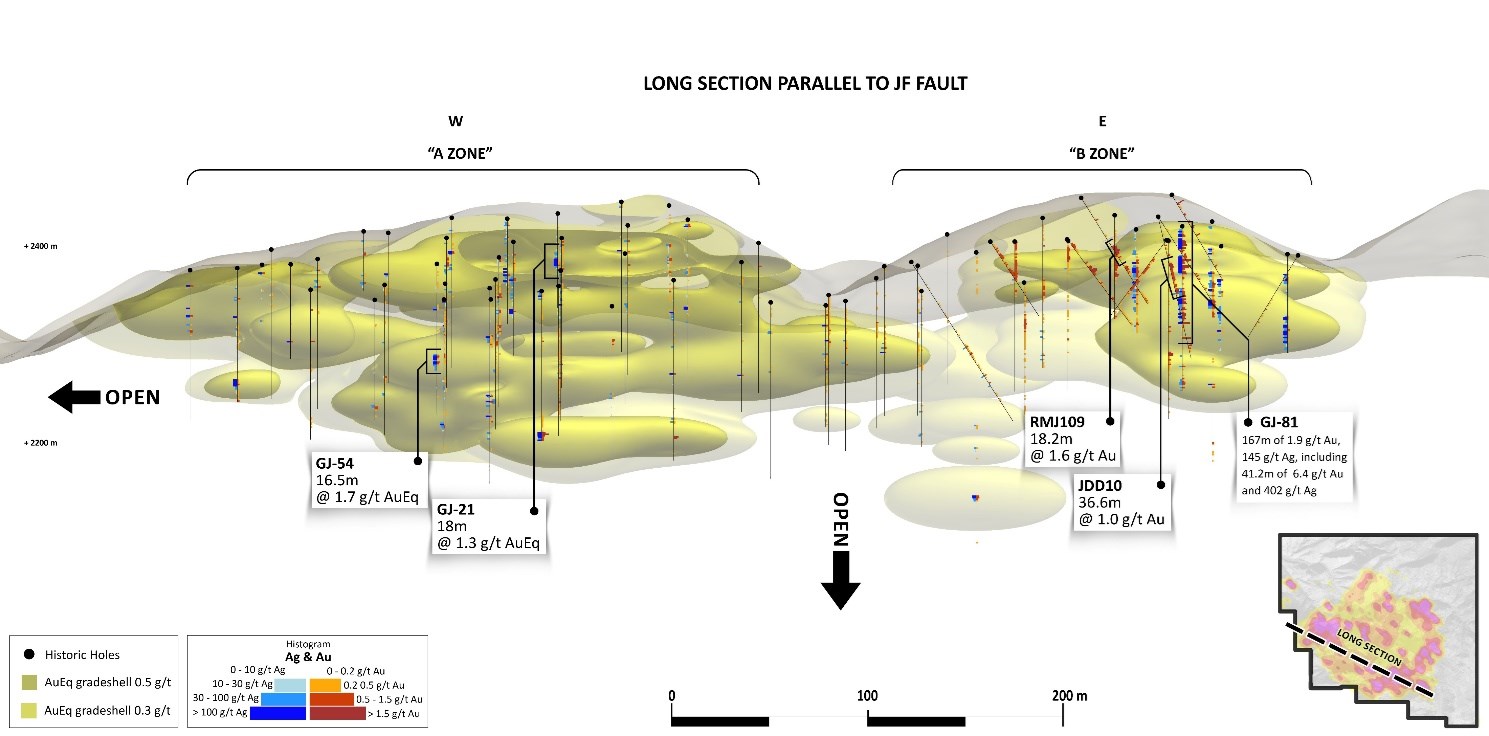
Historical drilling has defined multiple zones of mineralization (Figure 2) and has been highlighted by multiple significant drill intercepts, including 41.2m of 6.4 g/t Au and 402 g/t Ag (GJ-81).
Figure 2: Historical Drill Holes and Mineralized Envelope along the Jefferson Canyon (“JF”) Fault
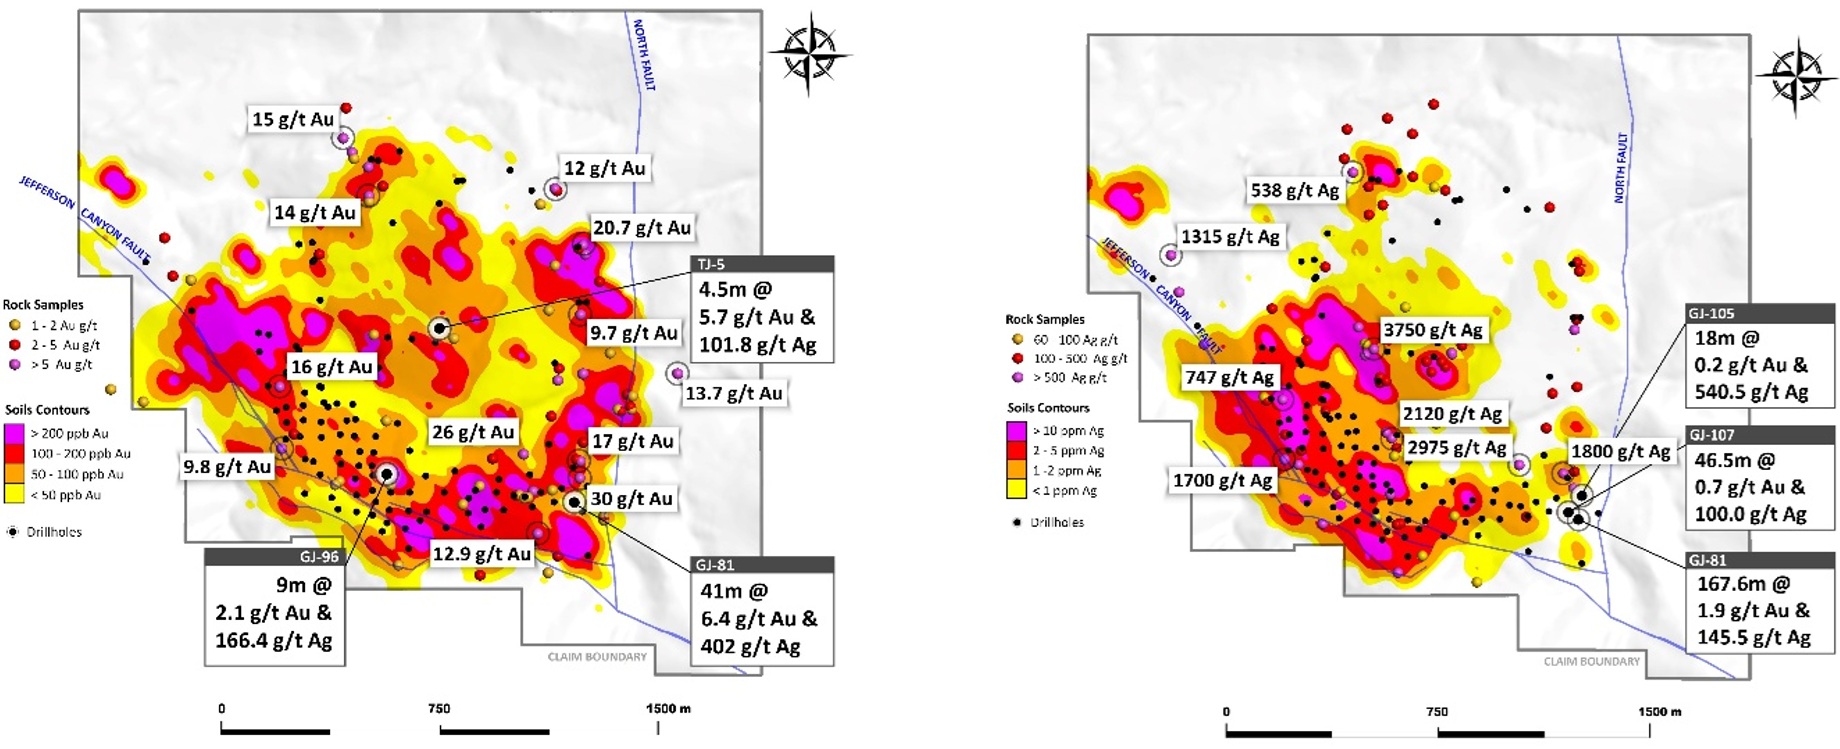
Soil sampling in 2021 revealed a four-square-kilometre circular gold-in-soil anomaly (Figure 3). The highest Au-in-soil value was 4,470 parts per billion Au and anomalous values were distributed as follows: 29 samples contained greater than 500 parts per billion Au; 99 samples were greater than 200 ppb Au; 234 samples were greater than 100 ppb Au; and, 631 samples were greater than 20 ppb Au. The five rock samples collected were anomalous, with values of up to 15.2 g/t gold and 421 g/t silver.
Figure 3: Gold-in-Soil and Silver-in-Soil Anomalies at Jefferson Canyon with historical drill collars
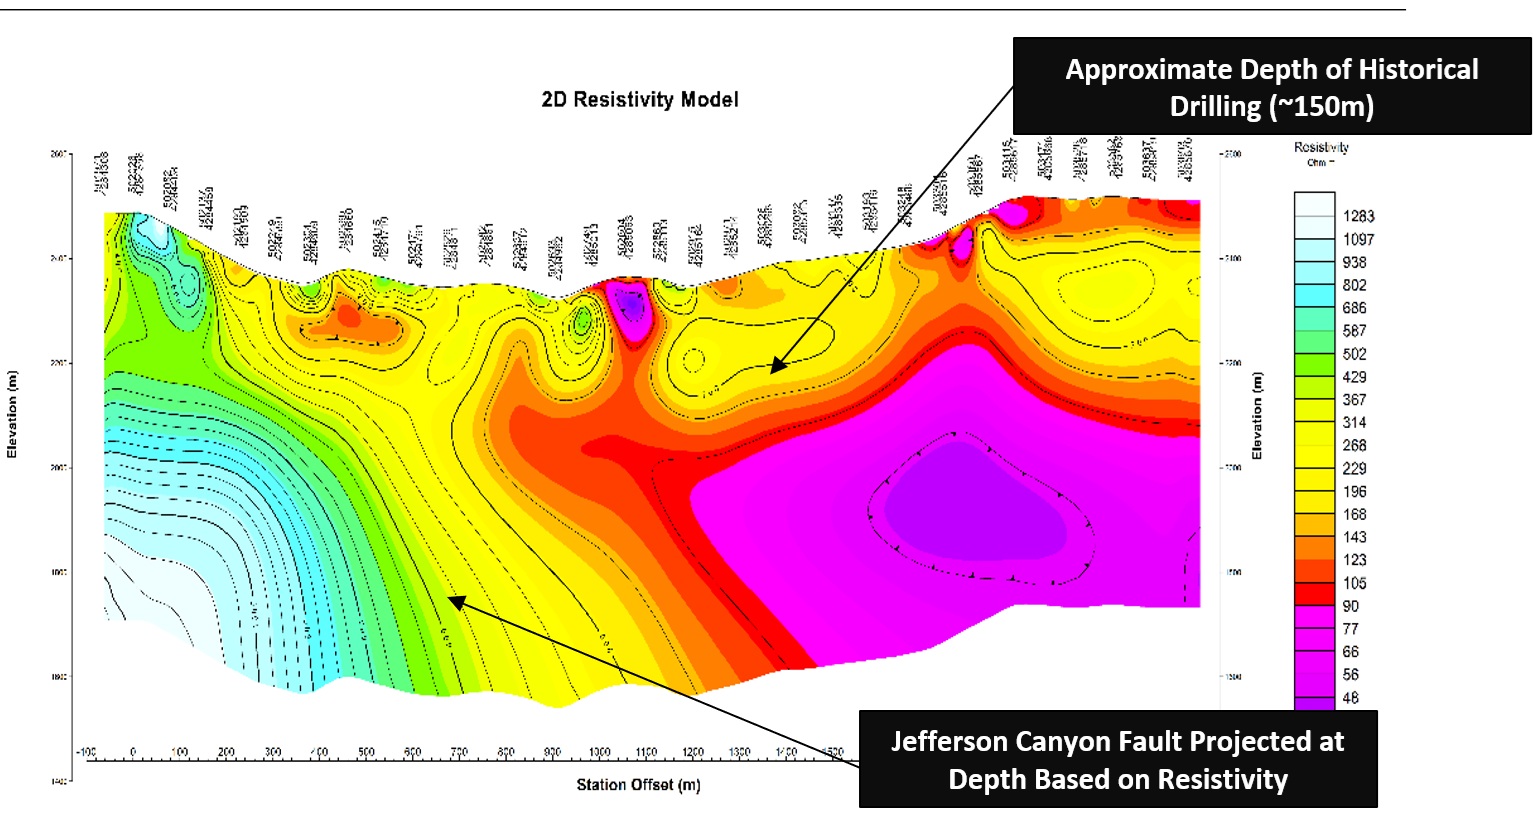
The CSMAT resistivity data suggests that the Jefferson Canyon fault is a deep structure which likely controls mineralization. This spatial relationship to the gold-silver mineralization supports the potential to expand the mineralized footprint both along strike and depth. A large conductor is evident down plunge along the northeast-dipping Jefferson Canyon fault.
Figure 4: CSAMT /Resistivity Model Showing the Projection of the Jefferson Canyon Fault at Depth
Kinross will continue making ongoing lease payments of US$75,000 per year for the term of the agreement.
Kinross is required to spend US$600,000 on exploration work and will be responsible for making the payments to keep the unpatented claims in good standing.
During the term of the agreement, Kinross has the option to acquire 70% of the project for a cash payment of US$5,000,000 to West Point Gold and form a joint venture LLC, and a second option to acquire an additional 10% of the project for a further payment of US$5,000,000 to the Company.
The term of the Agreement is four years commencing from receipt of drill permits, with a potential extension of up to two years, subject to certain conditions. Drill permits were received on August 19, 2026.
If an LLC is formed, and either party is diluted below 10%, its interest converts to a 1% net smelter returns (NSR) royalty.
Marketing Engagements The Company has engaged New Era Publishing Inc. (“New Era”), also doing business as Katusa Research, an arm’s-length service provider, to provide the Company certain investor relations and marketing services, in accordance with the policies of the TSX Venture Exchange and applicable securities laws. Based in Vancouver, B.C., New Era specializes in media and investor relations services within the natural resource sector. Under a consulting agreement dated September 8, 2026, New Era will provide media relations, investor communication and market awareness services to the Company for a two-month term for a one-time fee of US$150,000, payable at the commencement of services. The Company will not issue any securities to New Era as compensation for its services. As of the date hereof, to the Company’s knowledge, New Era (including its directors and officers) does not own any securities of the Company. The marketing agreement with New Era is subject to TSX Venture Exchange approval.
Additionally, the Company has engaged Freedom Financial Research, LLC (“Freedom Financial”), an arm’s-length service provider, to provide the Company certain investor relations and marketing services, in accordance with the policies of the TSX Venture Exchange and applicable securities laws. Based in Charlottesville, Virginia, Freedom Financial specializes in media and investor relations services. Under a consulting agreement dated September 11, 2026, Freedom Financial will provide media relations, investor communication and market awareness services to the Company for a 90-day term for a one-time fee of US$150,000, payable at the commencement of services. The Company will not issue any securities to Freedom Financial as compensation for its services. As of the date hereof, to the Company’s knowledge, Freedom Financial (including its directors and officers) does not own any securities of the Company. The marketing agreement with Freedom Financial is subject to TSX Venture Exchange approval.
Qualified Person Robert Johansing, M.Sc. Econ. Geol., P. Geo., the Company’s Vice President, Exploration, is a qualified person (“QP”) as defined by NI 43-101 and has reviewed and approved the technical content of this press release. The QP has not completed sufficient work to verify the historical information on the properties, particularly regarding historical drill results. However, the QP believes prior drilling and analytical results were completed in accordance with industry-standard practices.
About West Point Gold Corp. West Point Gold is an exploration and development company focused on unlocking value across four strategically located projects along the prolific Walker Lane Trend in Nevada and Arizona, USA, providing shareholders with exposure to multiple discovery opportunities across one of North America’s most productive gold regions. The Company’s near-term priority is advancing its flagship Gold Chain Project in Arizona.
For further information regarding this press release, please contact: Aaron Paterson, Corporate Communications Manager Phone: +1 (778) 358-6173 Email: info@westpointgold.com
FORWARD-LOOKING STATEMENTS: Certain statements contained in this press release constitute forward-looking information. These statements relate to future events or future performance. Forward-looking statements include estimates and statements that describe the Company’s future plans, objectives or goals, including words to the effect that the Company or management expects a stated condition or result to occur. The use of any of the words “could”, “intend”, “expect”, “believe”, “will”, “projected”, “estimated” and similar expressions and statements relating to matters that are not historical facts are intended to identify forward-looking information and are based on the Company’s current belief or assumptions as to the outcome and timing of such future events including, among others, assumptions about future prices of gold, silver, and other metal prices, currency exchange rates and interest rates, ability to define economic mineralization, favourable operating conditions, political stability, obtaining government approvals and financing on time, obtaining renewals for existing licenses and permits and obtaining required licenses and permits, labour stability, stability in market conditions, availability of equipment, availability of drill rigs, and anticipated costs and expenditures. The Company cautions that all forward-looking statements are inherently uncertain, and that actual performance may be affected by a number of material factors, many of which are beyond the Company’s control. Such factors include, among other things: risks and uncertainties relating to West Point Gold’s ability to complete any payments or expenditures required under the Company’s various option agreements for its projects; and other risks and uncertainties relating to the actual results of current exploration activities, the uncertainties related to resources estimates; the uncertainty of estimates and projections in relation to production, costs and expenses; risks relating to grade and continuity of mineral deposits; the uncertainties involved in interpreting drill results and other exploration data; the potential for delays in exploration or development activities; uncertainty related to the geology, grade and continuity of mineral deposits; the possibility that future exploration, development or mining results may vary from those expected; statements about expected results of operations, royalties, cash flows, financial position may not be consistent with the Company’s expectations due to accidents, equipment breakdowns, title and permitting matters, labour disputes or other unanticipated difficulties with or interruptions in operations, fluctuating metal prices, unanticipated costs and expenses, uncertainties relating to the availability and costs of financing needed in the future and regulatory restrictions, including environmental regulatory restrictions. The possibility that future exploration, development or mining results will not be consistent with adjacent properties and the Company’s expectations; operational risks and hazards inherent with the business of mining (including environmental accidents and hazards, industrial accidents, equipment breakdown, unusual or unexpected geological or structural formations, cave-ins, flooding and severe weather); metal price fluctuations; environmental and regulatory requirements; availability of permits, failure to convert estimated mineral resources to reserves; the inability to complete a feasibility study which recommends a production decision; the preliminary nature of metallurgical test results; fluctuating gold prices; possibility of equipment breakdowns and delays, exploration cost overruns, availability of capital and financing, general economic, political risks, market or business conditions, regulatory changes, timeliness of government or regulatory approvals and other risks involved in the mineral exploration and development industry, and those risks set out in the filings on SEDAR+ made by the Company with securities regulators. Although the Company believes that the assumptions and factors used in preparing the forward-looking information in this corporate press release are reasonable, undue reliance should not be placed on such information, which only applies as of the date of this news release, and no assurance can be given that such events will occur in the disclosed time frames or at all. The Company expressly disclaims any intention or obligation to update or revise any forward-looking statements whether as a result of new information, future events or otherwise, other than as required by applicable securities legislation.
Neither the TSX Venture Exchange nor its Regulation Services Provider (as that term is defined in the policies of the TSX Venture Exchange) accepts responsibility for the adequacy or accuracy of this release.
Scheduled manufacturing hours increase 110%, from 40 to 84 per week, as Company advances toward planned 24-hour operations
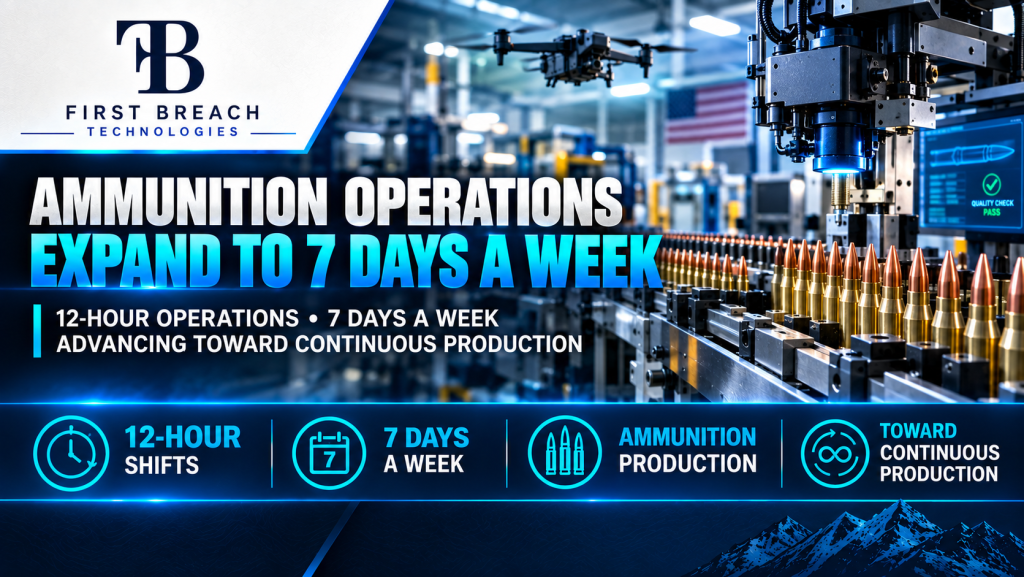
HAGERSTOWN, MD / ACCESS Newswire / September 30, 2026 / First Breach Inc. (NASDAQ:FBDT) (“First Breach” or the “Company”), an American-made defense technologies company focused on vertically integrated ammunition production and next-generation unmanned aerial systems, today announced that its ammunition manufacturing facility in Hagerstown, Maryland, has transitioned from eight-hour operations, Monday through Friday, to 12-hour operations, seven days a week.
Following a successful initial trial, the expanded schedule increases scheduled manufacturing hours from 40 to 84 per week. The transition represents the first phase of the Company’s planned move to 24-hour operations through two 12-hour shifts, seven days a week.
Together with recently installed loading and inspection equipment, the additional hours are intended to increase ammunition production capacity and support customer demand, including purchasing commitments under the Company’s previously announced three-year supply and distribution agreement with SAS Ammo.
“This expansion allows us to make greater use of our equipment and existing facility as we work to increase production and strengthen our ability to serve customers,” said Jeffrey Low, Co-Founder and Chief Executive Officer of First Breach. “The positive results of our initial trial give us confidence in our phased approach as we work toward continuous production.”
The expansion builds on First Breach’s investment in domestic ammunition manufacturing and its ISO 9001:2015-certified quality management system. Experience gained in managing additional shifts and coordinating production teams is also expected to support the Company’s planned drone manufacturing expansion.
About First Breach
First Breach Inc. is an ISO 9001:2015 certified, American-made defense technologies company focused on manufacturing match-grade ammunition components, finished ammunition, and developing next-generation unmanned aerial systems for commercial, law enforcement, and military markets. The Company manufactures its products in-house at its Hagerstown, Maryland facility, where it produces brass cups, casings, projectiles, lead cores, lead wire, and completed ammunition with rigorous quality control standards. First Breach is also advancing its drone strategy through the development of U.S.-made unmanned systems, leveraging advanced engineering, robotics, ISR and sensor technologies, and precision manufacturing capabilities to address evolving defense, homeland security, law enforcement, and commercial requirements across domestic and international markets.
This press release contains forward-looking statements within the meaning of the Private Securities Litigation Reform Act of 1995. Forward-looking statements are not historical facts and include statements regarding the Company’s expectations, beliefs, plans, objectives, strategies, future events, future performance, business prospects, growth initiatives, acquisitions, market opportunities, capital resources, operational objectives, and other statements that are predictive in nature. Forward-looking statements may be identified by the use of words such as “anticipate,” “believe,” “continue,” “could,” “estimate,” “expect,” “forecast,” “intend,” “may,” “plan,” “potential,” “predict,” “project,” “seek,” “should,” “target,” “will,” “would,” and similar expressions, although not all forward-looking statements contain these identifying words.
Forward-looking statements are based on management’s current expectations, assumptions, and beliefs regarding future developments and their potential effect on the Company. These statements are not guarantees of future performance and involve known and unknown risks, uncertainties, assumptions, and other factors that may cause actual results, performance, or achievements to differ materially from those expressed or implied by such forward-looking statements.
Factors that could cause actual results to differ materially from those expressed or implied by forward-looking statements include, but are not limited to, changes in economic, business, market, competitive, regulatory, technological, legal, and geopolitical conditions; the Company’s ability to execute its business strategy; the successful integration of acquisitions and strategic transactions; access to capital and financing; customer demand; industry developments; and other risks and uncertainties described from time to time in the Company’s filings with the U.S. Securities and Exchange Commission, which are available for review at www.sec.gov.
Readers are cautioned not to place undue reliance on forward-looking statements, which speak only as of the date they are made. Except as required by applicable law, the Company undertakes no obligation to update, revise, or publicly disclose any revisions to any forward-looking statements to reflect events, circumstances, or changes in expectations occurring after the date of this press release.
Vancouver, British Columbia and Salt Lake City, Utah–(Newsfile Corp. – September 28, 2026) – Sage Potash Corp. (TSXV: SAGE) (OTCQB: SGPTF) (“Sage Potash” or the “Company”) is pleased to provide potash assay results from the completion of drilling operations at the Peterson 1 site, located at the Company’s flagship Sage Plain Potash Project in southeast Utah. Results from the Saskatchewan Research Council lab assays returned three high-grade potash sections grading better than 50.0 % KCl within the Upper and Lower Cycle 18 potash beds. High-grade sections in the Upper Cycle 18 potash horizon include 10.8 feet (3.3 m) of 52.5% KCl and 3.3 feet (1.0 m) of 52.0% KCl within the 26.6 foot (8.1m) thick intersection of the Upper Cycle 18 potash bed grading 36.1% KCl. A high-grade, 10.1 foot (3.1 m) section grading 53.4% KCl in the Lower Cycle 18 potash bed occurs within a 16.4 foot (5.0 m) thick intersection grading 36.4% KCl, confirming the continuity and high-grade tenor of the deposit and making it one of the highest-grade deposits around the world.
DRILL PROGRAM HIGHLIGHTS
Continuity of high-grade potash and significant bed thicknesses have been confirmed for both Upper and Lower Cycle 18 potash beds.
Outstanding, high-grade tenor confirmed within the Upper and Lower Cycle 18 potash beds as summarized in Table 1.
Combined grade and thickness of 36.3% over 43 feet (13.1 m) for the whole of Cycle 18.
The potash intervals and assay results confirm remarkable continuity between the recently completed Peterson 1 hole and the previous Johnson 1 hole, located 0.62 miles (1.0 km) to the south.
Importantly, we have now also confirmed high-grade potash mineralization in the Lower Bed of Cycle 18.
FROM (ft)
TO (ft)
THICKNESS (ft)
THICKNESS (m)
KCl GRADE (%)
UPPER CYCLE 18
7,087.6
7,114.2
26.6
8.1
36.1%
Including
7,087.6
7,090.9
3.3
1.0
52.0%
Including
7,098.1
7,108.9
10.8
3.3
52.5%
LOWER CYCLE 18
7,154.2
7,170.6
16.4
5.0
36.4%
Including
7,154.2
7,164.4
10.2
3.1
53.4%
Table 1. Summary of Upper and Lower Cycle 18 drill intercepts in Peterson 1
“Completing the Peterson 1 drilling program and receiving these outstanding analytical results mark a significant, transformational development for the Sage Plain Project,” said Patricio Varas, CEO of Sage Potash. “The continuity, thickness and high grades of the potash beds demonstrate a world-class deposit that can be advanced rapidly toward production.”
Mr. Varas added: “Potash project resources commonly exceed the tonnage required to define reserves and a mine plan. As we advance the project – first with an updated resource estimate, followed by a PFS and further engineering studies, we expect the new resource to support a higher-capacity mine plan contemplating meaningful potash production in the United States. This scale should allow Sage to evaluate various mining methods and optimize a mine plan that leverages the very high-grade mineralization to target a high IRR and rapid payback, while pursuing a development larger than the 300,000 tonnes per year contemplated in the September 8, 2025 PEA.”
Mr. Varas further added: “The Sage Plain Project is advancing as the United States designates potash a critical mineral and global attention to fertilizer-input security remains elevated.”
Results from these analytical assays will now be used to update the project resources. An updated NI 43-101 resource estimate is planned to be delivered in the next 45 days.
PETERSON DRILLING PROGRAM
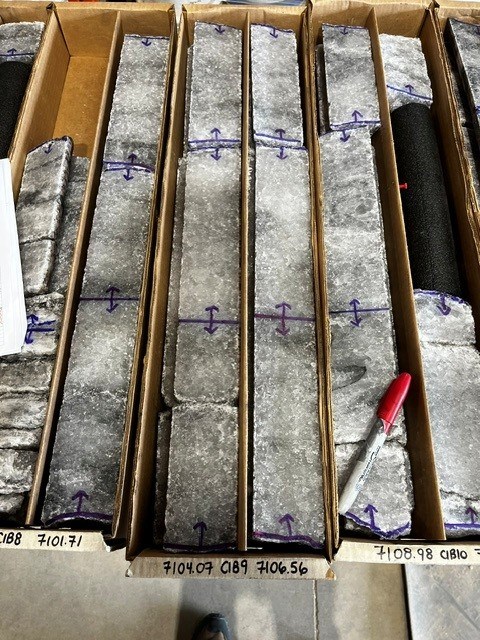
As previously announced, the Peterson 1 stratigraphic exploration hole was successfully completed on August 4, 2026, marking a key operational milestone for the project. During an initial onsite geological assessment of the recovered core, the Company confirmed the presence of pure sylvite mineralization within the Cycle 18 potash horizons.
The Peterson 1 hole was sited 0.62 miles (1.0 km) to the north-northeast of the previously drilled Johnson 1 hole (Figure 1) to facilitate both a resource expansion and delineation of a portion of the resource that will fall into the measured and indicated categories in a new NI 43-101 resource estimate.
Figure 1. Property location map with Peterson 1 and Johnson 1 Drill Hole Locations and regional extent of potash mineralization (USGA and others). Drill Hole Locations show Radius of Influence(“ROI”) illustrated as used in resource calculations.
Core from the Cycle 18 Upper and Lower zones was recovered and transported to the Saskatchewan Research Council laboratories in Saskatoon, Saskatchewan (“SRC”), for geochemical analysis. Samples were collected and shipped under the supervision of qualified independent geological personnel for analysis using industry-standard procedures. Quality assurance and quality control protocols included the insertion of blanks, standards, and duplicate samples throughout the sampling program. Assays were completed along the entire length of recovered core. Eight, one foot (30 cm) core sections were removed at the site for geo-mechanical testing. These core sections will be forwarded to the SRC laboratory for assays when geo-mechanical testing is completed. In the absence of assays, gamma ray results were used to determine the potash content for those eight samples.
The geochemical assay samples and resulting delineation of grade intercepts confirm attractive potash bed thicknesses and grades that demonstrate the high-grade tenor of the mineralization in this part of the Paradox Basin, between the Johnson 1 and Peterson 1 holes. The continuous thicknesses and high grade now demonstrated by the historical wells and the Peterson well will allow for a significant increase in the resource estimate and will allow for an upgrade in the quality of the resource for the project.
The Company has engaged RESPEC LLC to perform the NI 43-101 resource calculation based on the inclusion of the Peterson 1 drill hole information. RESPEC previously completed a NI 43-101 resource estimate on Sept 8, 2025.
SUMMARY OF CURRENT RESULTS AND COMPARISON TO PREVIOUS DRILL HOLE
Peterson 1 assays returned 36.1% KCl over 26.6 feet (8.1 m) in the Upper Bed of Cycle 18 and 36.4% KCl over 16.4 feet (5.0 m) in the Lower Bed of Cycle 18.
Figure 2. – Peterson 1 photograph of core recovered at the beginning of the Upper bed interval shows pure sylvite mineralization.
Table 2. – Full interval lengths and grades for the Cycle 18 Upper and Lower Beds; Peterson 1 and Johnson 1 drill holes.
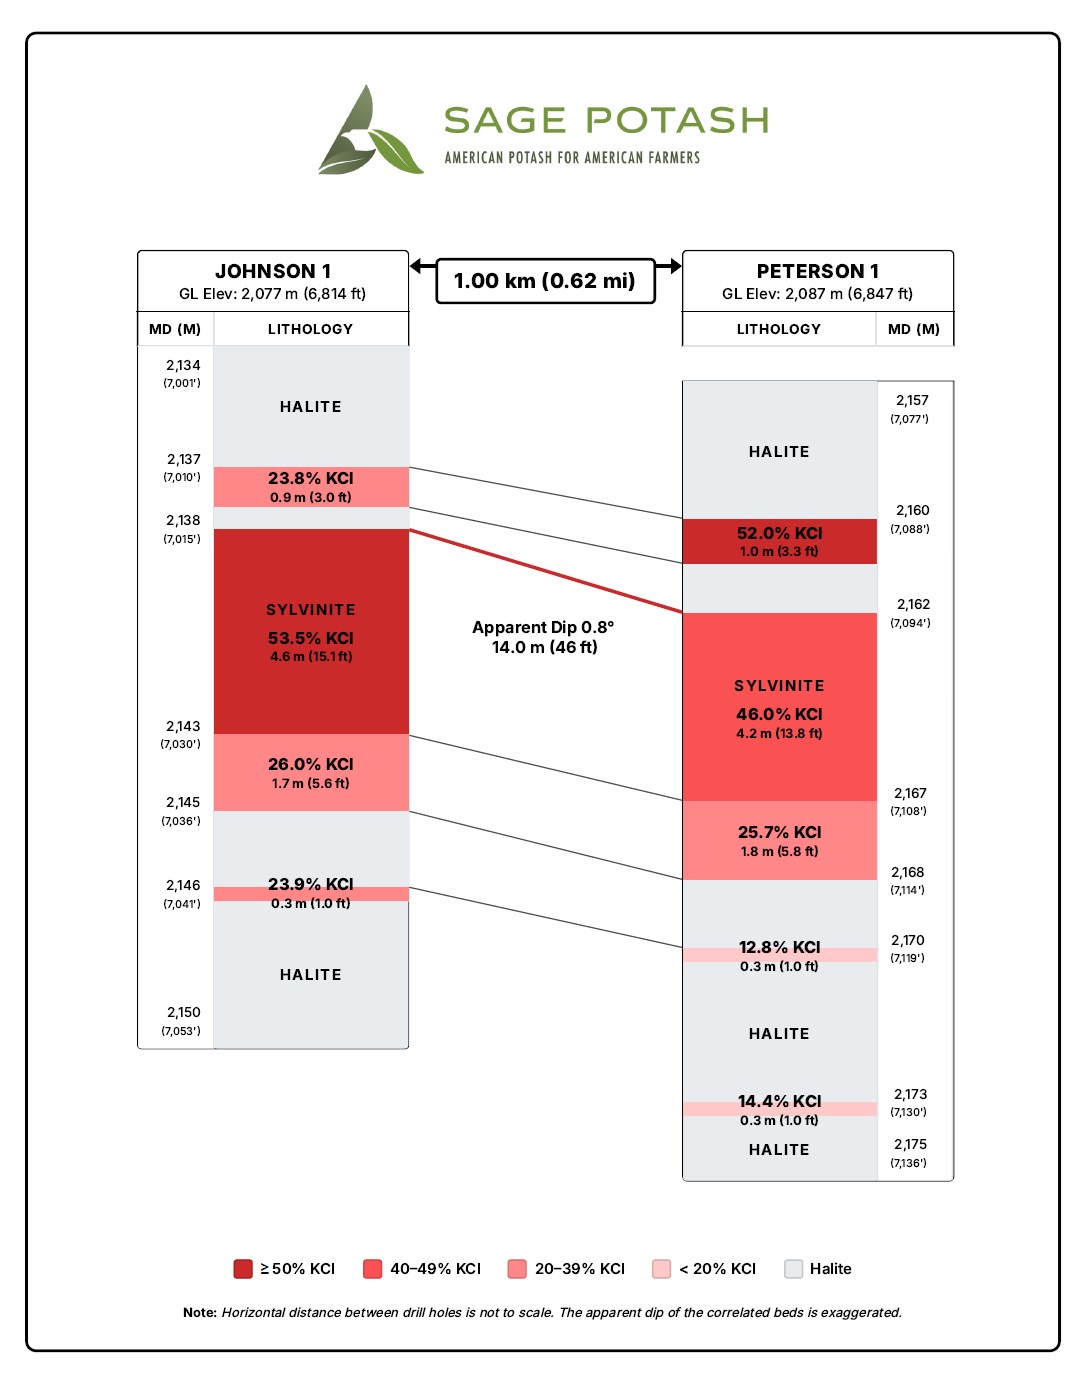
Table 2 shows the overall thickness and grade encountered at the Peterson 1 hole compared to the Johnson 1 drill hole; the two holes show excellent continuity. The current drill program recovered an outstanding high-grade interval within the Upper Bed of Cycle 18. At 7,094.5 feet (2162.4 m) of depth at the Peterson 1 drill site an interval measuring 13.8 feet (4.22 m) grading 45.5% KCl was recovered within an intercept of 19.7 feet (5.99 m) in the Cycle 18 Upper Bed with grades of 39.4% KCl. This correlates to a continuation of the same high-grade interval at Johnson 1 which was 15.0 feet (4.58 m) of 53.5% KCl.
The following figure shows a comparison of the Peterson 1 drill intercepts set out with the corresponding Johnson 1 drill intercepts in relation to the same stratigraphic bed for the Cycle 18 Upper Bed.
Figure 3. – Peterson-1 and Johnson-1 Upper Bed of Cycle 18 drill hole intercepts and continuity of Lithology
The beginning of the Upper Bed of Cycle 18 was encountered at 7,085.6 feet (2,159 m) at Peterson 1 and correlates well with the Johnson 1 hole, confirming the flat lying nature of the mineralization with a dip of approximately 0.8 degrees. The Upper Bed was followed by a barren halite interval of 42 feet (12.8 m) before entering the Lower Bed, which also correlates well with the 41 feet (12.5 m) of barren halite between the Upper and Lower Cycle 18 beds at the Johnson 1 hole site.
Assay results also indicate that the potash interval at the Peterson 1 well location is also very clean with traces of carnallite and less than 1% insoluble materials, which compares positively with the purity of the deposit in this part of the Paradox Basin as evidenced in the original Johnson 1 hole.
Drill results from the Peterson 1 and Johnson 1 sites, along with regional gamma ray results from historical drill data and previously obtained 2D seismic data, indicate the Cycle 18 potash mineralization is open in all directions.
SAGE PLAIN PROJECT GRADE COMPARISON WITH WORLD DEPOSITS
Sage Plain Project contains one of the highest-grade potash resources in the world. The bar graph in Figure 4 below shows deposit grades of many large producing mines along with certain development stage projects around the world:
Figure 4. Potash deposit grades around the world (see endnote for information sources).
The scientific and technical information contained in this news release has been reviewed and approved by Greg Vogelsang, P.Geo., P.Eng. a Qualified Person as defined by National Instrument 43-101 Standards of Disclosure for Mineral Projects. Mr. Vogelsang is Vice President Project Development for the Company.
About Sage Potash Corp.
Sage Potash Corp. (TSXV: SAGE) (OTCQB: SGPTF) is dedicated to the development of its flagship Sage Plain Potash Project, located in the Paradox Basin, Utah. With a large and high-grade resource base, the Company is advancing toward its goal of establishing a secure and sustainable domestic potash production platform in the United States. Sage Potash is committed to food security, environmental stewardship, and creating value for shareholders and stakeholders alike.
Neither the TSX Venture Exchange nor its Regulation Services Provider (as that term is defined in the policies of the TSX Venture Exchange) accepts responsibility for the adequacy or accuracy of this release.
Figure 4 Information Sources
Sources of information on other companies and projects used include: Millennial Potash Corp. (Banio Project Technical Report Nov. 11, 2025), Argentina Potash Corporation (company website referencing Agapito Associates NI 43-101 Dec 20, 2024), K+S Aktiengesellshaft (former owner Potash One Corp.’s Technical Report for Mineral Permit KP 289 Saskatchewan by Agapito Associates, Nov. 10, 2010), Uralkali (PJSC Uralkali Annual Report, April 24, 2024), Mosaic Company (Belle Plaine Technical Report, Dec. 31, 2024; Esterhazy resource grade from 2025 Annual Report), Brazil Potash Corp. (Autazes Project, S-K 1300 Technical Report Summary, Oct 14, 2021), Nutrien Ltd., (Nutrien’s 2025 AIF provides average grade mined over the 3-year period 2023 to 2025; Rocanville and Allan), Buffalo Potash Corp. (Disley Project, Technical Report April 15, 2026), Belaruskali, (JSC Belruskali entity website www:belaruskali.by/en/production), Gensource Potash Corporation (Tugaske Project, Technical Report, Oct. 14, 2021), Intrepid Potash Corp (Technical Report Summary of the 2023 Estimated Resources and Reserves at Intrepid Potash-Moab, Dec. 31, 2023), BHP (BHP Group Limited 2025 Annual Report; Jansen project).
Sage Potash Corp. resource information source (Sage Plain Technical Report, Sept 8, 2025 by RESPEC LLC).
This news release contains “forward-looking information” and “forward-looking statements” within the meaning of applicable securities legislation. The forward-looking statements herein are made as of the date of this news release only, and the Company does not assume any obligation to update or revise them to reflect new information, estimates or opinions, future events or results or otherwise, except as required by applicable law. Often, but not always, forward-looking statements can be identified by the use of words such as “plans”, “expects”, “is expected”, “budgets”, “scheduled”, “estimates”, “forecasts”, “predicts”, “projects”, “intends”, “targets”, “aims”, “anticipates” or “believes” or variations (including negative variations) of such words and phrases or may be identified by statements to the effect that certain actions “may”, “could”, “should”, “would”, “might” or “will” be taken, occur or be achieved. Forward-looking information in this news release includes, but is not limited to, statements with respect to future events or future performance of Sage Potash, including: the Peterson well allowing for a significant increase in the resource estimate and allowing for an upgrade in the quality of the resource for the project, the planned delivery of the new resource in 45 days, the planned delivery of a PFS, that the continuity, thickness and high grades of the potash beds demonstrate a world-class deposit that can be advanced rapidly toward production, that we expect the new resource to support a higher-capacity mine plan contemplating meaningful potash production in the United States, that scale should allow Sage to evaluate various mining methods and optimize a mine plan that leverages the very high-grade mineralization to target a high IRR and rapid payback, while pursuing a development larger than the 300,000 tonnes per year contemplated in the September 8, 2025 PEA.. Forward-looking statements and information are subject to various known and unknown risks and uncertainties, many of which are beyond the ability of the Company to control or predict, that may cause the Company’s actual results, performance or achievements to be materially different from those expressed or implied thereby, and are developed based on assumptions about such risks, uncertainties and other factors set out herein, including, but not limited to, the risk factors set out under the heading “Risk Factors and Uncertainties” in the Company’s Management’s Discussion & Analysis available for review under the Company’s profile at www.sedarplus.ca. Such forward-looking information represents management’s best judgement based on information currently available. No forward-looking statement can be guaranteed and actual future results may vary materially. Accordingly, readers are advised not to place undue reliance on forward-looking statements or information.
Moneywise and Yahoo Finance LLC may earn commission or revenue through links in the content below.
Your savings account is supposed to be the safe place for your money. But a warning from the Federal Reserve raises an unsettling question: What if the danger never shows up on your bank statement?
On Sept. 16, Fed Chair Kevin Warsh delivered (1) a blunt assessment: “The plain fact is that inflation is too high, and has been for too long.”
His words came as the Fed raised its benchmark interest rate from 3.75% to 4.00% — the first hike in three years. The vote was unanimous.
Higher rates could offer better returns for savers, but banks still set their own deposit rates, meaning that if your account earns less than prices are rising, the balance can grow while its buying power shrinks.
Warsh isn’t the only Fed official sounding the alarm.
Asked about U.S. debt surpassing $40 trillion, Richmond Fed President Tom Barkin warned (2), “There will be a reckoning on this as it goes forward. No one can tell you when.” He added that investors would eventually stop buying the government’s debt.
Barkin was speaking about U.S. government borrowing. But Ray Dalio, founder of the world’s largest hedge fund, Bridgewater Associates, has described how this debt crisis could reach American savers.
“There won’t be a default — the central bank will come in and we’ll print the money and buy it,” he told CNBC (3) last year. “And that’s where there’s the depreciation of money.”
In other words, the government may never technically run out of dollars — but those dollars can lose value fast.
The long-term loss of buying power has already been stark. According to the Inflation Calculator (4) put out by the Federal Reserve Bank of Minneapolis, $100 in 2026 has the same purchasing power as just $11.61 did in 1970.
That’s right. $100 became less than $12 — despite decades of efforts by the Fed to keep rising prices in check.
For people keeping much of their nest egg in savings accounts, the danger is clear: If the interest they earn fails to keep pace, inflation can steadily erode the value of their money. That’s why Warsh’s warning matters to savers.
The good news? Throughout history, savvy investors have found ways to shield their wealth from inflation’s bite, whether the central bank succeeded in containing it or not.
Here’s a look at three time-tested strategies.
Own something the Fed can’t print
When it comes to preserving wealth and fighting inflation, few assets have stood the test of time like gold.
Its appeal is simple: Unlike fiat currencies, the yellow metal can’t be printed at will by central banks. This inherently limited supply can arguably help it store its value.
Gold is also considered the ultimate safe haven. It’s not tied to any one country, currency or economy, and in times of economic turmoil or geopolitical uncertainty, investors often flock to it — driving prices higher.
Dalio has repeatedly highlighted gold’s role in a resilient portfolio.
“People don’t have, typically, an adequate amount of gold in their portfolio,” he said in the same CNBC interview. “When bad times come, gold is a very effective diversifier.”
Other prominent voices see further potential. JPMorgan CEO Jamie Dimon has said that in this environment, gold can “easily” rise to $10,000 an ounce.
In fact, as inflation continued to chip away at the purchasing power of the dollar, gold has climbed around 150% (5) over the past five years.
You can combine the recession-resistant properties of the precious metal with the tax advantages of an IRA by opening a gold IRA with the help of Newport Gold.
Even better, you can get free setup, shipping and storage for up to three years with Newport Gold’s Liberty bundle to minimize some of those upfront costs. Plus, you can roll over an existing IRA or 401(k) into a precious metals IRA completely tax- and penalty-free.
Gold isn’t the only asset investors turn to during inflationary times. Real estate has also proven to be a powerful hedge.
That’s because when inflation rises, property values often increase as well, reflecting the higher costs of materials, labor and land. At the same time, rental income tends to go up, providing landlords with a revenue stream that adjusts for inflation.
Over the past 10 years, the S&P Cotality Case-Shiller U.S. National Home Price NSA Index (6) has jumped by 87%, reflecting strong demand and limited housing supply.
Of course, high home prices can make buying a home more challenging, especially with mortgage rates still elevated. And being a landlord isn’t exactly hands-off work — managing tenants, maintenance and repairs can quickly eat into your time (and returns).
The good news? You don’t need to buy a property outright — or deal with leaky faucets — to invest in real estate today. Platforms like mogul provide an easier way to get exposure to this income-generating asset class.
This real estate investment platform offers fractional ownership in blue-chip rental properties, giving its investors the monthly rental income, real-time appreciation and tax benefits of owning a property — without the need for a hefty down payment or late-night tenant calls.
Each property undergoes a rigorous vetting process, requiring a minimum 12% return even in downside scenarios. Across the board, the platform features an average annual IRR of 18.8%. Their cash-on-cash yields, meanwhile, average between 10% and 12% annually. Offerings often sell out in under three hours, with investments typically ranging between $15,000 and $40,000 per property.
Another option is to leverage multifamily real estate investing. The advantage of investing in multifamily real estate — which includes anything from duplexes and triplexes to apartment buildings — is that it can generate multiple income streams from one asset, offering a potentially more resilient cash flow.
In a report (7) prepared by JPMorgan, Al Brooks — the firm’s vice chair of Commercial Banking — said, “I think multifamily housing is absolutely where you want to be as an investor.”
Accredited investors can now tap into this opportunity through platforms such as Lightstone DIRECT, which gives accredited investors access to single-asset multifamily and industrial deals.
Lightstone DIRECT’s direct-to-investor model ensures a high degree of alignment between individual investors and a vertically-integrated, institutional owner-operator — a sophisticated and streamlined option for individual investors looking to diversify into private-market real estate.
Investing legend Warren Buffett knows a thing or two about navigating inflation, having managed Berkshire Hathaway’s stock portfolio through the double-digit inflation of the 1970s. It would be fair to say he has developed plenty of insight into the types of businesses that can hold up when consumer prices surge.
In his 1982 letter to shareholders (8), Buffett pointed to two characteristics that can make a business especially resilient in an inflationary environment: the ability to increase prices easily and the ability to handle more business without requiring large amounts of new capital.
In other words, companies with strong pricing power and relatively modest capital needs can be better positioned to protect their profitability as costs rise.
That helps explain why the right stocks can serve as a long-term hedge against inflation. But Buffett has also made clear that you don’t need to be an expert in picking stocks to participate in the market’s growth.
“In my view, for most people, the best thing to do is own the S&P 500 index fund,” Buffett has famously said (9).
This approach gives investors exposure to 500 of America’s largest companies across a wide range of industries, providing instant diversification without the need for constant monitoring or active trading.
The beauty of this approach is its accessibility — anyone, regardless of wealth, can take advantage of it. Even small amounts can grow over time with tools like Acorns, a popular app that automatically invests your spare change.
Signing up for Acorns takes just minutes: All you have to do is link your cards, and Acorns will round up each purchase to the nearest dollar, investing the difference — your spare change — into a diversified portfolio.
With Acorns, you can invest in an S&P 500 ETF with as little as $5 — and, if you sign up today with a recurring investment, Acorns will add a $20 bonus to help you begin your investment journey.
Untethered flight validates airframe and vehicle systems as First Breach moves toward completion of initial prototypes in Q4 2026.
Company reaffirms target of scaling production in Q2 2027, supported by its strategic agreement with Hellbender for engineering, design, and domestic component manufacturing.
POC, with payload
HAGERSTOWN, Md / ACCESS Newswire / August 25, 2026 – First Breach Inc. (NASDAQ:FBDT) (“First Breach” or the “Company”), an American-made defense technologies company focused on
vertically integrated ammunition production and next-generation unmanned aerial systems, today announced the successful completion of the first untethered flight of its proprietary drone prototype. The Company also reported progress on its proprietary flight controller, developed under its strategic agreement with Hellbender, Inc., as it works toward completing initial prototypes in the fourth quarter of 2026. Building on the first flight announced on August 25, 2026, the latest milestone demonstrated operation of the prototype’s airframe, propulsion, and core vehicle systems in free flight without a physical tether. The aircraft flew using commercial flight electronics while development of the Company’s proprietary controller proceeded in parallel. Integrating that controller into the aircraft for further testing is the next development step.
“Untethered flight is the point where a drone stops being a test article and starts being a vehicle,” said Jeffrey Low, Co-Founder and Chief Executive Officer of First Breach. “Every step we take on this program is a step toward owning the full stack, meaning the airframe, the electronics, and the manufacturing, here in the United States. This flight is a visible marker of that progress.”
Advancing Flight Controller Development
The flight controller board engineered under the Hellbender agreement is now operating with Betaflight, an open-source flight control firmware. This milestone establishes an initial operating foundation for the Company’s controller hardware ahead of integration into upcoming prototype iterations.
The airframe flight and controller development represent separate stages of the program. Further integration and flight testing will be required to evaluate the combined system and support its progression toward production readiness.
“We are proving each piece independently and then bringing them together, which is how you get to a reliable, producible vehicle rather than a one-off,” said Jordan Low, Co-Founder, President and Chief Operating Officer of First Breach. “The airframe has flown untethered. Our flight controller is running Betaflight. The next step is putting them in the same aircraft and testing them together as we work toward integrating energetics and manufacturing at scale.”
Building Toward Domestic Production
First Breach continues to target completion of its initial prototypes in the fourth quarter of 2026 and the start of production scaling in the second quarter of 2027. As manufacturing operations expand, the Company is targeting production capacity of more than 2,500 drones per week. The timing and pace of that expansion remain subject to development, testing, and manufacturing readiness.
Under the strategic agreement, First Breach owns the drone platforms and their associated intellectual property and will control manufacturing and commercialization. Hellbender provides engineering, design, technical support, and component manufacturing.
“First Breach set out to own its platform, and our work together is helping turn that vision into reality,” said Brett Phillips, Chief Revenue Officer of Hellbender. “Both the airframe and flight controller are built to be manufactured domestically and at volume. That is exactly the kind of program our engineering and manufacturing model was designed to support, helping First Breach move from development toward scaled U.S. production.”
Prototype specifications
Proof-of-concept build; subject to change ahead of production.
The current prototype is a four-rotor Class 1 platform with an all-up weight of approximately 2.2 kg and a payload capacity of roughly 500 g, supported by a Picatinny rail and electrical interface. It has demonstrated an effective range of 2 km, an endurance of approximately 10 minutes, a cruise speed of 50 km/h, and a maximum speed of 120 km/h.
Navigation is GNSS with visual-inertial augmentation, and the control link is 900 MHz MAVLink. The platform uses swappable LiPo batteries and is designed for field assembly in under ten minutes.
About First Breach
First Breach Inc. is an ISO 9001:2015 certified, American-made defense technologies company focused on manufacturing match-grade ammunition components, finished ammunition, and developing next-generation unmanned aerial systems for commercial, law enforcement, and military markets. The Company manufactures its products in-house at its Hagerstown, Maryland facility, where it produces brass cups, casings, projectiles, lead cores, lead wire, and completed ammunition with rigorous quality control standards. First Breach is also advancing its drone strategy through the development of U.S.-made unmanned systems, leveraging advanced engineering, robotics, ISR and sensor technologies, and precision manufacturing capabilities to address evolving defense, homeland security, law enforcement, and commercial requirements across domestic and international markets.
For more information, please visit: First Breach
About Hellbender
Hellbender, Inc. is a Pittsburgh-based engineering and advanced manufacturing company specializing in physical AI, computer vision, drones, robotics, electronics design, and automated manufacturing. Operating from approximately 90,000 square feet of facilities, the company provides integrated product development capabilities spanning engineering, prototyping, printed circuit board assembly, advanced sensor integration, robotic manufacturing, and production testing. More than 25% of Hellbender’s workforce consists of military veterans, supporting its commitment to American manufacturing and technical innovation. For more information, please visit: Hellbender
This press release contains forward-looking statements within the meaning of the Private Securities Litigation Reform Act of 1995. Forward-looking statements are not historical facts and include statements regarding the Company’s expectations, beliefs, plans, objectives, strategies, future events, future performance, business prospects, growth initiatives, acquisitions, market opportunities, capital resources, operational objectives, and other statements that are predictive in nature. Forward-looking statements may be identified by the use of words such as “anticipate,” “believe,” “continue,” “could,” “estimate,” “expect,” “forecast,” “intend,” “may,” “plan,” “potential,” “predict,” “project,” “seek,” “should,” “target,” “will,” “would,” and similar expressions, although not all forward-looking statements contain these identifying words.
Forward-looking statements are based on management’s current expectations, assumptions, and beliefs regarding future developments and their potential effect on the Company. These statements are not guarantees of future performance and involve known and unknown risks, uncertainties, assumptions, and other factors that may cause actual results, performance, or achievements to differ materially from those expressed or implied by such forward-looking statements.
Factors that could cause actual results to differ materially from those expressed or implied by forward-looking statements include, but are not limited to, changes in economic, business, market, competitive, regulatory, technological, legal, and geopolitical conditions; the Company’s ability to execute its business strategy; the successful integration of acquisitions and strategic transactions; access to capital and financing; customer demand; industry developments; and other risks and uncertainties described from time to time in the Company’s filings with the U.S. Securities and Exchange Commission, which are available for review at www.sec.gov.
Readers are cautioned not to place undue reliance on forward-looking statements, which speak only as of the date they are made. Except as required by applicable law, the Company undertakes no obligation to update, revise, or publicly disclose any revisions to any forward-looking statements to reflect events, circumstances, or changes in expectations occurring after the date of this press release.
For additional company updates, follow First Breach on LinkedIn, X, and Facebook.
HAGERSTOWN, Md / ACCESS Newswire / August 25, 2026 – First Breach Inc. (NASDAQ:FBDT) (“First Breach” or the “Company”), an American-made defense technologies company focused on
vertically integrated ammunition production and next-generation unmanned aerial systems, today announced the successful completion of the first untethered flight of its proprietary drone prototype. The Company also reported progress on its proprietary flight controller, developed under its strategic agreement with Hellbender, Inc., as it works toward completing initial prototypes in the fourth quarter of 2026. Building on the first flight announced on August 25, 2026, the latest milestone demonstrated operation of the prototype’s airframe, propulsion, and core vehicle systems in free flight without a physical tether. The aircraft flew using commercial flight electronics while development of the Company’s proprietary controller proceeded in parallel. Integrating that controller into the aircraft for further testing is the next development step.
“Untethered flight is the point where a drone stops being a test article and starts being a vehicle,” said Jeffrey Low, Co-Founder and Chief Executive Officer of First Breach. “Every step we take on this program is a step toward owning the full stack, meaning the airframe, the electronics, and the manufacturing, here in the United States. This flight is a visible marker of that progress.”
Advancing Flight Controller Development
The flight controller board engineered under the Hellbender agreement is now operating with Betaflight, an open-source flight control firmware. This milestone establishes an initial operating foundation for the Company’s controller hardware ahead of integration into upcoming prototype iterations.
The airframe flight and controller development represent separate stages of the program. Further integration and flight testing will be required to evaluate the combined system and support its progression toward production readiness.
“We are proving each piece independently and then bringing them together, which is how you get to a reliable, producible vehicle rather than a one-off,” said Jordan Low, Co-Founder, President and Chief Operating Officer of First Breach. “The airframe has flown untethered. Our flight controller is running Betaflight. The next step is putting them in the same aircraft and testing them together as we work toward integrating energetics and manufacturing at scale.”
Building Toward Domestic Production
First Breach continues to target completion of its initial prototypes in the fourth quarter of 2026 and the start of production scaling in the second quarter of 2027. As manufacturing operations expand, the Company is targeting production capacity of more than 2,500 drones per week. The timing and pace of that expansion remain subject to development, testing, and manufacturing readiness.
Under the strategic agreement, First Breach owns the drone platforms and their associated intellectual property and will control manufacturing and commercialization. Hellbender provides engineering, design, technical support, and component manufacturing.
“First Breach set out to own its platform, and our work together is helping turn that vision into reality,”said Brett Phillips, Chief Revenue Officer of Hellbender. “Both the airframe and flight controller are built to be manufactured domestically and at volume. That is exactly the kind of program our engineering and manufacturing model was designed to support, helping First Breach move from development toward scaled U.S. production.”
Prototype specifications
Proof-of-concept build; subject to change ahead of production.
The current prototype is a four-rotor Class 1 platform with an all-up weight of approximately 2.2 kg and a payload capacity of roughly 500 g, supported by a Picatinny rail and electrical interface. It has demonstrated an effective range of 2 km, an endurance of approximately 10 minutes, a cruise speed of 50 km/h, and a maximum speed of 120 km/h.
Navigation is GNSS with visual-inertial augmentation, and the control link is 900 MHz MAVLink. The platform uses swappable LiPo batteries and is designed for field assembly in under ten minutes.
About First Breach
First Breach Inc. is an ISO 9001:2015 certified, American-made defense technologies company focused on manufacturing match-grade ammunition components, finished ammunition, and developing next-generation unmanned aerial systems for commercial, law enforcement, and military markets. The Company manufactures its products in-house at its Hagerstown, Maryland facility, where it produces brass cups, casings, projectiles, lead cores, lead wire, and completed ammunition with rigorous quality control standards. First Breach is also advancing its drone strategy through the development of U.S.-made unmanned systems, leveraging advanced engineering, robotics, ISR and sensor technologies, and precision manufacturing capabilities to address evolving defense, homeland security, law enforcement, and commercial requirements across domestic and international markets.
For more information, please visit: First Breach
About Hellbender
Hellbender, Inc. is a Pittsburgh-based engineering and advanced manufacturing company specializing in physical AI, computer vision, drones, robotics, electronics design, and automated manufacturing. Operating from approximately 90,000 square feet of facilities, the company provides integrated product development capabilities spanning engineering, prototyping, printed circuit board assembly, advanced sensor integration, robotic manufacturing, and production testing. More than 25% of Hellbender’s workforce consists of military veterans, supporting its commitment to American manufacturing and technical innovation. For more information, please visit: Hellbender
This press release contains forward-looking statements within the meaning of the Private Securities Litigation Reform Act of 1995. Forward-looking statements are not historical facts and include statements regarding the Company’s expectations, beliefs, plans, objectives, strategies, future events, future performance, business prospects, growth initiatives, acquisitions, market opportunities, capital resources, operational objectives, and other statements that are predictive in nature. Forward-looking statements may be identified by the use of words such as “anticipate,” “believe,” “continue,” “could,” “estimate,” “expect,” “forecast,” “intend,” “may,” “plan,” “potential,” “predict,” “project,” “seek,” “should,” “target,” “will,” “would,” and similar expressions, although not all forward-looking statements contain these identifying words.
Forward-looking statements are based on management’s current expectations, assumptions, and beliefs regarding future developments and their potential effect on the Company. These statements are not guarantees of future performance and involve known and unknown risks, uncertainties, assumptions, and other factors that may cause actual results, performance, or achievements to differ materially from those expressed or implied by such forward-looking statements.
Factors that could cause actual results to differ materially from those expressed or implied by forward-looking statements include, but are not limited to, changes in economic, business, market, competitive, regulatory, technological, legal, and geopolitical conditions; the Company’s ability to execute its business strategy; the successful integration of acquisitions and strategic transactions; access to capital and financing; customer demand; industry developments; and other risks and uncertainties described from time to time in the Company’s filings with the U.S. Securities and Exchange Commission, which are available for review at www.sec.gov.
Readers are cautioned not to place undue reliance on forward-looking statements, which speak only as of the date they are made. Except as required by applicable law, the Company undertakes no obligation to update, revise, or publicly disclose any revisions to any forward-looking statements to reflect events, circumstances, or changes in expectations occurring after the date of this press release.
Denver, Colorado–(Newsfile Corp. – September 21, 2026) – Elemental Royalty Corporation (NASDAQ: ELE) (TSX: ELE) (“Elemental” or the “Company“) is pleased to announce that it has entered into agreements which, together, are expected to materially increase the scale and cash-generative capacity of the Company’s royalty portfolio, simplify its corporate structure and reduce its ongoing cost base:
Acquisition of Stream and Royalty Portfolio: Elemental has entered into definitive agreements with funds managed by Orion Mine Finance Management LP (collectively, “Orion”) to acquire a high-quality portfolio of precious metals assets consisting of five streams and royalties for total consideration of US$290 million, with US$200 million in cash and US$90 million in equity (the “Acquisition“). The portfolio is expected to be immediately accretive to NAV per share, materially accretive to revenue per share, increases the Company’s precious metals weighting and adds material exposure in North America.
Strategic Divestment and Simplification: in conjunction with the portfolio Acquisition, Elemental announces that it has entered into a non-binding agreement with Carlin East Inc., (“Carlin East“), wherein Carlin East will acquire Elemental’s Generation Business (“Generation Business“), comprising wholly-owned exploration projects and will take on management and shared ownership of the Company’s Option Agreements and selected early stage exploration royalties related to the Generation Business (the “StrategicDivestment“). As consideration for the transaction, Elemental will acquire a cornerstone equity stake in Carlin East, and CEO and Director, David M. Cole, has resigned effective immediately to take up a leadership position at Carlin East. Current COO, President, and Founder of Elemental, Frederick Bell, has been appointed to the role of CEO and Director on the Board.
Highlights
Immediately accretive stream and royalty portfolio acquisition materially increases Elemental’s revenue, scale and exposure to high-quality producing precious metals assets, further adding to the Company’s growth profile
Enhances portfolio quality and diversification, Ruby Hill and Kouroussa will rank in the top five and top ten assets respectively in Elemental’s portfolio, and increase the Company’s exposure to Tier 1 jurisdictions
Strategic Divestment of Generation Business allows Elemental to retain the existing portfolio of over 100 early-stage royalties accumulated over more than a decade and to participate as the largest shareholder in future royalty generation through ownership of Carlin East
Reduction in Elemental G&A by over 25% with additional savings expected and streamlined company structure
Management realignment to reflect this transition, with Frederick Bell, current COO and President, taking on the role of CEO and Director, as David M. Cole steps down to run Carlin East
Elemental Chairman, Juan Sartori, commented: “Together, these transactions mark important milestones in a defining year of growth for Elemental. Over the past twelve months we have exponentially increased the scale of the business, strengthened the quality of our portfolio through high-quality transactions including the combination with EMX, acquisition of Vizsla Royalties, and the Orion portfolio announced today. With these simultaneous transactions we create a larger, simpler and more focused royalty company while retaining the upside directly and indirectly from the Company’s Generation Business. We will continue to deliver on our ambition of building a leading global royalty and streaming company with a dedicated growth trajectory.”
Outgoing Elemental Chief Executive Officer, and current Executive Chairman of Carlin East, David M. Cole, commented: “An economic geologist at heart, I have worked throughout my career to create and deliver shareholder exposure to the fundamental value and optionality of mineral rights. With Carlin East’s acquisition of the project generation arm, we will look to continue providing long-term compound growth as well as delivering value to our shareholders, which will include Elemental going forward.
I am immensely proud of what we have built together over the last year following Elemental’s merger with EMX. Our consolidation established a premium, mid-tier royalty company with a diverse portfolio of top tier royalties, and I look forward to seeing Fred take Elemental on to greater heights still.”
Incoming Elemental Chief Executive Officer, Frederick Bell, commented:“The royalty portfolio we are acquiring is the eighth transaction the company has announced in the past twelve months. It is accretive on both a NAV and revenue basis, aligns the company with proven management teams, further diversifies our revenue base through three producing assets as well as adding a new cornerstone silver stream to our pipeline with i-80’s Ruby Hill project in Nevada. The operators’ track record of successful execution makes them stand out and increases the value we see in their future ability to unlock the exploration optionality that exists across their projects.
In parallel with new royalty and stream acquisitions, we have continued to execute transactions across the royalty generation portfolio with twenty-five projects partnered in the last year, one of the busiest periods for the Company’s team, but one that largely falls under the radar as Elemental grows. We believe that by separating the Generation Business at this point we can realise value from within Elemental’s existing portfolio while simultaneously reducing the Company’s cost base, capital requirements and simplifying the corporate structure. A streamlined, simpler and increasingly cash-generative Elemental will emerge as the largest shareholder in a dedicated generation company led by a management team we know well.
Lastly, we are grateful to Dave Cole for his years of work and commitment helping the Company to reach this stage, and are pleased that he will remain a material shareholder moving forwards. Our focus remains firmly on execution, disciplined growth and converting the strength of our portfolio into enduring value for all our shareholders.”
Conference Call and Webcast Elemental will hold a conference call and webcast on Tuesday, September 22, 2026 at 11:00 a.m. Eastern Time (8 a.m. Pacific Time) to discuss these transactions.
The webcast registration can be accessed by visiting the Presentation and Events page on the Company’s website at: https://www.elementalroyalty.com/investors/presentation-events/. An archived version of the webcast will be available on the website for one year following the webcast.
Elemental has acquired a portfolio of streams and royalties from Orion, including a silver stream on i-80 Gold Corp’s Ruby Hill Complex, and a gold stream on Mansa Resources’ Kouroussa Mine which will rank in the top five and top ten assets respectively in Elemental’s portfolio. The Acquisition provides material and immediate uplift to the Company revenue base, with Kouroussa, La Negra, and Ruby Hill delivering cash flow from day one, further expanding and complementing Elemental’s unmatched growth profile, with anticipated catalysts advancing Snowy River and the Homestake District toward production.
Overview of Assets
Asset
Operator
Location
Commodity
Stage
Royalty/ Stream
Ruby Hill Complex and Granite Creek
i-80 Gold Corp.
Nevada, USA
Gold, Silver
Producing
50% silver stream
Kouroussa
Mansa Resources
Guinea
Gold
Producing
5% gold stream
La Negra
Silverco Mining
Mexico
Ag-Pb-Zn-Cu
Producing
2.5% GR royalty
Snowy River
Endura Mining
New Zealand
Gold
Near-term production
1% gold stream
Homestake District
Dakota Gold
South Dakota, USA
Gold, Silver
Development
1% NSR royalty
Updated Guidance Subject to completion of the Acquisition, the economic benefit of the three producing assets in the Orion Portfolio will accrue to Elemental from August 1, 2026. Reflecting the expected contribution from these assets, strong performance from the existing portfolio year to date and updated commodity-price assumptions, Elemental has updated its 2026 GEO sales guidance to 19,500 – 22,000 GEOs.
This increased guidance comprises an expected 18,000 – 20,500 GEOs from the existing Elemental portfolio, updated from 17,000 – 21,000 GEOs as at Q2 2026, and an incremental 1,500 GEOs expected from the Orion Portfolio for the period August 1, 2026, to December 31, 2026.
At assumed commodity prices of US$4,500 per ounce of gold and US$6.00 per pound of copper, Elemental expects 2026 revenue of US$89.8 – US$101.1 million.
The GEO and revenue guidance is presented on a gross basis. Under the Kouroussa stream, Elemental is required to make ongoing cash payments equal to 20% of the applicable gold price for each ounce delivered, which will be recorded as cost of sales.
Terms of the Acquisition & Timing The total consideration for the Acquisition payable to Orion upon close of the transaction comprises US$200 million in cash and US$90 million in the form of 4,289,053 Elemental shares, representing approximately 5.6% of issued and outstanding shares in the Company. The Acquisition is subject to customary closing conditions, including Toronto Stock Exchange approval to list the Elemental consideration shares and, with respect to the Snowy River stream, customary regulatory approval from the New Zealand government.
The Acquisition is expected to complete in Q4 2026 or, with respect only to the Snowy River stream, up to Q1 2027.
Upsized Credit Facility To fund the cash consideration for the Acquisition, Elemental has secured a commitment from National Bank of Canada to increase the committed amount available under the Company’s existing revolving credit facility from US$150 million to US$250 million. The existing US$50 million accordion feature will be retained, providing potential total capacity of US$300 million, subject to additional lender commitments and the satisfaction of customary conditions.
The amended Facility is expected to become effective on or prior to completion of the Acquisition.
STREAMING AND ROYALTY PORTFOLIO ASSETS
The acquisition introduces several meaningful cash-flowing and development stage assets to Elemental’s royalty portfolio:
Ruby Hill Complex and Granite Creek Elemental is entitled to receive 50% of silver production from select assets owned and operated by i-80 Gold Corp. (“i-80“), which, inter alia, include the Archimedes, and Mineral Point properties, (collectively, “Ruby Hill Complex“), and the Granite Creek property, at a purchase price equal to 20% of the spot silver price. The stream is currently delivering from i-80’s Archimedes property, with a step change in deliveries expected upon production commencing at Mineral Point, anticipated in 2031. Pursuant to the structure of the agreement, the stream steps down to 10% after delivery of 2.5 million ounces of silver (with 1.3 million ounces remaining) and has no further cap thereafter. Upon step-down, the Granite Creek property will be removed from the Elemental Area of interest (“AOI“).
The 100% owned Ruby Hill Complex and Granite Creek properties are located in northern Nevada, USA, a tier one mining jurisdiction. The properties are located along the prolific Getchell and Battle Mountain-Eureka gold trends, close to established mining infrastructure and major operations including Nevada Gold Mines’ Turquoise Ridge and Twin Creeks mines. Granite Creek includes an operating high-grade underground mine and a large open-pit development project, while the Ruby Hill Complex includes the Archimedes underground mine and the Mineral Point open-pit gold-silver development project. The stream includes the entire Ruby Hill complex, which covers ~14,272 acres, providing exposure to high-grade polymetallic exploration zones including Blackjack, Jackson, and Hilltop, among others.
i-80 is well-capitalised following a US$775 million financing package secured in March 2026, providing financial flexibility and capex requirements to fast-track development at Mineral Point, with an extensive drill programme already underway, designed to support an updated resource estimate and technical report for the property.
Kouroussa Elemental will receive 5% of gold production from the Kouroussa Gold Mine, operated by Mansa Resources (“Mansa“), at a purchase price equal to 20% of the prevailing gold spot price. Pursuant to the agreement, the stream steps down to 2.5% upon the later of either: November 2037, or on the total delivery of 39,800 ounces of gold under the stream. Once the stream steps down, there will be no associated cap. Mansa has a has a one-time buyback right exercisable before November 2028 to reduce the stream percentage in half by paying US$22,500,000 to Elemental.
The Kouroussa Gold Mine is located near the town of Kouroussa in eastern Guinea, approximately 440km east of Conakry, within the highly prospective Siguiri Basin. Kouroussa is a high-grade, producing open-pit gold mine and the flagship asset within Mansa’s portfolio. The operation is centred on the Koekoe deposit, with additional mineralisation identified across several nearby deposits and significant potential for further resource expansion.
Mansa is a private west African gold producer, formed through major shareholder, Nioko Resources Corporation’s take-private of Hummingbird Resources plc in March 2025. Mansa also own and operate the development-stage Dugbe project in Liberia, over which Elemental has a 2-2.5% NSR Royalty.
La Negra Elemental has acquired an uncapped 2.5% Gross Revenue Return (“GRR“) royalty over a total acreage of 829km2, encompassing the entirety of the La Negra underground polymetallic mine in Mexico, owned by Silverco Mining (TSXV: SICO) (“Silverco“).
The La Negra Mine is located in Querétaro State, central Mexico, approximately 150km by paved road from Querétaro City. Now 100% owned by Silverco Mining, La Negra is a producing underground silver-lead-zinc-copper mine with an operating history dating back to 1971. Operations were restarted in 2024, and Silverco is focused on increasing throughput at the mill to reach nameplate capacity of ~2,500tpd / ~900ktpa, and will look to update the resource and Mine Plan and expanding the mineralized system through exploration.
Silverco is a growing Mexico-focused silver producer, with a demonstrated history of success in building and leading mining companies across both board and management teams.
Snowy River Elemental is entitled to receive 1% of gold production from the construction-stage Snowy River Gold Project, being developed by operator Endura Mining (“Endura“). Pursuant to the agreement, the stream is effectively capped upon reaching 675koz of gold.
The Snowy River Gold Project is located near Reefton on the West Coast of New Zealand’s South Island, on the site of the historic Blackwater Mine. Fully permitted, Snowy River is a high-grade underground gold project and Endura’s flagship development asset. Underground development and processing plant construction are underway, with first gold targeted for December 2026, and annual production of 60+koz per year thereafter. The project is expected to re-establish large-scale gold production in the historic Reefton Goldfield and form the foundation of Endura’s broader growth strategy.
Endura is a privately owned mining company led by a team with proven track record of building and running gold companies with strong shareholder alignment. Endura Mining is well capitalised to complete construction, with strong support from major shareholders AustralianSuper and Orion Resource Partners.
Homestake District Elemental’s interest comprises two separate 1% Net Smelter Return (“NSR“) royalties over several properties in the Homestake District, South Dakota, USA, owned and operated by Dakota Gold Corp. (NYSE American: DC) (“Dakota Gold“). The properties include coverage over Dakota Gold’s flagship asset, Richmond Hill, a development-stage, large scale gold-silver open-pit heap-leach project, and numerous other mining claims throughout the Homestake District.
The Richmond Hill Gold Project is located near Lead, South Dakota, within the historic Homestake Mining District and 4km north of Coeur Mining’s producing Wharf Mine. The brownfield project is primarily located on previously mined private land, and benefits from existing infrastructure, with first production anticipated in 2029, with substantial potential for further resource expansion.
Dakota Gold is led by an experienced management and leadership team with strong local knowledge and proven track record with operational success at the Homestake and Wharf mines. The company is well capitalized for development through the completion of the feasibility study, anticipated in H1 2027.
The royalties provide district scale optionality and add further upside to Elemental’s unmatched growth profile.
STRATEGIC DIVESTMENT AND SIMPLIFICATION
Divestment of Project Generation Arm Concurrent to the portfolio Acquisition, Elemental announces that it has entered into a non-binding agreement with Carlin East, wherein Carlin East will acquire the Company’s Generation Business, while managing and sharing economic interests in a number of Option Agreements and 20 early-stage exploration royalties related to the Generation Business. Upon completion, the associated business infrastructure and certain members of the management and technical team currently working across Elemental’s project generation team, will join Carlin East.
Corporate Overview and Terms Pursuant to the agreement, Elemental will receive shares in Carlin East with a deemed value of US$8.5 million, expected to represent approximately 19.9% on a post-financing basis. Further to this, Elemental will, inter alia, retain 50% of all existing and future production royalties arising from transferred alliance agreements, transferred option agreements and transferred royalties; and receive 50% of certain royalty buyback proceeds. From 2027 to 2030, Carlin East retains the first US$1.5 million of annual cash portfolio payments, with Elemental receiving all cash payments above that threshold. From 2031 onwards, Carlin East will receive 100% of the portfolio payments. Generation costs between term-sheet signing and closing, and certain transfer taxes and duties, will be shared 50/50 between Elemental and Carlin East, subject to the definitive documentation surrounding the transaction.
Carlin East, which will remain a private entity, intends to complete an equity financing alongside the transaction.
Financial Upside to Elemental Elemental has now reached a size and scale where value proposition has evolved to reflect a focus on sourcing cash-generative royalties and streams; this divestment therefore improves operating leverage and increases free cash flow conversion.
As a result of the Strategic Divestment of the generation business, Elemental will reduce company headcount by over 50%, with the transfer of generation offices and personnel in North America, Fennoscandia, Serbia, Turkey, and North Africa. Pursuant to this, Elemental anticipates a reduction in annual cash expenses of approximately US$6 million, or approximately 25% of current projected annual cash expenditures, with further efficiencies expected over time.
Following completion of the transaction and Strategic Divestment, Elemental will have a more streamlined corporate structure, materially lower cost base, enhanced immediate and near-term revenue and a larger portfolio of producing royalties, while retaining meaningful exposure to long term optionality through the generation model and cornerstone equity investment in Carlin East.
Management Transition As part of the Strategic Divestment, David M. Cole has resigned as Chief Executive Officer and Director on the Board with immediate effect, in order to take on the full-time role of Executive Chair of Carlin East, where his extensive technical expertise, entrepreneurial track record, and knowledge of the generation portfolio will support the next stage of its development.
Frederick Bell has been appointed Chief Executive Officer of Elemental, and Director on the Board, having most recently served as President and Chief Operating Officer following the combination of Elemental and EMX. Frederick is a founder of Elemental and was previously Chief Executive Officer from 2017 until 2025.
Elemental Chairman, Juan Sartori, commented: “On behalf of the Board, I would like to thank Dave for his leadership and the contribution he has made to Elemental. Dave has helped shape the business we have today and it has been a pleasure to work with him over the past year. We are delighted that his experience and entrepreneurial approach will continue to benefit the Company through our cornerstone shareholding and shared interests in Carlin East, where the generation business will continue.
At the same time, we are very pleased to welcome Fred back to the role of CEO, a position he held from Elemental’s founding. Fred has played a central role in the Company’s development, with a track record of consistently identifying and executing accretive transactions and leading a step-change in Elemental’s scale, asset quality and market position. We have great confidence in Fred’s leadership and his ability to continue to add shareholder value by building on the strong foundations established.”
Conditions to Close & Timing Completion remains subject to, among other things, the negotiation and execution of definitive documentation between Elemental and Carlin East, completion of Carlin East’s concurrent financing and satisfaction of other customary conditions. Elemental will look to complete this divestment in October 2026, currently contemplated no later than October 31, 2026, subject to confirmation and extension by agreement.
Advisors McCarthy Tétrault LLP is acting as legal advisor to Elemental. Troutman Pepper Locke LLP is acting as U.S. legal counsel to Elemental.
National Bank of Canada Capital Markets is acting as financial advisor to Orion. Torys LLP is acting as legal advisor to Orion.
Davis Graham & Stubbs LLP is acting as legal advisor to Carlin East.
Qualified Person The scientific and technical information contained in this news release has been reviewed and approved by Michael Sheehan, an employee of the Company and a “Qualified Person” as defined in NI 43-101.
NASDAQ: ELE | TSX: ELE | ISIN: CA28620K1066 | CUSIP: 28620K1066
About Elemental Royalty Corporation Elemental is a mid-tier, gold-focused streaming and royalty company with a globally diversified portfolio of approximately 20 producing assets and more than 260 royalties, anchored by cornerstone assets and operated by world-class mining partners. The Company’s disciplined capital allocation and investment strategy combines immediate cash flow with significant embedded growth, providing a differentiated pathway to long-term value creation. Elemental benefits from a high-quality and diversified asset base, strong organic growth potential and sector-leading management expertise.
Elemental trades on Nasdaq and on the Toronto Stock Exchange under the ticker Symbol “ELE”.
This news release contains certain “forward-looking statements” and certain “forward-looking information” as defined under applicable United States and Canadian securities laws. Forward-looking statements and information can generally be identified by the use of forward-looking terminology such as “may”, “will”, “should”, “expect”, “intend”, “estimate”, “anticipate”, “believe”, “continue”, “plans” or similar terminology (including negative and grammatical variations thereof).
Forward-looking statements and information include, but are not limited to, statements regarding completion of the Acquisition and other transactions described in this news release, including any required approvals, and the timing thereof; future royalties and future consideration payments or issuances of shares, or other statements that are not statements of fact. Forward-looking statements and information are based on forecasts of future results, estimates of amounts not yet determinable and assumptions that, while believed by management to be reasonable, are inherently subject to significant business, economic and competitive uncertainties and contingencies.
References to nearby mines, deposits and projects are provided for geological and regional context only. Mineralization on nearby or adjacent properties is not necessarily indicative of mineralization on the properties in which Elemental holds, or has agreement to acquire, a royalty interest.
Forward-looking statements and information are subject to various known and unknown risks and uncertainties, many of which are beyond the ability of Elemental to control or predict, that may cause Elemental’s actual results, performance or achievements to be materially different from those expressed or implied thereby, and are developed based on assumptions about such risks, uncertainties and other factors set out herein, including but not limited to: the ability of the relevant parties to complete the Acquisition and the other transactions described in this news release; the receipt of approvals necessary for, and the satisfaction of other closing conditions to, the Acquisition; the impact of general business and economic conditions, the absence of control over the mining operations from which Elemental will receive royalties, risks related to international operations, government relations and environmental regulation, the inherent risks involved in the exploration and development of mineral properties; the uncertainties involved in interpreting exploration data; the potential for delays in exploration or development activities; the geology, grade and continuity of mineral deposits; the possibility that future exploration, development or mining results will not be consistent with Elemental’s expectations; accidents, equipment breakdowns, title matters, labour disputes or other unanticipated difficulties or interruptions in operations; fluctuating metal prices; unanticipated costs and expenses; uncertainties relating to the availability and costs of financing needed in the future; the inherent uncertainty of production and cost estimates and the potential for unexpected costs and expenses, commodity price fluctuations; currency fluctuations; regulatory restrictions, including environmental regulatory restrictions; liability, competition, loss of key employees and other related risks and uncertainties. For a discussion of important factors which could cause actual results to differ from forward-looking statements, refer to the annual information form of Elemental for the year ended December 31, 2025. Elemental undertakes no obligation to update forward-looking statements and information except as required by applicable law. Such forward-looking statements and information represent management’s best judgment based on information currently available. No forward-looking statement or information can be guaranteed, and actual future results may vary materially. Accordingly, readers are advised not to place undue reliance on forward-looking statements or information.
Neither The Nasdaq Stock Market LLC nor the Toronto Stock Exchange, nor its Regulation Services Provider (as that term is defined in the policies of the Toronto Stock Exchange), accepts responsibility for the adequacy or accuracy of this news release.
VANCOUVER, British Columbia, Sept. 21, 2026 (GLOBE NEWSWIRE) — Blue Jay Gold Corp. (TSXV: JAY) (OTCQB: JAYGF) (FSE: JAY) (“Blue Jay” or the “Company“), today reported results from the metallurgical test program on mineralization from the Becker-Cochran antimony occurrence at its Steller Gold Project (“Steller” or the “Project“) in southern Yukon. Our maiden test work at ALS Metallurgical Laboratories in Kamloops, British Columbia delivered a flowsheet design producing a 67% antimony (“Sb“) concentrate at a 94% recovery. Roughly 50 kg of the concentrate is now being converted into finished antimony products by three North American processing groups who are looking to secure access to long-term supply, with first products expected in the coming weeks. Our test does not end at the concentrate. It continues until the material exists as a finished antimony product.
The material was placed with three groups rather than one by design. Each uses different processing approaches as high-grade concentrate is compatible with more than one downstream route. Our approach affords Blue Jay the pathway best suited to our material and ours interests.
Highlights
67% antimony concentrate was produced at a 94% Sb recovery.
Concentrate grade well exceeds the 60% Sb premium product threshold. Pure stibnite is approximately 71.7% antimony, so 67% Sb approaches mineralogical purity.
Three North American antimony processing groups will convert the concentrate into a range of downstream metal products, each using different processing approaches. First results are expected in the coming weeks.
Test work was performed on material the Company collected and submitted, under documented chain of custody and modern quality assurance and quality controls.
Material will move from site to finished metal product within a single exploration season.
Drilling continues on high-grade gold targets with results expected to continue into 2027
“When we ran our due diligence after acquiring the Project, the antimony prospect was sitting in the historical record in plain sight, and nobody had touched it for sixty years,” said Geordie Mark, CEO of Blue Jay Gold. “Modern conventional processing comfortably outperformed what was achieved in the 1960s, but a flotation number is where most companies at our stage stop and then ask investors to imagine the rest. We are not doing that. The concentrate is now with three North American processing groups who will convert it into a range of finished antimony products, and we expect the first of those within weeks. That means this material will have gone from rock in the ground to finished metal inside a single exploration season. Linking the mine site to metal production is where value is created in critical minerals, and we saw no reason to wait years to find out whether this material can make that trip.”
“What we learn about the antimony also tells us something about the Project as a whole. One land package holds a past-producing gold mine, two further gold-silver deposits in different styles, and now produces a premium-grade antimony concentrate from a separate mineralized field whose footprint extends kilometres to the east. Those are different metals, deposited in different parts of the same system. To be clear, gold and silver are where our rigs and our budget are focused, and that has not changed by a single metre of drilling. But this is our maiden exploration year, and the point of a maiden year is to find out what you actually own. The antimony work was a small part of this year’s budget, and it has told us a great deal. It is another piece of evidence that Steller is a geological district rather than a single deposit.”
Table 1: Becker-Cochran Composite 1 (Concentrate): Cumulative Metal Balance
Cumulative
Cum. Weight
Assay – (%)
Recovery/Distribution (%)
Product
%
grams
Sb
Fe
S
Sb
Fe
S
Bulk Conc.: Product 1
24.0
481.8
66.9
0.5
27.5
93.9
12.0
89.2
Cleaner 2 Conc.
24.6
492.9
65.9
0.5
27.1
94.7
13.4
89.9
Cleaner 1 Conc.
25.9
519.3
63.2
0.6
26.0
95.6
17.9
90.9
Rougher Conc.
32.3
648.8
51.4
1.3
21.4
97.2
45.6
93.4
Rougher Tail
67.7
1358.7
0.7
0.7
0.7
2.8
54.4
6.6
Recalculated Feed
100.0
2007.5
17.1
0.92
7.4
100
100
100
Notes to Table 1: Products are reported cumulatively; each row includes all products above it. Weight % is the share of the original feed reporting to that product, Assay % is that product’s grade, and Recovery % is the share of the metal in the feed that it contains. Successive rows add lower-grade material, raising antimony recovery while diluting concentrate grade. The Company reports Product 1, 66.9% Sb at 93.9% recovery, as the representative result. Based on a single flotation test on a 2,007.5 g composite grading 17.1% Sb. Initial liberation analysis showed that stibnite and gangue minerals are excellent at 88% and 93% respectively. Mineral deportment studies have not been completed with Hg in concentrate aliquot up 1,100 ppm. Flotation optimization work is expected to commence shortly. No variability studies have been completed, and we note that the results are not necessarily representative of the occurrence as a whole.
Next Steps at Becker-Cochrane
First antimony metal products from the three processing groups are expected in the coming weeks. Assays remain pending from the ten-hole drill program at Becker-Cochran announced on August 31, 2026, which is testing the down-dip continuation of the mineralized shear zone below the historical workings. Should drilling confirm continuity at depth, the Company intends to advance to variability and locked cycle test work on drill core composites.
What Was Tested
The program was carried out on a composite of >400 kg of stibnite-bearing mineralization collected by Company personnel at a single trench at Becker-Cochran. The test sequence comprised head assays, mineralogical characterization, grind establishment, rougher and cleaner flotation, and final concentrate characterization.
The sample was collected from the surface expression of the stibnite-rich quartz vein systems that host mineralization in the underground workings at depth. These veins represent one on several east-west trending veins sets that occur on Becker, forming a trend extending west past the Goddell Gully Au deposit. Consequently, our work reflects only a small fraction of the system.
Reading the Result
Concentrate grade and recovery are most meaningful together, and in context with the flowsheet that produced them. Recovery measures how much of the antimony in the rock reports to the product. At 93.9%, almost none was lost to the tailings. Grade measures the quality of that product and determines what a processor will pay for it. Premium product specifications generally begin at 60% Sb, with value adjusted for other elements present and for processing factors. At 66.9% Sb, against a maximum possible 71.7% for pure stibnite, the concentrate is close to a pure mineral product. The flowsheet that produced it is conventional and uses standard reagents. Work at this stage does not constitute an offtake arrangement, or any type of commercial negotiation.
Why the Historical Work Needed to be Revisited
Bulk sampling and flotation testing were carried out on this occurrence in 1965. An approximately 8-ton sample was split between the federal Mineral Processing Division in Ottawa and Britton Laboratories Limited in Vancouver. The Ottawa work reported recovery of 92.8% of the contained antimony, and concentrates exceeding 62% antimony were produced. Underground development stopped shortly afterward when the antimony price fell.1
Those results are historical in nature. They were produced sixty years ago, to procedures and quality controls that cannot be verified today, on material the Company did not collect. A Qualified Person has not done sufficient work to verify them, the Company is not treating them as current, and they should not be relied upon. They were, however, sufficient reason to test the material again to a modern standard.
(1) Further detail regarding the Becker-Cochran occurrence, including its discovery, historical exploration, development and sampling, and regarding the Steller Gold Project and its current Mineral Resource Estimate, is set out in the technical report entitled “Technical Report and Updated Mineral Resource Estimate of the Steller Gold Project, Whitehorse Mining District, Yukon Territory, Canada,” prepared for the Company by P&E Mining Consultants Inc. with an effective date of October 31, 2025, available under the Company’s profile on SEDAR+ at www.sedarplus.ca. The historical metallurgical results quoted above are drawn from reports prepared for or on behalf of Yukon Antimony Corporation Ltd. between 1964 and 1966, including the concentration report of the Mineral Processing Division, Department of Mines and Technical Surveys, dated July 6, 1965. https://data.geology.gov.yk.ca/assessment-report/202 https://data.geology.gov.yk.ca/mineral-occurrence/12812https://data.geology.gov.yk.ca/assessment-report/3639
A District, Not a Single Deposit
The Steller Gold Project covers approximately 170 square kilometres and is accessible year-round by an 84-kilometre road from Whitehorse. It hosts the past-producing Mt. Skukum gold mine, the Skukum Creek and Goddell Gully gold-silver deposits, a 270 tonne per day process plant, and kilometres of underground development. Becker-Cochran lies within an antimony anomaly approximately 8 kilometres wide on the eastern side of the property.
The gold, silver and antimony mineralization across the property is interpreted to have formed during the same period of Eocene magmatic-epithermal activity, at different levels and temperatures within one extensive system. That interpretation is the basis for the Company’s view that Steller can host several deposits of different styles carrying different metals. Antimony mineralization at Becker-Cochran forms no part of the current Mineral Resource Estimate, and the Company’s 2026 program remains directed at the gold and silver resources at Skukum Creek and Mt. Skukum.
Metallurgical Test Work and Antimony Concentrate Results
Bench-scale flotation tests were completed at ALS Metallurgy Kamloops with the >400 kg sample provided from the Becker-Cochran antimony occurrence located in the Yukon Territory, Canada. The material was selected from an east-southeast trending stibnite-bearing quartz vein that is interpreted to reflect the vein exposed in underground workings accessed from multiple adits immediate below.
With a primary grind sizing near 140µm K80 and using lead nitrate as the stibnite activator and SIPX as the stibnite collector, excellent metallurgical performance was achieved with 95% antimony recovery to a stibnite concentrate which measured close to 66% antimony using rougher flotation followed by regrinding and two cleaner stages. This led to a final stage antimony concentrate grading 66.9% Sb. Antimony recovery to the final cleaner concentrate was 93.9%. These results are based on laboratory-scale rougher-cleaner testing and are preliminary in nature; they do not represent a feasibility-level process design or a commercial product specification.
Quality Assurance / Quality Control
The bulk sample used in this program were selected and prepared under the supervision of Freeman Smith. The ALS laboratory maintained its own internal QA/QC procedures to deliver these initial outcomes. QA/QC results were reviewed by Freeman Smith, and no material issues were identified that would affect the interpretation of the reported results.
Qualified Person
The scientific and technical content of this news release has been reviewed and approved by Freeman Smith, P.Geo., VP Exploration of Blue Jay Gold Corp., who is a Qualified Person as defined by National Instrument 43-101 – Standards of Disclosure for Mineral Projects.
About Blue Jay Gold Corp.
Blue Jay Gold Corp. is a Canadian gold exploration company focused on growing and discovering resources within established gold producing regions in Canada. The Company’s flagship asset is the 100%-owned Steller Gold Project in southern Yukon, an infrastructure-supported, past-producing mine with significant exploration upside and clear near-term catalysts. Blue Jay has also built a portfolio of projects in Ontario. With strategically located assets and a leadership team experienced in geology and capital markets, Blue Jay will advance disciplined, modern exploration programs focused on target definition, resource growth, and new discoveries in known gold-mineralized regions. For more information, please visit: www.bluejaygoldcorp.com.
Eric Negraeff Investor Relations Blue Jay Gold Corp. eric@bluejaygoldcorp.com Phone: (604) 235-4059
Cautionary Note Regarding Forward-Looking Statements Certain statements in this press release contain forward-looking information. Forward-looking information involves risks, uncertainties and other factors that could cause actual results to differ materially from those expressed or implied by such forward-looking information. In addition, the forward-looking statements require management to make assumptions and are subject to inherent risks and uncertainties. There is significant risk that the forward-looking statements will not prove to be accurate, that the management’s assumptions may not be correct and that actual results may differ materially from such forward-looking statements. These statements can be identified by the use of forward-looking terminology (e.g., “expect”,” estimates”, “intends”, “anticipates”, “believes”, “plans”). Forward-looking statements contained in this press release may include, but are not limited to, the results of drilling at the Becker-Cochran occurrence, the timing and scope of the rest of the Company’s exploration program, and future business plans of the Company. Such information involves known and unknown risks, including the receipt of regulatory approval, the results of future financing and exploration activities, the interpretation of exploration results and other geological data, or unanticipated costs and expenses and other risks identified by Blue Jay in its public securities filings that may cause actual events to differ materially from current expectations. Readers are cautioned not to place undue reliance on these forward-looking statements, which speak only as of the date of this press release. Except as required by applicable securities laws and regulation, Blue Jay disclaims any intention or obligation to update or revise any forward-looking statement, whether as a result of new information, future events or otherwise.
Sign up to Stay Up to Date on News and Progress from Page