Vancouver, British Columbia–(Newsfile Corp. – September 11, 2023) – EMX Royalty Corporation (NYSE American: EMX) (TSXV: EMX) (FSE: 6E9) (the “Company” or “EMX”) announces that pursuant to the Company’s Stock Option Plan, incentive stock options (the “Options“) to purchase an aggregate of 1,464,000 common shares, exercisable at a price of C$2.55 per share for a period of five years, has been granted to officers, directors, employees and consultants of the Company.
In addition, the Company has granted an aggregate of 562,000 restricted shares units (“RSU“) with a 3-year cliff vesting provision to officers, directors, and key employees, subject to any applicable stock exchange approvals and vesting requirements. Each RSU will entitle the holder to acquire, for nil cost, between zero and 1.5 common shares of the Company, subject to the achievement of performance conditions relating to the Company’s total shareholder return, and certain operational milestones.
About EMX. EMX is a precious, base and battery metals royalty company. EMX’s investors are provided with discovery, development, and commodity price optionality, while limiting exposure to risks inherent to operating companies. The Company’s common shares are listed on the NYSE American Exchange and the TSX Venture Exchange under the symbol EMX, and also trade on the Frankfurt exchange under the symbol “6E9”. Please see www.EMXroyalty.com for more information.
For further information contact:
David M. Cole President and Chief Executive Officer Phone: (303) 973-8585 Dave@EMXroyalty.com
Scott Close Director of Investor Relations Phone: (303) 973-8585 SClose@EMXroyalty.com
Neither the TSX Venture Exchange nor its Regulation Services Provider (as that term is defined in policies of the TSX Venture Exchange) accepts responsibility for the adequacy or accuracy of this release.
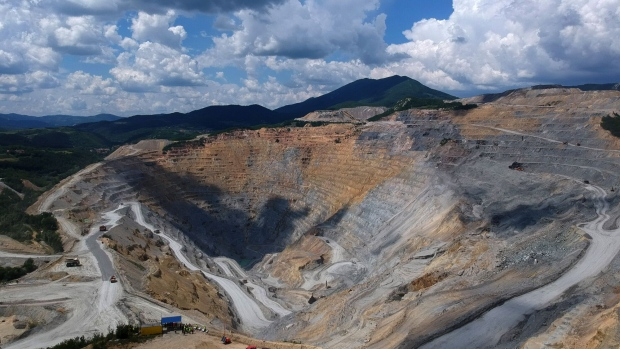
The excavated terrain of the Veliki Krivelj open pit copper mine, operated by Zijin Mining Group Co., in the Bor Region, Serbia. Photographer: Oliver Bunic/Bloomberg , Bloomberg
(Bloomberg) — China’s Zijin Mining Group Co. is developing plans to expand its copper mine in eastern Serbia due to demand for the metal considered vital to the global energy transition — an effort that could cost billions of dollars.
The company opened the Cukaru Peki copper and gold mine almost two years ago, with a $678 million investment allowing it to reach reserves a few hundred meters deep. Now it wants to drill down almost 2 kilometers (1.25 miles) to make the most of assets acquired in a takeover spree.
“These are vast reserves, which require additional infrastructure, additional investment of around $3.5 billion to $3.8 billion,” said Branko Rakocevic, the top Serbian official at the mine, whom the Chinese company authorized to speak with reporters.
Across the globe, companies and governments are racing to produce materials considered key to the shift toward a greener economy. Copper in particular is used in wind turbines, power grids and electric vehicles. China is the world’s top-supplier of so-called critical minerals, but the European Union and US are seeking to boost domestic supplies to ensure that they don’t fall further behind in the transition.
Read more: Why the Fight for ‘Critical Minerals’ Is Heating Up: QuickTake
Serbia, a candidate for EU membership, has embraced foreign investors including China as it looks to revitalize an ailing sector of its economy. Australia-based BHP Group, the world’s biggest mining company, is also looking more closely, signing an agreement earlier this year to explore for new copper deposits in the country.
Cukaru Peki is located in the town of Bor, where copper, gold and silver have been mined for over a century. The mine’s lower zone, at depths of more than 460 meters (1,508 feet), is believed to hold 2.2 million tons of copper, more than in the upper zone. Its gold content is thought to be lower at the deeper depths.
The upper zone may be exhausted of its deposits around 2034, while deeper operations could start in 7 to 10 years, according to Rakocevic. Zijin’s long-term plans for the site include building roads, and expanding power supply and flotation facilities, he said.
Zijin’s Expansion
Zijin bought Serbia’s sole copper and gold complex in 2018, when the government auctioned off the debt-laden business in an effort to save thousands of jobs in an impoverished mining region. Following a string of takeovers, the Chinese company developed full control of what is now Cukaru Peki.
The acquisition — and further investments to expand mines in Congo and Tibet — are helping to transform Zijin into one of the world’s largest copper miners, leapfrogging western producers like Rio Tinto, Anglo American and Antofagasta. By 2025, it expects to produce about 1.2 million tons of copper, a six-fold increase over levels seen in 2017.
Zijin now runs two units in Serbia. One produces copper cathodes, gold, silver and sulfuric acid at facilities co-owned with the government. The other, Serbia Zijin Mining — which operates the Cukaru Peki mine — exports copper concentrate to China, Canada, Bulgaria, Spain and Korea.
The companies have been among Serbia’s top exporters for the last two years, riding a wave of demand for metals. Benchmark copper futures soared earlier this year, though prices have cooled in recent months, largely over concerns about the health of China’s economy.
“Still, copper is in demand always and everywhere” which justifies the long-term investment, Rakocevic said. “The market is stable enough. Prices declined from last year, but we don’t expect much volatility.”
Vancouver, British Columbia–(Newsfile Corp. – September 6, 2023) – Ridgeline Minerals Corp. (TSXV: RDG) (OTCQB: RDGMF) (FSE: 0GC0) (“Ridgeline” or the “Company“) is pleased to announce the staking of an additional one hundred and forty-one (“141”) Bureau of Land Management (“BLM“) lode claims (2,913 acres) at the Big Blue project (“Big Blue” or “Project”) in Elko County, Nevada. Big Blue now comprises 502 contiguous lode claims totaling 10,168 acres or 41 square kilometers (“km”) (Figure 1), and is 100% owned by the Company with no underlying work commitments or royalty obligations. The property includes the past producing Delker Mine and Skarn Hill Adit, which collectively produced a reported 94,434 pounds of copper (“Cu”) at an average grade of 6.2% Cu between 1916-19171 (Figure 1). The Project has not seen a sustained exploration effort in decades and exhibits excellent potential to make new porphyry copper and Carbonate Replacement (“CRD”) style polymetallic discoveries.
The property expansion followed the Company’s recently announced acquisition of an extensive historical database for Big Bluesee (August 24, 2023 press release HERE), which has highlighted additional geophysical targets located to the northwest of the original claim block. This kilometer-scale target exhibits overlapping gravity and magnetic geophysics anomalies and is interpreted as a potential porphyry signature that may be the deeper source to the known Cu-skarn mineralization outcropping at the historical Delker Mine (Figure 2). As a result, Ridgeline staked all open and locatable claims surrounding the porphyry target and will continue advancing Big Blue towards a maiden drill program in 2024.
Chad Peters, President & CEO, commented, “Big Blue continues to be a rapidly evolving project in our exploration pipeline. Our team is very encouraged by the scale of the geophysical anomaly’s located on our new claim block, which suggests potential for a blind porphyry copper target at depth and distal CRD targets along strike. Until now, the Delker area has never been explored as a consolidated porphyry district and with this expansion we now control a target-rich land position with a robust geologic dataset to support our exploration model. We will continue to advance low-cost targeting and permitting initiatives through the remainder of this year while we prepare for a maiden drill campaign in 2024.”
Big Blue Project
Big Blue is located in Elko County, Nevada, approximately seventy-five kilometers (“km”) southeast of the city of Elko, NV. The Project includes the past producing Delker Mine, which produced a reported 94,434 pounds of copper at an average grade of 6.2% Cu between 1916-19171 and shares its southern boundary with Reyna Silver’s Medicine Springs Ag-Pb-Zn Carbonate Replacement (“CRD”) project. Mineralization occurs as outcropping, high-grade Cu occurrences located proximal to northeast trending felsic dikes that are interpreted as the zoned manifestations off a potential porphyry source, located in the northwest corner of the Big Blue property. Importantly, this target has never been drill-tested. The primary target at Big Blue is porphyry-skarn Cu ± Au-Ag mineralization, with potential to discover polymetallic, carbonate replacement deposit (CRD) style mineralization as the system zones outward over 6 kilometers of strike towards the Medicine Springs project. This target model is analogous to the Butte Valley porphyry Cu-Au system, which is inferred to be the source of CRD mineralization at the Company’s nearby Selena project. Big Blue is 100% owned by the Company and is comprised of a total of 41 square kilometers of highly prospective exploration ground that has seen limited exploration since the early 1900’s and will benefit from Ridgeline’s systematic approach to discovery (view Ridgeline’s Corporate Deck HERE).
Figure 1: Plan view map showing the location of the 141 new claims (shaded blue) staked by Ridgeline to increase claims by ~33% to 502 contiguous lode claims.
Figure 2: Plan view map on the left showing reduced to pole (“RTP”) airborne magnetics highlighting kilometer scale magnetic “highs” at both the Delker Mineand to the northwest on Ridgeline’s new claims. The map on the right shows Residual Gravity with a coincident high over proposed porphyry centers. Gravity also highlights a lower amplitude anomaly interpreted as a northeast trending structural corridor that trends southwest to the historical Golden Pipe mine (Ag-Pb-Zn) owned by Reyna Silver.
To view X-Section A-A’ showing magnetics anomaly beneath the Delker Mine, click HERE.
To view plan view maps showing Total Horizontal Gradient Magnetics and Residual gravity, click HERE.
QAQC Procedures
Samples are submitted to American Assay Laboratories (AAL) of Sparks, Nevada, which is a certified and accredited laboratory, independent of the Company. Samples are prepared using industry-standard prep methods and analysed using FA-PB30-ICP (Au; 30 g fire assay) and ICP-5AM48 (48 element Suite; 0.5 g 5-acid digestion/ICP-MS) methods. AAL also undertakes its own internal coarse and pulp duplicate analysis to ensure proper sample preparation and equipment calibration. Ridgeline’s QA/QC program includes regular insertion of CRM standards, duplicates, and blanks into the sample stream with a stringent review of all results completed by the Company’s Qualified Person, Michael T. Harp, Vice President, Exploration.
Technical information contained in this news release has been reviewed and approved by Michael T. Harp, CPG. the Company’s Vice President, Exploration, who is Ridgeline’s Qualified Person under National Instrument 43-101 and responsible for technical matters of this release.
About Ridgeline Minerals Corp.
Ridgeline is a discovery focused gold-silver explorer with a proven management team and a 204km² exploration portfolio across six projects in Nevada and Idaho, USA. More information about Ridgeline can be found at www.RidgelineMinerals.com.
On behalf of the Board “Chad Peters” President & CEO
Further Information: Chad Peters, P.Geo. President & CEO Ridgeline Minerals Corp. (775) 304-9773 | info@ridgelineminerals.com
Neither the TSX Venture Exchange nor its Regulation Service Provider (as that term is defined in the policies of the TSX Venture Exchange) accepts responsibility for the adequacy or accuracy of this press release.
Statements contained in this press release that are not historical facts are “forward-looking information” or “forward-looking statements” (collectively, “Forward-Looking Information”) within the meaning of applicable Canadian securities legislation and the United States Private Securities Litigation Reform Act of 1995. Forward-Looking Information includes, but is not limited to, the anticipated benefits of the Earn-In Agreement and the transaction contemplated thereby. The words “potential”, “anticipate”, “meaningful”, “discovery”, “forecast”, “believe”, “estimate”, “expect”, “may”, “will”, “project”, “plan”, “historical”, “historic” and similar expressions are intended to be among the statements that identify Forward-Looking Information. Forward-Looking Information involves known and unknown risks, uncertainties and other factors which may cause the actual results to be materially different from any future results expressed or implied by the Forward-Looking Information. In preparing the Forward-Looking Information in this news release, Ridgeline has applied several material assumptions, including, but not limited to, assumptions that TSX Venture Exchange approval will be granted in a timely manner subject only to standard conditions; the current objectives concerning the Project can be achieved and that its other corporate activities will proceed as expected; that general business and economic conditions will not change in a materially adverse manner; and that all requisite information will be available in a timely manner. Forward-Looking Information involves known and unknown risks, uncertainties and other factors which may cause the actual results, performance, or achievements of Ridgeline to be materially different from any future results, performance or achievements expressed or implied by the Forward-Looking Information. Such risks and other factors include, among others, risks related to dependence on key personnel; risks related to unforeseen delays; risks related to historical data that has not been verified by the Company; as well as those factors discussed in Ridgeline’s public disclosure record. Although Ridgeline has attempted to identify important factors that could affect Ridgeline and may cause actual actions, events, or results to differ materially from those described in Forward-Looking Information, there may be other factors that cause actions, events or results not to be as anticipated, estimated or intended. There can be no assurance that Forward-Looking Information will prove to be accurate, as actual results and future events could differ materially from those anticipated in such statements. Accordingly, readers should not place undue reliance on Forward-Looking Information. Except as required by law, Ridgeline does not assume any obligation to release publicly any revisions to Forward-Looking Information contained in this news release to reflect events or circumstances after the date hereof or to reflect the occurrence of unanticipated events.
Sources
1Delker Mine Historic Production (Page 57): Smith, R.M., 1976, Mineral resources of Elko County, Nevada: U.S. Geological Survey Open-File Report 76-56, 201 p.
Vancouver, British Columbia–(Newsfile Corp. – September 5, 2023) – EMX Royalty Corporation (NYSE American: EMX) (TSXV: EMX) (FSE: 6E9) (the “Company” or “EMX”) is pleased to announce the execution of an amended and restated royalty agreement on September 1, 2023 for its Timok royalty property with Zijin (Europe) International Mining Company Ltd., a wholly owned subsidiary of Zijin Mining Group Ltd (“Zijin”). EMX and Zijin have agreed that the Timok royalty will consist of a 0.3625% Net Smelter Return (“NSR”) royalty that is uncapped and cannot be repurchased or reduced. The royalty covers Zijin’s Brestovac exploration permit area (including the Cukaru Peki Mining licenses), as well as portions of Zijin’s Jasikovo-Durlan Potak exploration license north of the currently active Bor Mine (Figure 1).
EMX’s Timok royalty property is located in the Bor Mining District of Serbia and covers the Cukaru Peki copper-gold deposits which have recently been put into production by Zijin. Cukaru Peki represents one of the premier copper and gold discoveries in the world in the past 10 years and is a top tier royalty asset for EMX. The Cukaru Peki deposits consist of a high-level body of high-grade, epithermal-style copper-gold mineralization referred to as the “Upper Zone”, and a deeper body of porphyry-style copper-gold mineralization known as the “Lower Zone”.
Zijin is currently producing copper and gold from the Upper Zone deposit at Cukaru Peki, while concurrently developing the Lower Zone. The Cukaru Peki deposits and operations are summarized in Zijin’s annual reports and in various Zijin disclosures. An NI-43-101 technical report for the Timok royalty was filed by EMX on SEDAR on March 31, 2022.
As part of the execution of the revised royalty agreement, EMX will receive approximately US$6.68 million. This includes royalty payments of $1.59 million from July-December, 2021, royalty payments of $3.20 million from the calendar year 2022, and $1.89 million for the period of January-June, 2023. From that point forward EMX will continue to receive quarterly production royalty payments on an ongoing basis. EMX is appreciative of Zijin’s cooperative and amicable approach throughout the process of achieving this resolution and looks forward to working with Zijin as the projects advance.
Dr. Eric P. Jensen, CPG, a Qualified Person as defined by National Instrument 43-101 and employee of the Company, has reviewed, verified and approved the disclosure of the technical information contained in this news release.
About EMX. EMX is a precious, base and battery metals royalty company. EMX’s investors are provided with discovery, development, and commodity price optionality, while limiting exposure to risks inherent to operating companies. The Company’s common shares are listed on the NYSE American Exchange and the TSX Venture Exchange under the symbol EMX, and also trade on the Frankfurt exchange under the symbol “6E9”. Please see www.EMXroyalty.com for more information.
For further information contact:
David M. Cole President and Chief Executive Officer Phone: (303) 973-8585 Dave@emxroyalty.com
Scott Close Director of Investor Relations Phone: (303) 973-8585 SClose@emxroyalty.com
Neither the TSX Venture Exchange nor its Regulation Services Provider (as that term is defined in policies of the TSX Venture Exchange) accepts responsibility for the adequacy or accuracy of this release.
Forward-Looking Statements
This news release may contain “forward looking statements” that reflect the Company’s current expectations and projections about its future results. These forward-looking statements may include statements regarding perceived merit of properties, exploration results and budgets, mineral reserve and resource estimates, work programs, capital expenditures, timelines, strategic plans, market prices for precious and base metal, or other statements that are not statements of fact. When used in this news release, words such as “estimate,” “intend,” “expect,” “anticipate,” “will”, “believe”, “potential” and similar expressions are intended to identify forward-looking statements, which, by their very nature, are not guarantees of the Company’s future operational or financial performance, and are subject to risks and uncertainties and other factors that could cause the Company’s actual results, performance, prospects or opportunities to differ materially from those expressed in, or implied by, these forward-looking statements. These risks, uncertainties and factors may include, but are not limited to: unavailability of financing, failure to identify commercially viable mineral reserves, fluctuations in the market valuation for commodities, difficulties in obtaining required approvals for the development of a mineral project, increased regulatory compliance costs, expectations of project funding by joint venture partners and other factors.
Readers are cautioned not to place undue reliance on these forward-looking statements, which speak only as of the date of this news release or as of the date otherwise specifically indicated herein. Due to risks and uncertainties, including the risks and uncertainties identified in this news release, and other risk factors and forward-looking statements listed in the Company’s MD&A for the quarter ended June 30, 2023 (the “MD&A”), and the most recently filed Revised Annual Information Form (the “AIF”) for the year ended December 31, 2022, actual events may differ materially from current expectations. More information about the Company, including the MD&A, the AIF and financial statements of the Company, is available on SEDAR at www.sedar.com and on the SEC’s EDGAR website at www.sec.gov.
Figure 1. Locations of EMX royalty interests and key geological features in the Timok Magmatic Complex in the Bor Mining District of Serbia.
Vancouver, British Columbia–(Newsfile Corp. – August 14, 2023) – EMX Royalty Corporation (NYSE American: EMX) (TSXV: EMX) (FSE: 6E9) (the “Company” or “EMX”) is pleased to report results for the quarter ended June 30, 2023 (“Q2-2023”). The Company’s filings for the quarter are available on SEDAR at www.sedarplus.ca, on the U.S. Securities and Exchange Commission’s website at www.sec.gov, and on EMX’s website at www.EMXroyalty.com. Financial results were prepared in accordance with International Financial Reporting Standards, as issued by the International Accounting Standards Board. All dollar amounts in this news release are in USD unless otherwise noted.
HIGHLIGHTS
Financial Updates for the Three Months Ended June 30, 2023
Revenue and other income for the three months ended June 30, 2023 was $3,408,000 compared to $7,034,000 for the three months ended June 30, 2022 (“Q2-2022”). Adjusted revenue and other income1 of $6,481,000 (Q2-2022 – $9,465,000) included $3,073,000 (Q2-2022 – $2,431,000) in revenue for the Company’s share of royalty revenue from the Caserones Mine (effective) royalty interest in Chile. Revenue and other income and adjusted revenue and other income1 for Q2-2022 included the accrual of a $4,000,000 milestone payment related to Gediktepe.
Net loss for the three months ended June 30, 2023 was $4,722,000 (Q2-2022 – $3,315,000).
Cash used in operating activities for the three months ended June 30, 2023 was $1,160,000 (Q2-2022 – $4,152,000). Adjusted cash1 provided by operating activities for the three months ended June 30, 2023 was $1,294,000 (Q2-2022 – adjusted cash used in operating activities of $3,254,000). Operating cash flows for Q2-2023 include an accelerated $2,500,000 option payment by Aftermath Silver for the Berenguela property.
As at June 30, 2023, EMX had cash of $9,980,000 (December 31, 2022 – $15,508,000), investments, long-term investments and loans receivable valued at $14,346,000 (December 31, 2022 – $14,561,000) and loans payable of $41,428,000 (December 31, 2022 – $40,489,000).
Corporate Updates
Timok Dispute Update
On January 27, 2022 the Company announced that it had suspended the filing of a Notice of Arbitration to Zijin Mining Group Ltd (“Zijin”) regarding its royalty agreement covering the Timok project in Serbia, which includes the producing Cukaru Peki copper and gold mine. This suspension followed EMX’s previous announcement of its intention to file the Notice of Arbitration to formally dispute the royalty rate as defined under the Royalty Agreement (see EMX news release dated December 17, 2021). Discussions with Zijin have since proved amicable and productive and continued through Q2 2023. Both companies are expecting to execute a modified royalty agreement in 2023.
Acquisition of Additional Royalty Interest on Caserones
During Q2 2023, EMX acquired an additional 2.263% ownership in the underlying Caserones royalty holder, Sociedad Legal Minera California Una de la Sierra Peña Negra (“SLM”), for cash consideration of $3,517,000 pursuant to agreements with existing shareholders of SLM. The acquisition provides EMX with a further 0.044% (effective) net smelter royalty (“NSR”) interest in the Caserones property, increasing the Company’s NSR royalty interest to 0.7775%.
Acquisition Agreement for New Royalties with Franco-Nevada
During Q2 2023, EMX executed a term sheet with Franco-Nevada Corporation (“Franco-Nevada”) (NYSE: FNV) (TSX: FNV) for the joint acquisition of newly created precious metals and copper royalties sourced by EMX (the “Agreement”). Franco-Nevada will contribute 55% (up to $5.5 million) and EMX will contribute 45% (up to $4.5 million) towards the royalty acquisitions, with the resulting royalty interests equally split (i.e., 50/50). The initial term of the Agreement is for three years, or until the maximum contributions totaling $10 million from both companies have been met, and may be extended if mutually agreed by both companies.
Royalty and Royalty Generation Updates
During Q2 2023, the Company’s royalty generation business was active in North America, South America, Europe, Turkey, Australia and Morocco. The Company spent $4,255,000 (Q2-2022 – $5,108,000) on royalty generation costs and recovered $1,811,000 (Q2-2022 – $2,014,000) from partners. Royalty generation costs include exploration related activities, technical services, project marketing, land and legal costs, as well as third party due diligence for acquisitions. Included in revenue and other income was $807,000 in option, advance royalty, and other pre-production payments related to existing partnered projects as a result of the royalty generating activities. During Q2 2023, the Company also completed two new partnerships across the portfolio while continuing to replace partnered properties with new royalty generation projects.
Producing Royalties
6
Advanced Royalties
11
Exploration Royalties
152
Royalty Generation Properties
105
Figure 1. EMX’s royalty and mineral property portfolio.
EMX earned over $1,175,000 in royalty revenue from the Gediktepe mine. Mine operator Lidya advised EMX that Oxide Zone gold production will increase during the summer months of 2023.
The Caserones (effective) royalty distribution for Q1 was received in Q2 and totaled approximately $2,454,000. Lundin Mining completed the acquisition of fifty-one percent (51%) of the issued and outstanding equity of MLCC, the Caserones mine operator, from JX Nippon (see Lundin news release dated June 13, 2023). In connection with the acquisition, Lundin filed a technical report on SEDAR titled “NI 43-101 Technical Report on the Caserones Mining Operation, Atacama Region, Chile” that included current mineral resource and reserve estimates in accordance with National Instrument 43-101 – Standards of Disclosure for Mineral Projects.
Leeville payments to EMX totaled approximately $664,000 from royalty production that totaled 338 ounces of gold. Q2 marked another strong quarter of Leeville royalty production along with robust gold prices.
EMX earned, and subsequently received in Q3-2023 Gold Bar South royalty revenue of $54,000 from Q1 production of 2,966 gold ounces and $80,000 from Q2 production of 3,984 gold ounces. The receipt of initial royalty revenue from Gold Bar South now establishes the operation as a paying royalty for EMX.
Arizona Sonoran Copper released results of the Parks-Sayler infill drill program in preparation for a PFS planned for 2024, which included enriched (secondary sulfide) copper intercepts from EMX’s royalty property. Arizona Sonoran also provided an update on metallurgical programs being conducted in preparation for the PFS, which included recoveries of ~80% after 160 days from Parks-Sayler enriched copper mineralization (secondary sulfide).
Exploration drilling by South32 at the Hermosa property’s Peake prospect returned mineralized intercepts covered by EMX’s Hardshell royalty property included the best copper intercept to date of 139 meters averaging 1.88% copper, 0.51% lead, 0.34% zinc, and 52 g/t silver (true width not reported).
In Canada, EMX programs advanced available properties in the portfolio as partners conducted summer field programs on EMX royalty properties. EMX received $45,000 in cash payments and $Nil in share equity payments during the quarter from partnered projects.
EMX’s Latin American royalty portfolio was advanced with work programs that included drilling and metallurgical test work conducted by AbraSilver at the Diablillos project’s JAC Zone silver-gold discovery. GR Silver Mining Ltd (“GR Silver”) reported on successful exploration step-out drilling at the San Marcial epithermal silver project. Aftermath Silver made an accelerated $2,500,000 option payment to EMX for the Berenguela polymetallic CRD project.
The Company’s U.S. royalty generation portfolio progressed with ongoing partner-funded work programs, as well by the expansion of properties through the staking of new claims and permitting at key projects. EMX currently has 43 projects in partnership with other companies in the western U.S.
In Northern Europe the Company continued to develop and advance its portfolio of projects, with summer field programs commencing on numerous properties in Q2. EMX has 37 projects in partnership with other companies in Northern Europe and partner funded drill programs were completed in Q2 by Mahvie Minerals AB, a private Swedish corporation, at the Mo-I-Rana royalty property in Norway, and by Bayrock Resources, a private Australian company, at EMX’s Vuostok battery metals royalty property in Northern Sweden.
Kendrick Resources PLC (LSE: KEN) announced drill results from EMX’s Espedalen royalty property in Norway, including an intercept of 11.60 meters averaging 2.85% nickel, 1.04% copper and 0.08% cobalt from 52.4 meters depth in drill hole ESP23-08 (see Kendrick news release dated May 4, 2023). This hole was drilled at the Stormyra prospect on the Espedalen license (true width not reported, but can be estimated at 70-80% according to published cross sections). Kendrick plans to expand its exploration programs at Espedalen in the second half of 2023.
The Company optioned the Yarrol gold-copper (+ Co-Mn) project and the Mt Steadman gold project to Many Peaks Gold (“MPG”) during Q2. The agreement provides EMX with cash payments, equity interests in MPG, and work commitments during a fifteen month option period. Upon exercise of the option, EMX will receive additional payments of cash and shares of MPG along with annual advance royalty payments, royalty interests and other consideration.
Royalty generation programs proceeded in the Balkans and in Morocco in Q2, where multiple exploration license applications have been filed by the Company. New target areas are being assessed for further acquisitions.
Investment Updates
As at June 30, 2023, the Company had marketable securities of $8,626,000 (December 31, 2022 – $9,966,000), and $4,688,000 (December 31, 2022 – $4,591,000) in private investments. The Company will continue to generate cash flow by selling certain of its investments when appropriate.
OUTLOOK
The 2023 year will continue to see revenue and other income coming from our cash flowing royalties, including Leeville and Gold Bar South in Nevada, Gediktepe and Balya in Turkey, potentially Timok in Serbia (pending conclusion of discussions with Zijin), and our effective royalty interest on Caserones in Chile. As in previous years, production royalties will continue to be complemented by option, advance royalty, and other pre-production payments from partnered projects across the global asset portfolio.
The Company will continue to strengthen its balance sheet over the course of the year by looking to retire portions of our long-term debt, continuing to evaluate equity markets, and the ongoing monetization of the Company’s marketable securities.
EMX is well positioned to identify and pursue new royalty and investment opportunities, while further filling a pipeline of royalty generation properties that provide opportunities for additional cash flow, as well as exploration, development, and production success.
Qualified Person. Michael P. Sheehan, CPG, a Qualified Person as defined by NI 43-101 and employee of the Company, has reviewed, verified, and approved the above technical disclosure on North America and Latin America. Eric P. Jensen, CPG, a Qualified Person as defined by NI 43-101 and employee of the Company, has reviewed, verified, and approved the above technical disclosure on Europe, Turkey, and Australia.
About EMX. EMX is a precious, base and battery metals royalty company. EMX’s investors are provided with discovery, development, and commodity price optionality, while limiting exposure to risks inherent to operating companies. The Company’s common shares are listed on the NYSE American Exchange and TSX Venture Exchange under the symbol “EMX”, and also trade on the Frankfurt exchange under the symbol “6E9”. Please see www.EMXroyalty.com for more information.
Neither the TSX Venture Exchange nor its Regulation Services Provider (as that term is defined in policies of the TSX Venture Exchange) accepts responsibility for the adequacy or accuracy of this release
Forward-Looking Statements This news release may contain “forward looking statements” that reflect the Company’s current expectations and projections about its future results. These forward-looking statements may include statements regarding perceived merit of properties, exploration results and budgets, mineral reserves and resource estimates, work programs, capital expenditures, timelines, strategic plans, market prices for precious and base metal, or other statements that are not statements of fact. When used in this news release, words such as “estimate,” “intend,” “expect,” “anticipate,” “will”, “believe”, “potential” and similar expressions are intended to identify forward-looking statements, which, by their very nature, are not guarantees of the Company’s future operational or financial performance, and are subject to risks and uncertainties and other factors that could cause the Company’s actual results, performance, prospects or opportunities to differ materially from those expressed in, or implied by, these forward-looking statements. These risks, uncertainties and factors may include, but are not limited to unavailability of financing, failure to identify commercially viable mineral reserves, fluctuations in the market valuation for commodities, difficulties in obtaining required approvals for the development of a mineral project, increased regulatory compliance costs, expectations of project funding by joint venture partners and other factors.
Readers are cautioned not to place undue reliance on these forward-looking statements, which speak only as of the date of this news release or as of the date otherwise specifically indicated herein. Due to risks and uncertainties, including the risks and uncertainties identified in this news release, and other risk factors and forward-looking statements listed in the Company’s MD&A for the year ended December 31, 2022 (the “MD&A”), and themost recently filed Annual Information Form (“AIF”) for the year ended December 31, 2022, actual events may differ materially from current expectations. More information about the Company, including the MD&A, the AIF and financial statements of the Company, is available on SEDAR at www.sedarplus.ca and on the SEC’s EDGAR website at www.sec.gov.
_________________________ 1 Adjusted revenue and other income and adjusted cash provided by (used in) operating activities are non-IFRS financial measures with no standardized meaning under IFRS and might not be comparable to similar financial measures disclosed by other issuers. Refer to the “Non-IFRS financial measures” section on page 26 of the Q2-2023 MD&A for more information on each non-IFRS financial measure.
Vancouver, British Columbia–(Newsfile Corp. – August 8, 2023) – EMX Royalty Corporation (TSXV: EMX) (NYSE American: EMX) (the “Company” or “EMX”) is pleased to announce the execution of an agreement (the “Agreement”) to add its Mjövattnet and Njuggträskliden nickel-copper-PGE-cobalt projects in Sweden (the “Swedish Projects”) to an existing arrangement with Kendrick Resources PLC (“Kendrick”), a current EMX partner. Mjövattnet and Njuggträskliden battery metals projects will follow the same schedule of work commitments, advance royalty payments and milestone payments as the Espedalen battery metals project in Norway, another EMX royalty property being advanced by Kendrick. EMX will retain a 3% NSR royalty on the Swedish Projects along with other considerations summarized below. Kendrick is a Scandinavian focused energy metal exploration and development company currently listed on the London Stock Exchange (“LSE”) under the trading symbol “KEN”. See Figure 1 for project locations.
Each of the Swedish Projects contain nickel-copper-cobalt-PGE (Ni-Cu-Co-PGE) sulfide deposits associated with mafic-ultramafic intrusive complexes in the Skellefteå region of north-central Sweden, and both contain historical mineral resources. The Skellefteå area is known for its mining culture and heritage and is home to multiple actives mines, processing facilities and Boliden AB’s Rönnskär smelting complex.
The addition of the Swedish Projects follows Kendrick’s recent announcement of compelling drill results from the Espedalen battery metals project in Norway, a key EMX royalty property. Kendrick recently announced drill reported but Espedalen, including 11.60 meters averaging 2.85% nickel, 1.04% copper and 0.08% cobalt from 52.4 meters depth in drill hole ESP23-08, drilled at the Stormyra prospect on the Espedalen license (true width not reported, but can be estimated at 70-80% according to published cross sections)1. Please see www.EMXroyalty.com for more information on these and other battery metal projects in EMX’s portfolio.
Commercial Terms Overview. In accordance with the Agreement, Kendrick will issue to EMX 15,000,000 options exercisable at a strike price of 1.3 pence (GBX) for 60 months. EMX currently holds an 8.8% equity stake in Kendrick, and the options will allow EMX to maintain its equity position for the foreseeable future. Additional provisions include:
A 3% NSR royalty in favor of EMX, 1% of which can be bought down by Kendrick by paying EMX $1,000,000 by the fifth anniversary of the agreement (leaving EMX with a minimum 2% NSR royalty).
Annual work commitments of 1,000 meters of drilling on each of the Swedish Projects.
Annual Advance Royalty Payments (“AAR’s”) on each of the Swedish Projects beginning at $30,000 in 2024 and escalating by $5,000 per year.
Overview of the Swedish Projects. Regional nickel exploration became a focus of the Swedish Geological Survey (“SGU”) and other state-run mining concerns in the 1970’s and early 1980’s, leading to the discoveries of the Mjövattnet and Njuggträskliden nickel-copper-cobalt-PGE deposits along what became known as the “Nickel Line” in north central Sweden. The Nickel Line is broadly coincident with a belt of similar aged volcanogenic massive sulfide (“VMS”) type deposits and orogenic gold deposits that comprise the greater Skellefteå Mining Region.
Mjövattnet Project. The translation of Mjövattnet is “mead water” in English, which was one of the first nickel sulfide discoveries made along the Nickel Line. Discovered in 1971, the Mjövattnet nickel sulfide deposit occurs along a structural corridor of similar mineralized bodies, including the Lappvattnet Brannorna, and Lappbacken zones to the southwest, each of which have drill defined zones of mineralization, with the latter two also lying within the EMX license (See Figure 2; note that Lappvattnet is currently held by a third party). Notes from the Swedish Geological Company (“NSG”) in 1987 state that Mjövattnet has only been partly explored and its depth potential remains unknown2. Likewise, several clusters of nickel sulfide bearing boulders lie to the northeast and southeast (the Frangsmyran, Holmsvattnet, Långbacken and Vallen occurrences), the bedrock sources of which have yet to be identified.
This combination of known, drilled defined nickel sulfide mineralization which remains open in multiple directions, and the upside potential in the vicinities of the clusters of mineralized boulders makes the Mjövattnet project particularly attractive for further exploration.
Njuggträskliden Project. This deposit was discovered in the early 1970’s via boulder tracing, which led to the identification of several mineralized outcrops. Multiple drill defined zones of nickel sulfide mineralization were delineated in the early 1980’s, many of which were recognized as being enriched in PGE’s, but only some of the collected drill core samples were analyzed for PGE’s.
The drill defined zones of mineralization at Njuggträskliden remain open at depth, and the NSG noted in their summary report that a 10 kilometer corridor of similar boulder clusters with nickel sulfide mineralization remains to be explored at Njuggträskliden (see Figure 3)3. These occurrences all lie within the EMX license and represent considerable upside exploration potential. Since being drilled by the NSG, a few smaller companies have conducted limited exploration in the area, including twinning of some of the historic holes and reanalyzing the historic drill core for PGE’s. However, little to no systematic exploration has taken place.
Recent exploration programs conducted by EMX have identified numerous new copper and nickel soil anomalies on the Njuggträskliden project. Some of these newly recognized anomalies coincide with clusters of mineralized glacially transported boulders, the source(s) of which have not yet been discovered.
Exploration Plans for 2023. Permitting for drill testing has already begun, and Kendrick expects to commence a maiden drill program at Mjövattnet in later 2023 or early 2024.
Comments on Nearby and Adjacent Properties. The mines and deposits discussed in this news release provide context for EMX’s Projects, which occur in a similar geologic setting, but this is not necessarily indicative that the Projects host similar quantities, grades or styles of mineralization.
Dr. Eric P. Jensen, CPG, a Qualified Person as defined by National Instrument 43-101 and employee of the Company, has reviewed, verified and approved the disclosure of the technical information contained in this news release.
About EMX. EMX is a precious, base and battery metals royalty company. EMX’s investors are provided with discovery, development, and commodity price optionality, while limiting exposure to risks inherent to operating companies. The Company’s common shares are listed on the NYSE American Exchange and the TSX Venture Exchange under the symbol “EMX”, and also trade on the Frankfurt Exchange under the symbol “6E9”. Please see www.EMXroyalty.com for more information.
For further information contact:
David M. Cole President and Chief Executive Officer Phone: (303) 973-8585 Dave@emxroyalty.com
Scott Close Director of Investor Relations Phone: (303) 973-8585 SClose@emxroyalty.com
Neither the TSX Venture Exchange nor its Regulation Services Provider (as that term is defined in policies of the TSX Venture Exchange) accepts responsibility for the adequacy or accuracy of this release.
Forward-Looking Statements
This news release may contain “forward-looking statements” that reflect the Company’s current expectations and projections about its future results. These forward-looking statements may include statements regarding perceived merit of properties, exploration results and budgets, mineral reserve and resource estimates, work programs, capital expenditures, timelines, strategic plans, market prices for precious and base metal, or other statements that are not statements of fact. When used in this news release, words such as “estimate,” “intend,” “expect,” “anticipate,” “will”, “believe”, “potential” and similar expressions are intended to identify forward-looking statements, which, by their very nature, are not guarantees of the Company’s future operational or financial performance, and are subject to risks and uncertainties and other factors that could cause the Company’s actual results, performance, prospects or opportunities to differ materially from those expressed in, or implied by, these forward-looking statements. These risks, uncertainties and factors may include, but are not limited to: unavailability of financing, failure to identify commercially viable mineral reserves, fluctuations in the market valuation for commodities, difficulties in obtaining required approvals for the development of a mineral project, increased regulatory compliance costs, expectations of project funding by joint venture partners and other factors.
Readers are cautioned not to place undue reliance on these forward-looking statements, which speak only as of the date of this news release or as of the date otherwise specifically indicated herein. Due to risks and uncertainties, including the risks and uncertainties identified in this news release, and other risk factors and forward-looking statements listed in the Company’s MD&A for the quarter ended March 31, 2023 (the “MD&A”), and the most recently filed Annual Information Form (“AIF”) for the year ended December 31, 2022, actual events may differ materially from current expectations. More information about the Company, including the MD&A, the AIF and financial statements of the Company, is available on SEDAR at www.sedarplus.ca and on the SEC’s EDGAR website at www.sec.gov.
1 See Kendrick Resources PLC News Release dated May 4, 2023: “Stormyra Second Batch Assay Results Maiden Diamond Drill Programme”. EMX has not performed sufficient work to verify the published assay results, and these data cannot be verified as being compliant with NI43-101 standards. However, EMX believes these results to be reliable and relevant. 2 Information from the Geological Survey of Sweden archives in Malå., Sweden. 3 Information from the Geological Survey of Sweden archives in Malå., Sweden., including report BRAP 81007, 1981, Nickelmineraliseringarna i Njuggtraskliden.
Vancouver, British Columbia–(Newsfile Corp. – August 1, 2023) – EMX Royalty Corporation (NYSE American: EMX) (TSXV: EMX) (FSE: 6E9) (the “Company” or “EMX”) is pleased to announce the execution of a binding term sheet with Franco-Nevada Corporation (“Franco-Nevada”) for the joint acquisition of newly created precious metals and copper royalties sourced by EMX (the “Agreement”). Franco-Nevada will contribute 55% (up to US$5.5 million) and EMX will contribute 45% (up to US$4.5 million) towards the royalty acquisitions, with the resulting royalty interests equally split (i.e. 50/50). The initial term is for three years from the signing date, or until the maximum contributions totaling US$10 million from both companies have been met, and may be extended if mutually agreed by both companies.
EMX and Franco-Nevada believe that royalty financing capital is sorely needed in an exploration sector where equity capital is difficult to source. The Agreement allows EMX to direct a large amount of capital towards the royalty generation aspect of its business model, and Franco-Nevada to participate in exploration stage royalty financing opportunities identified by EMX. Franco-Nevada is already an EMX shareholder (6.1% fully diluted), having made a $10 million private placement to facilitate the Company’s purchase of additional royalty interests in the Caserones copper (molybdenum) mine in Chile last year (see EMX news release dated April 14, 2022). In parallel with EMX’s royalty acquisition, Franco-Nevada also purchased a royalty interest in Caserones.
Commercial Terms Overview. Pursuant to the terms of the Agreement dated June 27, 2023, EMX will source newly created precious metals royalties (“Precious Metals Royalties”) and/or copper royalties (“Copper Royalties”, and together with Precious Metals Royalties, “Royalties” and each a “Royalty”) exclusively for the benefit of EMX and Franco-Nevada (jointly the “Parties”). The Royalties will be for all minerals from mining projects having primary economic metal(s) that are precious metals or copper, but the Agreement will not apply to the purchase of existing third-party royalty interests or exploration lands.
The material Agreement terms are (all dollar amounts are in U.S. dollars (USD)):
Franco-Nevada will contribute 55% and EMX will contribute 45% of the purchase price of all Royalties, with such Royalties being equally split (i.e. 50/50) between each Party. Franco-Nevada will commit up to $5.5 million and EMX will commit up to $4.5 million for the acquisition of Royalties, totaling $10 million from both Parties (the “Capital Commitment”).
To illustrate the above, for a new 1% Royalty with a $1 million dollar purchase price, Franco-Nevada would contribute $550 thousand and EMX would contribute $450 thousand, with each Party receiving a 0.5% Royalty.
EMX will be responsible for managing all Royalty transaction sourcing, asset analysis, due diligence review, contract negotiations and other related activities in connection with the acquisition of Royalties.
The Agreement will expire upon the earlier of: (i) the contribution of the full Capital Commitment; or (ii) the date that is three years after the execution of the Agreement (the “Initial Term”), subject to extension upon mutual agreement of the Parties.
Discussion. The Agreement with Franco-Nevada is expected to accelerate the growth of the Company’s royalty portfolio by allowing EMX to direct a larger amount of capital towards new royalty acquisitions through exploration royalty financing or other entrepreneurial means. EMX’s assets currently include over 250 exploration and early stage royalty generation projects, in addition to six producing and eleven advanced royalty properties. The Company has active programs and important assets in North America (the western U.S., Canada, and Mexico), South America (Chile, Peru, and Argentina), Europe (Fennoscandia, Serbia and the other Balkans), western Asia (Turkey), Africa (Morocco and Botswana), and Australia. From these countries and regions, the Company manages its portfolio utilizing in-country or in-region exploration teams, consultants, and advisers. EMX’s search for new royalty opportunities will be led in the western hemisphere by Chief Geologist, Dr. David Johnson, in the eastern hemisphere by General Manager of Exploration, Dr. Eric Jensen, and globally by General Manager of Corporate Development, Thomas Mair.
The precious metals and copper focused search for new royalties leverages EMX’s experience in assessing opportunities for these commodities. The Company’s portfolio is principally comprised of gold (59%) and copper (21%) assets, with battery (e.g., cobalt, nickel, etc.) and other metals (e.g., lead, zinc, etc.) accounting for the remaining 20%. The Company’s current portfolio provides a strong base from which to source new royalties for both companies.
EMX is well positioned to source new royalty opportunities under the Agreement. In particular, the EMX – Franco-Nevada initiative well-suited for the acquisition of new royalties from companies that have promising precious metals or copper projects, but are confronted by the current challenging environment for exploration funding. Interested third parties are encouraged to see www.EMXroyalty.com for more information regarding key management contacts, as well as the Company’s portfolio and business strategy.
Qualified Person. Michael P. Sheehan, CPG, a Qualified Person as defined by National Instrument 43-101 and employee of the Company, has reviewed, verified and approved the disclosure of the technical information contained in this news release.
About EMX. EMX is a precious, base and battery metals royalty company. EMX’s investors are provided with discovery, development, and commodity price optionality, while limiting exposure to risks inherent to operating companies. The Company’s common shares are listed on the NYSE American Exchange and TSX Venture Exchange under the symbol “EMX”, and also trade on the Frankfurt exchange under the symbol “6E9”. Please see www.EMXroyalty.com for more information.
About Franco-Nevada. Franco-Nevada Corporation is the leading gold-focused royalty and streaming company with the largest and most diversified portfolio of cash-flow producing assets. Its business model provides investors with gold price and exploration optionality while limiting exposure to cost inflation. Franco-Nevada uses its free cash flow to expand its portfolio and pay dividends. It trades under the symbol FNV on both the Toronto and New York stock exchanges.
For further information contact:
David M. Cole President and Chief Executive Officer Phone: (303) 973-8585 Dave@emxroyalty.com
Scott Close Director of Investor Relations Phone: (303) 973-8585 SClose@emxroyalty.com
Neither the TSX Venture Exchange nor its Regulation Services Provider (as that term is defined in policies of the TSX Venture Exchange) accepts responsibility for the adequacy or accuracy of this release
Forward-Looking Statements This news release may contain “forward-looking statements” that reflect the Company’s current expectations and projections about its future results. These forward-looking statements may include statements regarding perceived merit of properties, exploration results and budgets, mineral reserves and resource estimates, work programs, capital expenditures, timelines, strategic plans, market prices for precious and base metal, or other statements that are not statements of fact. When used in this news release, words such as “estimate,” “intend,” “expect,” “anticipate,” “will”, “believe”, “potential” and similar expressions are intended to identify forward-looking statements, which, by their very nature, are not guarantees of the Company’s future operational or financial performance, and are subject to risks and uncertainties and other factors that could cause the Company’s actual results, performance, prospects or opportunities to differ materially from those expressed in, or implied by, these forward-looking statements. These risks, uncertainties and factors may include, but are not limited to unavailability of financing, failure to identify commercially viable mineral reserves, fluctuations in the market valuation for commodities, difficulties in obtaining required approvals for the development of a mineral project, increased regulatory compliance costs, expectations of project funding by joint venture partners and other factors.
Readers are cautioned not to place undue reliance on these forward-looking statements, which speak only as of the date of this news release or as of the date otherwise specifically indicated herein. Due to risks and uncertainties, including the risks and uncertainties identified in this news release, and other risk factors and forward-looking statements listed in the Company’s MD&A for the quarter ended March 31, 2023 (the “MD&A”), and themost recently filed Annual Information Form (“AIF”) for the year ended December 31, 2022, actual events may differ materially from current expectations. More information about the Company, including the MD&A, the AIF and financial statements of the Company, is available on SEDAR at www.sedarplus.ca and on the SEC’s EDGAR website at www.sec.gov.
Ottawa, Ontario–(Newsfile Corp. – July 24, 2023) – Gold79 Mines Ltd. (TSXV: AUU) (OTCQB: AUSVF) (“Gold79” or the “Company”) is pleased to announce that it has entered into an amending agreement with respect to one of its option agreements for the Gold Chain, Arizona project which reduces cash payments in the near-term.
This amending agreement relates to 107 unpatented mining claims forming part of the Gold Chain project. In total, the Gold Chain project consists of 379 unpatented mining claims covering approximately 3,058 hectares (7,552 acres) and 15 patented claims covering approximately 107 hectares (264 acres). The Company retains a right to earn a 100% interest in this portion of the project while the future payment schedule for certain cash and share payments has been amended as further detailed below.
Derek Macpherson, President and CEO of Gold79, states, “Given market conditions, this reduction in near-term cash payments is an important step to allow Gold79 to continue advancing the project. I would like to thank the project optionors for providing us with additional flexibility by deferring near-term cash payments with this amendment.”
Details with respect to the amendment is as follows:
The amended option agreement now requires a balance of future annual cash payments totaling US$415,000 (previously US$410,000) with anniversary payments extending to July 30, 2028 versus July 30, 2025 previously. Future share payments now total a value of US$192,000 (previously US$144,000) with annual payments due July 30, 2023 to July 30, 2026. Details of the revised future payments are as follows:
Table 1: Amended Payment Schedule
Timing
Cash payments (US dollars)
Common share payments (US dollars)
On or before July 30, 2023
$15,000
$48,000
On or before July 30, 2024
25,000
48,000
On or before July 30, 2025
55,000
48,000
On or before July 30, 2026
60,000
48,000
On or before July 30, 2027
100,000
Nil
On or before July 30, 2028
160,000
Nil
Totals
$415,000
$192,000
Table 2: Previous Payment Schedule
Timing
Cash payments (US dollars)
Common share payments (US dollars)
On or before July 30, 2023
$60,000
$48,000
On or before July 30, 2024
100,000
48,000
On or before July 30, 2025
250,000
48,000
Totals
$410,000
$144,000
There continues to be no minimum commitment for exploration work expenditures under the option agreement and all other terms remain unchanged.
This amending agreement is subject to approval of the TSX Venture Exchange.
About Gold79 Mines Ltd.
Gold79 Mines Ltd. is a TSX Venture listed company focused on building ounces in the Southwest USA. Gold79 holds 100% earn-in option to purchase agreements on three gold projects: the Jefferson Canyon Gold Project and the Tip Top Gold Project both located in Nevada, USA, and, the Gold Chain Project located in Arizona, USA. In addition, Gold79 holds a 32.3% interest in the Greyhound Project, Nunavut, Canada under JV by Agnico Eagle Mines Limited.
For further information regarding this press release contact: Derek Macpherson, President & CEO Phone: 416-294-6713 Email: dm@gold79mines.com Website: www.gold79mines.com.
This press release may contain forward looking statements that are made as of the date hereof and are based on current expectations, forecasts and assumptions which involve risks and uncertainties associated with our business including any proposed private placement or any future private placements, the uncertainty as to whether further exploration will result in the target(s) being delineated as a mineral resource, capital expenditures, operating costs, mineral resources, recovery rates, grades and prices, estimated goals, expansion and growth of the business and operations, plans and references to the Company’s future successes with its business and the economic environment in which the business operates. All such statements are made pursuant to the ‘safe harbour’ provisions of, and are intended to be forward-looking statements under, applicable Canadian securities legislation. Any statements contained herein that are statements of historical facts may be deemed to be forward-looking statements. By their nature, forward-looking statements require us to make assumptions and are subject to inherent risks and uncertainties. We caution readers of this news release not to place undue reliance on our forward-looking statements as a number of factors could cause actual results or conditions to differ materially from current expectations. Please refer to the risks set forth in the Company’s most recent annual MD&A and the Company’s continuous disclosure documents that can be found on SEDAR at www.sedar.com. Gold79 does not intend, and disclaims any obligation, except as required by law, to update or revise any forward-looking statements whether as a result of new information, future events or otherwise.
Neither the TSX Venture Exchange nor its Regulation Services Provider (as that term is defined in the policies of the TSX Venture Exchange) accepts responsibility for the adequacy or accuracy of this release.