- Step-out drill hole APC-28, which was drilled to the west from the eastern side of the Main Breccia system at Apollo cut the longest intercept to date as follows:
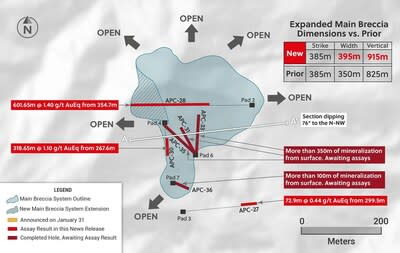
- As a result of APC-28, the maximum width and vertical dimensions of the Main Breccia system have increased to 395 metres (previously 350 metres) and 915 metres (previously 825 metres), respectively.
- Drill hole APC-28 bottomed while still in mineralization indicating that the Main Breccia system remains open for expansion to the west and at depth (as well as to the east and north based on previously announced assay results).
- Hole APC-30 was drilled southwards on the western side of the deposit and intercepted the Main Breccia system over a broad interval as follows:
- Four holes have now been completed into the Main Breccia system as part of the 2023 Phase II drill program at the Guayabales project. All four holes appear to have intercepted the Main Breccia system with mineralization beginning from surface. Assay results for these holes are expected in the near term.
Ari Sussman, Executive Chairman commented: “The Main Breccia system at Apollo continues to yield positive surprises. The Company drilled three long holes in 2022, APC-17, APC-22 and APC-28, with each hole expanding the size of the deposit and bottoming while still in mineralization. In addition, 2023 drilling is off to an excellent start with the initial four holes testing the Main Breccia system all intersecting mineralization beginning at surface. Our aim for 2023 is to define the newly discovered high-grade and near surface mineralization while continuing to be aggressive with expansion drilling. Without question, we have discovered a large copper-silver-gold deposit in a mining friendly jurisdiction of Colombia which will play a vital role in the country’s aggressive decarbonization goals.”
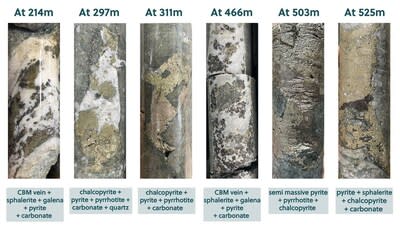
TORONTO, Feb. 15, 2023 /CNW/ – Collective Mining Ltd. (TSXV: CNL) (OTCQX: CNLMF) (“Collective” or the “Company”) is pleased to announce assay results from a further three holes drilled into the Main Breccia system at the Apollo target (“Apollo”), which is part of the Guayabales project located in Caldas, Colombia. The Main Breccia is a high-grade, bulk tonnage copper-silver-gold porphyry-related system, which owes its excellent metal endowment to multiple phases of mineralization which includes older copper-silver-gold porphyry mineralization and younger, overprinting, low and intermediate sulphidation, precious metal rich sheeted carbonate base metal vein systems.
Details (See Table 1 and Figures 1–5)
Assay results for all thirty-one diamond drill holes from the Phase I drilling program for 2022 have now been announced at Apollo. The Phase II drilling program for 2023 is advancing on schedule with assay results for the first holes expected in the near term. This press release summarizes assay results of the final three diamond drill holes from the Phase I program with results summarized below.
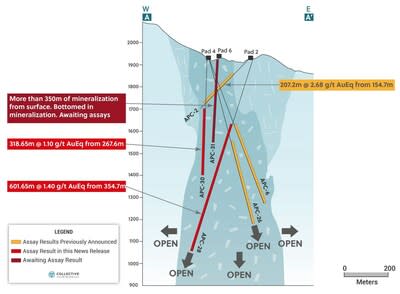
APC-28 was a step-out hole drilled steeply to the west from Pad 2 to a maximum depth of 956.35 metres (915 metres vertical) and was designed to test western and depth extensions to the Main Breccia system. The hole intersected the longest interval drilled to date within the system, commencing at 354.70 metres down hole (335 vertical) and averaging:
- 601.65 metres @ 1.4 g/t gold equivalent and including internal intervals of:
The mineralized angular breccia of this intercept represents the largest accumulation of metal returned to date within the Main Breccia system and contains a sulphide matrix which includes 0.5% up to 2.5% chalcopyrite and between 1% and 3% pyrite plus some pyrrhotite. The breccia has been overprinted by zones of carbonate and base metal (sphalerite and galena) veins, which yield the higher gold equivalent intervals. APC-28 stopped in mineralized breccia due to rig constraints. This hole has extended the main breccia westwards by 115 metres and is the deepest intercept drilled to date outlining continuity of mineralized breccia to a vertical depth of approximately 915 metres below surface. APC-28 also represents the westernmost hole drilled into the Main Breccia system and demonstrates that the mineralization is thickening with depth and has an inverted funnel morphology as outlined in Figure 2 below. This western area of the deposit remains open for expansion as the hole stopped in strong mineralization.
As a result of drill hole APC-28, the overall volume of rock in which the Main Breccia system is located has grown in width to 395 metres (from 350 metres) and a vertical dimension of 915 metres (from 825 metres). The strike of the system remains the same at 385 metres.
APC-30 was drilled southwards from Pad 4 to a total length of 589 metres downhole and intersected mineralized breccia from 267.60 metres downhole (240 metres vertical), averaging:
- 318.85 metres @ 1.10 g/t gold equivalent and including internal intervals of:
Gold, silver and copper mineralization relates to sulphides hosted within the angular breccia matrix with average concentrations of pyrite (2%) and chalcopyrite (0.5%). An upper zone of 60.8 metres bearing 2% to 3% chalcopyrite was intercepted at the beginning of the mineralized interval and a sheeted and overprinting sphalerite rich CBM vein zone of 81.4 metres was encountered from 472.3 metres downhole.
Reconnaissance hole APC-27 was drilled due east away from the Main Breccia system to test outcropping mineralization at surface. From 300.40 metres downhole (210 metres vertical depth) the Company intersected a new zone of continuous low-grade mineralization with assay results as follows:
Core logging of the breccia system at Apollo by the Company’s geologists has identified that the crackle breccia as seen in this newly discovered zone, is typically found both above and on the periphery of the more intensely mineralized angular breccia phase. As a result of this assessment, the Company may have drilled over top of an angular breccia zone with stronger mineralization than was intercepted in APC-27. Further exploratory drilling will be undertaken in this area.
The Company’s Phase II 2023 program is well underway with three rigs focused on drilling near surface, high grade mineralization below mineralized outcrops in the southern and central areas of the Main Breccia system from newly constructed pads 6 and 7. To date, four shallow holes have been completed and confirm continuous mineralized angular breccia from surface. Three of these holes were drilled from Pad 6 and were terminated while still in strong mineralization. The fourth hole from Pad 7 appears to have drilled out the east side of the system indicating a more vertical orientation to the system that was previously modelled. Assay results are expected in the near term.
The Apollo target area, as defined to date by surface mapping, rock sampling and copper and molybdenum soil geochemistry, covers a 1,000 metres X 1,200 metres area. The Apollo target area hosts the Company’s Main Breccia system and multiple additional untested breccia, porphyry and vein targets. The overall Apollo target area also remains open for further expansion.
Table 1: Apollo Target Assays Results for Holes APC-27, APC-28, and APC-30
| Hole ID | From (m) | To (m) | Intercept (m) | Au (g/t) | Ag (g/t) | Cu % | Mo % | AuEq (g/t) * |
| APC-27 | 299.50 | 372.40 | 72.90 | 0.30 | 6 | 0.02 | 0.002 | 0.44 |
| APC-28 | 286.60 | 305.55 | 18.95 | 1.11 | 12 | 0.04 | 0.001 | 1.30 |
| And | 354.70 | 956.35 | 601.65 | 0.89 | 24 | 0.10 | 0.001 | 1.40 |
| Incl | 354.70 | 614.65 | 259.95 | 1.21 | 43 | 0.20 | 0.001 | 2.15 |
| 713.10 | 772.80 | 59.70 | 2.04 | 15 | 0.14 | 0.04 | 2.23 | |
| 863.15 | 868.80 | 5.65 | 2.00 | 13 | 0.04 | 0.001 | 2.17 | |
| APC-30 | 267.60 | 586.25 | 318.65 | 0.61 | 19 | 0.12 | 0.002 | 1.10 |
| Incl | 267.60 | 328.40 | 60.80 | 0.17 | 48 | 0.40 | 0.002 | 1.64 |
| 472.30 | 553.70 | 81.40 | 1.95 | 18 | 0.04 | 0.002 | 2.22 |
| *AuEq (g/t) is calculated as follows: (Au (g/t) x 0.95) + (Ag g/t x 0.016 x 0.95) + (Cu (%) x 1.83 x 0.95)+ (Mo (%)*9.14 x 0.95) and CuEq (%) is calculated as follows: (Cu (%) x 0.95) + (Au (g/t) x 0.51 x 0.95) + (Ag (g/t) x 0.01 x 0.95)+ (Mo(%)x 3.75 x 0.95) utilizing metal prices of Cu – US$4.00/lb, Ag – $24/oz Mo US$20.00/lb and Au – US$1,500/oz and recovery rates of 95% for Au, Ag, Mo and Cu. Recovery rate assumptions are speculative as no metallurgical work has been completed to date. |
| ** A 0.2 g/t AuEq cut-off grade was employed with no more than 15% internal dilution. True widths are unknown, and grades are uncut. |


About Collective Mining Ltd.
To see our latest corporate presentation and related information, please visit www.collectivemining.com
Founded by the team that developed and sold Continental Gold Inc. to Zijin Mining for approximately $2 billion in enterprise value, Collective Mining is a copper, silver and gold exploration company based in Canada, with projects in Caldas, Colombia. The Company has options to acquire 100% interests in two projects located directly within an established mining camp with ten fully permitted and operating mines.
The Company’s flagship project, Guayabales, is anchored by the Apollo target, which hosts the large-scale, bulk-tonnage and high-grade copper, silver, and gold Main Breccia system. The Company’s near-term objective is to continue with expansion drilling of the Main Breccia system while increasing confidence in the highest-grade portions of the system.
Management, insiders and close family and friends own nearly 52% of the outstanding shares of the Company and as a result, are fully aligned with shareholders. The Company is listed on the TSXV under the trading symbol “CNL” and on the OTCQX under the trading symbol “CNLMF”.
Qualified Person (QP) and NI43-101 Disclosure
David J Reading is the designated Qualified Person for this news release within the meaning of National Instrument 43-101 (“NI 43-101”) and has reviewed and verified that the technical information contained herein is accurate and approves of the written disclosure of same. Mr. Reading has an MSc in Economic Geology and is a Fellow of the Institute of Materials, Minerals and Mining and of the Society of Economic Geology (SEG).
Technical Information
Rock and core samples have been prepared and analyzed at SGS laboratory facilities in Medellin, Colombia and Lima, Peru. Blanks, duplicates, and certified reference standards are inserted into the sample stream to monitor laboratory performance. Crush rejects and pulps are kept and stored in a secured storage facility for future assay verification. No capping has been applied to sample composites. The Company utilizes a rigorous, industry-standard QA/QC program.
Information Contact:
Follow Executive Chairman Ari Sussman (@Ariski) and Collective Mining (@CollectiveMini1) on Twitter
FORWARD-LOOKING STATEMENTS
This news release contains certain forward-looking statements, including, but not limited to, statements about the drill programs, including timing of results, and Collective’s future and intentions. Wherever possible, words such as “may”, “will”, “should”, “could”, “expect”, “plan”, “intend”, “anticipate”, “believe”, “estimate”, “predict” or “potential” or the negative or other variations of these words, or similar words or phrases, have been used to identify these forward-looking statements. These statements reflect management’s current beliefs and are based on information currently available to management as at the date hereof.
Forward-looking statements involve significant risk, uncertainties, and assumptions. Many factors could cause actual results, performance, or achievements to differ materially from the results discussed or implied in the forward-looking statements. These factors should be considered carefully, and readers should not place undue reliance on the forward-looking statements. Although the forward-looking statements contained in this news release are based upon what management believes to be reasonable assumptions, Collective cannot assure readers that actual results will be consistent with these forward-looking statements. These forward-looking statements are made as of the date of this news release, and Collective assumes no obligation to update or revise them to reflect new events or circumstances, except as required by law.
Neither the TSXV nor its Regulation Services Provider (as that term is defined in the policies of the TSXV) accepts responsibility for the adequacy or accuracy of this news release.
SOURCE Collective Mining Ltd.

View original content to download multimedia: http://www.newswire.ca/en/releases/archive/February2023/15/c3425.html