Categories
Base Metals Energy Junior Mining Precious Metals

Collective Mining Outlines Multiple, High-Grade Vein Systems at Olympus with Assay Results
from Channel Sampling of up to 137 g/t Gold and 563 g/t Silver

Collective Mining Ltd.

Figure 1

Plan View of the Guayabales Project Highlighting the Olympus Target

Figure 2

Olympus Target, Measuring 1.4 Kilometres x 0.9 Kilometres and Open

Figure 3: Photos of High-Grade Polymetallic Grab Samples Taken at Olympus

Veins of massive sulfides with pyrite, sphalerite, galena and chalcopyrite.

TORONTO, June 01, 2022 (GLOBE NEWSWIRE) — Collective Mining Ltd. (TSXV: CNL) (“Collective” or the “Company”) is pleased to announce high-grade gold and silver channel sample assay results from its grassroots generated Olympus target (“Olympus”) located within the Guayabales project (“Guayabales”), Colombia. Olympus is centrally situated within the four-by-four kilometre porphyry cluster where to date, the Company has generated eight drill targets through grassroots prospecting. Four of these targets have been drill tested yielding three significant discoveries including the Olympus target where the Company recently announced near surface discovery holes of 302 metres @ 1.11 g/t gold equivalent and 216.7 metres @ 1.08 g/t gold equivalent (refer to press release dated March 15, 2022 and May 9, 2022, respectively)As part of its fully funded 20,000+ metre program for 2022, Collective presently has three diamond drill rigs operating at Guayabales with drills turning at the Trap and Apollo targets and a fourth rig expected to kick off a phase II drilling program at Olympus at the beginning of Q3, 2022.
https://embed.fireplace.yahoo.com/embed?ctrl=Monalixa&m_id=monalixa&m_mode=document&site=sports&os=android&pageContext=%257B%2522ctopid%2522%253A%25221542500%253B1577000%2522%252C%2522hashtag%2522%253A%25221542500%253B1577000%2522%252C%2522wiki_topics%2522%253A%2522Olympus_Generation%253BColombia%253BMetre%253BTarget_Corporation%253BVein%253BKilometre%253BPorphyry_(geology)%253BTSX_Venture_Exchange%2522%252C%2522lmsid%2522%253A%2522a0770000002m0AbAAI%2522%252C%2522revsp%2522%253A%2522globenewswire.com%2522%252C%2522lpstaid%2522%253A%2522a06abe0d-75d8-37f6-9ef1-cc990de073da%2522%252C%2522pageContentType%2522%253A%2522story%2522%257D

Highlights (Table 1 and Figures 1, 2 and 3)

  • Assay results of chip channel samples taken from veins located within historical, shallow underground workings from Olympus continue to confirm the presence of a high-grade carbonate base metal (“CBM”) sheeted vein system into the southwest portion of the target area with results as follows:

Table 1: Chip Channel Sample Assay Results from Olympus

Sample IDAu (g/t)Ag (g/t)
R5451137.76476
R5429102.19427
R543185.41563
R544769.06439
R541850.98353
R521337.18349
R541526.29124
R546616.23238
R521011.4241
R521810.64287
R54449.0924
R52227.1519
R54166.6864
R54635.62428
R52154.8452
R54454.268
R52253.9910
R54213.93152
R52342.9811
R52122.8154
R54541.89154
R54321.34178

*Channel chip samples reported above are over true horizontal sampling widths of between 0.1 and 1 metre. Sample grades are uncappedChannel samples are representative of 2dimensional space and as a result should not be relied upon as being representative of average grades anticipated in any future resource estimate or mining scenario. Assay results for base metals are still pending for all samples listed.

  • Multiple CBM veins were sampled at Olympus, over an area measuring 250 metres x 250 metres from limited and partial exposures of rock in old tunnels. The CBM veins are sulphide rich and associated with intense sericite alteration superimposed on porphyry diorite and mineralized, hydrothermal breccia. Porphyry-related CBM veins can demonstrate robust continuity over significant vertical and lateral dimensions and the Company will assess through drilling whether those characteristics apply to the Olympus vein system.
  • Drilling, underground sampling and surface mapping to date have expanded Olympus to a target area measuring more than 1,400 metres by 900 metres, which hosts over 50 artisanal mines with over 25 veins mapped from available exposures. The Company believes that the probability is high that additional veins will be discovered as exploration ramps up. The Olympus target is open to the east, west, northwest, south and at depth.
  • Olympus now includes two mineralized zones. Both zones contain multiple porphyry and overprinting CBM veins associated with intense pyrite-sericite-carbonate alteration and hosted in a porphyry diorite (Eastern zone) and within schist country rocks intruded by porphyritic diorite (Western zone).
  • The highest-grade samples collected to date at Olympus come from areas that have yet to be drill tested by the Company. Diamond drilling completed to date has only focused on a small northern portion of the Eastern and Western zones while recent surface and underground mapping has expanded the Western zone to the west and southwest.
  • The Company reconfirms that it is on track with construction of underground drill chambers with the first rig anticipated to commence drilling in July 2022 followed by a second rig shortly thereafter.

Figure 1: Plan View of the Guayabales Project Highlighting the Olympus Target
https://www.globenewswire.com/NewsRoom/AttachmentNg/97067e84-29cb-4bf6-9d85-91bcaf4769e8

Figure 2: Olympus Target, Measuring 1.4 Kilometres x 0.9 Kilometres and Open
https://www.globenewswire.com/NewsRoom/AttachmentNg/6d8d594a-c3d4-47f2-81c2-5d6c184d6036

Figure 3: Photos of High-Grade Polymetallic Grab Samples Taken at Olympus
https://www.globenewswire.com/NewsRoom/AttachmentNg/01377213-bd22-4b42-93df-e97abec5c6a4
Veins of massive sulfides with pyrite, sphalerite, galena and chalcopyrite.

Qualified Person (QP) and NI43-101 Disclosure

David J Reading is the designated Qualified Person for this news release within the meaning of National Instrument 43-101 (“NI 43-101”) and has reviewed and verified that the technical information contained herein is accurate and approves of the written disclosure of same. Mr. Reading has an MSc in Economic Geology and is a Fellow of the Institute of Materials, Minerals and Mining and of the Society of Economic Geology (SEG).

Technical Information

Rock samples have been prepared and analyzed at SGS laboratory facilities in Medellin, Colombia and Lima, Peru. Blanks, duplicates, and certified reference standards are inserted into the sample stream to monitor laboratory performance. Crush rejects and pulps are kept and stored in a secured storage facility for future assay verification. No capping has been applied to sample composites. The Company utilizes a rigorous, industry-standard QA/QC program.

About Collective Mining Ltd.

To view the Company’s most recent investor presentation, please visit www.collectivemining.com

Collective Mining is an exploration and development company focused on identifying and exploring prospective mineral projects in South America. Founded by the team that developed and sold Continental Gold Inc. to Zijin Mining for approximately $2 billion in enterprise value, the mission of the Company is to repeat its past success in Colombia by making a significant new mineral discovery and advancing the projection to production. Management, insiders and close family and friends own approximately 40% of the outstanding shares of the Company and as a result, are fully aligned with shareholders. Collective currently holds an option to earn up to a 100% interest in two projects located in Colombia. As a result of an aggressive exploration program at both the Guayabales and San Antonio projects a total of eleven major targets have been defined. The Company is fortuitous to have made significant grassroots discoveries on both projects with discovery holes of 302 metres @ 1.1 g/t AuEq and 163 metres @ 1.3 g/t AuEq at the Guayabales project and 710 metres @ 0.53 AuEq at the San Antonio project. (See press releases dated October 18th and 27th, 2021 and March 15, 2022, for AuEq calculations.)

Contact Information

Collective Mining Ltd.
Steve Gold, Vice President, Corporate Development and Investor Relations
Tel. (416) 648-4065

To schedule a one-on-one meeting with management please use the following link:
https://calendly.com/collectivemining/30min?month=2021-11

FORWARD-LOOKING STATEMENTS

This news release contains certain forward-looking statements, including, but not limited to, statements about the drill programs, including timing of results, and Collective’s future and intentions. Wherever possible, words such as “may”, “will”, “should”, “could”, “expect”, “plan”, “intend”, “anticipate”, “believe”, “estimate”, “predict” or “potential” or the negative or other variations of these words, or similar words or phrases, have been used to identify these forward-looking statements. These statements reflect management’s current beliefs and are based on information currently available to management as at the date hereof.

Forward-looking statements involve significant risk, uncertainties, and assumptions. Many factors could cause actual results, performance, or achievements to differ materially from the results discussed or implied in the forward-looking statements. These factors should be considered carefully, and readers should not place undue reliance on the forward-looking statements. Although the forward-looking statements contained in this news release are based upon what management believes to be reasonable assumptions, Collective cannot assure readers that actual results will be consistent with these forward-looking statements. These forward-looking statements are made as of the date of this news release, and Collective assumes no obligation to update or revise them to reflect new events or circumstances, except as required by law.

Neither the TSXV nor its Regulation Services Provider (as that term is defined in the policies of the TSXV) accepts responsibility for the adequacy or accuracy of this news release.

Categories
Junior Mining Precious Metals

ROVER METALS PROVIDES AN INFRASTRUCTURE UPDATE FOR ITS NORTHERN CANADA GOLD PROJECTS

Rover Metals Corp.
Rover Metals Corp.

VANCOUVER, British Columbia, May 31, 2022 (GLOBE NEWSWIRE) — Rover Metals Corp. (TSXV: ROVR) (OTCQB: ROVMF) (FSE:4XO) (“Rover” or the “Company”) is pleased to provide an infrastructure update for its Cabin Gold Project and its Up Town Gold Project, located at the 60th parallel of the Northwest Territories of Canada.

NWT Infrastructure Initiatives
The Government of Canada has moved one step closer to funding the expansion of the Taltson Hydro dam into the city of Yellowknife, NWT. In a recent interview with the CBC, the federal infrastructure minister provides an update on the project. One of the many benefits of bringing additional green power into the city of Yellowknife includes a more cost-effective source of power for the future mines being developed near the city. Green energy is also amongst the ESG initiatives that major gold producers are looking for when it comes to taking an interest in development-stage gold projects.

The expansion of the Taltson Hydro dam into the city of Yellowknife also has the potential to free up hydro at both the Strutt and Snare hydro facilities which are located close to Rover’s Cabin Gold, Slemon Gold, and Camp Gold Projects.

Mineral resource exploration, and the development of mines in the Northwest Territories, remains a priority of all levels of government (not just at the federal level). In 2021, Rover received two exploration grants from the territorial government to assist with advancing exploration at its Cabin Gold Project. Also in 2021, the federally funded Tlicho All Season Road (“TASR”) opened to the public. TASR connects the cities of Yellowknife and Hay River, via Highway NT3, to Rover’s Cabin Gold Project, Fortune Minerals’ NICO Project, and Nighthawk Gold’s Indin Lake Gold Project.

Collaboration between the government and the mining industry will continue to grow economic prospects for Northern Canada and will work towards the reinforcement of Canada’s northern sovereignty. As much of the world begins to look for more ethically sourced natural resources, companies like Rover Metals are investing heavily into exploration to build the mines of the future.https://embed.fireplace.yahoo.com/embed?ctrl=Monalixa&m_id=monalixa&m_mode=document&site=sports&os=android&pageContext=%257B%2522ctopid%2522%253A%25221542500%253B1577000%2522%252C%2522hashtag%2522%253A%25221542500%253B1577000%2522%252C%2522wiki_topics%2522%253A%2522Canada%253BProvinces_and_territories_of_Canada%253BGovernment_of_Canada%253BNorthwest_Territories%253BGold%253BYellowknife%253BCompany%253BVancouver%253BExploration%2522%252C%2522lmsid%2522%253A%2522a0770000002m0AbAAI%2522%252C%2522revsp%2522%253A%2522globenewswire.com%2522%252C%2522lpstaid%2522%253A%25225be403c1-59e4-385c-9bc8-6c6aa5f27790%2522%252C%2522pageContentType%2522%253A%2522story%2522%257D

Q1-2022 Financial Package
Rover is pleased to report that it has SEDAR filed its March 31, 2022 Financial Statements and Management Discussion and Analysis (“MD&A”). The MD&A includes management’s milestone for the first three months of the year.

Grant of Stock Options
The Company has granted 500,000 incentive stock options to a new consultant of the Company. The options have a five-year life, and an exercise price of $0.06 per share. The options have been granted from the Company’s 10% rolling stock option plan, approved by its shareholders at its August 2021 Annual General Meeting.

About Rover Metals
Rover is a precious metals exploration company specialized in North American (Canada and U.S.) precious metal resources, which is currently advancing the gold potential of its existing projects in the Northwest Territories of Canada (60th parallel), and north-central Nevada, USA. The Company owns five gold projects. Phase 3 Exploration at its Cabin Gold Project, 60th Parallel, NT, Canada, commenced in March 2022 and continues through to the date of this release. Phase 1 Exploration at its Tobin Gold Project commenced in May 2022 and continues through to the date of this release. Lastly, the Company, is also awaiting news from the Phase 2 Exploration Program at its Up Town Gold Project, in the Northwest Territories of Canada (60th parallel).

You can follow Rover on its social media channels: 
Twitter: https://twitter.com/rovermetals 
LinkedIn: https://www.linkedin.com/company/rover-metals/ 
Facebook: https://www.facebook.com/RoverMetals/
for daily company updates and industry news, and
YouTube: https://www.youtube.com/channel/UCJsHsfag1GFyp4aLW5Ye-YQ?view_as=subscriber
for corporate videos.
Website: https://www.rovermetals.com/

ON BEHALF OF THE BOARD OF DIRECTORS
“Judson Culter”
Chief Executive Officer and Director

For further information, please contact:
Email: info@rovermetals.com
Phone: +1 (778) 754-2617

Statement Regarding Forward-Looking Information
This news release contains statements that constitute “forward-looking statements.” Such forward-looking statements involve known and unknown risks, uncertainties and other factors that may cause Rover’s actual results, performance or achievements, or developments in the industry to differ materially from the anticipated results, performance or achievements expressed or implied by such forward-looking statements. Forward-looking statements are statements that are not historical facts and are generally, but not always, identified by the words “expects,” “plans,” “anticipates,” “believes,” “intends,” “estimates,” “projects,” “potential” and similar expressions, or that events or conditions “will,” “would,” “may,” “could” or “should” occur. There can be no assurance that such statements prove to be accurate. Actual results and future events could differ materially from those anticipated in such statements, and readers are cautioned not to place undue reliance on these forward-looking statements. Any factor could cause actual results to differ materially from Rover’s expectations. Rover undertakes no obligation to update these forward-looking statements in the event that management’s beliefs, estimates or opinions, or other factors, should change.

THE FORWARD-LOOKING INFORMATION CONTAINED IN THIS NEWS RELEASE REPRESENTS THE EXPECTATIONS OF THE COMPANY AS OF THE DATE OF THIS NEWS RELEASE AND, ACCORDINGLY, IS SUBJECT TO CHANGE AFTER SUCH DATE. READERS SHOULD NOT PLACE UNDUE IMPORTANCE ON FORWARD-LOOKING INFORMATION AND SHOULD NOT RELY UPON THIS INFORMATION AS OF ANY OTHER DATE. WHILE THE COMPANY MAY ELECT TO, IT DOES NOT UNDERTAKE TO UPDATE THIS INFORMATION AT ANY PARTICULAR TIME EXCEPT AS REQUIRED IN ACCORDANCE WITH APPLICABLE LAWS.

NEITHER THE TSX VENTURE EXCHANGE NOR ITS REGULATION PROVIDER (AS THAT TERM IS DEFINED IN THE POLICIES OF THE TSX VENTURE EXCHANGE) ACCEPTS RESPONSIBILITY FOR THE ADEQUACY OF THIS RELEASE.

Categories
Junior Mining Lion One Metals Precious Metals

Lion One Reports Latest Results from Its Phase 2 Infill Drill Program from Tuvatu, Fiji, Demonstrating Significant New Mineralization, Including a Bonanza Intercept of 584.07 g/t Au Over 0.30m

North Vancouver, British Columbia–(Newsfile Corp. – May 31, 2022) – Lion One Metals Limited (TSXV: LIO) (OTCQX: LOMLF) (ASX: LLO) (“Lion One” or the “Company”) is pleased to announce results from ongoing infill drilling at its Tuvatu Alkaline Gold Project in Fiji.

Results for the first 11 holes of Lion One’s Phase 2 infill program on Zone 5 of their fully permitted Tuvatu alkaline gold deposit are here reported. The results to date indicate significant new intercepts of high- to bonanza-grade Au mineralization that was not known to occur as part of the existing resource model. The Phase 2 infill drill program was designed to confirm the location, size, and continuity of the known mineralized lodes, in a portion of the orebody slated for early production (Figure 1A).

Top Intercepts include:

  • 18.47 g/t Au over 1.20m from 104.7-105.9m, and 584.07 g/t Au over 0.30m from 122.4-122.7m from TUDDH-586 (new)
  • 24.72 g/t Au over 0.60m from 187.4-188.0m, incl. 43.34 g/t Au over 0.30m from 187.7-188.0m from TUDDH-580 (new)
  • 25.23 g/t Au over 1.20m from 70.9-72.1m, incl. 78.02 g/t Au over 0.30m from TUG-139
  • 18.77 g/t Au over 2.10m from 118.8-120.9m, incl. 26.07 g/t Au over 1.50m from TUDDH-577
  • 11.95 g/t Au over 2.70m from 55.9-58.6m, incl. 35.91 g/t Au over 0.60m from TUDDH-578
  • 11.18 g/t Au over 1.20m from 153.5-154.7m, incl. 40.05 g/t Au over 0.30m from TUDDH-580

The mineralization reported here is considered to be a highly significant development, representing a substantive addition of Au mineralization at grades well in excess of the average resource grade, intersected at relatively shallow levels in the orebody. As a result, the new high-grade mineralization defined by the ongoing infill drill program can be expected to substantially enhance the early part the production stream and hence the immediate economic viability of Tuvatu.https://embed.fireplace.yahoo.com/embed?ctrl=Monalixa&m_id=monalixa&m_mode=document&site=sports&os=android&pageContext=%257B%2522ctopid%2522%253A%25221542500%253B1480989%253B1481489%2522%252C%2522hashtag%2522%253A%25221542500%253B1480989%253B1481489%2522%252C%2522wiki_topics%2522%253A%2522Lion%253BExploration_diamond_drilling%2522%252C%2522lmsid%2522%253A%2522a0V0W00000HOPDcUAP%2522%252C%2522revsp%2522%253A%2522newsfile_64%2522%252C%2522lpstaid%2522%253A%252290214f74-cd87-30c8-9d72-a6dbadcf0260%2522%252C%2522pageContentType%2522%253A%2522story%2522%257D

Results of the ongoing infill drill program to date are summarized below in Table 1. Highlighted in blue on Table 1 are specific drill intercepts that are outside of the mineralized lodes that make up the existing resource model. Each of these additional intercepts has the potential to add width, grade, and continuity to the resource in this portion of the Tuvatu orebody.

Lion One CEO Walter Berukoff, stated “We are confident that the high-grade intercepts indicated by our infill programs and the increased drilling density will lead to a more robust resource model overall with higher localized grades earlier in the production schedule at Tuvatu. Furthermore, when considering the substantially higher grade near-surface infill results reported here, along with the continuing success of the deep drilling program, this underscores the significance of Tuvatu as a potentially multi-million ounce, world-class high-grade Au producer. As we expand our drilling fleet to eight rigs and our laboratory capacity to 12,000 samples per month, we are well positioned to continue securing impressive results from all three tiers of our exploration strategy: from ongoing near-surface infill drilling; from extensions of deep high-grade feeder targets at Tuvatu; and from our pipeline of regional targets in the surrounding Navilawa caldera”.

Since the start of Phase 2 infill drill program in February 2022, Lion One has to date completed approximately 3,700m out of a planned 8,000m of infill drilling. This news release reports the results from approximately 2,375m of drilling, equivalent to approximately 30% of the planned program.

Infill Drilling Program

Two phases of infill drilling have been planned at Tuvatu with the aim of infilling areas within the current resource and thus augmenting the data density, to further improve the resolution of the geological model in portions of the deposit scheduled for earliest production. Phase 1 infill drilling was completed over Zone 2 (Figure 1A) in mid-February 2022, adding over 8,400m of new drill data, including 7,475m of new drilling and 955m of sampling of previously unsampled historic drill core (see Feb. 23, 2022 News Release).

This release presents final assay data from the initial 11 drill holes completed as part of the Phase 2 infill program, which is planned for approximately 8000m of diamond drilling from surface and underground, and is aimed at upgrading the resource database in Zone 5 of the Tuvatu orebody (Figure 1). The program as planned includes 30 holes totalling 5,400m carried out from 4 separate drill stations at surface, and 34 holes totalling 2,600m carried out from 6 underground drill stations. Phase 2 infill drill program began February 17, 2022 with drill hole TUDDH-577, and is expected to require 5-6 months of drilling using three rigs (two from surface and one from underground) to complete.

The results from the initial approximately 2,375m of drilling in Zone 5 (Figure 2), representing approximately 30% of the planned program total, indicate consistent high-grade to locally bonanza-grade Au mineralization for known mineralized lodes in this portion of the current resource (Table 1). Additionally, the results from the initial 30% of the Phase 2 infill program indicates significant new high-grade mineralization not previously known to occur prior to this program, and therefore not included in the current resource statement.

Overall, results to date suggest higher-than-expected continuity and widths of mineralization, locally at grades above the calculated average grade of the deposit. Indeed, the Phase 2 infill program is confirming, and in certain instances, extending previously modelled lodes in this part of the resource. Intercepts of exceptionally high-grades (e.g. 584.07 g/t Au in TUDDH-586) are in line with bonanza results documented from several intercepts from the previously completed Phase 1 infill drill program, providing further support to the expectation of an overall increase in average grades of the lodes scheduled for earliest phases of mining.

Numerous mineralized intervals, including the 584.07 g/t Au bonanza-grade intercept in hole TUDDH-586 as well as 43.34 g/t Au over 0.30m from 187.7-188.0m in hole TUDDH-580, occur fully outside of existing modelled lodes (Table 1, highlighted), adding to our understanding of the lode geometry, as well as to the overall inventory of high-grade mineralization slated for early production at Tuvatu.

As per the Phase 1 infill program, numerous strategically located historic holes have also been identified for resampling, the results of which will be reported in future news releases.

Figure 1: A) Oblique view looking N060° and down 17° showing the current conceptual mine plan ore panels (gold) highlighting the location of Zone 2 and Zone 5, the exploration decline (yellow) and the planned Zone 5 infill drilling program (blue). The planned drilling consists of 4 surface and 6 underground drill stations. B) Oblique view looking N060° and down 40° showing the UR1 to UR5, URW1A, URW1C, and URW3 lodes (transparent gray), exploration decline (yellow) and the planned Zone 5 infill drilling program (blue).

To view an enhanced version of Figure 1, please visit:
https://orders.newsfilecorp.com/files/2178/125923_lionon2.jpg

Figure 2: Composite vertical section looking N through Zone 5 at Tuvatu, showing the UR1 to UR5, URW1A, URW2A, and URW3 lodes (blue labels) and the trace of the infill drilling reported in this release (yellow traces). Solid lines are in the section, dotted lines are projected to this section.

To view an enhanced version of Figure 2, please visit:
https://orders.newsfilecorp.com/files/2178/125923_lionon4.jpg

Table 1: Drilling intervals returning >0.5 g/t Au (intervals > 3.0 g/t Au cutoff are shown in red, and intervals >9.0 g/t Au or longer than 1.2m are bolded). Intercepts that are outside of the current geological model are highlighted in light blue.

Hole IDFrom (m)To (m)Interval (m)Grade (g/t Au)
TUDDH-5777.28.10.91.25
59.160.31.21.13
100.8101.40.60.86
118.8120.92.118.77
including118.8120.31.526.07
127.5127.80.316.30
135.6136.20.61.09
138.6138.90.324.66
182.2182.80.60.65
TUDDH-57845.445.70.30.72
55.958.62.711.95
including55.956.50.635.91
and58.058.30.322.39
64.365.20.90.58
82.382.90.60.77
100.6101.50.91.39
TUDDH-57922.022.30.30.73
126.1126.40.32.43
129.7131.82.10.94
135.1135.40.313.56
140.5142.31.82.88
including140.5140.80.311.62
and142.0142.30.35.2
161.2163.62.41.78
TUDDH-5808.09.21.24.53
46.747.30.61.67
81.882.40.60.78
83.685.11.51.48
153.5154.71.211.18
including153.5153.80.340.05
157.7158.60.90.66
159.5159.80.30.66
165.2167.01.81.11
including166.7167.00.35.01
173.6173.90.30.76
187.4188.00.624.72
including187.4187.70.36.12
including187.7188.00.343.34
192.8196.43.61.88
including193.1193.40.311.17
including194.6194.90.34.11
TUDDH-58120.921.20.34.12
81.882.40.60.76
100.4101.00.61.56
106.4107.00.60.82
168.5170.01.54.41
including168.5168.80.38.27
and168.8170.01.23.25
179.3182.02.71.32
186.8187.10.30.54
206.6206.90.33.07
208.4209.91.51.91
212.3213.20.90.69
226.1227.91.82.39
including227.0227.30.37.48
249.8250.70.91.38
251.9252.20.32.38
307.4308.91.51.55
TUDDH-58247.648.50.93.21
91.893.61.83.81
including92.493.61.25.22
99.3102.02.73.33
including99.3100.20.95.77
TUDDH-5837.58.10.62.26
46.547.10.61.02
72.072.30.31.48
87.388.51.20.69
96.396.90.62.68
114.0114.30.31.62
121.5122.71.21.48
126.9128.71.81.93
including128.4128.70.34.39
132.0132.30.325.32
137.4137.70.30.66
138.9140.11.23.11
including138.9139.20.37.12
241.2241.50.31.48
TUDDH-5869.311.11.84.28
including10.211.10.97.91
63.664.20.60.53
67.868.40.61.8
84.684.90.35.95
98.198.40.32.95
104.7105.91.218.47
116.7117.30.60.55
122.1122.70.6292.69
including122.4122.70.3584.07
127.5127.80.31.68
129.3129.90.610.74
133.2133.80.63.41
141.6143.72.11.75
including142.5142.80.37.33
238.5241.22.70.95
TUDDH-58717.217.50.30.69
62.863.40.61.11
76.676.90.31.57
89.589.80.30.59
103.6103.90.32.34
146.2146.50.34.43
159.1160.91.81.66
232.9233.50.66.43
including232.9233.20.311.40
234.7235.91.24.27
including235235.60.65.42
237.4238.61.28.89
TUG-13917.818.10.31.42
22.022.30.30.82
26.526.80.31.47
28.929.20.31.42
31.031.30.30.75
48.749.60.91.49
54.459.24.84.20
including54.755.00.35.91
and55.055.30.312.60
and55.655.90.37.27
and55.956.20.35.70
and57.157.40.315.09
70.972.11.225.23
including70.971.20.38.96
and71.271.50.38.32
and71.571.80.35.00
and71.872.10.378.02
82.382.60.32.78
91.691.90.31.66
95.595.80.31.84
TUG-14220.420.70.31.15
29.429.70.31.49
31.236.35.10.65
41.4420.61.88
45.345.60.30.69
61.363.72.43.55
including62.563.10.68.14
additional results pending

Table 2: Survey details of diamond drill holes referenced in this release

Hole NoCoordinates (Fiji map grid)RLfinal depthdipazimuth
NEm(TN)
TUDDH-57739204351876442314.0197.9-39268
TUDDH-57839205201876513348.6150.3-59267
TUDDH-57939204351876513348.6239.0-49269
TUDDH-58039204351876513348.6284.9-60265
TUDDH-58139204351876513348.6311.6-70265
TUDDH-58239204351876442314.0120.2-49267
TUDDH-58339204351876513348.6303.2-44289
TUDDH-58639204351876513348.6302.3-55289
TUDDH-58739204351876513348.6256.8-63289
TUG-13939204801876411103.1123.3+13091
TUG-14239204801876411103.185.8-30090

Qualified Person

In accordance with National Instrument 43-101 – Standards of Disclosure for Mineral Projects (“NI 43-101”), Sergio Cattalani, P.Geo, Senior Vice President Exploration, is the Qualified Person for the Company and has reviewed and is responsible for the technical and scientific content of this news release.

QAQC Procedures

Lion One adheres to rigorous QAQC procedures above and beyond basic regulatory guidelines in conducting its sampling, drilling, testing, and analyses. The Company utilizes its own fleet of diamond drill rigs, using PQ, HQ and NQ sized drill core rods. Drill core is logged and split by Lion One personnel on site. Samples are delivered to and analysed at the Company’s geochemical and metallurgical laboratory in Fiji. Duplicates of all samples with grades above 0.5 g/t Au are both re-assayed at Lion One’s lab and delivered to ALS Global Laboratories in Australia (ALS) for check assay determinations. All samples for all high-grade intercepts are sent to ALS for check assays. All samples are pulverized to 80% passing through 75 microns. Gold analysis is carried out using fire assay with an AA finish. Samples that have returned grades greater than 10.00 g/t Au are then re-analysed by gravimetric method. For samples that return greater than 0.50 g/t Au, repeat fire assay runs are carried out and repeated until a result is obtained that is within 10% of the original fire assay run. For samples with multiple fire assay runs, the average of duplicate runs is presented. Lion One’s laboratory can also assay for a range of 71 other elements through Inductively Coupled Plasma Optical Emission Spectrometry (ICP-OES), but currently focuses on a suite of 9 important pathfinder elements. All duplicate anomalous samples are sent to ALS labs in Townsville QLD and are analysed by the same methods (Au-AA26, and Au-GRA22 where applicable). ALS also analyses for 33 pathfinder elements by HF-HNO3-HClO4 acid digestion, HCl leach and ICP-AES (method ME-ICP61).

About Lion One Metals Limited

Lion One’s flagship asset is 100% owned, fully permitted high grade Tuvatu Alkaline Gold Project, located on the island of Viti Levu in Fiji. Lion One envisions a low-cost high-grade underground gold mining operation at Tuvatu coupled with exciting exploration upside inside its tenements covering the entire Navilawa Caldera, an underexplored yet highly prospective 7km diameter alkaline gold system. Lion One’s CEO Walter Berukoff leads an experienced team of explorers and mine builders and has owned or operated over 20 mines in 7 countries. As the founder and former CEO of Miramar Mines, Northern Orion, and La Mancha Resources, Walter is credited with building over $3 billion of value for shareholders.

On behalf of the Board of Directors of
Lion One Metals Limited
Walter Berukoff
Chairman and CEO

For further information
Contact Investor Relations
Toll Free (North America) Tel: 1-855-805-1250
Email: info@liononemetals.com
Website: www.liononemetals.com

Neither the TSX Venture Exchange nor its Regulation Service Provider 
accepts responsibility for the adequacy or accuracy of this release.

This press release may contain statements that may be deemed to be “forward-looking statements” within the meaning of applicable Canadian securities legislation. All statements, other than statements of historical fact, included herein are forward looking information. Generally, forward-looking information may be identified by the use of forward-looking terminology such as “plans”, “expects” or “does not expect”, “proposed”, “is expected”, “budget”, “scheduled”, “estimates”, “forecasts”, “intends”, “anticipates” or “does not anticipate”, or “believes”, or variations of such words and phrases, or by the use of words or phrases which state that certain actions, events or results may, could, would, or might occur or be achieved. This forward-looking information reflects Lion One Metals Limited’s current beliefs and is based on information currently available to Lion One Metals Limited and on assumptions Lion One Metals Limited believes are reasonable. These assumptions include, but are not limited to, the actual results of exploration projects being equivalent to or better than estimated results in technical reports, assessment reports, and other geological reports or prior exploration results. Forward-looking information is subject to known and unknown risks, uncertainties and other factors that may cause the actual results, level of activity, performance or achievements of Lion One Metals Limited or its subsidiaries to be materially different from those expressed or implied by such forward-looking information. Such risks and other factors may include, but are not limited to: the stage development of Lion One Metals Limited, general business, economic, competitive, political and social uncertainties; the actual results of current research and development or operational activities; competition; uncertainty as to patent applications and intellectual property rights; product liability and lack of insurance; delay or failure to receive board or regulatory approvals; changes in legislation, including environmental legislation, affecting mining, timing and availability of external financing on acceptable terms; not realizing on the potential benefits of technology; conclusions of economic evaluations; and lack of qualified, skilled labour or loss of key individuals. Although Lion One Metals Limited has attempted to identify important factors that could cause actual results to differ materially from those contained in forward-looking information, there may be other factors that cause results not to be as anticipated, estimated or intended. Accordingly, readers should not place undue reliance on forward-looking information. Lion One Metals Limited does not undertake to update any forward-looking information, except in accordance with applicable securities laws.

To view the source version of this press release, please visit https://www.newsfilecorp.com/release/125923

Categories
Energy Junior Mining Precious Metals

Palladium: The Secret Weapon in Fighting Pollution

Source: https://www.visualcapitalist.com/palladium-the-secret-weapon-in-fighting-pollution/

Despite the growing hype around electric vehicles, conventional gas-powered vehicles are expected to be on the road well into the future.

As a result, exhaust systems will continue to be a critical tool in reducing harmful air pollution.

The Power of Palladium

Today’s infographic comes to us from North American Palladium, and it demonstrates the unique properties of the precious metal, and how it’s used in catalytic converters around the world.

In fact, palladium enables car manufacturers to meet stricter emission standards, making it a secret weapon for fighting pollution going forward.

Palladium: The Secret Weapon in Fighting Pollution

The world is in critical need of palladium today.

It’s the crucial metal in reducing harmful emissions from gas powered vehicles—as environmental standards tighten, cars are using more and more palladium, straining global supplies.

What is Palladium?

Palladium is one of six platinum group metals which share similar chemical, physical, and structural features. Palladium has many uses, but the majority of global consumption comes from the autocatalyst industry.

In 2018, total gross demand for the metal was 10,121 million ounces (Moz), of which 8,655 Moz went to autocatalysts. These were the leading regions by demand:

  • North America: 2,041 Moz
  • Europe: 1,883 Moz
  • China: 2,117 Moz
  • Japan: 859 Moz
  • Rest of the World: 1,755 Moz

Catalytic Converters: Palladium vs. Platinum

The combustion of gasoline creates three primary pollutants: hydrocarbons, nitrogen oxides, and carbon monoxide. Catalytic converters work to alter these poisonous and often dangerous chemicals into safer compounds.

In order to control emissions, countries around the world have come up with strict emissions standards that auto manufacturers must meet, but these are far from the reality of how much pollutants are emitted by drivers every day.

Since no one drives in a straight line or in perfect conditions, stricter emissions testing is coming into effect. Known as Real Driving Emissions (RDE), these tests reveal that palladium performs much better than platinum in a typical driving situation.

In addition, the revelation of the Volkswagen emission scandal (known as Dieselgate) further undermines platinum use in vehicles. As a result, diesel engines are being phased out in favor of gas-powered vehicles that use palladium.

Where does Palladium Come From?

If the world is using all this palladium, where is it coming from?

Approximately, 90% of the world’s palladium production comes as a byproduct of mining other metals, with the remaining 10% coming from primary production.

In 2018, there was a total of 6.88 million ounces of mine supply primarily coming from Russia and South Africa. Conflicts in these jurisdictions present significant risks to the global supply chain. There are few North American jurisdictions, such as Ontario and Montana, which present an opportunity for more stable primary production of palladium.

Long Road to Extinction

The current price of palladium is driven by fundamental supply and demand issues, not investor speculation. Between 2012 and 2018, an accumulated deficit of five million ounces has placed pressures on readily available supplies of above-ground palladium.

Vehicles with internal combustion engines (ICE) will continue to dominate the roads well into the future. According to Bloomberg New Energy Finance, it will not be until 2040 that ICE vehicles will dip below 50% of new car sales market, in favor of plug-in and hybrid vehicles. Stricter emissions standards will further bolster palladium demand.

The world needs stable and steady supplies of palladium today, and well into the future.

Categories
Energy Junior Mining Precious Metals

Silver Demand and Supply Trends to Watch

BY MARIA SMIRNOVA | THURSDAY, MAY 26, 2022

My colleague Paul Wong wrote about silver’s recent flat performance in his recent monthly, April Pressures Risk Assets. Wong aptly explained silver’s interesting role: “Silver has a distinct duality pricing function that, at times, may be contradictory due to its industrial component and its monetary role.”

In this report, we provide our current outlook for silver. Ultimately, we believe recent market dynamics are creating short-term headwinds for precious metals from a monetary standpoint, but those trends could reverse – and silver supply constraints are likely to become more relevant in the face of sustained demand, with notable momentum in silver’s industrial uses related to the green energy transition.The strength of silver’s fundamentals has been fueled by strong gains across all demand components.

Silver’s Behavior Since COVID

Silver bullion1 posted a 47% gain in 2020 (see red oval in Figure 1) and has recently been in a holding pattern. Despite this,  silver traded in the range of $22-$28 in 2021, and its average price for the year reached a nine-year high of $25.14.

Since silver’s outperformance in 2020, the global macroeconomic environment has changed dramatically and become increasingly volatile. Markets continue to grapple with the impacts of the COVID pandemic, geopolitical concerns have increased substantially, and the recent sell-off of stocks has not yet found a stopping point. Rising interest rates have created a headwind for precious metals assets, particularly gold and silver.

Silver is More Volatile than Gold

Silver’s response to current macroeconomic challenges has been to follow its traditional pattern of reacting with more volatility than gold. Silver is down modestly YTD; priced at $23.35 per ounce on December 31, 2021, it was $21.72 as of May 23, 2022, a decline of 7.02%. Gold, by contrast, gained 1.38% YTD2 through May 23. Both are strong showings, given the S&P 5003 declined 16.65% in the same period.

Figure 1. Silver Price vs. Gold Price (2000-2022)

Silver Chart Figure 1 
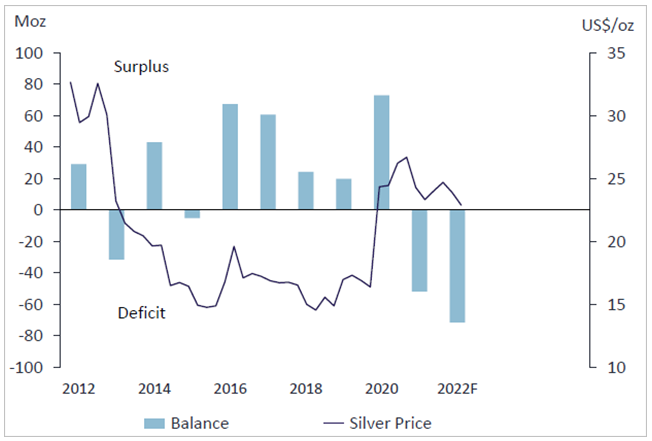
Source: Bloomberg. Data as of 4/30/2022. Included for illustrative purposes only. Past performance is no guarantee of future results.
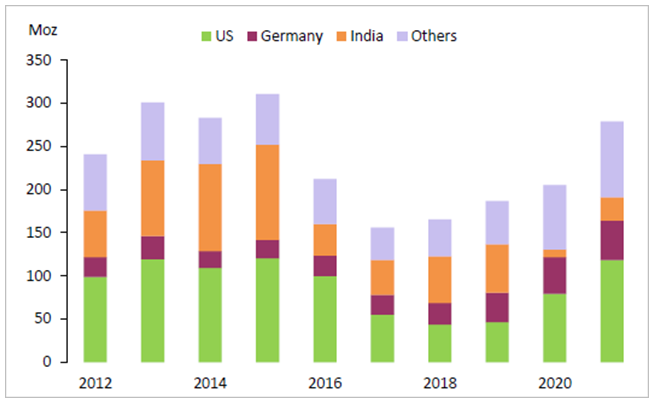
But to fully understand our current positive outlook for silver, we should revisit the supply-demand dynamics of the silver market — the fundamental relationship that directs long-term pricing trends. To assess these dynamics, we looked to the annual silver outlook published by the Silver Institute and Metals Focus in April, the World Silver Survey 2022.

Although the risk-off tenor of the moment may be a headwind for short-term silver pricing trends, over the longer term, we believe silver supply constraints will become more relevant in the face of sustained, growing demand.

Silver Supply Headwinds in the Post-COVID Era

As expected on the back of silver’s price rise in 2020, silver mining rebounded in 2021 — but to a lesser degree than forecasted. Mine production was up about 5% in 2021 from 2020 levels. Recycling volumes grew by 7% as higher pricing attracted more scrap to the market. Still, Metals Focus analysts had predicted growth for mining supply to be higher, in the range of 8%. As shown in Figure 2, silver supplies have dropped into a deficit since last year, and Metals Focus analysts predict another sizeable deficit of 72 million ounces in 2022.

Figure 2. Silver Supply Dives into Deficit in 2021

Silver Chart Figure 2
Source: Metals Focus, April 2022. Included for illustrative purposes only. Past performance is no guarantee of future results.

In addition to tighter silver supply, silver grades have been declining for several years. Ore grades depend on several things, including rising silver prices (which make it profitable to accept lower grades) and how the silver is mined. Going forward, mining companies will likely have to invest more in exploration and development in order to increase or even maintain supply.

Figure 3. Grades of Mined Silver Ore have Declined ~55% Since 2005

Silver Chart Figure 3

Source: CPM Group. Average grade data on seven primary silvers mines unsubstantiated by SPM Group, 3/16/2021. Included for illustrative purposes only. Past performance is no guarantee of future results. 

Byproduct prices are also a big input for total silver mining activity. More than 70% of silver mining supply is a result of byproduct mining. Higher prices for byproduct metals — lead, zinc and copper, for instance — drive higher mining activity for those metals, essentially subsidizing silver mining in the process. That impact has contributed to supply in recent quarters. But, it’s a tailwind to supply that is potentially at risk. If macroeconomic conditions soften in the medium-term and price support eases for those byproduct metals, silver mining supply is also vulnerable. Without the subsidy effect of higher byproduct prices, the outlook for silver supply could be even weaker than expected.

Figure 4. Higher Prices for Byproduct Metals have Helped Silver Mining Output

Silver Chart Figure 4
Source: Bloomberg, as of 5/13/2022. Orange = Copper Futures. Green = Zinc Futures (3 month contracts). Blue = Silver Spot. Gold = Gold Spot. Included for illustrative purposes only. Past performance is no guarantee of future results.

Miners must also contend with inflation, which directly impacts their fuel costs in production and exploration. If costs are expected to increase and silver miners aren’t sufficiently confident in higher silver prices, it’s difficult to envision a scenario where they are likely to ramp up mining activity substantially. There are also continued reports of worker shortages in silver mining as the tight labor market and waves of COVID outbreaks hamper operations in some locations.

These supply trends have already resulted in a drop in global silver reserves. In 2021, 122 million ounces (Moz) of silver were added to reserves, but 270 Moz were taken in production, as shown in Figure 5. Reserves dropped by about 4% to 3,412 Moz at yearend. Exploration and discoveries were also underwhelming in 2021. Globally, total identified silver resources (excluding reserves) only grew 1% last year. At the same time, there was subdued merger and acquisition activity in 2021 in the primary silver sector, with only eight deals totaling just US$11 million.

Figure 5. Global Silver Mine Reserves Drop in 2021

Primary silver reserves declined as mining depletion exceeded additions.


Source: Metals Focus, April 2022. Included for illustrative purposes only. Past performance is no guarantee of future results.

Silver Demand: Green Technologies Support Sustained Growth

While silver supply faces some constricting trends, the rebound in demand could prove sustainable, thanks to silver’s critical role in growing green energy initiatives.

Photovoltaic demand — silver inputs for solar panel production — is a prime example, growing 13% as a category in 2021 and contributing to a new record high for global silver demand in 2021. This rebound, even in the face of the supply-chain constraints that have plagued global manufacturing since COVID began, reflects the substantial green-energy investment that is underway.

We believe this trend could drive continued demand growth even if other manufacturing activity softens incrementally. Industrial demand overall accounts for about half of annual silver demand, and photovoltaic demand is about a fifth of all industrial offtake (and growing in share, since photovoltaic is growing faster than overall industrial use at large).

Figure 6. Silver Industrial Demand Tops Pre-COVID Highs, with Higher Photovoltaic (PV) Fabrication

Silver Chart Figure 6
Source: Metals Focus, April 2022. Included for illustrative purposes only. Past performance is no guarantee of future results.

The outlook for green energy investment has only strengthened in the face of the Russia-Ukraine conflict, which is pushing global sentiment towards energy security and renewables. Vehicle electrification and renewable energy demand could have more staying power in an environment where developed economies are turning a corner toward weaker growth or even recession. Industry forecasts project that silver demand for electric vehicles is likely to eventually surpass the volume of silver used in photovoltaics. As Paul Wong discussed last month, silver prices have demonstrated a growing correlation to energy transition equities. According to Wong, “Silver pricing has become highly correlated (R-square4 of 0.82) with energy transition equities, as illustrated in Figure 7. This Energy Transition Index is comprised of 12 large ETFs in the energy transition space (solar, renewables, wind, carbon, infrastructure, uranium, etc.).”

Figure 7. Silver Correlates with Energy Transition Equities

Silver Chart Figure 7
Source: Bloomberg and Sprott Asset Management LP. Data as of 4/30/2022. Included for illustrative purposes only. You cannot invest directly in an index. Past performance is no guarantee of future results.

The Energy Transition Story is a Large Force for Silver

The current environment may be dominated by risk-off behavior, but that’s not the primary factor for longer-term silver demand, particularly given its dual nature as a precious metal and an industrial metal.

We see the energy transition story as a large force for silver demand — this year and in future years. The geopolitical issues dominating the current environment only strengthen that trend, even as they weaken other components of silver demand. The pandemic and the war in Ukraine have both served to reinforce investment in energy-transition initiatives. 

Silver is a critical component of electric vehicles (EVs), which are experiencing strong demand growth globally. EV sales are slated to represent >30% of total light-vehicle sales by 2030, mainly stemming from China, Europe and the U.S. EVs are going to require a new set of manufacturing materials versus traditional ICE (internal combustion vehicles) vehicles. Silver’s high conductivity and ductility make EVs more efficient by establishing lightweight but strong electrical connections between batteries and other car components. Battery electric vehicles use between ~25-50 grams of silver per vehicle.

At present, EV inventories remain backlogged. Ford announced in January that it would double production of its electric F-150 pickup truck to work through a three-year backlog. Tesla reported that some models were backlogged until 2023, even after price increases. Solar panels have also been backlogged in recent months, according to some reports.

Figure 8. A Surge in EVs

Silver Chart Figure 8
Source: BMO Capital Markets, HIS, CAAM, InsideEVs, Industry Reports as of 2/07/2022.

Positive Non-Industrial Demand Trends

Looking at non-industrial demand for silver, trends have been milder but positive. In photography — which represents a small and declining share of silver demand — there was a small post-COVID rebound related to the catch-up trend of X-rays in healthcare after lockdowns subsided. Jewelry and silverware are more closely tied to economic growth, and both rebounded substantially in 2021. The return of weddings and social events in India supported higher jewelry production. Italy and China also accounted for healthy rebounding demand for jewelry amid economic recoveries. Silverware also reflected these trends. However, jewelry and silverware purchases both remained below pre-COVID levels.

Physical demand for silver coins and bars is the most volatile category of demand (and hard to get real-time data for mid-year). Physical demand grew 36% in 2021 over the year prior, driving the category up to represent a full quarter of global demand for the year. Bar and coin investments have not retreated since 2016/17.

Figure 9. Silver Bar and Coin Investment Surged by 36% in 2021

Silver Chart Figure 9
Source: Metals Focus, April 2022. Included for illustrative purposes only. Past performance is no guarantee of future results.

Why We Remain Bullish on Silver

From a pricing standpoint, silver is historically undervalued relative to gold right now, and offers an attractive investment opportunity. We see a picture of silver fundamentals where supply trends cannot keep up with longer-term demand. Overall, the silver market has been in a physical deficit since 2019, and silver mine supply has been in decline since 2016. There has been a lack of funds going into silver mine development and the timelines from discovery to production have gotten longer. On the demand side, all segments of silver demand are rebounding, led by industrial, jewelry and physical investment. We continue to believe that silver is likely to benefit from supply constraints in the face of growing demand. We expect green technology and de-carbonization trends to continue and increase, even if economic growth slows globally.

1Silver bullion is measured by Bloomberg Silver (XAG Curncy) U.S. dollar spot rate.
2Gold bullion is measured by the Bloomberg GOLDS Comdty Spot Price.
3The S&P 500 or Standard & Poor’s 500 Index is a market-capitalization-weighted index of the 500 largest U.S. publicly traded companies.
4R-squared values range from 0 to 1 and are commonly stated as percentages from 0% to 100%. An R-squared of 100% means that all movements of a security (or another dependent variable) are completely explained by movements in the index (or the independent variable(s) you are interested in). Source: Investopedia.

Maria Smirnova
Maria Smirnova, MBA, CFA
Managing Director, Sprott Inc.; Senior Portfolio Manager & Chief Investment Officer, Sprott Asset Management

Read Full Bio

Sprott Physical
Silver Trust

Important Disclosure

Past performance is no guarantee of future results. You cannot invest directly in an index. Investments, commentary and statements are that of the author and may not be reflective of investments and commentary in other strategies managed by Sprott Asset Management USA, Inc., Sprott Asset Management LP, Sprott Inc., or any other Sprott entity or affiliate. Opinions expressed in this commentary are those of the author and may vary widely from opinions of other Sprott affiliated Portfolio Managers or investment professionals.

This content may not be reproduced in any form, or referred to in any other publication, without acknowledgment that it was produced by Sprott Asset Management LP and a reference to sprott.com. The opinions, estimates and projections (“information”) contained within this content are solely those of Sprott Asset Management LP (“SAM LP”) and are subject to change without notice. SAM LP makes every effort to ensure that the information has been derived from sources believed to be reliable and accurate. However, SAM LP assumes no responsibility for any losses or damages, whether direct or indirect, which arise out of the use of this information. SAM LP is not under any obligation to update or keep current the information contained herein. The information should not be regarded by recipients as a substitute for the exercise of their own judgment. Please contact your own personal advisor on your particular circumstances. Views expressed regarding a particular company, security, industry or market sector should not be considered an indication of trading intent of any investment funds managed by Sprott Asset Management LP. These views are not to be considered as investment advice nor should they be considered a recommendation to buy or sell. SAM LP and/or its affiliates may collectively beneficially own/control 1% or more of any class of the equity securities of the issuers mentioned in this report. SAM LP and/or its affiliates may hold short position in any class of the equity securities of the issuers mentioned in this report. During the preceding 12 months, SAM LP and/or its affiliates may have received remuneration other than normal course investment advisory or trade execution services from the issuers mentioned in this report.

SAM LP is the investment manager to the Sprott Physical Bullion Trusts (the “Trusts”). Important information about the Trusts, including the investment objectives and strategies, purchase options, applicable management fees, and expenses, is contained in the prospectus. Please read the document carefully before investing. Investment funds are not guaranteed, their values change frequently and past performance may not be repeated. This communication does not constitute an offer to sell or solicitation to purchase securities of the Trusts. You will usually pay brokerage fees to your dealer if you purchase or sell units of the Trusts on the Toronto Stock Exchange (“TSX”) or the New York Stock Exchange (“NYSE”). If the units are purchased or sold on the TSX or the NYSE, investors may pay more than the current net asset value when buying units or shares of the Trusts and may receive less than the current net asset value when selling them.

The risks associated with investing in a Trust depend on the securities and assets in which the Trust invests, based upon the Trust’s particular objectives. There is no assurance that any Trust will achieve its investment objective, and its net asset value, yield and investment return will fluctuate from time to time with market conditions. There is no guarantee that the full amount of your original investment in a Trust will be returned to you. The Trusts are not insured by the Canada Deposit Insurance Corporation or any other government deposit insurer. Please read a Trust’s prospectus before investing.

The information contained herein does not constitute an offer or solicitation to anyone in the United States or in any other jurisdiction in which such an offer or solicitation is not authorized or to any person to whom it is unlawful to make such an offer or solicitation. Prospective investors who are not resident in Canada or the United States should contact their financial advisor to determine whether securities of the Funds may be lawfully sold in their jurisdiction.

The information provided is general in nature and is provided with the understanding that it may not be relied upon as, nor considered to be, the rendering or tax, legal, accounting or professional advice. Readers should consult with their own accountants and/or lawyers for advice on their specific circumstances before taking any action.

Categories
Base Metals Breaking Energy Junior Mining Precious Metals

Dolly Varden: Located in a Historic Mining District

Source: https://b-tv.com/dolly-varden-located-in-a-historic-mining-district-btv-episode/

https://b-tv.com/dolly-varden-located-in-a-historic-mining-district-btv-episode/

Advancing one of the largest high-grade, undeveloped precious metal assets in BC’s Golden Triangle

Dolly Varden is a silver and gold exploration company focused on advancing it’s 100% held Kitsault Valley Project located in the southern tip of BC’s Golden Triangle. The project was formed by combining the Dolly Varden and Homestake Ridge projects on February 25, 2022.

Dolly Varden Resource:

The Dolly Varden comprises the 88 sq. km southern half of the Company’s 163 sq. km. Kitsault Valley project located in the Golden Triangle of Northwest British Columbia. It features a high-grade 100% silver resource. It includes four known precious metal deposits: Wolf, North Star, Dolly Varden and Torbrit.

Homestake Ridge Resources:

Homestake Ridge comprises the 75 sq. km. northern half of the Company’s 163 sq. km. Kitsault Valley project located in the Golden Triangle of Northwest British Columbia and features a high-grade gold and silver resource. It includes three known precious metal deposits: Homestake Main, Homestake Silver and South Reef. More than 90,000 metres in 275 holes have been drilled at Homestake Ridge forming a resource of high-grade gold and silver (along with copper and lead).

For more information on Dolly Varden Silver Corp. (TSX.V: DV, OTCQX: DOLLF) please click the request investor info button.

Categories
Energy Junior Mining Precious Metals

Metallic Minerals Drills 4.6 Meters of 983 g/t Silver Equivalent at the Keno Silver Project in Yukon, Canada

VANCOUVER, BC / ACCESSWIRE / May 26, 2022 / Metallic Minerals (TSX.V:MMG)(OTCQB:MMNGF) (“Metallic Minerals“, or the “Company“) is pleased to report the final set of assay results from its 2021 drilling completed at the Company’s 100%-owned, 166-square-kilometer Keno Silver Project located within the historic, high-grade Keno Hill silver district in Canada’s Yukon Territory. These drill tests were targeted at extending high-grade silver-gold-lead-zinc mineralization at the Formo deposit in the West Keno target area, one of several advanced stage targets moving toward an initial NI 43-101 mineral resource estimate for the Keno Silver project.

Highlights

  • Drilling in 2021 and 2020 by Metallic Minerals at the Formo deposit intercepted both high-grade Keno-style Ag-Au-Pb-Zn veins and broader zones of potentially bulk mineable mineralization.
  • FOR21-05 returned three intervals at over 1,000 g/t silver equivalent (“Ag Eq”) from 92.7 m to 115.5 m for a total of 22.8 m grading 219.5 g/t Ag Eq including 0.5 m of 1,657.8 g/t Ag Eq with up to 17 g/t Au, 0.7 m of 1,408.8 g/t Ag Eq and 0.5 m of 1,649.9 g/t Ag Eq.
  • FOR21-06 intercepted multiple zones of mineralization with 4.6 m of 938.3 g/t Ag Eq including 3,229.9 g/t Ag Eq over 1.0 m within a broader zone of 11.4 m grading 413.7 g/t Ag Eq.

The Formo target area hosts multiple parallel vein structures and mineralized zones within a broader structural envelope that remains open to expansion and shows excellent opportunities for resource delineation. Results from 2021 drilling intercepted extremely high grades, including FOR21-05 returning three intervals over 1,000 g/t silver Ag Eq and FOR21-06 with 3,229.9 g/t Ag Eq over 1.0 m within an interval of 4.6 m of 938.3 g/t Ag Eq (see Table 1 below). Both zones were encountered at shallow depths of less than 150 m down hole and these intersections extend high-grade silver mineralization below the 2020 drilling and the historically productive Formo mine. Geophysical and geochemical surveys, enhanced by the 2021 fieldwork, demonstrate significant resource potential opportunities in the Formo target area.

The Formo vein structure lies at the intersection of a north-easterly extension of the Bermingham-Calumet and the Elsa vein system, which are hosts to the some of the largest historic producing mines and current resources and reserves in the Keno Hill silver district (see Figure 1). The Formo Target remains open for expansion along trend and down dip and has several untested surface targets.

Metallic Minerals President, Scott Petsel, stated, “These exciting results from this most recent follow-up drilling program at the Formo target area in the western Keno Hill District, combined with the exceptional 2020 drill results, demonstrate the potential to delineate significant, high-grade resources at the Keno Silver project. Our team has done remarkable work to build on our understanding of the geology and the important controls to mineralization in the highly productive Keno Hill silver district.”

“As we prepare to embark on our upcoming exploration campaign, we recognize the importance of moving toward the definition of an inaugural resource estimates at Keno Silver, with Formo and Caribou being the two most advanced in that regard. We are also very focused on and enthusiastic about conducting robust follow-up work on our recent discoveries of both high-grade silver veins and bulk mineable mineralization in the East Keno area. We expect to provide updates with respect to planned programs at both Keno Silver and the La Plata project in Colorado over the coming weeks and look forward to meeting with investors during the upcoming Prospectors and Developers Conference in Toronto in mid-June.”

Upcoming Events

PDAC 2022 – Metallic will join fellow Metallic Group members at PDAC in Toronto, May 13-15 (Booth IE2851).

Yukon Property Tours & Conference – Metallic will be in Dawson City June 20-24 for the 2022 Yukon Property Tours

Figure 1. Keno Silver Project

Metallic Minerals Corp., Wednesday, May 25, 2022, Press release picture

West Keno Exploration Program and Formo Target

The Western Keno Hill district is host to the largest historic production and current resources in the prolific Keno Hill silver district. The Formo target is located at the intersection of a north-easterly structural zone extending from the Hector-Calumet mine, which was the largest producer in the district producing nearly 100 million ounces of silver and the Elsa structural trend, which was the second largest silver producer in the district (see Figure 2). The historic Formo mine produced silver at various times since the 1930s from high-grade vein structures that graded an average of over 5,000 g/t silver1. The majority of this historic production came from an open pit located alongside of the Silver Trail highway between the Elsa townsite and Keno City.

Metallic Minerals’ exploration efforts at the Formo target area have integrated recent drilling with surface and underground sampling into a 3D geologic model, along with multi-spectral studies and geophysical surveys covering the area (see Figure 3). In addition to the mineralization at the known Formo deposit, two new surface targets have been identified through surface soil and rock sampling along the same structural corridors that show potential to host high-grade and bulk tonnage Keno-style Ag-Au-Pb-Zn. The opportunity to significantly expand the known mineralization defined from underground sampling and surface drilling, as well as the potential to define new high-grade deposits along the main mineralized structural corridor, positions Formo as a top priority target for near-term resource definition at the Keno Silver project.

Table 1 – Significant Drill Results from 2020-2021 at the Formo Target Area

DDH Hole IDFrom (m)To (m)Width (m)Ag Eq (g/t)Ag (g/t)Au (g/t)Pb (%)Zn (%)
FOR21-0592.7115.522.8219.5690.40.302.07
94.695.10.51,657.82517.00.010.44
98.81089.2430.51640.10.694.85
102.4103.10.71,408.83610.02.1720.09
107107.50.51,649.94210.11.5324.20
FOR21-0696971.0221.81550.00.451.03
111.612311.4413.72340.01.972.07
114.41194.6938.35280.14.484.82
1161171.03,229.91,9780.413.0914.97
121.21231.8202.81280.01.000.76
FOR-20-00150.9576.1284.52180.00.31.14
including50.953.953.05447.53690.00.111.52
FOR-20-00249.4552.32.8548220.00.180.39
FOR-20-00396100.14.12,536.01,1650.021.7411.32
including96993.03,425.91,5680.029.4515.35
FOR-20-00489.895.96.1367.62250.02.041.35
including91.893.71.9698.44540.03.482.32
including93.293.70.51,083.66010.07.334.25
FOR-20-005104.76105.450.69365.01460.01.323.52
152.17152.670.585.560.40.010.76
FOR-20-006137.63139.782.15740.63320.03.066.04
including139.13139.780.652,255.91,0010.18.9218.92
FOR-20-00798.198.650.5577120.00.121.2
107.65108.150.586.1460.20.240.34
125.55126.050.575.510.201.23
FOR-20-008116.45116.950.5289.21780.12.20.42
including168.6169.61.079.2570.00.250.25
FOR-20-00969.770.140.4467.4150.00.210.91
113.2113.70.5211.6260.40.063
FOR-20-01155.359.74.475.630.00.050.04
including57.758.60.9307.71950.02.790.1

Silver equivalent (Ag Eq) values assume Ag $19/oz, Pb $1.05/lb, Zn $1.30/lb, Au $1,800/oz and 100% metallurgical recovery. Sample intervals are based on measured drill intersect lengths and are believed to be representative of true widths.

Figure 2 – West Keno Plan Map

Metallic Minerals Corp., Wednesday, May 25, 2022, Press release picture

Figure 3 – Formo Vein Long Section (Looking NW)

Metallic Minerals Corp., Wednesday, May 25, 2022, Press release picture

About Metallic Minerals

Metallic Minerals Corp. is a growth-stage exploration company, focused on high-grade silver and gold projects in underexplored, brownfields mining districts of North America. Our objective is to create shareholder value through a systematic, entrepreneurial approach to exploration in the Keno Hill silver district, La Plata silver-gold-copper district, and Klondike gold district through new discoveries and advancing resources to development. Metallic Minerals has consolidated the second-largest land position in the historic Keno Hill silver district of Canada’s Yukon Territory, directly adjacent to Alexco Resource Corp’s operations, with nearly 300 million ounces of high-grade silver in past production and current M&I resources. In addition, exploration at the recently acquired La Plata silver-gold-copper project in southwestern Colorado is targeting a silver and gold-enriched copper porphyry and adjacent high-grade silver and gold epithermal systems. The Company also continues to add new production royalty leases on its holdings in the Klondike gold district in the Yukon. All three districts have seen significant mineral production and have existing infrastructure, including power and road access. Metallic Minerals is led by a team with a track record of discovery and exploration success on several major precious and base metal deposits, as well as having large-scale development, permitting and project financing expertise.

About the Metallic Group of Companies

The Metallic Group is a collaboration of leading precious and base metals exploration and development companies, with a portfolio of large, brownfields assets in established mining districts adjacent to some of the industry’s highest-grade producers of silver and gold, platinum and palladium, and copper. Member companies include Metallic Minerals in the Yukon’s high-grade Keno Hill silver district and La Plata silver-gold-copper district of Colorado, Granite Creek Copper in the Yukon’s Minto copper district, and Group Ten Metals in the Stillwater PGM-nickel-copper district of Montana and Kluane district in the Yukon. The founders and team members of the Metallic Group include highly successful explorationists formerly with some of the industry’s leading explorer/developers and major producers. With this expertise, the companies are undertaking a systematic approach to exploration and development using new models and technologies to facilitate discoveries in these proven, but under-explored, mining districts. Members of the Metallic Group have been recognized as recipients of awards for excellence in environmental stewardship demonstrating commitment to responsible resource development and appropriate ESG practices. The Metallic Group is headquartered in Vancouver, BC, Canada, and its member companies are listed on the Toronto Venture, US OTCQB and Frankfurt stock exchanges.

FOR FURTHER INFORMATION, PLEASE CONTACT:

Website: mmgsilver.com
Email: cackerman@mmgsilver.com
Phone: 604-629-7800
Toll Free: 1-888-570-4420

Qualified Person

The disclosure in this news release of scientific and technical information regarding exploration projects on Metallic Minerals’ mineral properties has been reviewed and approved by Scott Petsel, P.Geo., President, who is a Qualified Person as defined by National Instrument 43-101 – Standards of Disclosure for Mineral Projects (“NI 43-101”).

Quality Assurance / Quality Control

All samples were assayed by 36 Element Aqua Regia Digestion ICP-MS methods at Bureau Veritas labs in Vancouver. with sample preparation in Whitehorse, Yukon and geochemical analysis in Vancouver, British Columbia. Samples with over limit silver and gold were re-analyzed using a 30-gram fire assay fusion with a gravimetric finish. Over-limit lead and zinc samples were analyzed by multi-acid digestion and atomic absorption spectrometry. All results have passed the QAQC screening by the lab and the company utilized a quality control and quality assurance protocol for the project, including blank, duplicate, and standard reference samples.

Forward-Looking Statements

Forward Looking Statements: This news release includes certain statements that may be deemed “forward-looking statements”. All statements in this release, other than statements of historical facts including, without limitation, statements regarding potential mineralization, historic production, estimation of mineral resources, the realization of mineral resource estimates, interpretation of prior exploration and potential exploration results, the timing and success of exploration activities generally, the timing and results of future resource estimates, permitting time lines, metal prices and currency exchange rates, availability of capital, government regulation of exploration operations, environmental risks, reclamation, title, and future plans and objectives of the company are forward-looking statements that involve various risks and uncertainties. Although Metallic Minerals believes the expectations expressed in such forward-looking statements are based on reasonable assumptions, such statements are not guarantees of future performance and actual results or developments may differ materially from those in the forward-looking statements. Forward-looking statements are based on a number of material factors and assumptions. Factors that could cause actual results to differ materially from those in forward-looking statements include failure to obtain necessary approvals, unsuccessful exploration results, changes in project parameters as plans continue to be refined, results of future resource estimates, future metal prices, availability of capital and financing on acceptable terms, general economic, market or business conditions, risks associated with regulatory changes, defects in title, availability of personnel, materials and equipment on a timely basis, accidents or equipment breakdowns, uninsured risks, delays in receiving government approvals, unanticipated environmental impacts on operations and costs to remedy same, and other exploration or other risks detailed herein and from time to time in the filings made by the companies with securities regulators. Readers are cautioned that mineral resources that are not mineral reserves do not have demonstrated economic viability. Mineral exploration and development of mines is an inherently risky business. Accordingly, the actual events may differ materially from those projected in the forward-looking statements. For more information on Metallic Minerals and the risks and challenges of their businesses, investors should review their annual filings that are available at www.sedar.com

Neither the TSX Venture Exchange nor its Regulation Services Provider (as that term is defined in the policies of the TSX Venture Exchange) accepts responsibility for the adequacy or accuracy of this release.

SOURCE: Metallic Minerals Corp.

Categories
Base Metals Energy Junior Mining

Noram Receives Results for CVZ-71: High-Grade Intercept of 280.0 ft (85.3 m) Averaging 1050 ppm & High of 1560 ppm

VANCOUVER, BC / ACCESSWIRE / May 26, 2022 / Sandy MacDougall, CEO of Noram Lithium Corp. (“Noram” or the “Company“) (TSXV:NRM)(OTCQB:NRVTF)(Frankfurt:N7R) is pleased to announce the successful completion of CVZ-71 (PH-10) and release of the final assay results. The Company completed core hole CVZ-71 at a depth of 453.5 feet (138.2 m). Sampling for assay began at 30 ft (9.1 m) and continued to the bottom of the hole. An interval thickness of 280 ft (85.3 m) was intersected from 140 ft (42.7 m) to 420 ft (128.0 m). The hole ended in mineralization and the weighted average lithium values present were as follows:

Noram Lithium Corp., Thursday, May 26, 2022, Press release picture

“As Noram moves toward completion of the Zeus property’s PFS, now on schedule for completion in October 2022, the assay results from CVZ-71 provide another long, high-grade intercept to the list of drillholes that is expected to upgrade a major portion of the deposit from an inferred resource to the indicated resource category” comments Brad Peek, VP of Exploration and geologist on all six phases of Noram’s Clayton Valley exploration drilling.

Noram Lithium Corp., Thursday, May 26, 2022, Press release picture

Table 1 – Sample results from CVZ-71 from 30 ft (9.1 m) to depth of 453.5 ft (138.2 m).https://embed.fireplace.yahoo.com/embed?ctrl=Monalixa&m_id=monalixa&m_mode=document&site=sports&os=android&pageContext=%257B%2522ctopid%2522%253A%25221542500%253B1577000%2522%252C%2522hashtag%2522%253A%25221542500%253B1577000%2522%252C%2522wiki_topics%2522%253A%2522Clayton_Valley_Charter_High_School%253BLithium_carbonate%253BNor-Am_Cup%253BMineral_resource_classification%2522%252C%2522lmsid%2522%253A%2522a077000000LnOyOAAV%2522%252C%2522revsp%2522%253A%2522accesswire.ca%2522%252C%2522lpstaid%2522%253A%25221869a662-45fa-37a9-a47a-ba4e81a1165c%2522%252C%2522pageContentType%2522%253A%2522story%2522%257D

The samples were analyzed by the ALS laboratory in Reno, Nevada. Certified reference standard samples were included in the sample batch and returned values that were within their expected ranges.

The technical information contained in this news release has been reviewed and approved by Brad Peek., M.Sc., CPG, who is a Qualified Person with respect to Noram’s Clayton Valley Lithium Project as defined under National Instrument 43-101.

About Noram Lithium Corp.

Noram Lithium Corp. (TSXV:NRM),(OTCQB: NRVTF),(Frankfurt:N7R) is a well-financed Canadian based advanced Lithium development stage company with less than 90 million shares issued and a fully funded treasury. Noram is aggressively advancing its Zeus Lithium Project in Nevada from the development-stage level through the completion of a Pre-Feasibility Study in 2022.

The Company’s flagship asset is the Zeus Lithium Project (“Zeus”), located in Clayton Valley, Nevada. The Zeus Project contains a current 43-101 measured and indicated resource estimate* of 363 million tonnes grading 923 ppm lithium, and an inferred resource of 827 million tonnes grading 884 ppm lithium utilizing a 400 ppm Li cut-off. In December 2021, a robust PEA** indicated an After-Tax NPV(8) of US$1.3 Billion and IRR of 31% using US$9,500/tonne Lithium Carbonate Equivalent (LCE). Using the LCE long term forecast of US$14,000/tonne, the PEA indicates an NPV (8%) of approximately US$2.6 Billion and an IRR of 52% at US$14,000/tonne LCE.

Please visit our web site for further information: www.noramlithiumcorp.com.

ON BEHALF OF THE BOARD OF DIRECTORS

Sandy MacDougall
Chief Executive Officer and Director
C: 778.999.2159

For additional information please contact:
Peter A. Ball
President and Chief Operating Officer
peter@noramlithiumcorp.com
C: 778.344.4653

Neither the TSX Venture Exchange nor its Regulation Services Provider (as that term is defined in the policies of the TSX Venture Exchange) accepts responsibility for the adequacy or accuracy of this release. This news release may contain forward-looking information which is not comprised of historical facts. Forward-looking information involves risks, uncertainties and other factors that could cause actual events, results, performance, prospects and opportunities to differ materially from those expressed or implied by such forward-looking information. Forward-looking information in this news release includes statements regarding, among other things, the completion transactions completed in the Agreement. Factors that could cause actual results to differ materially from such forward-looking information include, but are not limited to, regulatory approval processes. Although Noram believes that the assumptions used in preparing the forward-looking information in this news release are reasonable, including that all necessary regulatory approvals will be obtained in a timely manner, undue reliance should not be placed on such information, which only applies as of the date of this news release, and no assurance can be given that such events will occur in the disclosed time frames or at all. Noram disclaims any intention or obligation to update or revise any forward-looking information, whether as a result of new information, future events or otherwise, other than as required by applicable securities laws. *Updated Lithium Mineral Resource Estimate, Zeus Project, Clayton Valley, Esmeralda County, Nevada, USA (August 2021) **Preliminary Economic Assessment Zeus Project, ABH Engineering (December 2021).

SOURCE:Noram Lithium Corp.


View source version on accesswire.com:
https://www.accesswire.com/702737/Noram-Receives-Results-for-CVZ-71-High-Grade-Intercept-of-2800-ft-853-m-Averaging-1050-ppm-High-of-1560-ppm

Categories
Junior Mining Precious Metals

Goldshore Resources Announces Public (NSERC & MITACS) and Educational (Lakehead University) Tri-Party Institutional Partnership with Alliance Grant

Vancouver, British Columbia–(Newsfile Corp. – May 25, 2022) – Goldshore Resources Inc. (TSXV: GSHR ) (OTCQB: GSHRF) (FSE: 8X00) (“Goldshore” or the “Company“), is pleased to announce that the Lakehead University’s application for educational and public tri-party Alliance grant for its partnership with The Natural Sciences and Engineering Research Council of Canada (“NSERC“); MITACS and Lakehead University has been granted in the amount of CA$ 83,750 for 2022 and CA$ 76,250 for 2023.

The Alliance grant encourages university researchers to collaborate with partner organizations (in this case Goldshore Resources), which can be from the private, public or not-for-profit sectors. These grants support research projects led by strong, complementary, collaborative teams that will generate new knowledge and accelerate the application of research results to create benefits for Canada.

Research supported by Alliance grants will:

  • generate new knowledge and/or technology to address complex challenges
  • create economic, social and/or environmental benefits
  • contribute to Canada’s long-term competitiveness
  • support public policy
  • train new researchers in areas that are important to Canada and to the partner organizations
  • draw on diverse perspectives and skill sets to accelerate the translation and application of research results

Pete Flindell, VP Exploration for Goldshore Resources, said, “This study will investigate the volcanic and structural architecture, intrusive character, petrography, and alteration chemistry of our portion of the Shebandowan greenstone belt in the Wawa sub-province of Northern Ontario. The aim is to better constrain gold mineralization at Moss Lake and to develop vectors towards mineralization that we will use to grow our resource inventory.”

Dr Pete Hollings, Professor of Geology and NOHFC IRC Chair in Mineral Exploration at Lakehead University commented: “The principal methods employed in this study will be fundamental geological mapping and logging, combined with traditional and state-of-the-art analytical techniques, which will characterize the structures, mineralization, and alteration system associated with mineralization. The research team will be trained to use modern digital field methods and high-quality microanalytical instruments, making them highly skilled assets for industry, academia, or government surveys, while generating valuable data sets that Goldshore can rapidly employ to aid their exploration.”

The Natural Sciences and Engineering Research Council of Canada is the major federal agency responsible for funding natural sciences and engineering research in Canada. NSERC directly funds university professors and students as well as Canadian companies to perform research and training.

MITACS is a nonprofit national research organization that, in partnerships with Canadian academia, private industry and government, operates research and training programs in fields related to industrial and social innovation.

Dr. Noah Philips and Dr. Pete Hollings are excited to be starting a new partnership with Goldshore Resources Inc, through their wholly-owned subsidiary, Moss Lake Project Inc. Thanks to CA$ 80,000 in support from Goldshore, which was matched by CA$160,000 from an NSERC Alliance grant and CA$ 75,000 from MITACS. The Lakehead University researchers will lead a team of one Post-Doctoral Fellow and two MSc (Masters of Science) students in an investigation of the gold and related mineralization on the Moss Lake property.

About Goldshore

Goldshore is an emerging junior gold development company, and owns the Moss Lake Gold Project located in Ontario. Wesdome Gold Mines Ltd. is currently a strategic shareholder of Goldshore with an approximate 22% equity position in the Company. Well-financed and supported by an industry-leading management group, board of directors and advisory board, Goldshore is positioned to advance the Moss Lake Gold Project through the next stages of exploration and development.

About the Moss Lake Gold Project

The Moss Lake Gold Project is located approximately 100 km west of the city of Thunder Bay, Ontario. It is accessed via Highway 11 which passes within 1 km of the property boundary to the north. The Moss Lake Gold Project covers 14,292 hectares and consists of 282 unpatented and patented mining claims.

Moss Lake hosts a number of gold and base metal rich deposits including the Moss Lake Deposit, the East Coldstream Deposit (Table 1), the historically producing North Coldstream Mine (Table 2), and the Hamlin Zone, all of which occur over a mineralized trend exceeding 20 km in length. A historical preliminary economic assessment was completed on Moss Lake in 2013 and published by Moss Lake Gold1. A historical mineral resource estimate was completed on the East Coldstream Deposit in 2011 by Foundation Resources Inc2,3. In addition to these zones, the Moss Lake Gold Project also hosts a number of under-explored mineral occurrences which are reported to exist both at surface and in historically drilled holes. The Moss Lake Deposit is a shear-hosted disseminated-style gold deposit which outcrops at surface. It has been drilled over a 2.5 km length and to depths of 300 m with 376 holes completed between 1983 and 2017. The last drilling program conducted in 2016 and 2017 by Wesdome Gold Mines Ltd. (“Wesdome“), which consisted of widely spaced holes along the strike extension of the deposit was successful in expanding the mineralized footprint and hydrothermal system 1.6 km to the northeast. Additionally, the deposit remains largely open to depth. In 2017, Wesdome completed an induced polarization survey which traced the potential extensions of pyrite mineralization associated with the Moss Lake Deposit over a total strike length of 8 km and spanning the entire extent of the survey grids.

The East Coldstream Deposit is a shear-hosted disseminated-style gold deposit which locally outcrops at surface. It has been drilled over a 1.3 km length and to depths of 200 m with 138 holes completed between 1988 and 2017. The deposit remains largely open at depth and may have the potential for expansion along strike. Historic drill hole highlights from the East Coldstream Deposit include 4.86 g/t Au over 27.3 m in C-10-15.

The historically producing North Coldstream Mine is reported to have produced significant amounts of copper, gold and silver4 from mineralization with potential iron-oxide-copper-gold deposit style affinity. The exploration potential immediately surrounding the historic mining area is not currently well understood and historic data compilation is required.

The Hamlin Zone is a significant occurrence of copper and gold mineralization, and also of potential iron-oxide-copper-gold deposit style affinity. Between 2008 and 2011, Glencore tested Hamlin with 24 drill holes which successfully outlined a broad and intermittently mineralized zone over a strike length of 900 m. Historic drill hole highlights from the Hamlin Zone include 0.9 g/t Au and 0.35% Cu over 150.7 m in HAM-11-75.

The Moss Lake, East Coldstream and North Coldstream deposits sit on a mineral trend marked by a regionally significant deformation zone locally referred to as the Wawiag Fault Zone in the area of the Moss Lake Deposit. This deformation zone occurs over a length of approximately 20 km on the Moss Lake Gold Project and there is an area spanning approximately 7 km between the Moss Lake and East Coldstream deposits that is significantly underexplored.

Table 1: Historical Mineral Resources1,2,3

INDICATEDINFERRED
DepositTonnesAu g/tAu ozTonnesAu g/tAu oz
Moss Lake Deposit1 (2013 resource estimate)
Open Pit Potential39,795,0001.11,377,30048,904,0001.01,616,300
Underground Potential1,461,1002.9135,400
Moss Lake Total39,795,0001.11,377,30050,364,0001.11,751,600
East Coldstream Deposit2 (2011 resource estimate)
East Coldstream Total3,516,7000.8596,40030,533,0000.78763,276
Combined Total43,311,7001.081,473,70080,897,0000.982,514,876


Notes:

(1) Source: Poirier, S., Patrick, G.A., Richard, P.L., and Palich, J., 2013. Technical Report and Preliminary Economic Assessment for the Moss Lake Project, 43-101 technical report prepared for Moss Lake Gold Mines Ltd. Moss Lake Deposit resource estimate is based on 0.5 g/t Au cut-off grade for open pit and 2.0 g/t Au cut-off grade for underground resources.

(2) Source: McCracken, T., 2011. Technical Report and Resource Estimate on the Osmani Gold Deposit, Coldstream Property, Northwestern Ontario, 43-101 technical report prepared for Foundation Resources Inc. and Alto Ventures Ltd. East Coldstream Deposit resource estimate is based on a 0.4 g/t Au cut-off grade.

(3) The reader is cautioned that the above referenced “historical mineral resource” estimates are considered historical in nature and as such is based on prior data and reports prepared by previous property owners. A qualified person has not done sufficient work to classify the historical estimates as current resources and Goldshore is not treating the historical estimates as current resources. Significant data compilation, re-drilling, re-sampling and data verification may be required by a qualified person before the historical estimate on the Moss Lake Gold Project can be classified as a current resource. There can be no assurance that any of the historical mineral resources, in whole or in part, will ever become economically viable. In addition, mineral resources are not mineral reserves and do not have demonstrated economic viability. Even if classified as a current resource, there is no certainty as to whether further exploration will result in any inferred mineral resources being upgraded to an indicated or measured mineral resource category.

Table 2: Reported Historical Production from the North Coldstream Deposit4

DepositTonnesCu %Au g/tAgCu lbsAu ozAg oz
Historical Production2,700,00001.890.565.59102,000,00044,000440,000


Note:

(4) Source: Schlanka, R., 1969. Copper, Nickel, Lead and Zinc Deposits of Ontario, Mineral Resources Circular No. 12, Ontario Geological Survey, pp. 314-316.

Peter Flindell, MAusIMM, MAIG, Vice President – Exploration of the Company, a qualified person under NI 43-101 has approved the scientific and technical information contained in this news release.

Neither the TSXV nor its Regulation Services Provider (as that term is defined in the policies of the TSXV) accepts responsibility for the adequacy or accuracy of this release.

For More Information – Please Contact:

Brett A. Richards
President, Chief Executive Officer and Director
Goldshore Resources Inc.

P. +1 604 288 4416 M. +1 905 449 1500
E. brichards@goldshoreresources.com
W. www.goldshoreresources.com

Facebook: GoldShoreRes | Twitter: GoldShoreRes | LinkedIn: goldshoreres

Cautionary Note Regarding Forward-Looking Statements

This news release contains statements that constitute “forward-looking statements.” Such forward looking statements involve known and unknown risks, uncertainties and other factors that may cause the Company’s actual results, performance or achievements, or developments to differ materially from the anticipated results, performance or achievements expressed or implied by such forward-looking statements. Forward looking statements are statements that are not historical facts and are generally, but not always, identified by the words “expects,” “plans,” “anticipates,” “believes,” “intends,” “estimates,” “projects,” “potential” and similar expressions, or that events or conditions “will,” “would,” “may,” “could” or “should” occur.

Forward-looking statements in this news release include, among others, statements relating to expectations regarding the exploration and development of the Moss Lake Gold Project, the use of proceeds from the Financing, and other statements that are not historical facts. By their nature, forward-looking statements involve known and unknown risks, uncertainties and other factors which may cause our actual results, performance or achievements, or other future events, to be materially different from any future results, performance or achievements expressed or implied by such forward-looking statements. Such factors and risks include, among others: the Company may require additional financing from time to time in order to continue its operations which may not be available when needed or on acceptable terms and conditions acceptable; compliance with extensive government regulation; domestic and foreign laws and regulations could adversely affect the Company’s business and results of operations; the stock markets have experienced volatility that often has been unrelated to the performance of companies and these fluctuations may adversely affect the price of the Company’s securities, regardless of its operating performance; and the impact of COVID-19.

The forward-looking information contained in this news release represents the expectations of the Company as of the date of this news release and, accordingly, is subject to change after such date. Readers should not place undue importance on forward-looking information and should not rely upon this information as of any other date. The Company undertakes no obligation to update these forward-looking statements in the event that management’s beliefs, estimates or opinions, or other factors, should change.

This news release does not constitute an offer to sell, or a solicitation of an offer to buy, any securities in the United States. The securities have not been and will not be registered under the United States Securities Act of 1933, as amended (the “U.S. Securities Act”) or any state securities laws and may not be offered or sold within the United States or to U.S. Persons unless registered under the U.S. Securities Act and applicable state securities laws or an exemption from such registration is available.

To view the source version of this press release, please visit https://www.newsfilecorp.com/release/125257

Categories
Energy Junior Mining Precious Metals Uncategorized

Collective Mining Outlines Multiple, High-Grade Vein Systems at Olympus with Assay Results from Channel Sampling of up to 221 g/t Gold and 812 g/t Silver

Collective Mining Ltd.

Collective Mining Ltd.

Figure 1

Plan View of the Guayabales Project and the Olympus South Target

Figure 2

Photos of High-Grade Polymetallic Grab Samples Taken at Olympus

TORONTO, May 12, 2022 (GLOBE NEWSWIRE) — Collective Mining Ltd. (TSXV: CNL) (“Collective” or the “Company”) is pleased to announce high-grade gold and silver channel sample assay results from its grassroot generated Olympus target (“Olympus”) within the Guayabales project (“Guayabales”), Colombia. The Company presently has three diamond drill rigs operating at Guayabales with drills turning at the Olympus and Apollo targets as well as the newly discovered Trap target. At Olympus, the Company is focused on expanding upon the recently announced discovery holes of 302 metres @ 1.11 g/t gold equivalent and 216.7 metres @ 1.08 g/t gold equivalent (refer to press release dated March 15 and May 9, 2022, respectively).

Highlights (Table 1 and Figures 1 and 2)

  • Assay results of chip channel samples taken from veins located within historical, shallow underground workings from Olympus confirm the continuation of the high-grade carbonate base metal (“CBM”) sheeted vein system into the southwest portion of the target area with results as follows:

Table 1: Chip Channel Sample Assay Results from Olympus

Sample IDAu (g/t)Ag (g/t)
R5465220.97812
R5437134.73598
R545088.28409
R521673.83675
R541259.15365
CM394838.78450
R522633.9133
R546417.0268
R54539.06353
R52245.611
R54485.28329
R54565.1789
R54675.0262
R54134.97238
R54354.39108
R54344.20193
R54172.87161
R54522.7576
R54492.65102
R52192.5754
R54571.45347

*Channel chip samples reported above are over true horizontal sampling widths of between 0.1 and 1 metre. Sample grades are uncapped
**Channel samples are representative of 2dimensional space and as a result should not be relied upon as being representative of average grades anticipated in any future resource estimate or mining scenario.
***Assay results for base metals are still pending for all samples listed.

  • Multiple CBM veins were sampled, where possible at Olympus, over an area measuring 250 metres x 250 metres from limited and partial exposures of rock in old tunnels. The CBM veins are sulphide rich and associated with intense sericite-illite alteration superimposed on porphyry diorite and mineralized, hydrothermal breccia. Porphyry-related CBM veins can demonstrate robust continuity over significant vertical and lateral dimensions.
  • Drilling, underground sampling and surface mapping to date have expanded Olympus to a target area measuring more than 1,400 metres by 900 metres, which hosts over 50 artisanal mines with over 25 veins mapped from available exposures. The Company believes that the probability is high that additional veins will be discovered as exploration ramps up. The Olympus target is open to the east, west, northwest, south and at depth.
  • Olympus now includes two mineralized zones. Both zones contain multiple porphyry and overprinting CBM veins associated with intense pyrite-sericite-carbonate alteration and hosted in a porphyry diorite (Eastern zone) and within schist country rocks intruded by porphyritic diorite (Western zone).
  • The highest-grade samples collected to date at Olympus come from areas that have yet to be drill tested by the Company. Diamond drilling completed to date has only focused on a small northern portion of the Eastern and Western zones while recent surface and underground mapping has expanded the Western zone to the west and southwest.
  • The Company is planning to move two underground rigs in Q2 into the area covered by these high-grade channel sampling results.

“With the scale of veining and alteration at Olympus and mineralized systems that come to surface, the Company now believes that we have a discovered a vein and broad mineralized system,” commented Ari Sussman, Executive Chairman. “The more exploration we undertake, the more high-grade veins we find. We will remain aggressive with drilling at Olympus and look forward to commencing the first underground drill-hole into the high-grade vein portion of the system in June 2022.”

Figure 1: Plan View of the Guayabales Project and the Olympus South Target
https://www.globenewswire.com/NewsRoom/AttachmentNg/a3099c7e-51eb-4385-89ec-620f9c6a649d

Figure 2: Photos of High-Grade Polymetallic Grab Samples Taken at Olympus
https://www.globenewswire.com/NewsRoom/AttachmentNg/cbbce069-dbb1-4ad0-b430-f28519b8285c
Veins of massive sulfides with pyrite, sphalerite, galena and chalcopyrite.

Qualified Person (QP) and NI43-101 Disclosure

David J Reading is the designated Qualified Person for this news release within the meaning of National Instrument 43-101 (“NI 43-101”) and has reviewed and verified that the technical information contained herein is accurate and approves of the written disclosure of same. Mr. Reading has an MSc in Economic Geology and is a Fellow of the Institute of Materials, Minerals and Mining and of the Society of Economic Geology (SEG).

Technical Information

Rock samples have been prepared and analyzed at SGS laboratory facilities in Medellin, Colombia and Lima, Peru. Blanks, duplicates, and certified reference standards are inserted into the sample stream to monitor laboratory performance. Crush rejects and pulps are kept and stored in a secured storage facility for future assay verification. No capping has been applied to sample composites. The Company utilizes a rigorous, industry-standard QA/QC program.

About Collective Mining Ltd.

To view the Company’s most recent investor presentation, please visit www.collectivemining.com

Collective Mining is an exploration and development company focused on identifying and exploring prospective mineral projects in South America. Founded by the team that developed and sold Continental Gold Inc. to Zijin Mining for approximately $2 billion in enterprise value, the mission of the Company is to repeat its past success in Colombia by making a significant new mineral discovery and advancing the projection to production. Management, insiders and close family and friends own approximately 40% of the outstanding shares of the Company and as a result, are fully aligned with shareholders. Collective currently holds an option to earn up to a 100% interest in two projects located in Colombia. As a result of an aggressive exploration program at both the Guayabales and San Antonio projects a total of eleven major targets have been defined. The Company is fortuitous to have made significant grassroots discoveries on both projects with discovery holes of 302 metres 1.1 g/t AuEq and 104 metres @ 1.3 g/t AuEq at the Guayabales project and 710 metres @ 0.53 AuEq at the San Antonio project. (See press releases dated October 18th and 27th, 2021 and March 15, 2022, for AuEq calculations.)

Contact Information

Collective Mining Ltd.
Steve Gold, Vice President, Corporate Development and Investor Relations
Tel. (416) 648-4065

To schedule a one-on-one meeting with management please use the following link:
https://calendly.com/collectivemining/30min?month=2021-11

FORWARD-LOOKING STATEMENTS

This news release contains certain forward-looking statements, including, but not limited to, statements about the drill programs, including timing of results, and Collective’s future and intentions. Wherever possible, words such as “may”, “will”, “should”, “could”, “expect”, “plan”, “intend”, “anticipate”, “believe”, “estimate”, “predict” or “potential” or the negative or other variations of these words, or similar words or phrases, have been used to identify these forward-looking statements. These statements reflect management’s current beliefs and are based on information currently available to management as at the date hereof.

Forward-looking statements involve significant risk, uncertainties, and assumptions. Many factors could cause actual results, performance, or achievements to differ materially from the results discussed or implied in the forward-looking statements. These factors should be considered carefully, and readers should not place undue reliance on the forward-looking statements. Although the forward-looking statements contained in this news release are based upon what management believes to be reasonable assumptions, Collective cannot assure readers that actual results will be consistent with these forward-looking statements. These forward-looking statements are made as of the date of this news release, and Collective assumes no obligation to update or revise them to reflect new events or circumstances, except as required by law.

Neither the TSXV nor its Regulation Services Provider (as that term is defined in the policies of the TSXV) accepts responsibility for the adequacy or accuracy of this news release.