Vancouver, British Columbia–(Newsfile Corp. – January 12, 2026) – Riverside Resources Inc. (TSXV: RRI) (OTCQB: RVSDF) (FSE: 5YY0) (“Riverside” or the “Company“), is pleased to outline its 2026 corporate outlook and work programs while highlighting key milestones achieved during 2025. Building on a year that saw the successful spin-out of Blue Jay Gold Corp., advancement of partner-funded work in Mexico, and a strategic investment of C$3.7 million which included Rick Rule and Sprott Wealth Management. Riverside now enters 2026 positioned to advance its key assets in the project generator and royalty portfolios.
Riverside maintains a solid balance sheet with strong cash, no debt and solid share structure with approximately 93 million shares outstanding following the December 2025 private placement. The recently completed non-brokered financing with strategic shareholders, including Rick Rule, Sprott Wealth Management, and Metallum, provides additional capital to advance key exploration, royalty, and transactional initiatives in 2026 while preserving the Company’s disciplined approach to share structure and capital allocation.
With a portfolio of projects in Canada and Mexico, a growing royalty platform anchored by Tajitos and Sugarloaf Peak (Arizona Metals Corp), and third-party funding from partners such as Questcorp Mining, Riverside will continue to focus on transactions and exploration programs that can create meaningful leverage for shareholders without overextending the treasury. This includes adding more assets this year, derisking key ones, and advancing partner-funded exploration programs as well as self-funded mineral exploration. Riverside also holds a portfolio of equity securities in partner and former partner companies which is separate from and in addition to the Company’s cash position.
“2025 was a pivotal year for Riverside as we delivered on several of the major objectives we laid out at the start of the year,” said John-Mark Staude, President and CEO of Riverside. “We completed the spin-out of Blue Jay Gold to our shareholders, marking the second time we have executed a successful spinout, the first being Capitan Silver, which also delivered a strong 2025 for its shareholders. Riverside secured an option agreement with Questcorp that funds exploration and first-phase drilling at the Union Project, and we strengthened our balance sheet through the completed strategic year-end financing. These actions place us in a strong position for 2026.”
“In 2026, we intend to keep doing what has worked for Riverside: emphasis on focused capital management, advance our best projects with our own capital and with third-party partner funding where prudent, and grow our royalty and equity portfolio exposure to potential discoveries and future value generation transactions. Our goal remains simple and opportunity-driven: to execute disciplined transactions, grow and advance our royalty interests, and pursue an exploration plan that fits Riverside’s model, while focusing on the best opportunities and working to deliver meaningful results over time.”
For an overview of Riverside’s 2025 progress and what we’re focused on heading into 2026, we encourage you to watch a short update video from President and CEO, John-Mark Staude. In the video, John-Mark highlights key milestones from the year, how our partner-funded model is advancing the portfolio, and the main priorities we’re working toward next.
Cannot view this video? Visit:
https://www.youtube.com/watch?v=BpKGz0eNqds
2026 Strategic Goals and Potential Milestones
1. Canadian Assets
Advance British Columbia Gold and REE Portfolio
Continue systematic work at Red Jacket, Revel and Deer Park and related rare earth element and gold targets, with the objective of moving the British Columbia projects to more advanced exploration stages (including potential drill permitting, geophysics or partner exploration). The recent success of new mines in BC and higher commodity prices, combined with government and international strategic initiatives, makes for a good potential opportunity for Riverside.
In addition, China has implemented export controls and licensing requirements affecting certain rare earth materials, related products, and processing technologies, highlighting how concentrated and sensitive global REE supply chains remain. This reinforces why the Company intends to continue seeking REE opportunities that align with efforts to diversify supply and support strategic demand outside of China.
New Canadian Transactions
Riverside plans to assess additional BC and other Canadian opportunities using Riverside’s database and technical team to secure attractive entry terms with the potential for future royalties and spinouts. In Q1, the Company intends to use a portion of the capital raised in December with strategic investors to add key tenures and continue to grow Riverside’s Canadian business.
2. Mexico Exploration and Partnerships
Union Project
Complete assaying Union’s Phase 1 drilling program and plan the follow-up work to advance Union as the district-scale carbonate replacement region. The Company will continue exploring for gold and porphyry copper targets with Questcorp funding exploration under the option agreement.
Cecilia Project
Advance the Cecilia Project following positive Q4 2024 drilling and 2025 follow-up targeting, interpretations program by integrating geophysics, structural modelling, and district-scale targeting to position the project for additional drilling and actively marketing it for an option or partnership. In light of recent positive statements and actions by the Mexican government, including the granting of new open-pit mining permits and titles, Riverside is stepping up its partner-seeking opportunities.
Advance and De-risk other Projects in Mexico
Continue to progress and/or transact on the project portfolio through options, joint ventures, or asset sales, with the objective of providing shareholder return.
3. Royalty and Strategic Portfolio Growth
Leverage Existing Royalties
Riverside’s royalty portfolio is anchored by its 2% NSR on the Tajitos Gold Project operated by Fresnillo and the Sugarloaf Peak gold project operated by Arizona Metals, where ongoing technical and permitting work by the operators could move these assets closer to future production decisions, with further leveraged upside from royalties on Capitan Silver’s Cruz de Plata Project and Blue Jay Gold’s Ontario properties.
Originate New Royalties through Transactions
Structure new deals in Canada, Mexico and potentially in US jurisdictions where Riverside can retain NSRs and/or equity while transferring a portion of the capital burden to partners. Expanding the royalty portfolio including using the strong capital position of the Company.
4. Corporate Development & Capital Markets
Disciplined Deployment of New Capital
Allocate the December 2025 financing proceeds into focused work programs and corporate development, prioritizing opportunities with clear value catalysts in an effort to deliver shareholders further potential returns.
Active Market Presence
Continue regular outreach through conferences and targeted meetings, including key 2026 sector events, to broaden Riverside’s shareholder base and support liquidity. Attending key conferences including AME Roundup in Vancouver, January 26-29, 2026, and PDAC in Toronto, March 1-4, 2026.
2025 Recap and Highlights
Canada
Blue Jay Gold Spin-out and Ontario Portfolio
Riverside completed the spin-out of Blue Jay Gold Corp. under a court-approved plan of arrangement, distributing one Blue Jay share and one new Riverside share for every five Riverside shares held on the May 22, 2025 effective date. This transaction gave Riverside shareholders direct exposure to a dedicated gold explorer while Riverside retained a royalty on Blue Jay’s Ontario property portfolio.
British Columbia – Gold and REE Projects
Riverside advanced its BC portfolio with ongoing work at Red Jacket, Deer Park, Revel, and related projects, confirming strong analogues to the historic Yellowhead mining camp for Red Jacket and the Rossland mining camp at Deer Park as well as outlining a 12-kilometre-long carbonatite-style rare earth system at Revel that remains undrilled.
Mexico
Cecilia Gold Project
Riverside reported positive results from the Q4 2024 drill program at Cecilia, which tested multiple targets. These holes provided geologic context and allow for the next phase of exploration work at the: San Jose vein system, East Target, Mayra Vein and South Mesa Fault among other targets. Most of the targets drilled in 2025 returned encouraging geological and gold indicators, confirming a large, low-sulphidation epithermal system.
The 2025 work focused on integrating structural, geochemical and geophysical data to better understand the scale and orientation of mineralization and expanded the targets setting the project up for the next exploration work.
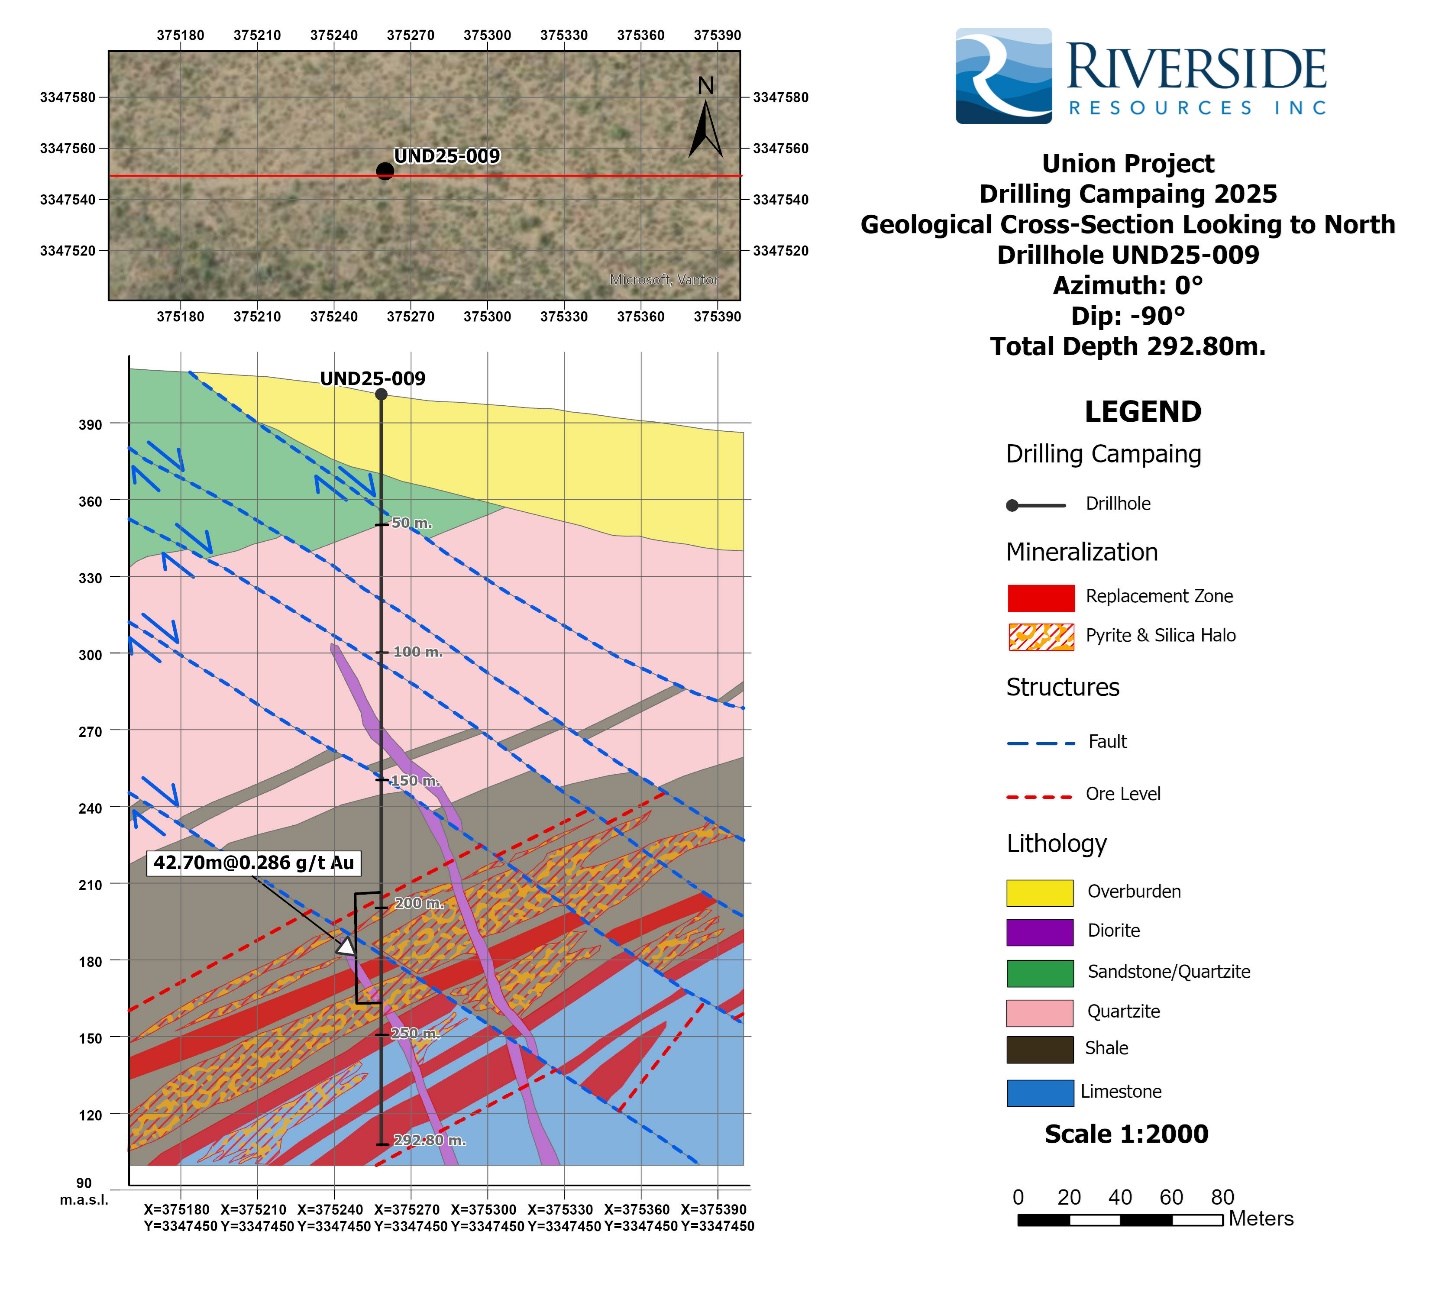
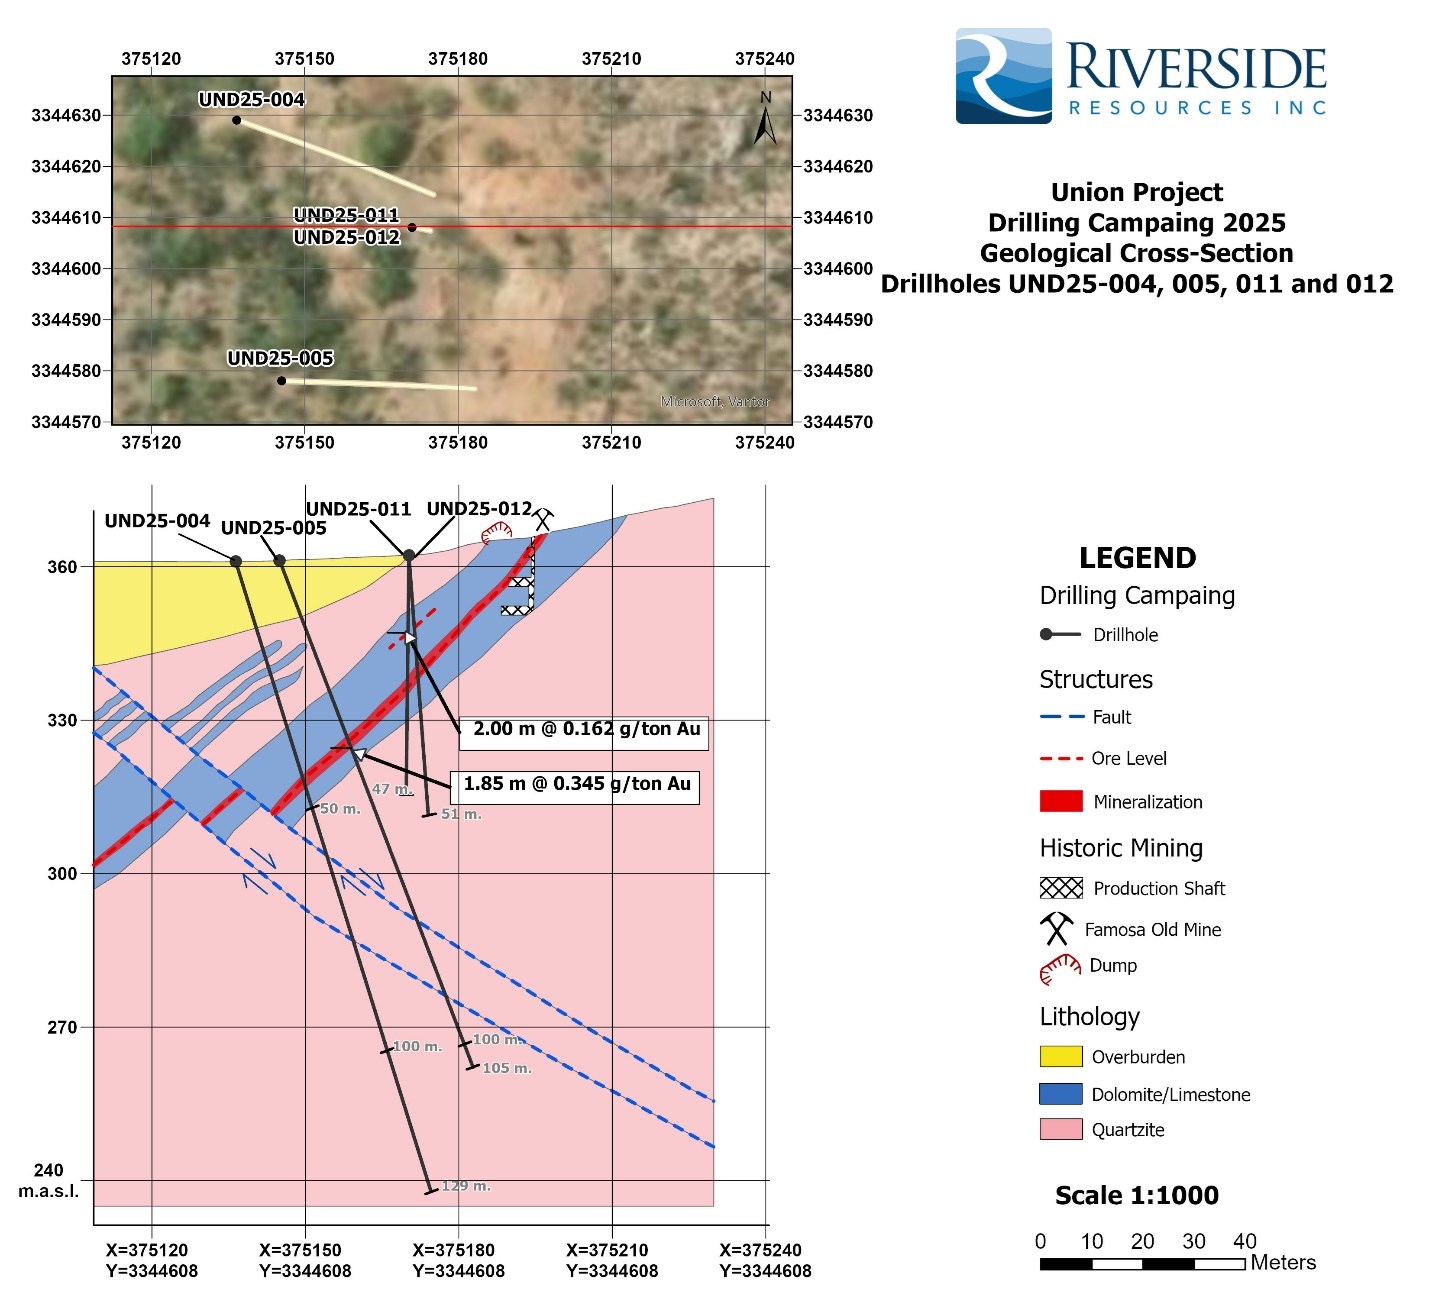
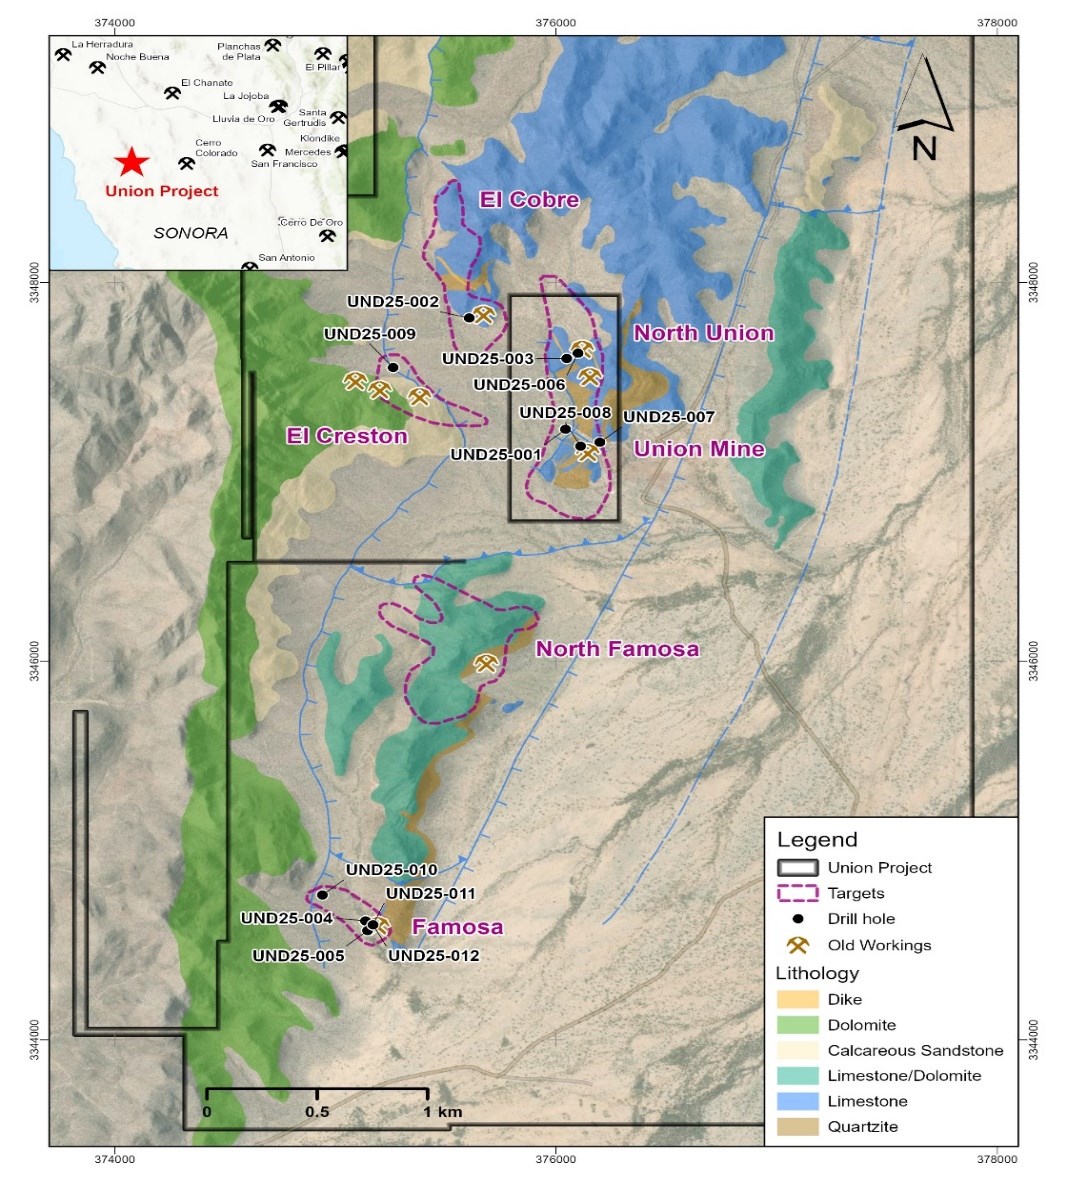
Union Project – Questcorp Option & First-Year Work
Riverside executed a definitive option agreement with Questcorp Mining (QQQ.CSE) on the 2,520-hectare Union Project in Sonora. The agreement provides for up to C$5.5 million in exploration expenditures and a staged path for Questcorp to earn in, while Riverside retains a royalty and became a shareholder of Questcorp. Under the terms of the agreement, Riverside will act as the exploration Operator for the project.
Questcorp issued 6,285,722 shares to Riverside (9.9% of Questcorp) and made cash payments. Following this, Riverside’s Mexico-based team began pre-drilling preparations, including contractor selection and geophysics to refine drill targets in the CRD-porphyry system. In late 2025, Riverside and Questcorp completed a partner-funded Phase 1 drill campaign of 12 holes totaling over 1,600 metres at Union, with assays pending for the first quarter of 2026.
Other Mexican Assets and Royalties
The Company continued to advance its broader Mexican portfolio, including Cuarentas (drill permitted), Valle and the Ariel porphyry copper prospects, maintaining optionality for future joint ventures, sales or additional royalties.
Riverside’s royalty portfolio remained an important part of the value proposition, including the 2% NSR on the Tajitos Gold Project operated by Fresnillo and the 2% NSR on Arizona Metals’ Sugarloaf Peak gold project in Arizona, both of which continued to see operator-led technical and evaluation work through 2025.
Corporate & Financial
On December 1, 2025, Riverside closed a C$3.7 million non-brokered private placement with long-term strategic investors which included Rick Rule, Sprott Wealth Management and Metallum. The 18,460,000 units included half-warrants exercisable at C$0.30 for two years, adding potential future capital while keeping the structure straightforward. Following the financing, Riverside has 93 million shares outstanding and no debt, providing flexibility for 2026 programs and transactions.
Qualified Person & QA/QC
The scientific and technical information contained in this news release has been reviewed and approved by Freeman Smith, P.Geo, a non-independent qualified person to Riverside Resources, who is responsible for ensuring that the geologic and technical information provided in this news release is accurate and who acts as a “qualified person” under National Instrument 43-101 – Standards of Disclosure for Mineral Projects.
About Riverside Resources Inc.
Riverside is a well-funded exploration company driven by value generation and discovery. The Company has a solid balance sheet with no debt and tight share structure with a strong portfolio of gold-silver, copper and REE assets and royalties in North America. Further information about Riverside is available on the Company’s website at www.rivres.com.
ON BEHALF OF THE BOARD OF RIVERSIDE RESOURCES INC.
“John-Mark Staude”
Dr. John-Mark Staude, President & CEO
For additional information contact:
| John-Mark Staude President, CEO Riverside Resources Inc. info@rivres.com Phone: (778) 327-6671 Fax: (778) 327-6675 Web: www.rivres.com | Eric Negraeff Investor Relations Riverside Resources Inc. Eric@rivres.com Phone: (778) 327-6671 TF: (877) RIV-RES1 Web: www.rivres.com |
Certain statements in this press release contain forward-looking information. Forward-looking information involves risks, uncertainties and other factors that could cause actual results to differ materially from those expressed or implied by such forward-looking information. In addition, the forward-looking statements require management to make assumptions and are subject to inherent risks and uncertainties. There is significant risk that the forward-looking statements will not prove to be accurate, that the management’s assumptions may not be correct and that actual results may differ materially from such forward-looking statements. These statements can be identified by the use of forward-looking terminology (e.g., “expect”,” estimates”, “intends”, “anticipates”, “believes”, “plans”). Forward-looking statements contained in this press release may include, but are not limited to, use of proceeds, obtaining regulatory approval for the Offering and future business plans of the Company. Such information involves known and unknown risks, including the receipt of regulatory approval, the results of future financing and exploration activities, the interpretation of exploration results and other geological data, or unanticipated costs and expenses and other risks identified by Riverside in its public securities filings that may cause actual events to differ materially from current expectations. Readers are cautioned not to place undue reliance on these forward-looking statements, which speak only as of the date of this press release. Except as required by applicable securities laws and regulation, Riverside disclaims any intention or obligation to update or revise any forward-looking statement, whether as a result of new information, future events or otherwise.
Neither the TSX Venture Exchange nor its Regulation Services Provider (as that term is defined in the policies of the TSX Venture Exchange) accepts responsibility for the adequacy or accuracy of this release.

To view the source version of this press release, please visit https://www.newsfilecorp.com/release/280000