Published 1 month ago on July 20, 2025 By Bruno Venditti Graphics/Design: Sam Parker
Charted: America’s Reliance on Foreign Minerals
This was originally posted on our Voronoi app. Download the app for free on iOS or Android and discover incredible data-driven charts from a variety of trusted sources.
Key Takeaways
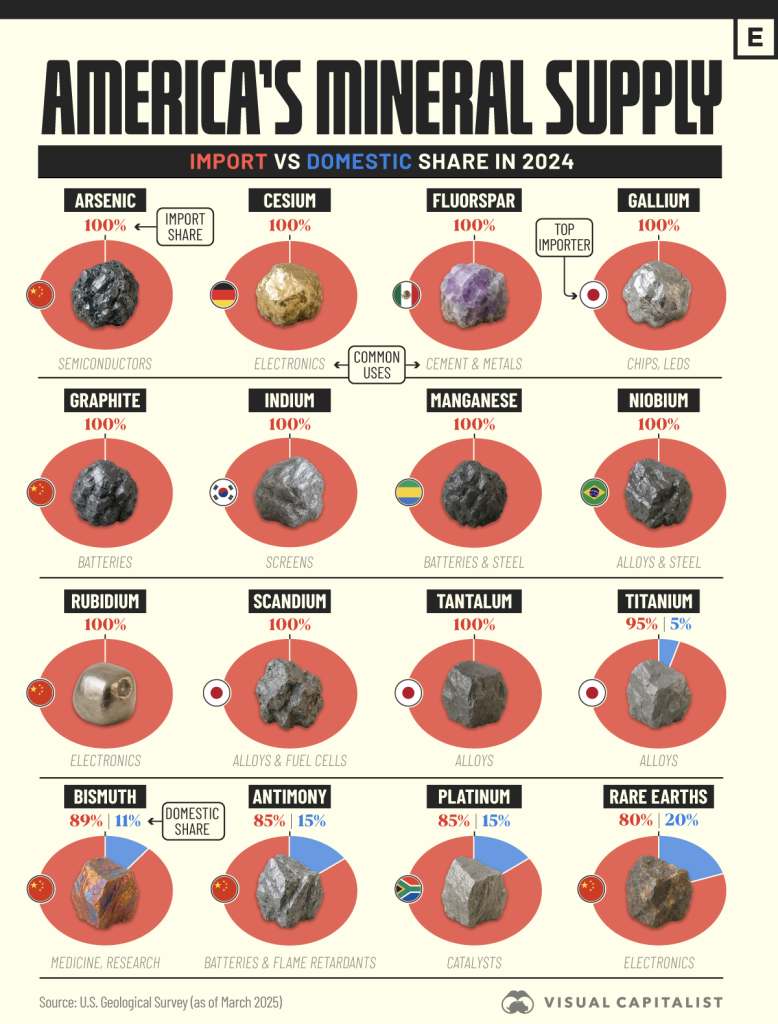
The U.S. was 100% import reliant for 11 mineral commodities in 2024, including graphite, manganese, and fluorspar.
China remains the dominant supplier for many critical minerals, particularly rare earth elements.
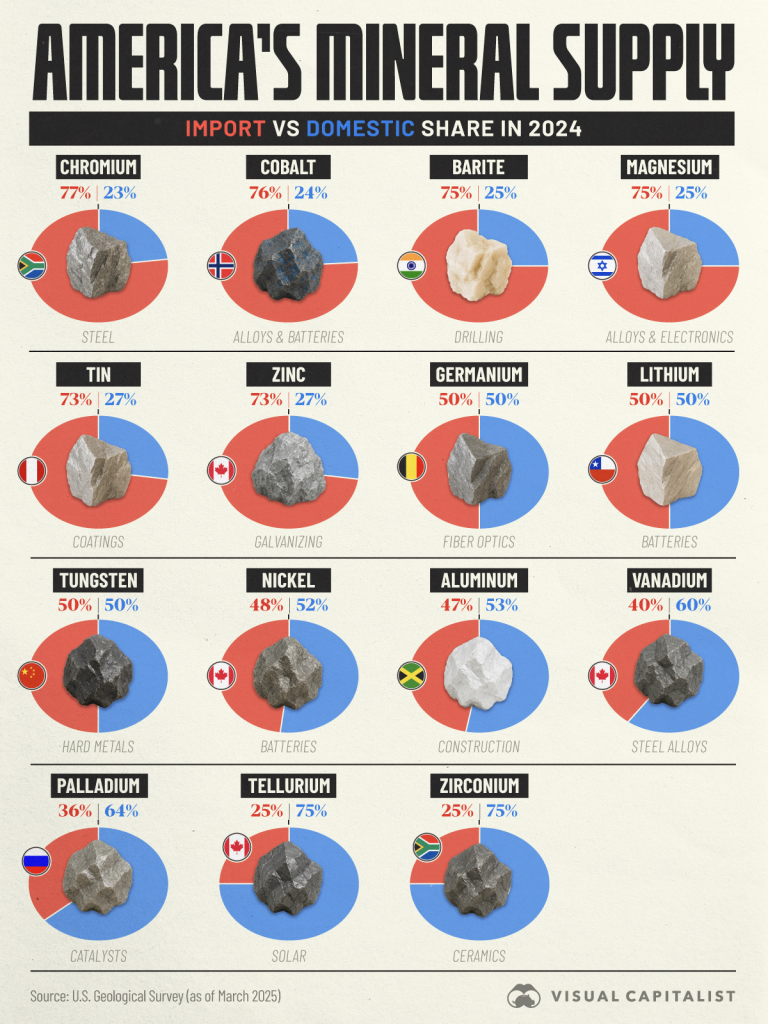
America’s economy is heavily reliant on imported minerals, many of which are critical for technology, energy, and defense. The latest data from the U.S. Geological Survey highlights the extent of this dependence.
Top Mineral Import Dependencies
In 2024, the United States was 100% import reliant for 11 key mineral commodities. These include essential industrial inputs like natural graphite, manganese, fluorspar, and arsenic. These materials are vital in steelmaking, battery production, and chemical manufacturing.
China remains the leading supplier for many of these resources, particularly rare earth elements, for which the U.S. remains highly dependent.
Currently, 80% of America’s rare earth element imports come from China. The Asian country mines about 70% of the world’s rare earths and has a virtual monopoly on refining and processing.
Many of these elements are essential in military applications, electric motors, and next-gen electronics. Companies like Lockheed Martin, Tesla, and Apple rely on these materials in their core products.
Amid the recent trade war with U.S. President Donald Trump, China imposed export restrictions on rare earth magnets and related materials in April. The measure has already led major automakers—including BMW, Mercedes-Benz, and Ford—to flag production challenges due to supply shortages.
Besides rare earth elements, the list includes other critical materials for U.S. manufacturing:
Graphite (100% import reliant) — key for lithium-ion battery anodes.
Manganese (100%) — used in steel and battery alloys.
Fluorspar (100%) — essential in aluminum production and hydrofluoric acid manufacturing.
Key Take-AwaysCenterra can earn up to 70% of the Lehman Butte project by investing US $30.0 million over eight (8) years in two stages, with committed US $2.0 million in expenditures within the first two (2) years.Scout will be operator with its internal teams at cost plus 20%; the Lehman Butte project is drill-ready with permits in hand.This agreement is the crystallization of Scout’s vertically integrated approach, which allows the Company to be paid to advance its own projects using in-house drill rigs and geologic team.Coeur d’Alene, Idaho – August 27, 2025 – Scout Discoveries Corp. (“Scout” or the “Company”) is pleased to announce the execution of a definitive agreement with Centerra Gold Inc. (“Centerra”). Under this agreement, Centerra has the right to earn up to a 70% interest in Scout’s Lehman Butte epithermal Au-Ag project (the “Project”), located in Custer County, Idaho, through a two-stage Earn-In structure, summarized below and in Table 1. All amounts referenced are in U.S. dollars.Earn-In Agreement HighlightsExecution Payment:Centerra will pay Scout $75,800 (2025 BLM Claim fees and underlying royalty) within thirty (30) business days following execution of the Agreement (August 8, 2025).Initial Stage 1 Earn-In Option: Centerra may earn an initial 51% interest in the Project by incurring a minimum of $15.0 million in qualifying work expenditures over the initial five (5) year period (the “First Option”), which includes:Funding of $500,000 and $1.5 million (a total of $2.0 million) in exploration expenditures on or before each of the first and second anniversaries of the agreement, respectively, as a firm commitment.An additional $13.0 million in qualifying exploration expenditures must be funded by the fifth anniversary of the agreement, bringing the total to $15.0 million.During the First Option, Scout will continue as the exploration and drilling operator for the Project, operating at cost plus 20% for the first $10.0 million and cost plus 15% thereafter.Centerra and Scout will each elect two representatives to a technical steering committee, which will meet quarterly to review budgets and monitor exploration progress.If Centerra does not complete the expenditure requirements of the First Option within five (5) years, 100% ownership of the project will revert back to Scout.Stage 2 Earn-In Option: Subject to Centerra having exercised the First Option, Centerra shall retain the sole right and option to earn an additional 19% ownership interest in the Project, for a total aggregate of 70% ownership interest (the “Second Option”), by:Sole-funding an additional $15.0 million in qualifying work expenditures over a three (3) year period following the First Option.Centerra has the option to assume operatorship of the Project and pay Scout a 10% fee on all expenditures or continue with Scout as operator at cost plus 20% for the first $10.0 million spent under the Section Option and cost plus 15% thereafter.Continued Advancement, Dilution of Ownership:To ensure the project continues to advance if either party elects to do so,following the completion of either the First Option or in the Second Option, if no exploration or development program is undertaken by Centerra within twelve (12) months, Scout maintains the right to propose such a program.If Centerra declines to fund the program, Scout may elect to fund it independently, and Centerra’s ownership will be diluted on a pro rata basis.If either party’s interest drops below 10%, its interest will be converted to a 2% NSR royalty, with 1% buyable upon commencement of commercial production at the net present value (5% discount rate) as defined by the feasibility study.Either party may convert its interest to a 2% NSR royalty at any time during the agreement or joint venture.
Curtis Johnson, Scout’s President and CEO commented, “This agreement with Centerra is the core of our business model. We generate the project, advance it through drill targeting, then partner with a strong group to aggressively drill the targets while staying directly engaged as operator through our vertically integrated platform. By drilling with our internal rigs and leveraging our geologic team, we move faster, drill more meters per dollar for ourselves and partners, and keep momentum and positive cash flow working for shareholders. This is a sustainable exploration model that will allow Scout to test more targets to overcome the low odds of making a tier one discovery.”
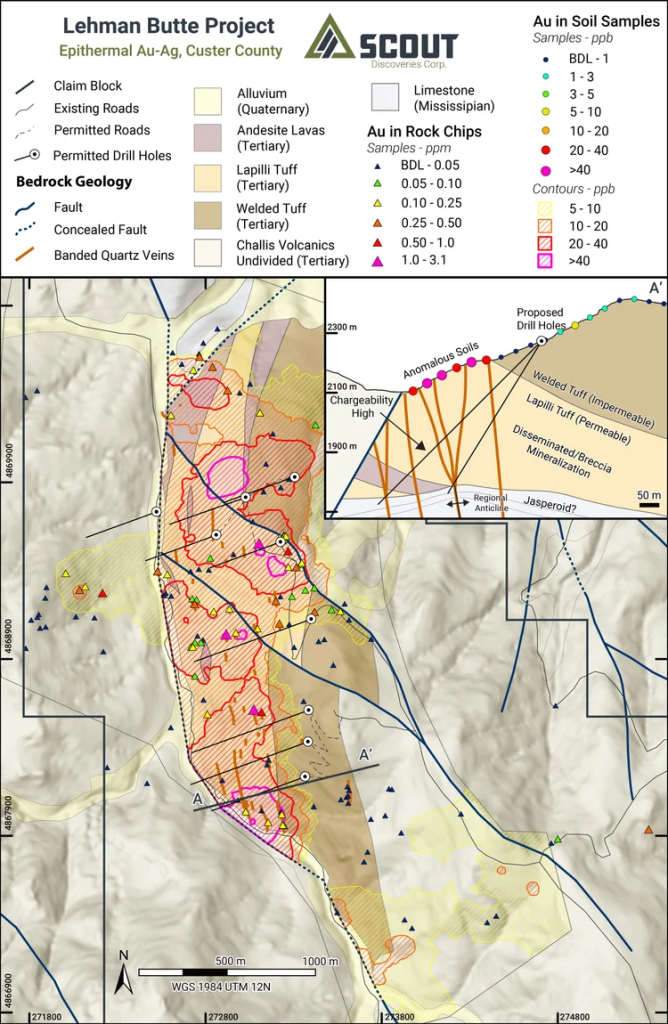
About the Lehman Butte ProjectThe Lehman Butte project, located in central Idaho (Figure 1), features extensive low-sulfidation epithermal veining and quartz-clay-adularia alteration within intermediate volcanic rocks, as well as jasperoid replacement in underlying Mississippian limestone. Exploration by the Scout team, during their tenure at EMX Royalty Corp. and with prior partners, has outlined a cohesive 1.5 x 3 km gold-in-soil anomaly. Rock chip samples have returned values up to 3.1 g/t Au and 19.8 g/t Ag (n=214, avg. 0.145 g/t Au and 4.8 g/t Ag). These results indicate bulk-tonnage style mineralization, centered around a zone of banded quartz-adularia feeder veins up to 2.5 m wide, mapped across 3 km of strike. Coincident magnetic, chargeability, and resistivity anomalies support the targets identified through surface sampling and mapping. The project is permitted for drilling, with primary targets including a bulk-tonnage Au-Ag deposit hosted in volcanics, as well as high-grade bonanza-style epithermal veins at depth.
Next Steps – Work ProgramIn fall 2025, the Scout team will collaborate with Centerra to design and execute an advanced-stage exploration program, funded by Centerra. This will include additional geologic mapping, surface rock sampling, soil sampling, and drone magnetics across the southern portion of the land position that has not yet been covered by these methods. These efforts will lead to a planned Phase I core drilling program in spring-summer 2026, targeting up to 5,000 meters within the primary target zone as outlined in Figure 2.
Execution of Additional Drilling ContractIn addition to the above, Scout has executed an all-in-drilling contract with Mammoth Minerals Limited to carry out an initial 1,500-meter core drilling program in Nevada, including core drilling, rig management, core logging and cutting, as well as TerraCore hyperspectral imaging. The Company has used funds from the advance payment for this program to acquire its fifth surface core drilling rig; an excellent condition, used Boart Longyear track-mounted LF-70.
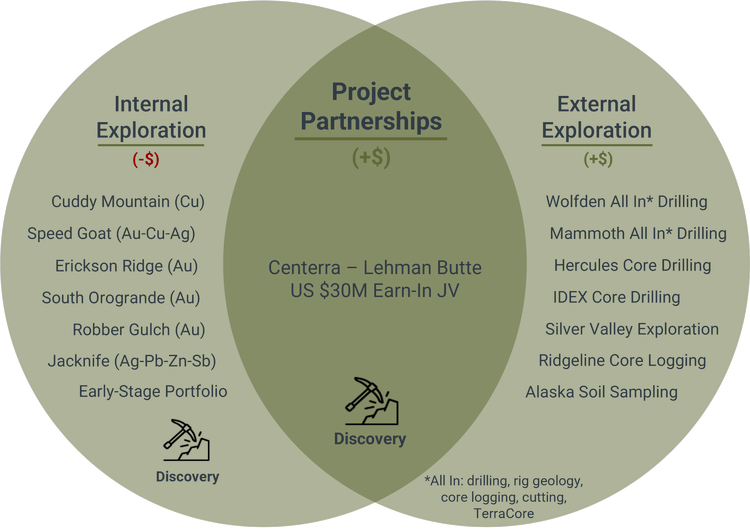
Our Discovery‑to‑Partnership ModelDiscovery generator + vertical integration: Scout’s strategy combines the breadth of a prospect generator with the execution discipline of a major mining company. We advance projects internally, from mapping and geophysics through internal core drilling, with these costs offset by external contracts, then partner when scale and capital intensity increase on the project, preserving upside and accelerating timelines (Figure 3).Lower cost, more meters, aligned structure: Because we manage the full exploration stack in‑house (including drilling), we can reduce exploration costs by ~50–75% versus third‑party contractors. That efficiency lets us drill more meters per dollar and iterate targets faster, supporting rapid decision‑making across the portfolio. This structure is fully aligned with partners earning in on our projects, as Scout’s primary goal is to maximize exploration work done per dollar.Maintaining momentum through partnerships: When a project reaches the right inflection point, we partner with strong groups, such as Centerra at Lehman Butte, to scale work programs while staying directly engaged as operator. Under the Option Agreement, Scout is the initial Project Planner and Operator, enabling continuity of planning, permitting, and drilling cadence as capital ramps, and helping keep momentum squarely on advancing the asset.
About Centerra Gold Inc.Centerra Gold Inc. is a Canadian-based gold mining company focused on operating, developing, exploring and acquiring gold and copper properties in North America, Türkiye, and other markets worldwide. Centerra operates two mines: the Mount Milligan Mine in British Columbia, Canada, and the Öksüt Mine in Türkiye. The Company also owns the Kemess Project in British Columbia, Canada, the Goldfield Project in Nevada, United States, and owns and operates the Molybdenum Business Unit in the United States and Canada. Centerra’s shares trade on the Toronto Stock Exchange under the symbol CG and on the New York Stock Exchange under the symbol CGAU. The Company is based in Toronto, Ontario, Canada.
About Scout Discoveries Corp.Scout Discoveries Corp., headquartered in Coeur d’Alene, Idaho, is a private U.S. mineral exploration company with rights to twelve separate precious and base metal projects in the western U.S.A., comprising one of the largest unpatented claim holdings in the region, totaling over 50,000 acres. Scout’s vision is to bring the full discovery process in-house from idea generation through resource drilling, lowering costs and increasing efficiency. With this model, the Company can rapidly advance its project portfolio through discovery by leveraging its five internal core drill rigs and experienced technical teams. For further information visit: https://www.scoutdiscoveries.com/
Forward-looking StatementsCertain statements in this news release are forward-looking and involve a number of risks and uncertainties. Such forward-looking statements are within the meaning of that term in Section 27A of the Securities Act of 1933, as amended, and Section 21E of the Securities Exchange Act of 1934, as amended. Forward-looking statements are not comprised of historical facts. Forward-looking statements include estimates and statements that describe the Company’s future plans, objectives or goals, including words to the effect that the Company or management expects a stated condition or result to occur. Forward-looking statements may be identified by such terms as “believes”, “anticipates”, “expects”, “estimates”, “may”, “could”, “would”, “will”, or “plan”. Since forward-looking statements are based on assumptions and address future events and conditions, by their very nature they involve inherent risks and uncertainties. Although these statements are based on information currently available to the Company, the Company provides no assurance that actual results will meet management’s expectations. Risks, uncertainties and other factors involved with forward-looking information could cause actual events, results, performance, prospects and opportunities to differ materially from those expressed or implied by such forward-looking information. Factors that could cause actual results to differ materially from such forward-looking information include, but are not limited to those risks set out in the Company’s public documents filed on EDGAR. Although the Company believes that the assumptions and factors used in preparing the forward-looking information in this news release are reasonable, undue reliance should not be placed on such information, which only applies as of the date of this news release, and no assurance can be given that such events will occur in the disclosed time frames or at all. The Company disclaims any intention or obligation to update or revise any forward-looking information, whether as a result of new information, future events or otherwise, other than as required by law. No stock exchange, securities commission or other regulatory authority has approved or disapproved the information contained herein.
Now, I’ve seen a thing or two in my time, from the muddy banks of the Mississippi to the wild, woolly, and mostly-full-of-lies silver rushes out West. The talk of riches—it’s like a siren’s song, ain’t it? It’ll make a man forget his grammar, his good sense, and sometimes his very trousers. The world is full of fellows who’d sell you a gold brick made of brass, and another sort who’ll show you a hole in the ground and swear it’s a direct-to-Heaven express line for your pocketbook.
And so it is, that a body must approach a matter of finance with a mind as clear as a bottle of good whiskey before the cork’s been pulled. And I’ve been looking at this Apollo Silver business, and it’s a curious thing, a right proper puzzle for a man who’s seen a few. It ain’t about the grand promises of a bonanza that’ll make you the next Rockefeller, a-building libraries and a-dressing in finery. No sir. That kind of talk is for the greenhorns and the giddy.
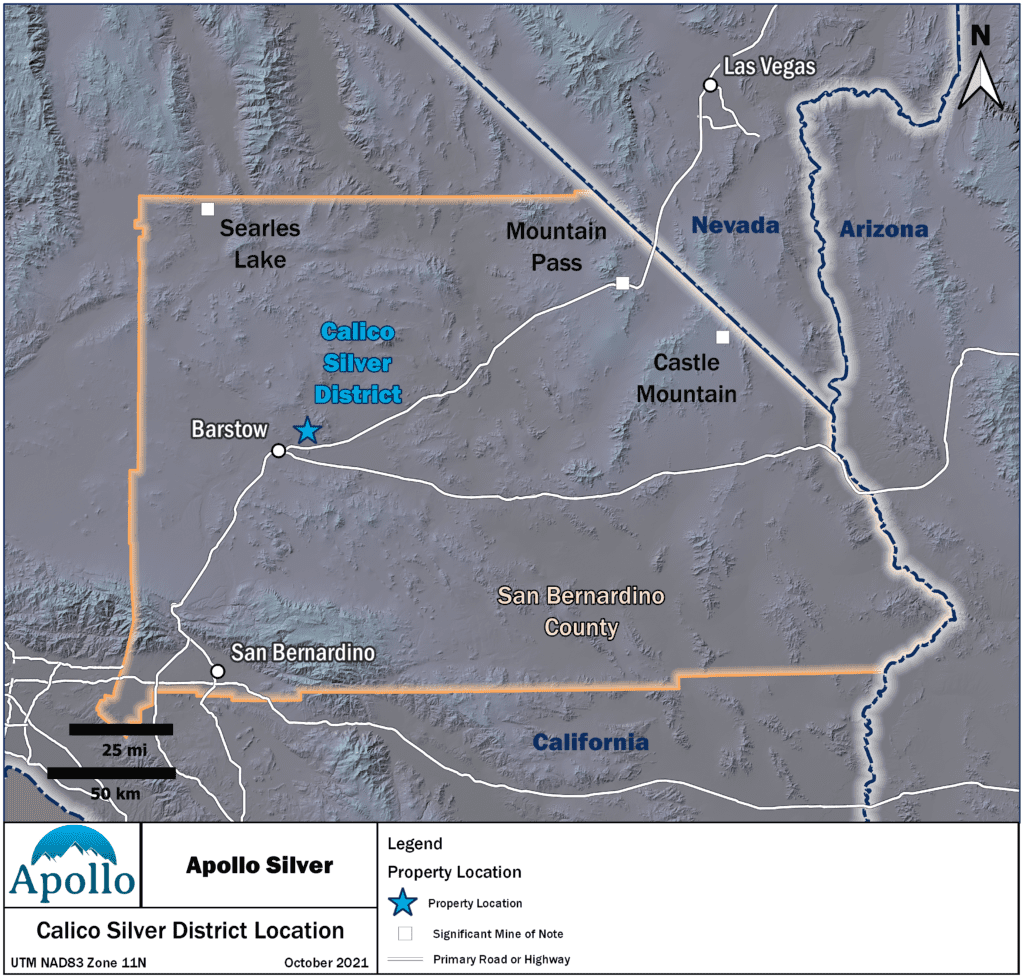
What’s to be said for Apollo is a different tune entirely. It’s a calm, measured sort of melody, like a riverboat gliding on a Sunday afternoon. You see, they’ve got this Calico project out in California, and another one, Cinco de Mayo, down in Mexico. And when they speak of it, they ain’t waving their arms about or using words too big for their boots. They’re talking about a mineral resource. And not just a vague promise, but numbers that have been “measured,” “indicated,” and “inferred.” That’s the part that sticks to a man’s ribs like a good meal.
And there’s history to back it up, too. The Calico district ain’t some new-fangled idea; it’s a place where they’ve been pulling silver from the earth for a long spell. Back in 1881, after a big discovery, Calico became a real humdinger of a town. It was a place that produced millions of dollars in silver over a dozen years, a wild and colorful place that drew in folks from all over the globe, a town with a name that came right from the “calico-colored” mountains themselves. A fella by the name of Walter Knott, who had a berry farm and a fondness for history, even went and restored the old place after it became a ghost town. So, the ground there, it’s got a reputation.
And in that reputable ground, they’ve got a proper accounting. The Calico project is said to hold a mighty 110 million ounces of silver in the “Measured and Indicated” category, which is a powerful lot of the shiny stuff. And on top of that, there’s another 51 million ounces of silver in the “Inferred” category. That’s a sum a body can get his head around.
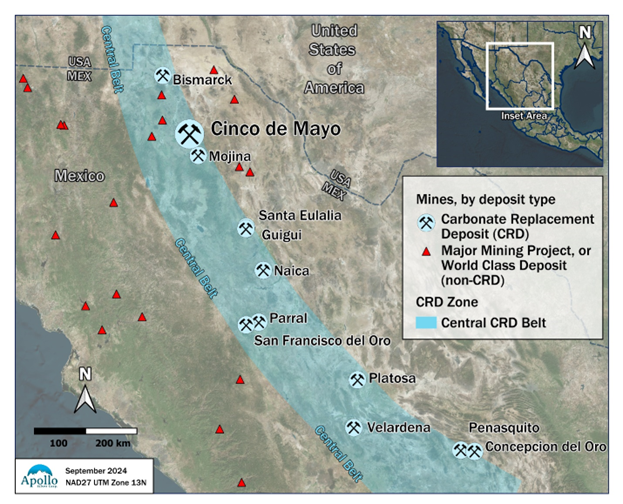
Now, as for the Cinco de Mayo project down in Chihuahua, Mexico, well, that region is a whole other book of stories. Mexico’s got a history with silver that goes back centuries, and a fella who knows a thing or two about rocks will tell you that the very geology of the area is famous for these “carbonate replacement deposits,” the kind that have been responsible for a good 40% of all the silver ever pulled out of the ground in that country. And while their report on this project is of a historical nature, it still speaks to a substantial resource, with a historical estimate of 52.7 million ounces of silver in the “Inferred” category. It’s a testament to the region’s long-standing character.
Now, I’ve seen men go bust on a whim, throwing their money at some fly-by-night scheme with a map that had more flourishes than truth. But this here, this is a matter of geography and common sense. It’s in places where they’ve been digging silver for a hundred years, and where the land itself seems to say, “Why yes, there’s more where that came from.” And the folks in charge—they’ve got a long-standing acquaintance with the business of pulling wealth from the earth, not just from the pockets of others.
So, a man must ask himself, what’s the virtue in this? The virtue is in the lack of fancy. It’s a bet on what’s already there, not what might be. It’s the difference between a high-stakes poker game where you might lose your shirt, and a man walking into a store to buy a new one. It ain’t a get-rich-quick scheme. It’s a slow, deliberate trundle down the road of reason. And in a world where every huckster with a shovel has a story to tell, a story about a resource measured and counted is a mighty comfortable thing to rest your hat on.
(Please note: Apollo Silver is a sponsor of Proven And Probable, and we are biased.)
Speed Goat is a large-scale porphyry Au-Cu-Ag drill discovery made by the Scout team in northern Nevada’s Battle Mountain mining region following only minor shallow historic drilling.
Multiple holes drilled with +100-meter intervals of 0.5 g/t AuEQ (0.56% CuEQ), large strike length and continuity from surface to 400m depth confirmed and remains open.
Robust thicknesses of porphyry Au-Cu-Ag mineralization at grades and mineralogy consistent with the nearby Phoenix Complex operated by Nevada Gold Mines.
The topography is favorable for surface mining, with road access and proximity to infrastructure, including high-voltage power lines on the property.
Scout continues to aggressively advance its portfolio, expanding operations from two to four surface core drills, which are generating significant revenues for the Company.
Coeur d’Alene, Idaho – August 20, 2025 – Scout Discoveries Corp. (“Scout” or the “Company”) is pleased to provide drill results from its Phase II core drilling program at the Speed Goat Project in Nevada, as well as updates on internal and external core drilling programs and exploration activities. The Company continues to build long-term value through its vertically integrated team by balancing internal drilling and exploration on its portfolio, moving toward a Tier-One discovery and executing cash-flow-generating contracts.
Including 164.8m (from 23.23-188.1m) @ 0.51 g/t Au, 0.15% Cu, 1.98 g/t Ag (0.67 g/t AuEQ; 0.75% CuEQ)
Including 38.9m (from 149.2-188.1m) @ 1.02 g/t Au, 0.27% Cu, 2.25 g/t Ag (1.29 g/t AuEQ; 1.44% CuEQ)
SG25-05: 317.9m (from 0-317.9m) @ 0.25 g/t Au, 0.11%Cu, 1.66 g/t Ag (0.37 g/t Au EQ; 0.41% CuEQ)
Including 136.1m (from 30.4-166.5m) @ 0.42 g/t Au, 0.16% Cu, 2.47 g/t Ag (0.59 g/t AuEQ; 0.66% CuEQ)
Including 43.4m (from 36.3-79.7m) @ 0.73 g/t Au, 0.25% Cu, 4.03 g/t Ag (1.00 g/t AuEQ; 1.11% CuEQ)
Scout Operational Update Highlights:
Exploration Updates: Scout has made substantial progress in exploring its project portfolio during the 2025 season, including:
Geological mapping at Cuddy Mountain, along with a large-scale joint Magnetotelluric–Natural Source Induced Polarization (MT–NSIP) survey with Hercules Metals.
Surface mapping and soil sampling at Independence and soil sampling at Moose Ridge. Further mapping and sampling are planned at Lehman Butte and Muldoon.
Aggressive generative exploration for copper in the western U.S., with one newly staked project now advancing through evaluation phases including mapping and sampling.
Cuddy Mountain Permitting: Scout is finalizing permits for 18 drill sites at Cuddy Mountain and anticipates drilling to commence at the Climax target in September or October, utilizing its internal drilling division.
Operations: The Company has expanded its drilling operations from two to four surface core drills after securing three major contracts expected to deliver strong cash flow through 2026:
Hercules Metals, adjacent to Cuddy Mountain: two rigs for 2025.
IDEX Metals, north of Cuddy Mountain: one core rig plus TerraCore imaging.
Wolfden Resources: one rig, rig management, core logging/cutting, and TerraCore imaging – a full turnkey program.
Speed Goat Phase II Drill Results
Scout has successfully completed a 2,000-meter, 6-hole core drilling program at its Speed Goat porphyry Au-Cu (Ag) project in Nevada. This Phase II program follows up on initial successful drilling conducted in 2022 by the team during their tenure at EMX Royalty Corp. (“EMX”), prior to spinning out as Scout. That work intercepted robust porphyry Au-Cu-Ag mineralization beginning at surface – significant results are outlined above in the summary section, and in Table 1.
The Speed Goat project is located within the prolific Battle Mountain mining region of north-central Nevada (Figure 1). This district hosts multiple producing gold (Marigold, SSR Mining) and gold-copper mines (Phoenix Complex, Nevada Gold Mines). The project was initially identified and acquired through staking by the Scout team, formerly as EMX employees, in 2021.
Historical exploration is uncertain; however, previous drilling and exploration work is reported to have taken place in the mid-1990s between Pittston Nevada Gold Co. and Newmont Mining Corp. To date, Scout has relied solely on its own drill results to guide its exploration efforts. The outcropping mineralization at Speed Goat, combined with strong reconnaissance geochemistry, proved compelling even without historic drill data available in 2022, prompting the completion of an initial 862-meter Phase I core program. Notable intercepts from Phase I, beginning at surface, included 284.0m @ 0.34 g/t Au, 1.87 g/t Ag, and 0.10% Cu (0.46 g/t AuEQ or 0.43% CuEQ; with a higher-grade interval of 16.9 meters at 0.76 g/t Au, 1.24 g/t Ag, and 0.20% Cu (0.96 g/t AuEQ or 0.82% CuEQ.
The Phase II program outlined here was designed to test previously drilled holes, both at depth and along strike, to better understand the scale potential. Strong porphyry Au-Cu-Ag mineralization was intercepted in all step-outs, indicating significant tonnage potential starting at surface.
Figure 1: Speed Goat Property Map
Geologic Mapping: During 2025, the Scout technical team remapped the Speed Goat project area using digital “Anaconda-style” outcrop mapping to document lithology, structure, alteration, and mineralization in detail (Figure 2). The primary goal was to assess the time-space relationships between the host Jurassic igneous units, the later Eocene (?) mineralized porphyry dikes, and the outcropping mineralization, in order to better understand the tonnage potential. Figure 3 displays results of this work, which shows widespread early potassic and later sericitic alteration, with zones of >10 quartz-pyrrhotite-chalcopyrite veins per meter documented across an ~1 square kilometer area associated with a series of porphyry dikes. Several high-priority new targets were identified, particularly when considered in context with insights gained during this latest drill program (Figure 4 and Figure 5). Figure 6 through Figure 9 are drill sections of Holes SG25-04 to 06 displaying Au and Cu grades. Refer to the following links for drill sections of Ag for Holes SG25-04, SG25-05 and SG25-06.
Figure 2: New Geology and Alteration Map
Figure 3: Quartz Veins Per Meter in Latest Drilling and Outcrop
Figure 4: Long Section Showing AuEQ Grades in 2022 and 2025 Drill Programs
Figure 5: Long Section Showing CuEQ Grades in 2022 and 2025 Drill Programs
Table 1: Speed Goat Phase II Drilling Intercepts (click on hole IDs to view Intellicore photos, mineralogy, and assays)
Table 1: Speed Goat Phase II Drilling Intercepts (click on hole IDs to view Intellicore photos, mineralogy, and assays) SG25-06: The Phase II drill program successfully extended mineralization both along strike and at depth, while also identifying a higher-grade Au-Cu-Ag zone that warrants follow-up. Hole SG25-06 was the last and most significant of this program, which drilled beneath the best channel samples. The entire 357.5m hole assayed 0.35 g/t Au, 0.11% Cu, 1.66 g/t Ag (0.46 g/t AuEQ; 0.52% CuEQ). This included a higher-grade interval of 38.9m (from 149.2-188.1m) @ 1.02 g/t Au, 0.27% Cu, 2.25 g/t Ag (1.29 g/t AuEQ; 1.44% CuEQ) within 164.8m (from 23.23-188.1m) @ 0.51 g/t Au, 0.15% Cu, 1.98 g/t Ag (0.67 g/t AuEQ; 0.75% CuEQ). The hole ended in strong mineralization and was terminated at the Nevada Gold Mines property boundary to the northeast.
Figure 6: Drill Section for SG25-05 and 06 Showing Au Grades in Core
Figure 7: Drill Section for SG25-05 and 06 Showing Cu Grades in Core
Figure 8: Drill Section for SG25-04 Showing Au Grades in Core
Figure 9: Drill Section for SG25-04 Showing Cu Grades in Core
SG25-04 and 05: Both holes demonstrated that Au-Cu-Ag grades are largely continuous across ~400m of outcropping mineralization. SG25-04 was drilled at -60 degrees beneath the previous hole SG-22-02 (-45 degrees). This hole successfully showed vertical continuity of mineralization over the 483m hole length (~420m true depth), without exiting potassic alteration or mineralized Au-Cu-Ag veins. The hole was terminated because vein dips had shallowed and the inclination had steepened moderately to where the hole was nearly parallel to the quartz vein sets, making it no longer representative. There remains potential to expand mineralization beyond 420m with different hole orientations beneath SG25-04 and steeper drilling beneath SG25-06.
SG25-01 to 03: The Company drilled three holes from one drill pad to test for southeast extensions of the porphyry Au-Cu-Ag system under post-mineral gravel cover in the hanging wall of a post-mineral fault. Bedrock was encountered ~25 meters below gravel, with all holes intercepting strong zones of porphyry-style sericitic alteration and local zones of >0.5 g/t Au up to 1.23 g/t Au over 0.94m and 0.05% Cu over 0.81m. These results suggest upper portions of a porphyry system are preserved, and the pediment area holds potential for additional porphyry Au-Cu-Ag mineralization. Further drilling will be necessary to vector into higher-temperature and potentially higher-grade zones of the porphyry system(s) in the pediment. Refer to the following link for drill sections of SG25-01 to 03 showing Au, Cu and Ag grades in core.
Figure 10: Core photos from SG25-04, 05, and 06 highlighting key porphyry mineralization styles and associated grades with sheeted to stockwork quartz-pyrrhotite-chalcopyrite veins cutting Jurassic quartz monzonite.
Economic Potential and Next Steps: Vein mineralization at Speed Goat is primarily pyrrhotite-chalcopyrite with minor molybdenite in potassic alteration, and later pyrite-dominant mineralization associated with sericitic alteration. This is directly analogous to intrusion-hosted Eocene porphyry mineralization at similar Au-Cu-Ag grades, processed at the Phoenix Mining Complex, ~25km southeast, using standard gravity, flotation, and carbon-in-leach methods. Although metallurgical work at Speed Goat has not yet been completed, the simple sulfide composition and uniform geology suggest a straightforward processing approach.
The Speed Goat project lies within Nevada’s “checkerboard” land, where alternating one-mile by one-mile sections are either BLM or private land, largely owned by Nevada Gold Mines. Thanks to its fortuitous surface and mineral rights history, Speed Goat connects with BLM land over two sections (Figure 1), forming a contiguous land position containing >95% of the known outcropping Au-Cu-Ag mineralization. The site offers easy road access, favorable topography for open-pit mining, and high-voltage power lines across the project in a major mining region. These advantages position Speed Goat for aggressive advancement to demonstrate significant scale and grade potential for porphyry Au-Cu-Ag mineralization.
Exploration and Permitting Updates
Scout is advancing earlier-stage projects and generating near-term cash flow through drilling while awaiting final U.S. Forest Service permits for a 10,000-meter drill program at the Cuddy Mountain project, expected still for 2025. Upon receipt of the permits, the Company plans to mobilize drill rigs to Cuddy Mountain for the 12-month permit period, including drilling at the Railroad targets located on private land.
As part of a collaborative initiative, Scout and Hercules Metals completed a 120 km² district-scale MT–NSIP geophysical survey across the Cuddy Mountain and Hercules properties. The survey was conducted by Moombarriga Geoscience, a global leader in deep-sensing geophysical methods. Scout helped Moombarriga expand to the U.S.A. in 2024 when the firm completed a 3D-IP survey at Cuddy Mountain. This MT-NSIP survey enables structural interpretation to depths of up to six kilometers — an order of magnitude deeper than previous techniques — and is expected to significantly enhance targeting and porphyry discovery potential across the region.
Scout’s in-house exploration team is now focused on advancing gold and copper targets across its Idaho portfolio — including the Muldoon, Independence, Moose Ridge, and Century projects — toward drill-ready status for 2026 and beyond.
External Revenue Generating Contracts
Scout expanded from two to four surface core drills through three new contracts via its wholly owned drilling division, Scout Drilling LLC. Current operations include two rigs at Hercules Metals, one at IDEX Metals, and a fourth in western Nevada with Wolfden Resources. The agreements with IDEX and Wolfden include TerraCore hyperspectral imaging (see May 9, 2024 news release). Scout is also overseeing program management, core logging and cutting for Wolfden. These contracts strengthen Scout’s financial profile position as a major cash-flow-generative operator. They also highlight increasing demand for its integrated drilling and technical services, supporting continued advancement of its internal exploration portfolio without significant shareholder dilution.
Building Long-Term Value with a Vertically Integrated Model
Scout’s unique positioning as a vertically integrated exploration and drilling company with the ability to offer technical services, enables long-term value creation (Figure 11):
Cash Flow Generation – Three active drilling contracts with four drills provide steady cash flow into 2026.
Exploration Leverage – Ongoing cash flow allows Scout to advance its own projects independently of equity markets, reducing shareholder dilution.
Technical Depth – Stable finances support a robust internal technical team for advancing drilling and exploration programs for Scout and partners.
Strategic Visibility – Partnerships with Hercules Metals, IDEX Metals, and Wolfden Resources enhances Scout’s profile and provide insight on emerging mineral belts.
Figure 11: Scout Discoveries Vertically Integrated Model Venn Diagram
With a sustained balance of external contracts providing significant cash flow generation and a project pipeline moving towards discovery with compelling porphyry Au-Cu-Ag drill results at Speed Goat, Scout is well-positioned to deliver meaningful catalysts with a strong balance sheet in the second half of 2025 and beyond.
Curtis Johnson, President & CEO commented: “We are highly encouraged by the results to date at Speed Goat and will continue to advance the project as a key goal of the Company, in conjunction with Cuddy Mountain and other high priority targets in our portfolio. First and foremost, Scout is a discovery-focused company and will always be so – as genuine economic discovery is what drives value creation in this industry. In pursuit of this, Scout’s vision is to transform exploration by bringing the discovery process in-house — reducing costs, increasing efficiency, and building a sustainable, profitable business. Our goal is to combine external contracts as described here with discovery upside on our portfolio through earn-in joint venture agreements – whereby Scout is both the underlying project owner and technical services provider. This is a fully aligned partnership structure where Scout provides drilling and technical services at lower cost to earn-in partners, while profitably advancing our large portfolio through discovery. The more efficient we are in advancing our projects for partners, the more work is done per dollar and the better odds we have of discovery. We are motivated to demonstrate this model and continue to advance partnership discussions with multiple parties across our portfolio.”
About Scout
Scout Discoveries Corp., headquartered in Coeur d’Alene, Idaho, is a private U.S. mineral exploration company with rights to fourteen separate precious and base metal projects in the western U.S.A., comprising one of the largest unpatented claim holdings in the region, totaling over 50,000 acres. Scout’s vision is to bring the full discovery process in-house from idea generation through resource drilling, lowering costs and increasing efficiency. With this model, the Company can rapidly advance its project portfolio through discovery by leveraging its four internal core drill rigs and experienced technical teams. For further information: https://www.scoutdiscoveries.com/
Download PDF
Forward-looking Statements
Certain statements in this news release are forward-looking and involve a number of risks and uncertainties. Such forward-looking statements are within the meaning of that term in Section 27A of the Securities Act of 1933, as amended, and Section 21E of the Securities Exchange Act of 1934, as amended. Forward-looking statements are not comprised of historical facts. Forward-looking statements include estimates and statements that describe the Company’s future plans, objectives or goals, including words to the effect that the Company or management expects a stated condition or result to occur. Forward-looking statements may be identified by such terms as “believes”, “anticipates”, “expects”, “estimates”, “may”, “could”, “would”, “will”, or “plan”. Since forward-looking statements are based on assumptions and address future events and conditions, by their very nature they involve inherent risks and uncertainties. Although these statements are based on information currently available to the Company, the Company provides no assurance that actual results will meet management’s expectations. Risks, uncertainties and other factors involved with forward-looking information could cause actual events, results, performance, prospects and opportunities to differ materially from those expressed or implied by such forward-looking information. Factors that could cause actual results to differ materially from such forward-looking information include, but are not limited to those risks set out in the Company’s public documents filed on EDGAR. Although the Company believes that the assumptions and factors used in preparing the forward-looking information in this news release are reasonable, undue reliance should not be placed on such information, which only applies as of the date of this news release, and no assurance can be given that such events will occur in the disclosed time frames or at all. The Company disclaims any intention or obligation to update or revise any forward-looking information, whether as a result of new information, future events or otherwise, other than as required by law. No stock exchange, securities commission or other regulatory authority has approved or disapproved the information contained herein.
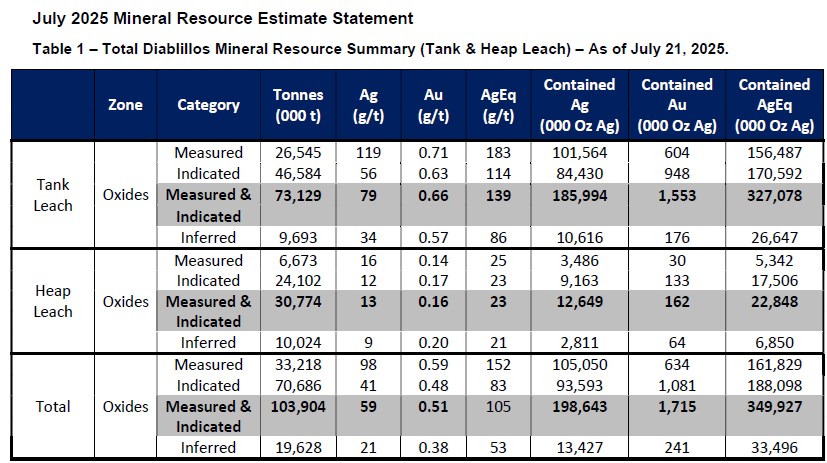
Vancouver, British Columbia–(Newsfile Corp. – August 20, 2025) – EMX Royalty Corporation (NYSE American: EMX) (TSXV: EMX) (the “Company” or “EMX”) congratulates AbraSilver Resource Corp. (“AbraSilver”) on its recent updated Diablillos mineral resource estimate (“MRE”) that increased total open pit constrained, oxide mineral resources to 199 million ounces of contained silver (+34%) and 1.72 million ounces of contained gold (+27%) in the measured and indicated (“MI”) categories.1,2 AbraSilver is also further enhancing project economics with ongoing drilling, advancing other priority initiatives (e.g., engineering optimization, investment incentives, among others), and is expected to receive EIA approval in the latter half of 2025 and on schedule to deliver a definitive feasibility study (“DFS”) for the Project in Q1 2026. EMX retains a 1% NSR royalty on the Diablillos Project, and all known mineralization occurs within EMX’s royalty ground.
The updated Diablillos MRE reports tank leach resources, which previously was the sole metallurgical processing assumption for the Project, as well as contributions from a maiden heap leach MRE. The additional heap leach resources represent a milestone advancement in converting near surface and peripheral lower grade “waste” material within the constraining open pit configuration to mineralization potentially recoverable via a low-cost processing route. AbraSilver reported total (i.e., tank and heap leach) oxide MI resources as 104 Mtonnes averaging 59 g/t silver and 0.51 g/t gold. The tank leach MI resources account for approximately 70% of the tonnes and over 90% of the contained silver and gold, with the heap leach resources contributing the balance which provides the potential to reduce the strip ratio and enhance project economics.
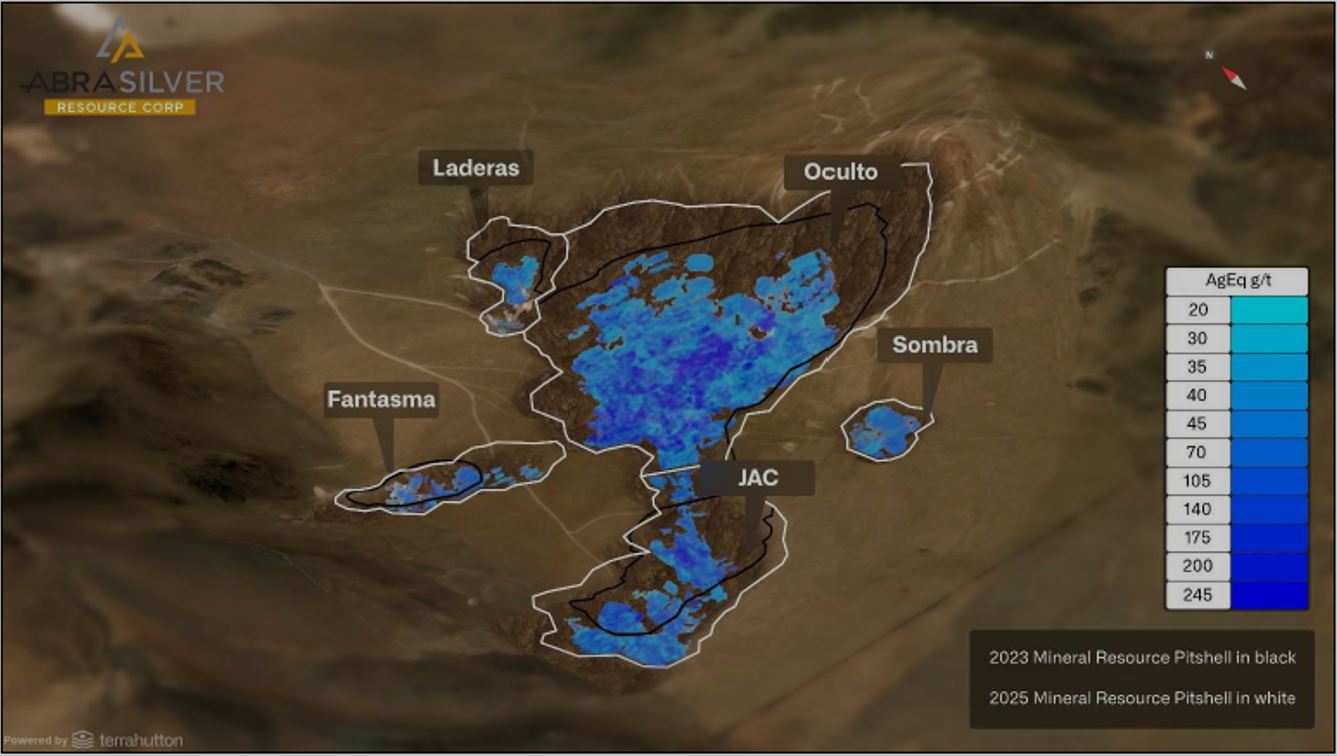
There were significant MI increases across all five resource deposits (i.e., Oculto, JAC, Fantasma, Laderas and Sombra) (see Figure 1 reference map), with the largest tonnage and contained metal increases driven by the JAC deposit, which is characterized by high-grade, near-surface silver-gold mineralization, as well as the Oculto deposit. The Sombra deposit, a recent discovery immediately south of Oculto and JAC, represents a first-time addition to the Project MRE totals.
There is significant district scale exploration upside at Diablillos with an ongoing Phase V 20,000 meter drill program scheduled for completion by early 2026. This program includes step-out drilling at Oculto East, JAC, and Sombra, as well as exploration drilling at the Cerro Viejo and Cerro Blanco porphyry targets.
EMX congratulates AbraSilver for its success in rapidly building value at the Diablillos royalty property. In addition to the significant increases in silver-gold mineral resources via drilling and metallurgical advancements, AbraSilver is currently evaluating other initiatives to further enhance project economics as inputs to the H1 2026 DFS (e.g., connecting to national grid for power, upgrading the fleet size, outsourcing waste movement, and optimizing TSF design to co-locate waste with tailings).3 Moreover, Diablillos is eligible for Argentina’s Incentive Regime for Large Investments (i.e., RIGI), which includes lower tax rates, elimination of export duties, and accelerated depreciation; an investment decision by Q2 2027 is required to fully qualify. Clearly, AbraSilver is on a fast track in advancing Diablillos to a production decision, and thereby unlocking the value of EMX’s royalty interest.
Comments on the Updated MRE. The updated Diablillos MRE reports total (i.e., tank and heap leach) measured resources of 33,218 Ktonnes @ 98 g/t Ag (105,050 Koz contained) and 0.59 g/t Au (634 Koz contained) and indicated resources of 70,686 Ktonnes @ 41 g/t Ag (93,593 Koz contained) and 0.48 g/t Au (1,081 Koz contained). In addition, the updated MRE includes total inferred resources of 19,628 Ktonnes @ 21 g/t Ag (13,427 Koz contained) and 0.38 g/t Au (241 Koz contained).
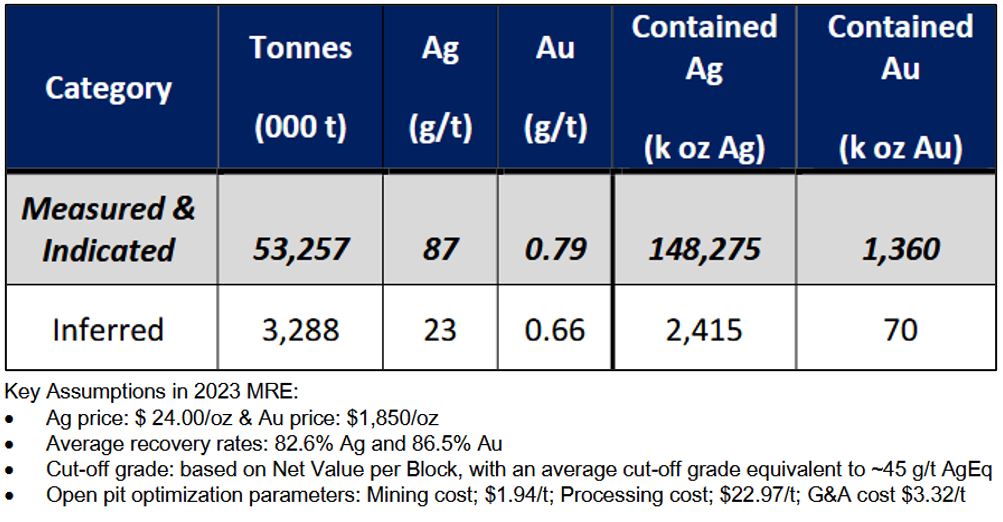
Comments on the December 2024 PFS. AbraSilver’s PFS study updated in December 2024 outlined an average 14 year life of mine with annual production of 7.6 Moz of silver and 72 Koz of gold yielding an NPV(5) of US$747 million, 28% IRR, and a two year payback using base case prices of $25.50/oz silver and $2,050/oz gold. Importantly, the PFS production profile over the first five years of full mine production averages 11.7 Moz silver and 59 Koz gold which underlines the Project’s early-stage potential for strong cash-flow generation and corresponding royalty payments to EMX. AbraSilver’s ongoing initiatives and sustained silver and gold bull market prices suggest significant additional Project upside.
About the Diablillos Silver-Gold Royalty Property. Diablillos is a high sulfidation silver-gold project located in the Puna region of Salta Province, Argentina. There are multiple mineralized zones in a district scale area covered by EMX’s uncapped 1% NSR royalty ground. Of note, in April of this year the Company received an early final property payment from AbraSilver totaling US$6.85 million.
Michael P. Sheehan, CPG, a Qualified Person as defined by National Instrument 43-101 and employee of the Company, has reviewed, verified and approved the disclosure of the technical information contained in this news release.
About EMX. EMX is a precious and base metals royalty company. EMX’s investors are provided with discovery, development, and commodity price optionality, while limiting exposure to risks inherent to operating companies. The Company’s common shares are listed on the NYSE American Exchange and TSX Venture Exchange under the symbol “EMX”. Please see www.EMXroyalty.com for more information.
Neither the TSX Venture Exchange nor its Regulation Services Provider (as that term is defined in policies of the TSX Venture Exchange) accepts responsibility for the adequacy or accuracy of this release
Forward-Looking Statements This news release may contain “forward looking statements” that reflect the Company’s current expectations and projections about its future results. These forward-looking statements may include statements regarding perceived merit of properties, exploration results and budgets, mineral reserves and resource estimates, work programs, capital expenditures, timelines, strategic plans, market prices for precious and base metal, or other statements that are not statements of fact. When used in this news release, words such as “estimate,” “intend,” “expect,” “anticipate,” “will”, “believe”, “potential” and similar expressions are intended to identify forward-looking statements, which, by their very nature, are not guarantees of the Company’s future operational or financial performance, and are subject to risks and uncertainties and other factors that could cause the Company’s actual results, performance, prospects or opportunities to differ materially from those expressed in, or implied by, these forward-looking statements. These risks, uncertainties and factors may include, but are not limited to unavailability of financing, failure to identify commercially viable mineral reserves, fluctuations in the market valuation for commodities, difficulties in obtaining required approvals for the development of a mineral project, increased regulatory compliance costs, expectations of project funding by joint venture partners and other factors.
Readers are cautioned not to place undue reliance on these forward-looking statements, which speak only as of the date of this news release or as of the date otherwise specifically indicated herein. Due to risks and uncertainties, including the risks and uncertainties identified in this news release, and other risk factors and forward-looking statements listed in the Company’s MD&A for the quarter June 30, 2025 (the “MD&A”), and the most recently filed Annual Information Form (“AIF”) for the year ended December 31, 2024, actual events may differ materially from current expectations. More information about the Company, including the MD&A, the AIF and financial statements of the Company, is available on SEDAR at www.sedarplus.ca and on the SEC’s EDGAR website at www.sec.gov.
Figure 1. Diablillos Project Plan View of Mineral Resource Estimate (taken from Figure 2, AbraSilver news release dated July 29, 2025).
1 See AbraSilver news release dated July 29, 2025 and Appendix 1 of this news release 2 Increases referenced to the November 2023 MRE 3 See AbraSilver “August 2025” Corporate Presentation 4 See AbraSilver news release dated December 3, 2024
Vancouver, British Columbia–(Newsfile Corp. – August 19, 2025) – Questcorp Mining Inc. (CSE: QQQ) (OTCQB: QQCMF) (FSE: D910) (the “Company” or “Questcorp“) is pleased to announce they have completed 25% of the planned drilling program on its La Union Project in northwest Sonora, Mexico. This work is being carried out by property vendor and operator Riverside Resources Inc. (TSXV: RRI).
Highlights
The Company has completed 300 metres of the planned drill program of 1200 to 1500m.
Drilling to test the carbonate-hosted replacement deposit (CRD) style of mineralization, with gold associated with mantos, chimneys, and along structural zones.
Angled drill holes are aimed at cutting perpendicular to stratigraphic targets and some structural targets which is typical in CRD systems
Structural features may have served as mineralizing conduits and are key targets in the current drill program.
Questcorp is capitalizing on the recent exploration work over the past three months by Riverside that improved the understanding of the structural geology and stratigraphy that is guiding current exploration efforts at La Union. The exploration target focus is for a large potential gold discovery that expands from previous smaller scale mine operations on the property. The drill program will begin to test the new concepts and expand past previous mining.
Saf Dhillon, President & CEO states, “Questcorp is pleased with the progress being made at this first ever drill program at La Union. The Riverside team has been able to work throughout these hot summers months to enable the successful completion of this Maiden drill.
Earlier this year, Questcorp entered into a definitive option agreement with Riverside’s wholly owned subsidiary, RRM Exploracion, S.A.P.I. DE C.V. to acquire a 100% interest in the La Union Project. As part of the agreement, Questcorp issued shares to Riverside, making Riverside a shareholder and aligning both parties’ interests in the Project’s success. With funding provided by Questcorp, an initial C$1,000,000 exploration program is now underway. This marks the first phase of a larger, C$5,500,000 work commitment, contingent on exploration results and Questcorp’s continued participation.
The Drill Program Targets include more than four different areas, beginning with this early-stage stratigraphic and orientation phase of drilling exploration aimed at evaluating the scale of alteration and indications of a mineralized system. This will be the first drilling ever conducted on most of the targets, despite past mining having occurred in the majority of these areas. The initial program will consist of one to three holes per area, primarily for orientation purposes. Follow-up drilling is planned and can be expanded based on initial results, which will help verify the stratigraphy, lithologies, and structural features allowing for improved modeling and next-stage discovery targeting. The four areas are listed below:
Union Main MineArea – The program will use angled drill holes to test limestone and other carbonate stratigraphic hosts within the Clemente Formation, with the potential to reach the underlying Caborca Formation. These units are considered the primary hosts for replacement-style mineralization.
North Union Mine Area – The initial focus of the program will be on testing structural interpretations. Additional drilling is anticipated following this first phase, as results will help guide future drill testing of areas with past mining activity and various structural orientations.
Cobre MineArea – The Clemente Formation is the primary host unit, and structural features combined with areas of past mining provide multiple target zones. Drilling will begin with an initial stratigraphic test hole to help orient around the thickness of the host unit and extend into the lower Caborca Formation, which is also a favorable host for CRD-style mineralization.
Central UnionArea – Structural targets, as possible mineralization feeder zones, are a key focus in this past mining manto area. There are extensive additional target zones in the area, and this initial orientation drilling will provide vectoring for the next stage of drilling and further study of the Clemente Formation, and possibly into the Caborca Formation as currently interpreted.
General Overview of La Union Project
The Project is summarized in a recently published NI 43-101 Technical Report available under Questcorp’s SEDAR+ profile (www.sedarplus.ca). Riverside initially acquired the Project and subsequently consolidated additional inlier mineral claims, building a strong land position. Riverside then advanced the Project through surface access agreements and drill permitting, making it a turn-key exploration opportunity for Questcorp.
The Project was originally identified through Riverside’s exploration work in the western Sonora Gold Belt, conducted in collaboration with AngloGold Ashanti Limited, Centerra Gold Inc., and Hochschild Mining Plc. Earlier research by Riverside Founder John-Mark Staude also contributed to recognizing the district’s potential. Initial work by members of the Riverside team, drawing on more than two decades of geological compilation and analysis, further confirmed the region as highly prospective.
At the Project, historical mining by the Penoles Mining Company targeted chimney and manto-style replacement bodies within the upper oxide zones. As a result, the underlying sulfide zones represent immediate and compelling drill targets for further exploration.
At the La Union Project, immediate drill targets offer the potential for significant-scale discoveries. La Union is well positioned for near-term exploration success, with targets that include both oxide and deeper sulfide mineralization.
The La Union Project
The La Union Project is a carbonate replacement deposit (“CRD”) project hosted by Neoproterozoic sedimentary rocks (limestones, dolomites, and siliciclastic sediments) overlying crystalline Paleoproterozoic rocks of the Caborca Terrane. The structural setting features high-angle normal faults and low-to-medium-angle thrust faults that sometimes served as mineralization conduits. Mineralization occurs as polymetallic veins, replacement zones (mantos, chimneys), and shear zones with high-grade metal content, as shown in highlight grades of 59.4 grams per metric tonne (g/t) gold, 833 g/t silver, 11% zinc, 5.5% lead, 2.2% copper, along with significant hematite and manganese oxides, consistent with a CRD model (see the technical report entitled “NI 43-101 Technical Report on the Union Project, State of Sonora, Mexico” dated effective May 6, 2025 available under Questcorp’s SEDAR+ profile). These targets also demonstrate intriguing potential for large gold discoveries potentially above an even larger porphyry Cu district potential as the Company’s target concept at this time.
Questcorp cautions investors that grab samples are selective by nature and not necessarily indicative of similar mineralization on the property.
The technical and scientific information in this news release has been reviewed and approved by R. Tim Henneberry, P. Geo (BC), a director of the Company and a “qualified person” under National Instrument 43-101 – Standards of Disclosure for Mineral Projects.
About Questcorp Mining Inc.
Questcorp Mining Inc. is engaged in the business of the acquisition and exploration of mineral properties in North America, with the objective of locating and developing economic precious and base metals properties of merit. The Company holds an option to acquire an undivided 100% interest in and to mineral claims totaling 1,168.09 hectares comprising the North Island Copper Property, on Vancouver Island, British Columbia, subject to a royalty obligation. The Company also holds an option to acquire an undivided 100% interest in and to mineral claims totaling 2,520.2 hectares comprising the La Union Project located in Sonora, Mexico, subject to a royalty obligation.
This news release includes certain “forward-looking statements” under applicable Canadian securities legislation. Forward-looking statements include, but are not limited to, statements with respect to Riverside’s arrangements with geophysical contractors to undertake orientation surveys and follow up detailed survey to confirm and enhance the drill targets. Forward-looking statements are necessarily based upon a number of estimates and assumptions that, while considered reasonable, are subject to known and unknown risks, uncertainties, and other factors which may cause the actual results and future events to differ materially from those expressed or implied by such forward-looking statements. Such factors include but are not limited to: the ability of Riverside to secure geophysical contractors to undertake orientation surveys and follow up detailed survey to confirm and enhance the drill targets as contemplated or at all, general business, economic, competitive, political and social uncertainties, uncertain capital markets; and delay or failure to receive board or regulatory approvals. There can be no assurance that the geophysical surveys will be completed as contemplated or at all and that such statements will prove to be accurate, as actual results and future events could differ materially from those anticipated in such statements. Accordingly, readers should not place undue reliance on forward-looking statements. The Company disclaims any intention or obligation to update or revise any forward-looking statements, whether as a result of new information, future events or otherwise, except as required by law.
In his monograph “A Short History of Financial Euphoria”, economic historian John Kenneth Galbraith observed, “For practical purposes, the financial memory should be assumed to last, at a maximum, no more than 20 years. This is normally the time it takes for the recollection of one disaster to be erased and for some variant on previous dementia to come forward to capture the financial mind.”
For those afflicted by FMDS, we prescribe defensive positioning including high levels of cash and gold bullion.
It has been almost 20 years since the Global Financial Crisis restored a measure of sobriety to the financial markets. It is our thinking that the current cycle of market mania is due for a comeuppance. Resistance to a reality check is baked into the “buy the dip” conventional wisdom. Galbraith writes in “The 1929 Parallel” (Atlantic, 1987), “There is a compelling vested interest in euphoria, or perhaps especially, when it verges, as in 1929, on insanity.” As noted by Walter Bagehot in Lombard Street (1873), “All people are the most credulous when they are the most happy.”
Timing a financial market reversal, while imprecise, is aided by the historical fact that ebbs and flows of mass psychology are repetitive, go to extreme levels and reverse under the weight of their exhaustion. The markers of what constitute a “danger zone” are consistent. The forgotten champions of mortgage-backed securities (2007), dot-com startups (late 1990s), the “nifty fifty” stocks of the 1970s or investment trusts of the 1920s have much in common with today’s proponents of the MAG 7, crypto and the AI revolution. The signs include extreme market concentration, leverage and delusional extrapolation of the benefits of whatever happens to be the current craze.
In the following note, we prescribe for those afflicted by financial market derangement syndrome, or FMDS, a healthy dose of contrarian thinking and defensive positioning including high levels of cash and gold bullion. For those wishing for stronger countermeasures to generate positive investment returns from FMDS, we suggest significant exposure to precious metals mining equities.
Gold Equities: Still Undervalued and Under-Owned
Despite the strong year-to-date performance for gold bullion (25.35%)1 and precious metals shares (52.65% with dividends reinvested),2 investor participation remains scant. To measure current investor participation and positioning, we look to the number of shares outstanding in the VanEck Gold Miners ETF (GDX), which has declined 20.37% year-to-date and 32.86% since 2020. Mining stocks, despite an 85.47% increase in the gold price over the past five years and an even greater rise in profit margins, have lagged gold conspicuously, gaining only 51.82% over the same period.
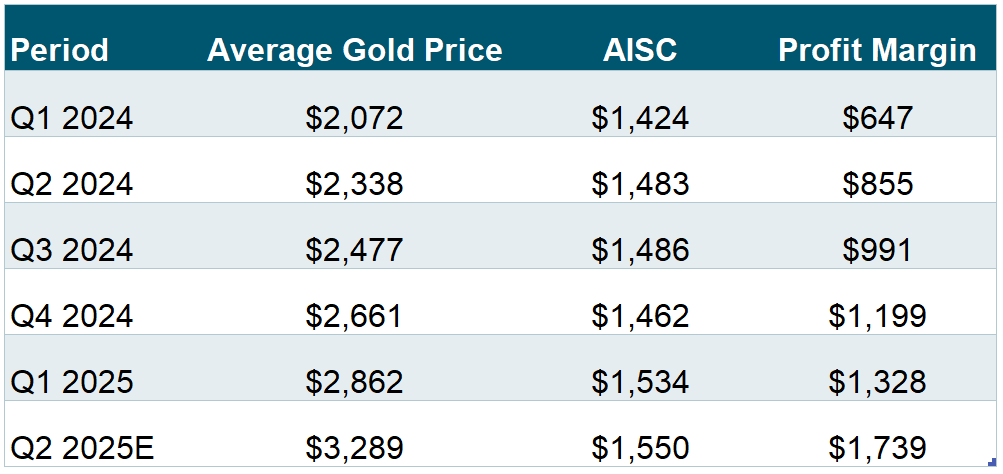
For gold miners, the approximate industry-wide profit margin has increased from $647 per ounce in Q1 2024 to approximately $1,700 in Q2 2025, a gain of 168%.
Figure 1: Gold Miner Profitability Has Risen Significantly (2024-2025E)
Sources: (1) Average Gold Price: Bloomberg XAU Curncy, (2) AISC: Bloomberg Intelligence (BI METG: Precious Metal Mining Dashboard), (3) Q2 2025E for AISC is based on Sprott’s estimate.
Gold miners are generating record profits and cash flow. Their balance sheets are flush. Industry leaders, including Newmont and Agnico Eagle, are promising to return surplus capital to shareholders. Share buyback announcements and dividend hikes are listed in Appendix A. At the recent Rick Rule Symposium in Boca Raton, Agnico Eagle CEO Ammar Al Joundi stated that he “would rather give money back” than chase marginal deals.3 Newmont Mining has generated proceeds of $3 billion after tax from asset divestitures over the past year and announced share buybacks of $3 billion in July 2025.
The lack of interest in precious metals miners seems as inexplicable as it is unsustainable.
Blockbuster earnings reports are becoming commonplace, in many cases well above sell-side research consensus. We strongly believe there is more good news to come as the third quarter average gold price (quarter-to-date) already exceeds the second quarter average gold price by $54 per ounce. Fear of a sustained drop in the metal’s price, if that is the reason for the absence of investor enthusiasm, is misplaced.
Sell-side analysts continue to play catch-up with their earnings forecasts and price targets. Ingrained “bunker mentality” from a decade of poor performance in the mining sector seems to be preventing forceful advocacy of a pro-miners investment thesis from those who should be its champions.
While not standard, attention to shareholder accountability in terms of per-share metrics is increasingly evident. Useful per-share stats would include earnings, cash flow, reserves and production. Investor presentations that disclose per-share information include Wesdome, Alamos, Kinross and Dundee Precious Metals, to name a few. The key investment rationale for gold mining equities is leverage to the movement in the gold price. In a bull market for the metal, gold bulls want a quantification of that torque. Discussion of that connection was virtually non-existent five years ago.
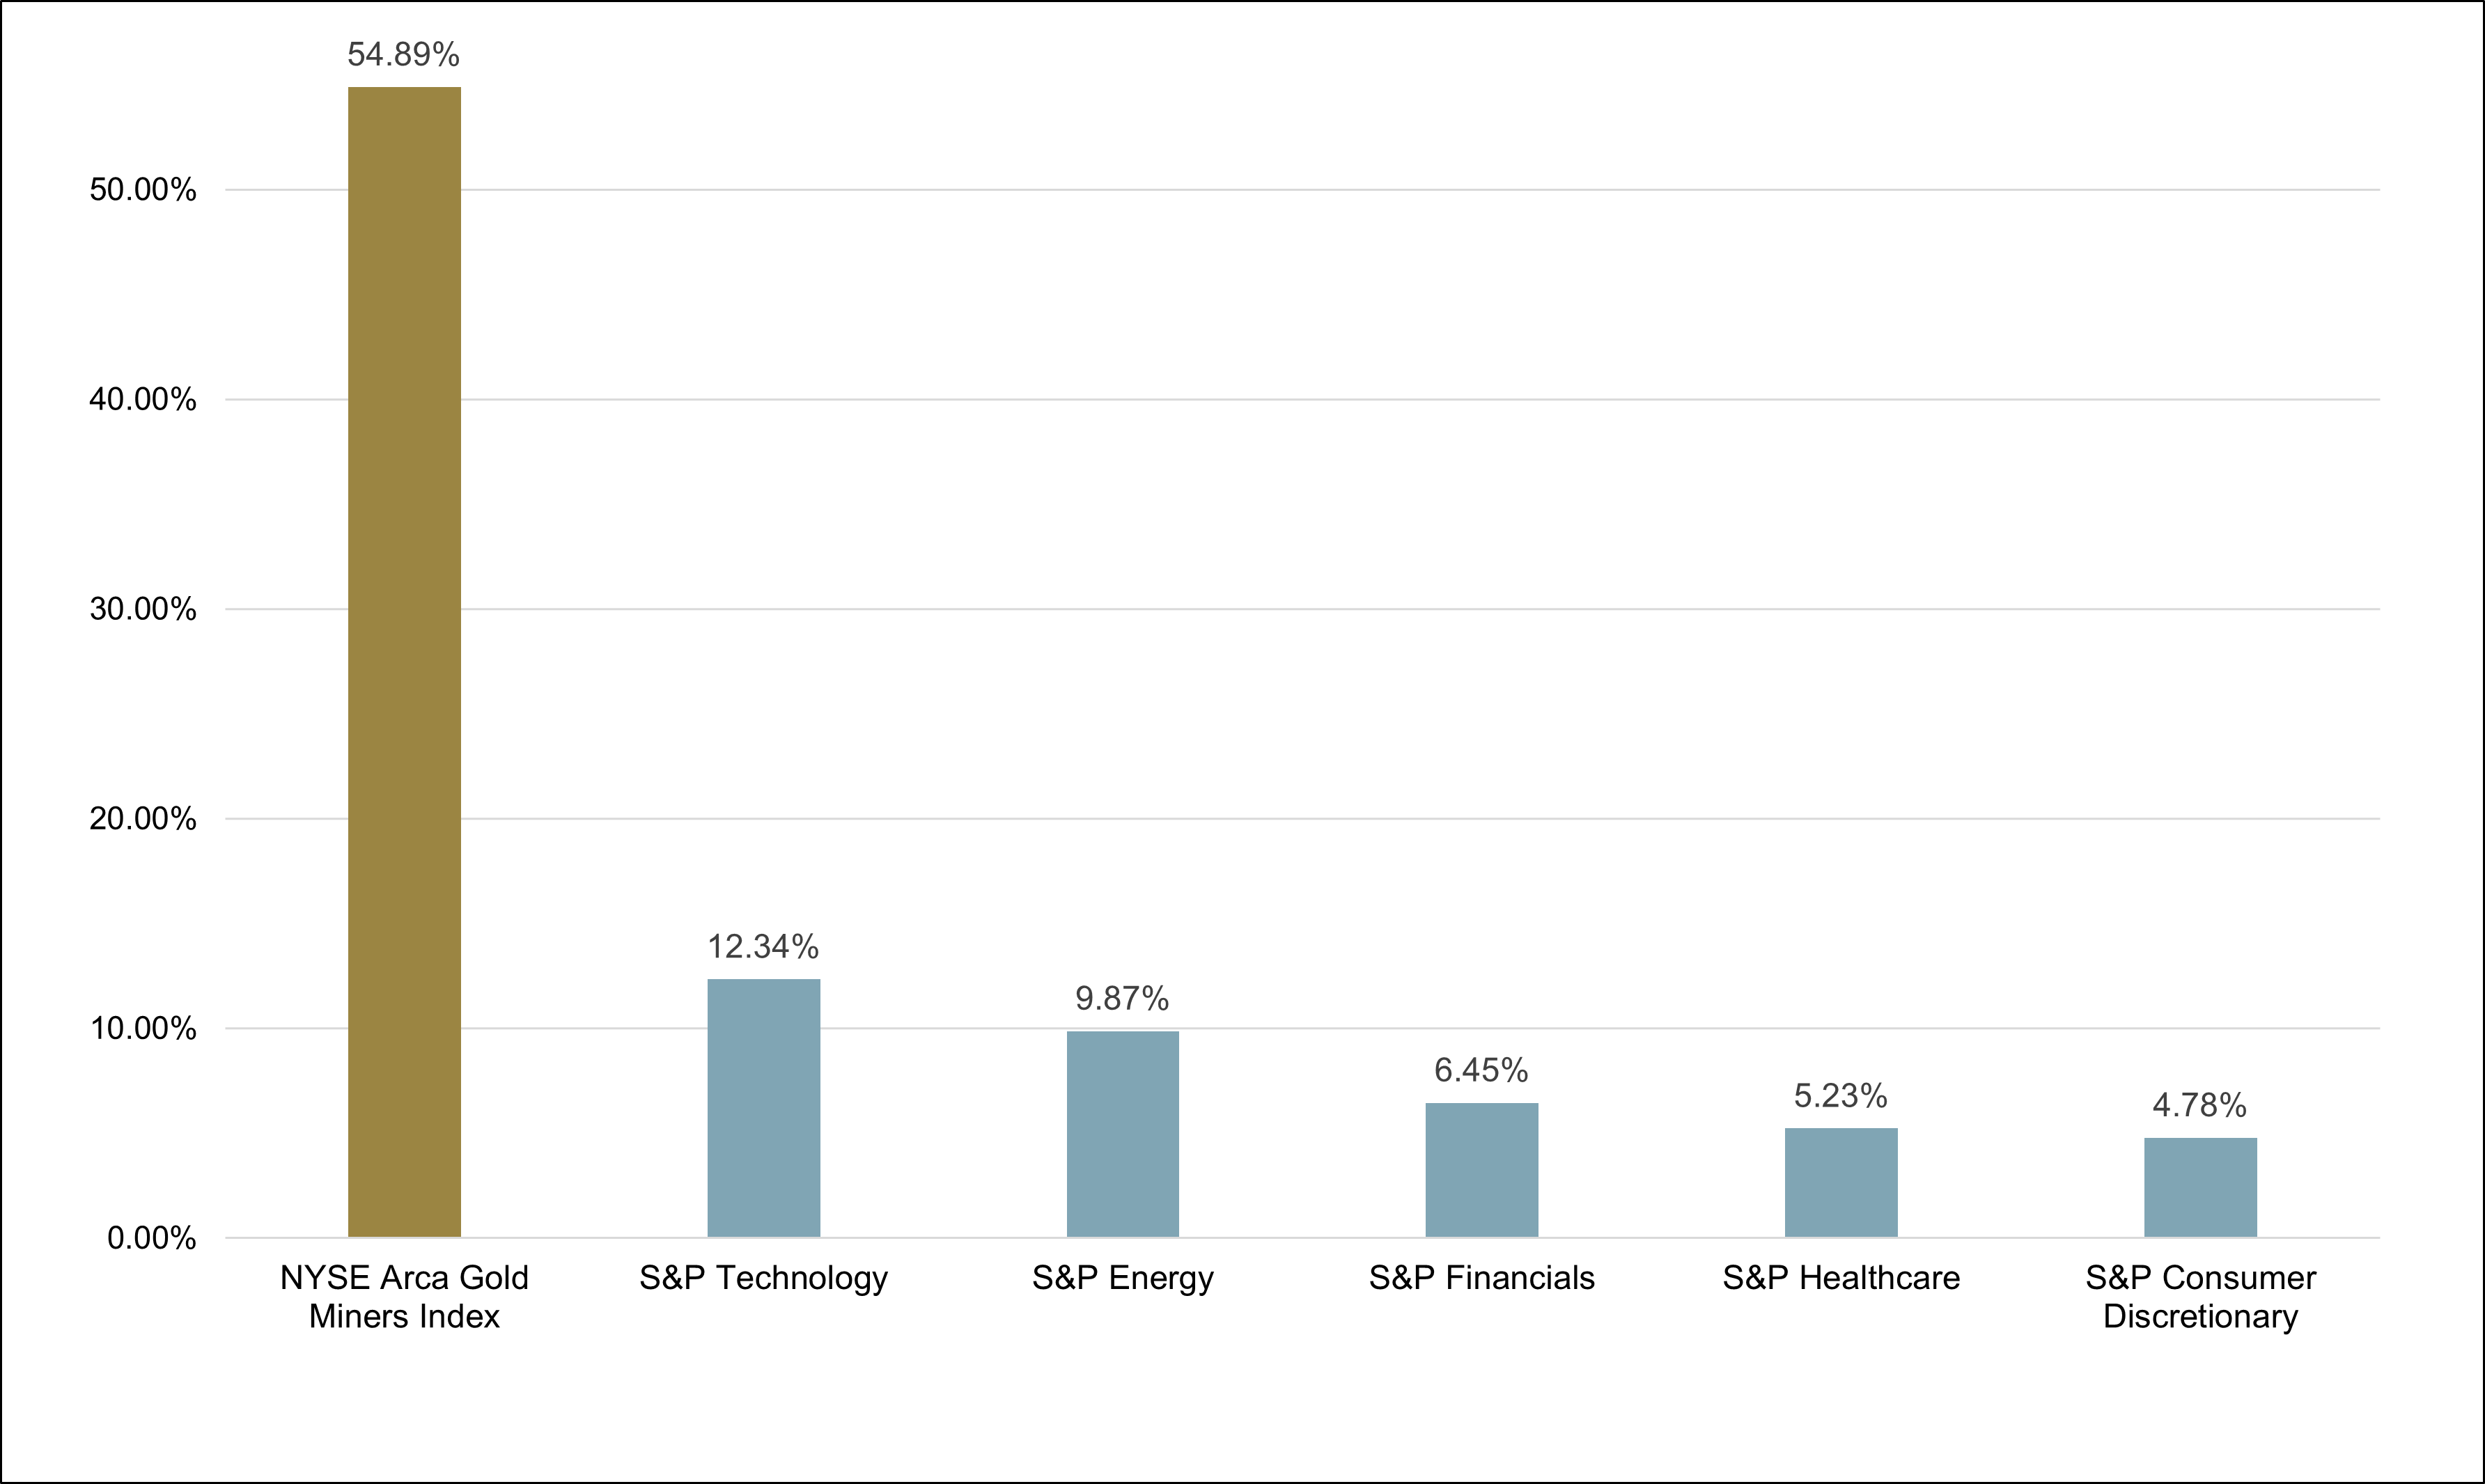
The lack of interest in precious metals miners seems as inexplicable as it is unsustainable. Strong fundamentals, along with extreme investor disinterest, suggest that mining stocks are likely to continue to outperform all other S&P sectors, as they have over the past twelve months. It is the table we have been pounding, endlessly it seems, since the most recent leg of the gold bull market commenced during the throes of the COVID-19 pandemic.
Figure 2: Gold Miners Have Outperformed All S&P Sectors over the Past 12 Months as of 6/30/2025
Source: Bloomberg. Data as of June 30, 2025.
Gold Bullion vs. Miners
The investment case for gold bullion, in its least controversial form, rests on the prudence of portfolio diversification. Those benefits are amply demonstrated by dispassionate historical analysis. It is a sensible argument that appeals to conservative, adult instincts. Accessibility, once challenging, has been eased for equity investors by the profusion of ETF wrappers.
Mining stocks, a logical subset of the diversification tool kit, get failing grades when it comes to judicious exposure. The bad rap includes a (now ancient) history of juvenile capital allocation decisions, volatility, illiquidity and a business model that disturbs the planet’s surface, not to mention mainstream aversion to the rationale for a gold bull market’s very existence. Bullion is to gold miners as hamburgers are to abattoirs. “Portfolio diversification” is just a polite euphemism for protection against currency depreciation and bear markets. While bullion may provide a safe haven, the miners could provide torque to events for which the markets are improperly positioned.
The Next Gold Price Catalyst: Financial Market Dysfunction
A token gold allocation of 2% to 3% is, in our opinion, just a “CYA” acknowledgement of the possibility of market adversity while remaining asleep as to any likelihood or timing. Predicting the precise turning point in the bull equity market is, of course, a hazardous exercise with many past misfires by well-regarded observers. In our opinion, however, there is strong evidence suggesting the onset of a bear market is nigh including extremes of valuation, technical analysis, investor psychology and behavior, and hyperactive retail participation.
A token 2% to 3% gold stake is just hitting the snooze button on a looming bear market alarm.
A multitude of valuation red flags is covered here (Grant’s, 7/16/25):
The charging-bull crowd can surely use such continued operating momentum, with the S&P 500 changing hands at 22.3 times forward earnings, compared with 5-year and 10-year average valuations of 19.9 and 18.4 times, respectively. Other indicators point to an historically stretched market, with the index perched at 3.29 times trailing sales, the highest since at least 1990 and nearly one full turn above that seen at the peak of the dot-com bubble. The free cash-flow yield crouches at 2.76%, near February’s post-Lehman Brothers low of 2.71% and compared with a 4.19% average reading over the past 10 years, while the 1.23% dividend yield undercuts the 1.26% yield seen during risk appetite on record. In turn, average cash levels have ebbed to 3.9% from 4.2% in June, approaching February’s 3.5% (which marked the lowest reading on record dating to 2010) and triggering a sell signal from BofA’s in-house trading model.”
More broadly, the FT Wilshire 5000 Index4 commands an aggregate market value near $62 trillion, equivalent to just over 208.1% of U.S. GDP. Famously dubbed the Buffett Indicator,5 that metric elicited the following commentary from the Oracle of Omaha to Forbes in December 2001: ‘If the ratio approaches 200%—as it did in 1999 and a part of 2000—you are playing with fire.’ The stock market’s sterling post–Liberation Day rebound has given a new boost to market morale, as Tuesday’s release of the latest Bank of America Global Fund Manager Survey shows the biggest three-month rise in Don’t look down.
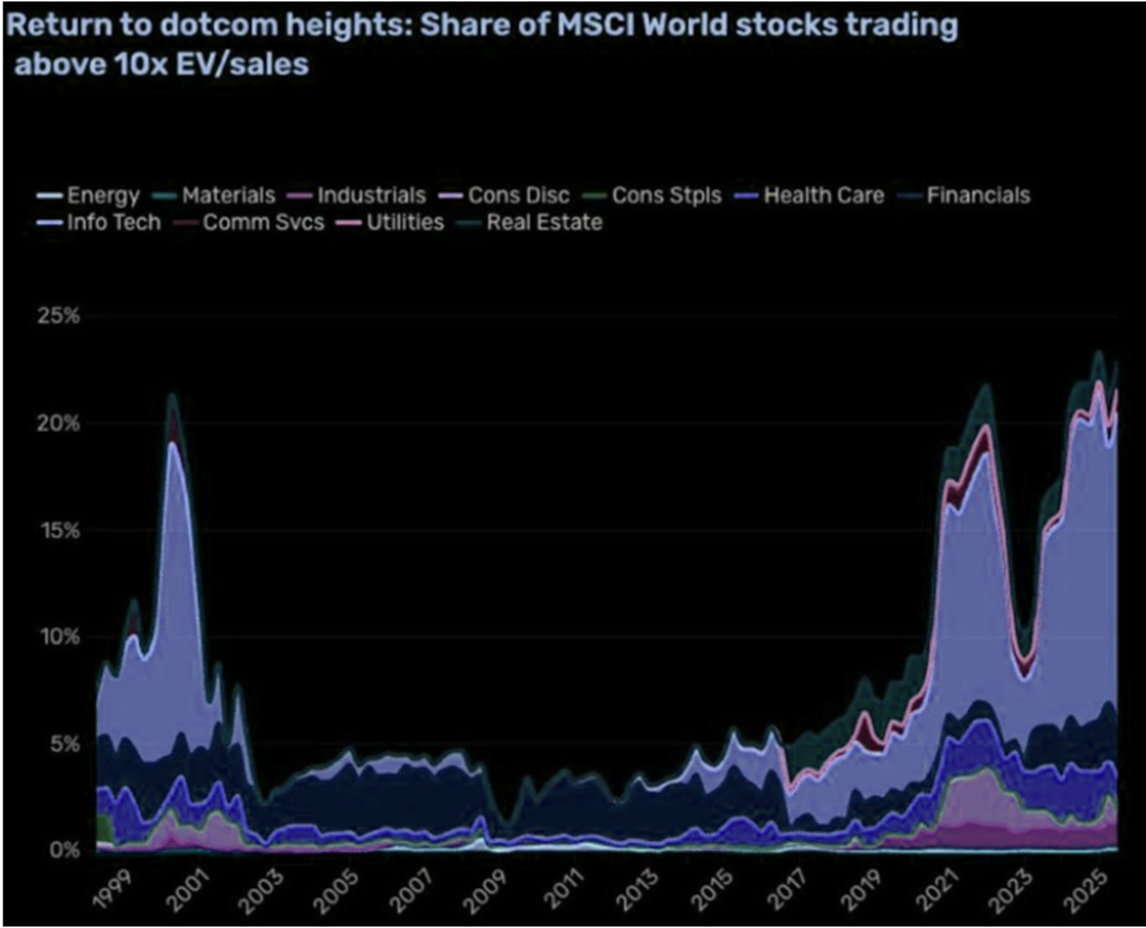
A valuation red flag not mentioned in Grant’s is depicted in the Zero Hedge chart in Figure 3.
Figure 3. Return to Historic Heights The percentage of global stocks trading above 10x EV/Sales has reached the highest level in history, surpassing both the Dot-Com Bubble and the 2021 meme mania.
Source: Barchart/Man.
Thanks to David “Haymaker” Hay for the above chart and the context provided. Stocks trading at 10 times sales are generally considered to be in bubble territory. The illogic of paying this type of valuation for most, but not all, equities was famously articulated by Sun Microsystem’s co-founder and then-CEO Scott McNealy in March 2002.* This was after its stock price had been obliterated in the wake of the first tech bubble’s implosion.
*McNealy quoted in BusinessWeek, 2002:
At 10 times revenues, to give you a 10-year payback, I have to pay you 100% of revenues for 10 straight years in dividends. That assumes I can get that by my shareholders. That assumes I have zero cost of goods sold, which is very hard for a computer company. That assumes zero expenses, which is really hard with 39,000 employees. That assumes I pay no taxes, which is very hard. And that assumes you pay no taxes on your dividends, which is kind of illegal. And that assumes with zero R&D for the next 10 years, I can maintain the current revenue run rate. Now, having done that, would any of you like to buy my stock at $64? Do you realize how ridiculous those basic assumptions are? You don’t need any transparency. You don’t need any footnotes. What were you thinking?
There is a good case based on technical analysis that the equity market is skating on thin ice. Highly respected chartist Carter Worth suggests that the S&P 500 Index has run out of upside potential based on well-defined historical trend lines:
Figure 4. S&P 500 20-Year Trendline (2006-2025)
Source: Worth Charting as of July 31, 2025.
As to the danger signals emitted from euphoric psychology, special thanks go to Bitcoin Magazine (August 1, 2025) for this gushing explanation of the rationale for crypto trusts:
Strategy (formerly MicroStrategy)6 delivered a second-quarter earnings call that demonstrated more than financial results; it revealed a robust and deliberate treasury architecture designed to make Bitcoin the centerpiece of shareholder value creation. The call was dense with insight into how a public company can re-engineer its balance sheet, capital structure, and market signaling to outperform traditional fiat-based treasuries.
An excellent discussion of the proliferation of bitcoin trust issuance (Bitcoin Treasury Cos: Lessons from the 1929 Crash) suggests analogies to the investment trusts of the 1920s or mortgage-backed securities that preceded the 2007-2008 Global Financial Crisis (GFC).
Additional grist for the bearish mill includes the recent preponderance of insider selling. The Kobeissi Letter (@KobeissiLetter) posted on X at 3:28 PM on Tuesday, Aug 05, 2025:
Yet another sign of a market top is hyperactive retail trading in zero-day options. Zero-day options are options contracts that expire on the same day they are traded. These have become increasingly popular among traders due to their potential for quick profits and high leverage. Retail investors account for over half of all zero-day options trading flow, and recently, zero-day options surged to an all-time high, comprising 61% of total S&P 500 volume.7
What, Me Worry?
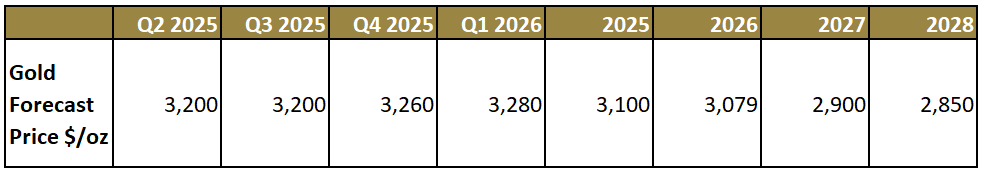
For all but the few investors that pay close attention to gold macros, it seems the consensus expectation is for minimal upside versus considerable downside risk. Figure 5 depicts Wall Street’s bearish consensus expectation. Investor hesitation to position gold stocks most likely is directly connected, in our opinion, to the resolute bullishness that props mainstream equity positioning. Until real economic adversity sets in, interest in gold and gold stock exposure will likely continue to be a case of “who needs it?” Alfred E. Neuman is alive and well.
Figure 6. Consensus Forecasts on Gold Prices to 2028
Source: Bloomberg. Data as of 6/30/2025.
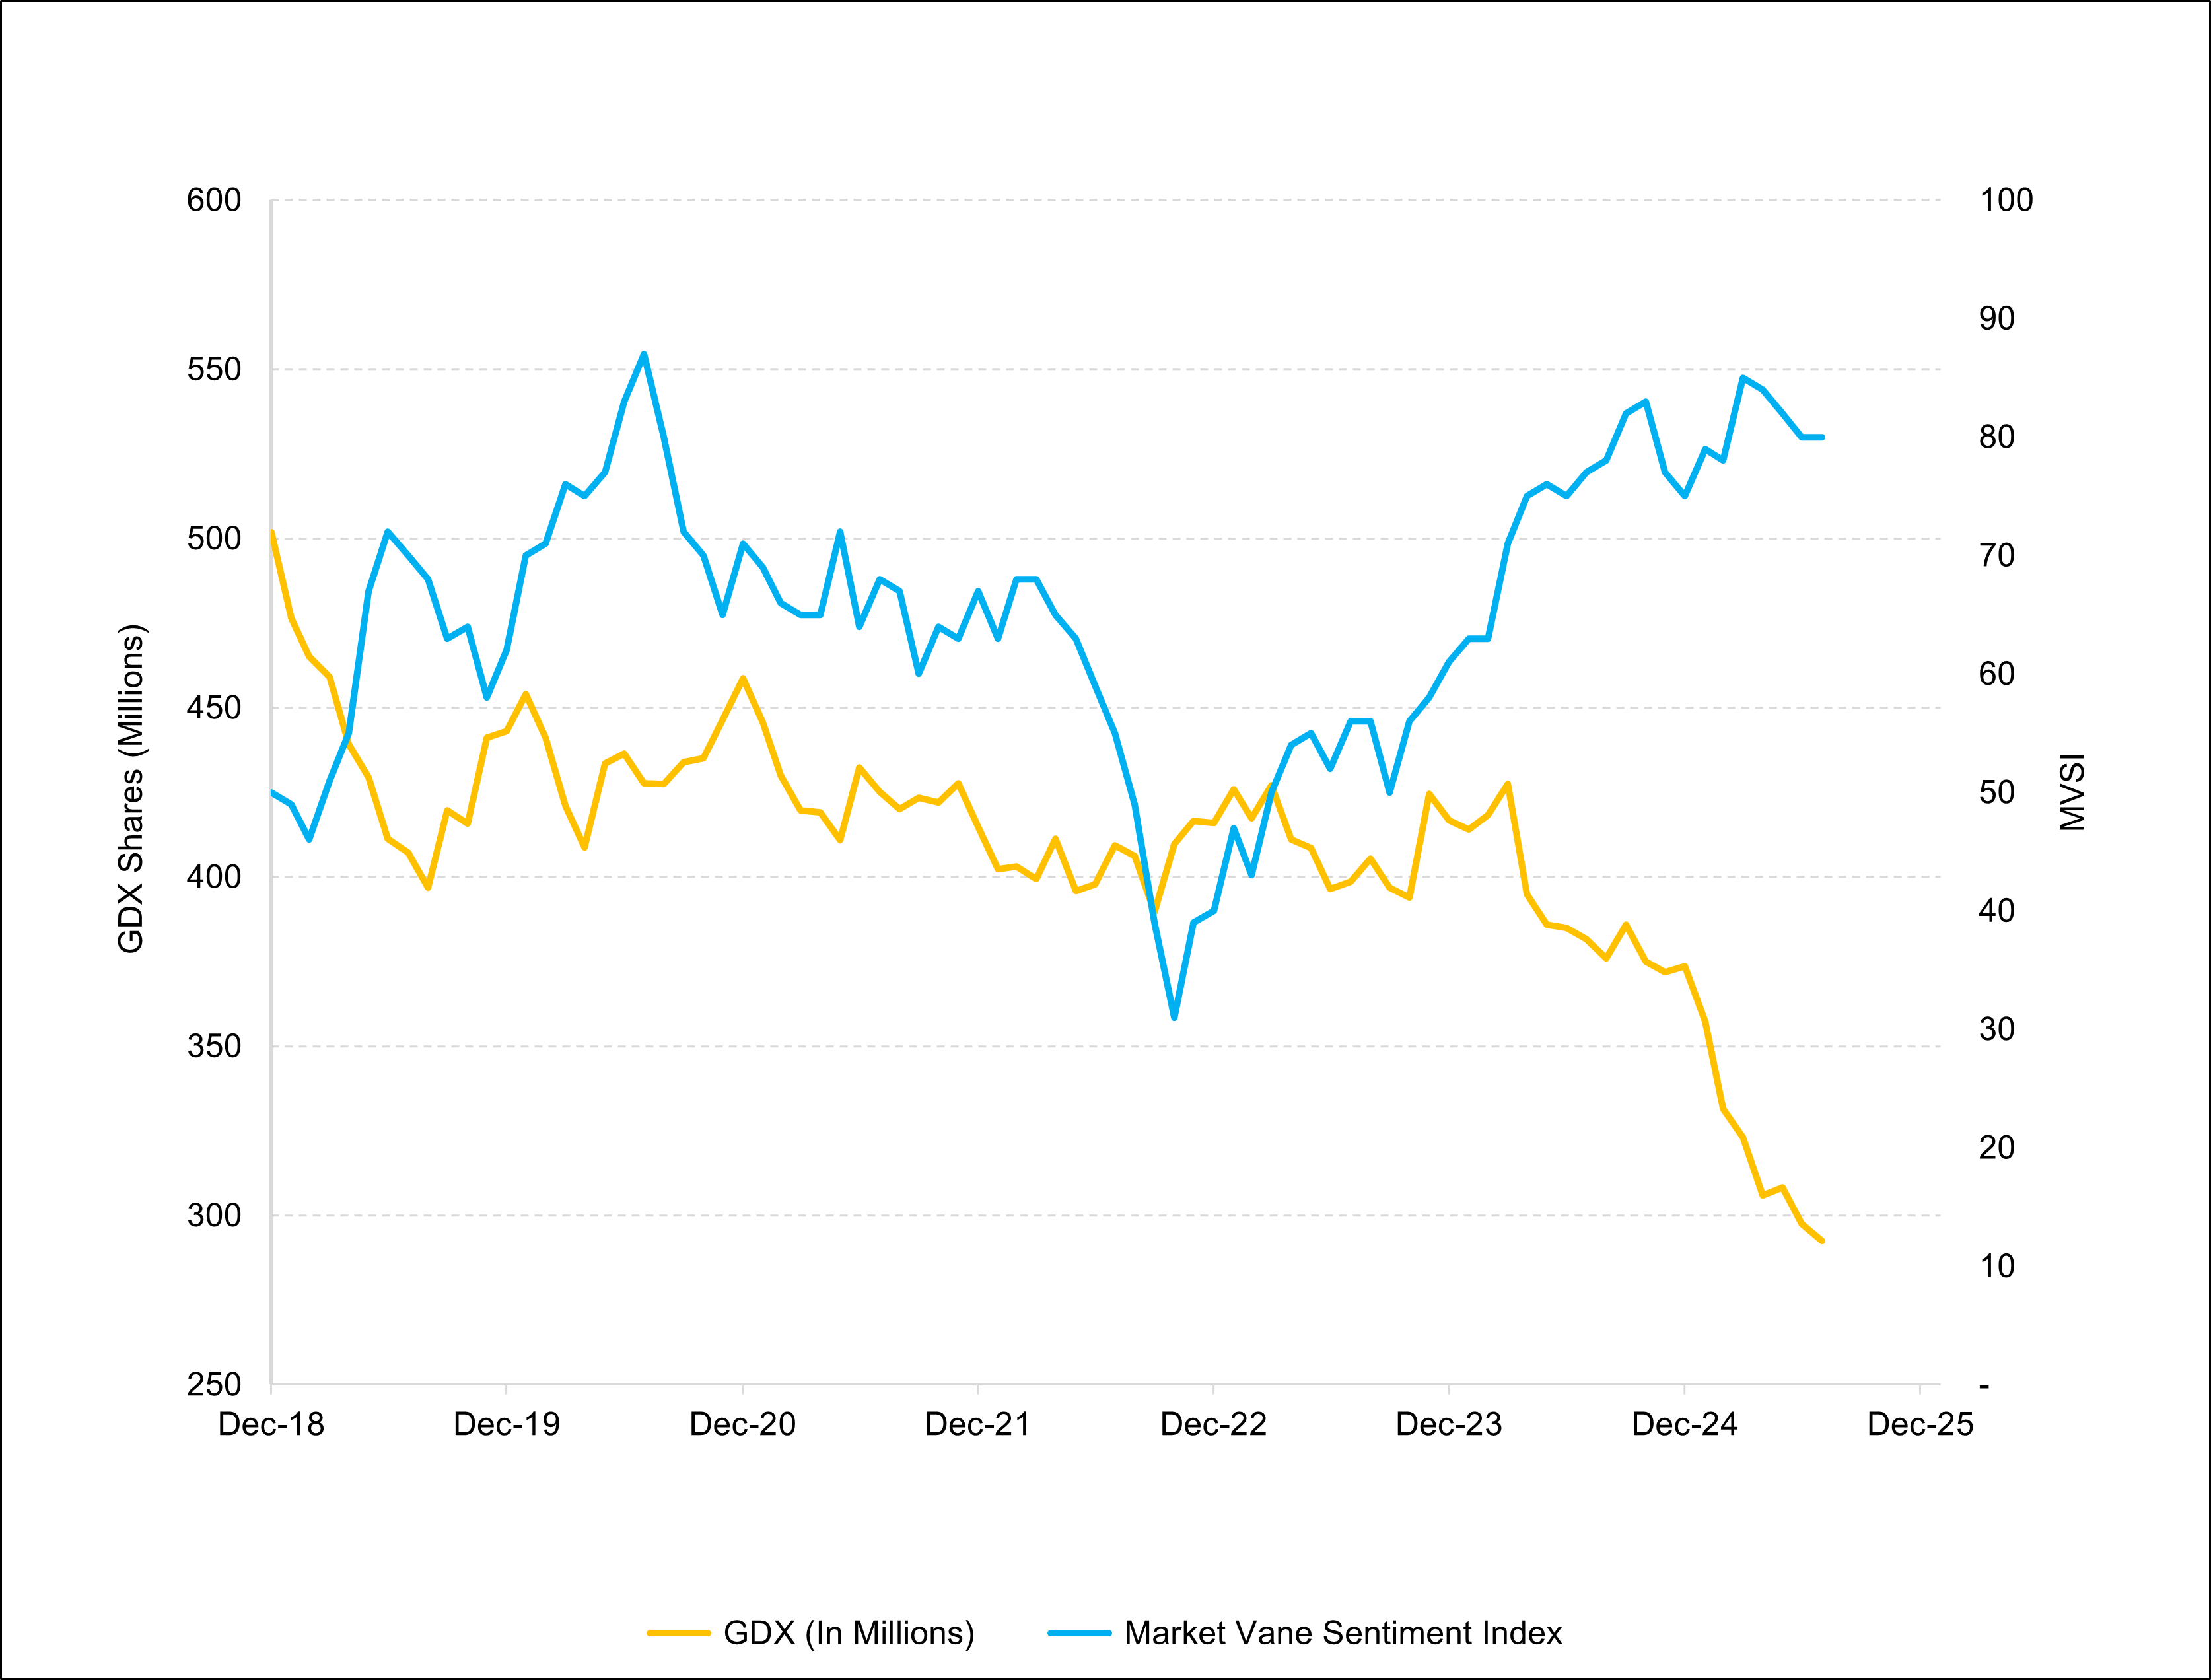
Is gold nonetheless a “crowded” trade? As reported by the June Bank of America (BofA) Global Fund Manager Survey, 41% of respondents think so. However, BofA also reported that investors had allocated just 3.5% of their portfolios to gold. Sentiment is bullish, as reflected by Market Vane (Figure 6), but below the “Tariff” Peak of Q1 ’25 and the COVID Peak of 2019. The steady liquidation of GDX gold mining shares suggests investor aversion to gold exposure.
Figure 7. GDX Shares vs. Market Vane Sentiment Index8 (2018-2025)
Sources: Bloomberg and Market Vane. Data as of 8/13/2025.
In our view, gold is consolidating its April 2025 spike to $3,500 per ounce. The many factors that launched gold to that temporary peak, including central bank buying, de-dollarization, concerns over the U.S. fiscal situation and geopolitical risk have continuing latency and explain why gold is trading effortlessly in the current range of $3,200 to $3,400. They have been extensively discussed, however, and one might say already “priced in” to the current trading range. What we believe has not been priced in, however, is a significant decline in equities.
Mainstream Support for Gold
In The Strategic Case for Gold and Oil in Long-Run Portfolios (5/28/2025), Goldman Sachs co-head of Commodity Research Daan Struyven states:9
Following the recent failure of U.S. bonds to protect against equity downside and the rapid rise in U.S. borrowing costs, investors seek protection for equity-bond portfolios. During any 12-month period when real returns were negative for both stocks and bonds, either oil or gold has delivered positive real returns
It is one thing for those already convinced of gold’s merit to suggest, but quite another for Goldman Sachs, that the time-honored risk mitigation portfolio strategy provided by a 40% weighting in bonds no longer functions.10 Even more attention-grabbing is Goldman’s call to substitute gold for bonds. Words from Goldman amount to gospel for investment fiduciaries managing assets of trillions that have little or no gold exposure. The message has been delivered, but the investment response has barely started, in our opinion. Even a slight reallocation as a percentage of global financial assets would have a disproportionate percentage impact on the gold price.
Goldman says gold, not bonds, is the safe haven now.
The catalyst least discussed but, in our view, most likely to power gold’s breakout into new high territory would be a general loss of confidence, either sudden or gradual, in financial assets. Gold is under-owned and highly illiquid relative to potential capital market flows. That limited illiquidity was discussed at length in our previous Sprott Gold Report, The Return of Exter’s Inverted Pyramid.
Exter’s Pyramid, conceived by economist and Fed Governor John Exter in the 1960s, is a visual representation that categorizes assets based on their liquidity and risk. The assets at the bottom of the pyramid are considered more liquid and less risky, while the assets at the top are less liquid and more risky. During times of prosperity and high confidence, capital flows towards riskier assets at the top of the pyramid, such as equities, corporate bonds and derivatives. By contrast, during times of financial crises, investors seek refuge in “safer” assets toward the bottom of the pyramid, including cash and gold.
However, Exter in all likelihood did not imagine that his pyramid would become sufficiently top heavy with derivatives and debt to nullify the liquidity of gold that he posited. We would, with respect, add to Exter’s conception the proviso that: “Where there is liquidity there is no value, and where there is value there is no liquidity.” During periods of high confidence, risky assets appear highly liquid, an illusion that rapidly dissipates when the music stops.
A swing in the pendulum of confidence, as it seeps into investment psychology, has the potential to destroy illusory wealth, disrupt the economy and possibly destabilize political order. The case for allocating a meaningful slice of liquid assets to unlevered positions in physical metals has never seemed stronger. Why tip toe around the edges of a plausible reset of macro expectations with token exposure? The potential influx of liquid assets into gold could, in our opinion, double the U.S. dollar price within a year or two. Should this occur, profits of many mid- and small-capitalization miners could exceed their current equity market capitalization. Gold mining equities are still stuck at bargain basement valuations. We unabashedly continue to pound the table for precious metals equities and bullion alike.
Gold bullion is measured by the Bloomberg GOLDS Comdty Index.
2
Gold mining equities are measured by the NYSE Arca Gold Miners Index (GDM), a rules-based index designed to measure the performance of highly capitalized companies in the gold mining industry.
The FT Wilshire 5000 Index Series is a comprehensive, float adjusted measure of the U.S. stock market, designed to reflect the performance of all U.S. equity securities that have readily available prices.
5
The Buffett indicator (or the Buffett metric, or the Market capitalization-to-GDP ratio) is a valuation multiple used to assess how expensive or cheap the aggregate stock market is at a given point in time.
6
Strategy is the world’s first and largest Bitcoin Treasury company, and the largest independent, publicly traded business intelligence company.
7
The Cboe Volatility Index® (VIX® Index) is considered by many to be the world’s premier barometer of equity market volatility. The VIX Index is based on real-time prices of options on the S&P 500® Index (SPX) and is designed to reflect investors’ consensus view of future (30-day) expected stock market volatility. The VIX Index is often referred to as the market’s “fear gauge”.
8
Market Vane is a sentiment trading indicator used by traders to gauge market direction based on the collective investor sentiment of individual and institutional traders.
Explore the Union Project with Riverside Resources! ⛏️ The team is on-site in Sonora, Mexico, showcasing their gold exploration efforts and the potential of the old Union Mine. 🗺️ Check out the drilling process, core samples, and drone footage of the site. 👷♂️ 🔗 https://youtu.be/_O6AKIkW_1c
This was originally posted on our Voronoi app. Download the app for free on iOS or Android and discover incredible data-driven charts from a variety of trusted sources.
As the digital economy accelerates and generative AI becomes more deeply embedded in business and daily life, the physical infrastructure supporting these technologies is undergoing a transformative explosion.
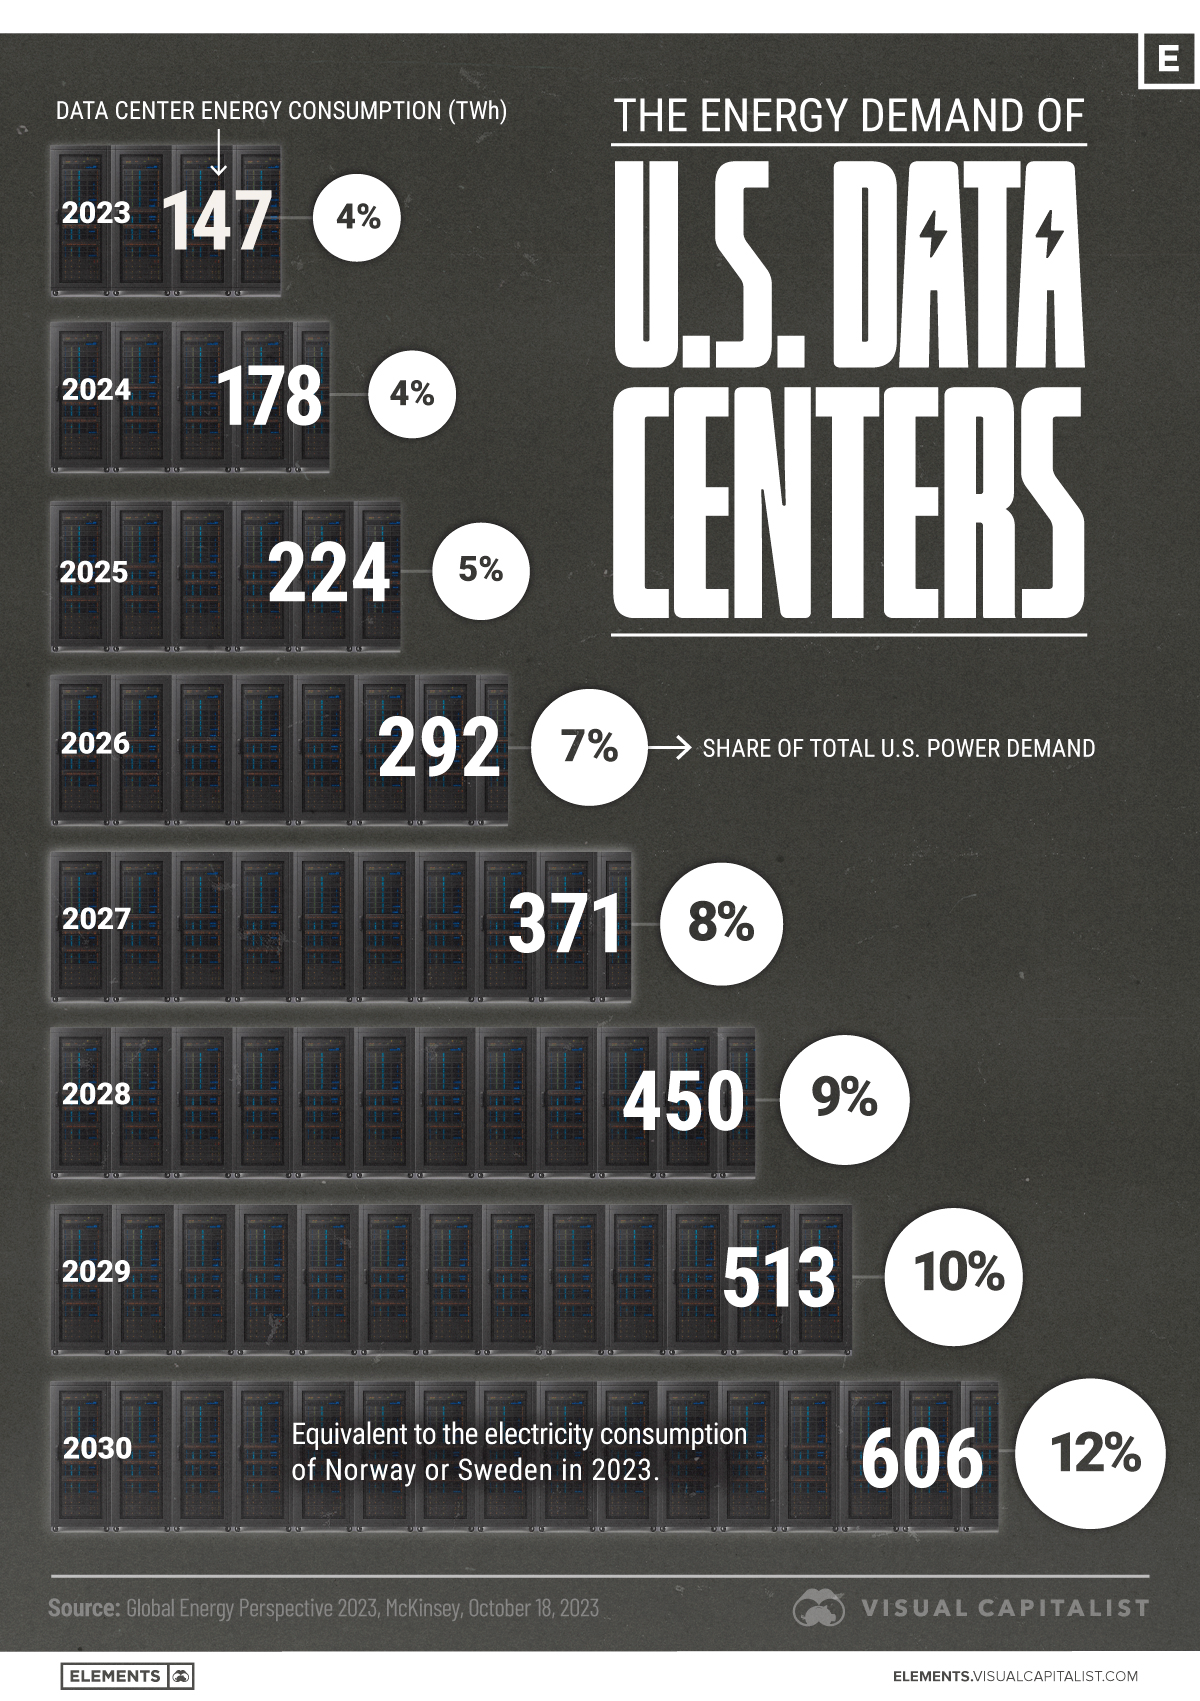
In this graphic, we use data from McKinsey to show current and projected energy demand from data centers in the United States. Data is from October 2023.
U.S. Data Centers Could Quadruple Power Demand by 2030
Today, data centers account for roughly 4% of total U.S. electricity consumption. But by 2030, that share is projected to rise to 12%, driven by unprecedented growth in computing power, storage needs, and AI model training.
In fact, U.S. data center energy demand is set to jump from 224 terawatt-hours in 2025 to 606 terawatt-hours in 2030.
Year
Consumption (TWh)
% of Total Power Demand
2023
147
4%
2024
178
4%
2025
224
5%
2026
292
7%
2027
371
8%
2028
450
9%
2029
513
10%
2030
606
12%
Meeting this projected demand could require $500 billion in new data center infrastructure, along with a vast expansion of electricity generation, grid capacity, and water-cooling systems. Generative AI alone could require 50–60 GW of additional infrastructure.
This massive investment would also depend on upgrades in permitting, land use, and supply chain logistics. For example, the lead time to power new data centers in large markets such as Northern Virginia can exceed three years. In some cases, lead times for electrical equipment are two years or more.
A Strain on the U.S. Grid
The U.S. has experienced relatively flat power demand since 2007. Models suggest that this stability could be disrupted in the coming years. Data center growth alone could account for 30–40% of all net-new electricity demand through 2030.
Unlike typical power loads, data center demand is constant, dense, and growing exponentially. Facilities often operate 24/7, with little downtime and minimal flexibility to reduce usage.
Bitcoin (BTC-USD) retreated more than 3% from its record highs on Thursday after hotter-than-expected inflation soured expectations of a large rate cut in September and Treasury Secretary Scott Bessent signaled the US won’t be purchasing bitcoin for its strategic reserve.
On Wednesday, bitcoin touched an all-time high past $123,500 per token in anticipation of looser monetary policy and corporate purchases. Crypto rolled over after July’s Producer Price Index came in much higher than expected.
During an interview with Fox Business, Bessent said US reserves of bitcoin amount to around $15 billion or $20 billion at today’s prices.
“We’ve also started to get into the 21st century — a bitcoin strategic reserve. We’re not going to be buying that, but we are going to use confiscated assets and continue to build that up,” he said.
Expectations of Fed rate cuts, coupled with heavy purchases from corporate treasuries, have driven up the price of the asset this year.
The cryptocurrency has gained 25% year to date and has rallied roughly 57% since the April lows.
Sign up to Stay Up to Date on News and Progress from Page