
RUMBlE: https://rumble.com/v754ogy-jayant-bhandari-geopolitics-gold-and-the-philosophy-of-markets.html


 Proven Probable
Hong Kong billionaire Cheah Cheng Hye has quietly turned a quarter of his fortune into gold, betting that in an era of sanctions, seizures, and geopolitical shocks, nothing beats metal you can touch.
“If you have the physical gold in the warehouse or in your bank safe, nobody owes you anything,” he told Bloomberg News last week.
While he didn’t confirm his family office’s performance and holdings, a source told Bloomberg that precious metals make up about 25% of the $1.4 billion portfolio.
The 71-year-old Cheah, who built Value Partners Group into a multibillion-dollar Hong Kong asset manager, is an outlier in the world of ultrahigh-net-worth investing, with the UBS Global Family Office Report 2025 putting the average allocation to gold and other precious metals at just 2% in 2024. Nevertheless, the billionaire urged investors to rethink their mix altogether, advocating a portfolio split of 60% equities, 20% bonds, and 20% precious metals, led by gold.
Cheah’s interview with Bloomberg took place after the gold boom of 2025, when a series of geopolitical shocks encouraged investors to seek safety in the yellow bars, but before gold set another new record, rocketing past $5,000 per ounce for the first time ever on Jan. 24.
As Fortune’s Jim Edwards noted shortly before this new milestone, the Trump “TACO trade” has been driving up the price of gold as central banks hoard bullion to hedge against the dollar. JPMorgan analysts wrote in mid-2025 that more gold increases could be coming if—and when—foreign investors continue shifting away from Treasury bonds.

Behind the gold rush is Cheah’s conviction that global finance has entered what he calls a period of massive “vault flight.” The freezing of Russian assets after the 2022 invasion of Ukraine, and more recent tensions involving Venezuela and Iran, have convinced him that politically exposed money is safer closer to home. Wealthy Asian families, he argued, are increasingly repatriating funds to insulate themselves from U.S. sanctions or potential asset seizures.
For those investors, he said, physical bullion is the preferred refuge. Cheah’s holdings are backed by gold stored in a Hong Kong government warehouse at the city’s airport, and he insists Asia‑based wealth should favor metal in vaults over “paper gold” such as purely synthetic products. His mantra—that nobody owes you anything if you hold the metal yourself—captures both skepticism about Western financial plumbing and a deeply conservative instinct about security.
Cheah’s gold pivot is also institutional. Frustrated by Western vault arrangements after he began buying in 2008, he helped launch the Value Gold ETF in 2010, designed to store physical bullion at Hong Kong’s airport facility. He remains the fund’s largest holder, with a stake worth about 1.3 billion Hong Kong dollars, or roughly $167 million, people familiar with the matter told Bloomberg.
Cheah’s bullish stance has been buttressed by markets. Entering 2026, gold, silver, copper, and tin have all hit record highs, buoyed by expectations of Federal Reserve easing, political pressure from President Donald Trump’s administration, and persistent geopolitical tensions. Silver, which he also favors, has roughly tripled over the past year, far outpacing even gold’s gains.
While Cheah may be an outlier among ultrahigh-net-worth investors, more big names in finance are coming around to his viewpoint as well. JPMorgan CEO Jamie Dimon, for instance, told Fortune in November that it was “semi-rational” for the first time in his life to have gold in one’s portfolio. That same month, “bond king” Jeffrey Gundlach said that gold had become a “real asset class” that was no longer limited to “survivalists” or “crazy speculators.” Instead, he said, people were allocating “real money because it’s real value.” Gundlach suggested maintaining an allocation, perhaps around 15% of a portfolio, because it was consolidating somewhat.
Cheah began his career as a financial journalist with the Asian Wall Street Journal and Far Eastern Economic Review, before establishing the Hong Kong/China equities research department at Morgan Grenfell Group in Hong Kong, where he was also head of research and a proprietary trader.
Source: https://www.yahoo.com/finance/news/hong-kong-billionaire-invests-25-185023322.html
Vancouver, British Columbia–(Newsfile Corp. – January 28, 2026) – Minaurum Silver Inc. (TSXV: MGG) (OTCQX: MMRGF) (“Minaurum” or the “Company”) is pleased to announce the completion of an Inferred Mineral Resource Estimate (“Resource Estimate”) at its 100%-owned Alamos Silver Project (“Alamos”) located in Sonora, Mexico.
Highlights:
“Our inferred resource estimate of 55 million ounces of AgEq, defined across portions of just three of the 26 identified vein zones at Alamos, represents a major milestone for Minaurum,” stated Darrell Rader, President and CEO of Minaurum Silver. “The estimate establishes Alamos as a high-grade silver district with a rare combination of grade and width, with each of the vein zones included remaining open for expansion. Our next step is to aggressively grow the resource through the ongoing Phase II 50,000-metre resource expansion drilling program. I would like to thank the entire Minaurum team, along with our contractors and local communities, for their contributions to this achievement.”
Table 1. Alamos Silver Project – Inferred Mineral Resource Estimate Summary (150 g/t AgEq cut-off)
| Inferred Mineral Resource: | Average Grade | Metal Content | ||||||||||||
| Mass | AgEq | Ag | Au | Cu | Pb | Zn | AgEq | Ag | Au | Cu | Pb | Zn | ||
| Ktonnes | (g/t) | (g/t) | (g/t) | (%) | (%) | (%) | (koz) | (koz) | (koz) | (klbs) | (klbs) | (klbs) | ||
| Vein | ||||||||||||||
| Promontorio/ | ||||||||||||||
| Veta Grande | 1,835 | 281 | 138 | 0.31 | 0.40 | 1.11 | 2.80 | 16,602 | 8,142 | 17.99 | 16,060 | 44,904 | 113,272 | |
| Veta Guijas | 124 | 202 | 92 | 0.17 | 0.45 | 0.89 | 1.82 | 806 | 365 | 0.67 | 1,230 | 2,433 | 4,975 | |
| Vela El Cien | 561 | 299 | 136 | 0.49 | 0.42 | 1.69 | 2.34 | 5,388 | 2,448 | 8.77 | 5,182 | 20,902 | 28,941 | |
| Vela El Cien HW | 152 | 283 | 159 | 0.07 | 0.32 | 1.36 | 2.98 | 1,381 | 777 | 0.33 | 1,059 | 4,557 | 9,986 | |
| Veta Oeste | 186 | 379 | 218 | 0.45 | 0.23 | 1.47 | 3.37 | 2,266 | 1,302 | 2.70 | 955 | 6,028 | 13,819 | |
| Travesia | 373 | 187 | 125 | 0.12 | 0.36 | 0.52 | 0.49 | 2,247 | 1,499 | 1.39 | 2,944 | 4,276 | 4,029 | |
| Total | 3,231 | 276 | 140 | 0.31 | 0.39 | 1.17 | 2.46 | 28,691 | 14,532 | 31.86 | 27,431 | 83,100 | 175,023 | |
| Europa/ | ||||||||||||||
| Europa | 1,426 | 402 | 306 | 0.06 | 0.54 | 0.75 | 1.41 | 18,435 | 14,006 | 2.57 | 16,882 | 23,578 | 44,327 | |
| Europa HW | 409 | 351 | 274 | 0.07 | 0.48 | 0.38 | 1.03 | 4,621 | 3,604 | 0.87 | 4,355 | 3,426 | 9,287 | |
| Europa HW2 | 51 | 242 | 167 | 0.02 | 0.41 | 0.72 | 1.10 | 396 | 274 | 0.03 | 462 | 810 | 1,237 | |
| Europa HW3 | 45 | 308 | 244 | 0.01 | 0.37 | 0.64 | 0.88 | 446 | 353 | 0.01 | 370 | 635 | 873 | |
| Europa HW4 | 32 | 667 | 502 | 0.02 | 0.26 | 2.05 | 4.69 | 686 | 517 | 0.02 | 184 | 1,446 | 3,309 | |
| Nuevas Europa | 53 | 428 | 358 | 0.03 | 0.39 | 0.62 | 0.98 | 729 | 611 | 0.05 | 456 | 724 | 1,145 | |
| Nuevas Europa HW | 119 | 300 | 238 | 0.06 | 0.32 | 0.40 | 0.99 | 1,149 | 909 | 0.24 | 845 | 1,049 | 2,597 | |
| Total | 2,135 | 386 | 295 | 0.06 | 0.50 | 0.67 | 1.33 | 26,463 | 20,274 | 3.78 | 23,554 | 31,669 | 62,775 | |
| Grand Total | 5,366 | 320 | 202 | 0.21 | 0.43 | 0.97 | 2.01 | 55,154 | 34,806 | 35.64 | 50,985 | 114,769 | 237,798 | |
Notes:
Table 2. Alamos Silver Project – Inferred Mineral Resource Estimate Sensitivity Table
| Average Grade | Metal Content | |||||||||||||
| Mass | AgEq | Ag | Au | Cu | Pb | Zn | AgEq | Ag | Au | Cu | Pb | Zn | ||
| Resource Case | Ktonnes | (g/t) | (g/t) | (g/t) | (%) | (%) | (%) | (koz) | (koz) | (koz) | (klbs) | (klbs) | (klbs) | |
| Case 1. 115 g/t Equivalent Silver Cutoff | ||||||||||||||
| Promontorio | 4,608 | 233 | 118 | 0.26 | 0.33 | 0.94 | 2.07 | 34,450 | 17,487 | 38.39 | 33,352 | 95,877 | 210,519 | |
| Europa | 2,459 | 353 | 269 | 0.05 | 0.47 | 0.62 | 1.24 | 27,889 | 21,295 | 3.92 | 25,295 | 33,375 | 67,030 | |
| Total | 7,067 | 274 | 171 | 0.19 | 0.38 | 0.83 | 1.78 | 62,339 | 38,782 | 42.31 | 58,647 | 129,252 | 277,549 | |
| Case 2. 125 g/t Equivalent Silver Cutoff | ||||||||||||||
| Promontorio | 4,031 | 249 | 126 | 0.28 | 0.35 | 1.02 | 2.20 | 32,204 | 16,290 | 36.27 | 31,414 | 90,843 | 195,348 | |
| Europa | 2,418 | 357 | 273 | 0.05 | 0.47 | 0.62 | 1.25 | 27,721 | 21,182 | 3.88 | 25,099 | 33,091 | 66,607 | |
| Total | 6,449 | 289 | 181 | 0.19 | 0.40 | 0.87 | 1.84 | 59,925 | 37,472 | 40.16 | 56,513 | 123,933 | 261,955 | |
| Case 3. 140 g/t Equivalent Silver Cutoff | ||||||||||||||
| Promontorio | 3,520 | 266 | 134 | 0.30 | 0.37 | 1.11 | 2.36 | 30,043 | 15,191 | 33.57 | 29,007 | 86,480 | 183,041 | |
| Europa | 2,248 | 373 | 286 | 0.05 | 0.49 | 0.65 | 1.29 | 26,988 | 20,688 | 3.80 | 24,079 | 32,164 | 63,718 | |
| Total | 5,768 | 308 | 194 | 0.20 | 0.42 | 0.93 | 1.94 | 57,031 | 35,879 | 37.38 | 53,087 | 118,644 | 246,759 | |
| Case 4. 150 g/t Equivalent Silver Cutoff | ||||||||||||||
| Promontorio | 3,231 | 276 | 140 | 0.31 | 0.39 | 1.17 | 2.46 | 28,691 | 14,532 | 31.86 | 27,431 | 83,100 | 175,023 | |
| Europa | 2,135 | 386 | 295 | 0.06 | 0.50 | 0.67 | 1.33 | 26,463 | 20,274 | 3.78 | 23,554 | 31,669 | 62,775 | |
| Total | 5,366 | 320 | 202 | 0.21 | 0.43 | 0.97 | 2.01 | 55,154 | 34,806 | 35.64 | 50,985 | 114,769 | 237,798 | |
| Case 5. 165 g/t Equivalent Silver Cutoff | ||||||||||||||
| Promontorio | 2,744 | 297 | 152 | 0.33 | 0.41 | 1.25 | 2.60 | 26,238 | 13,420 | 28.89 | 24,949 | 75,663 | 157,356 | |
| Europa | 2,035 | 397 | 304 | 0.06 | 0.51 | 0.69 | 1.36 | 25,959 | 19,910 | 3.71 | 23,024 | 31,128 | 61,127 | |
| Total | 4,779 | 340 | 217 | 0.21 | 0.46 | 1.01 | 2.07 | 52,197 | 33,330 | 32.60 | 47,973 | 106,791 | 218,483 | |
| Case 6. 175 g/t Equivalent Silver Cutoff | ||||||||||||||
| Promontorio | 2,518 | 309 | 158 | 0.34 | 0.43 | 1.30 | 2.71 | 24,993 | 12,791 | 27.48 | 23,643 | 72,378 | 150,307 | |
| Europa | 1,982 | 403 | 309 | 0.06 | 0.52 | 0.70 | 1.38 | 25,662 | 19,693 | 3.68 | 22,731 | 30,661 | 60,331 | |
| Total | 4,500 | 350 | 225 | 0.22 | 0.47 | 1.04 | 2.12 | 50,656 | 32,484 | 31.16 | 46,375 | 103,039 | 210,638 | |
The Resource Estimate lies in portions of the 3 veins of the 26 identified veins in the Alamos district, roughly 2 kilometres of approximately 30 known kilometres of cumulative vein strike length (Figures 1-3).
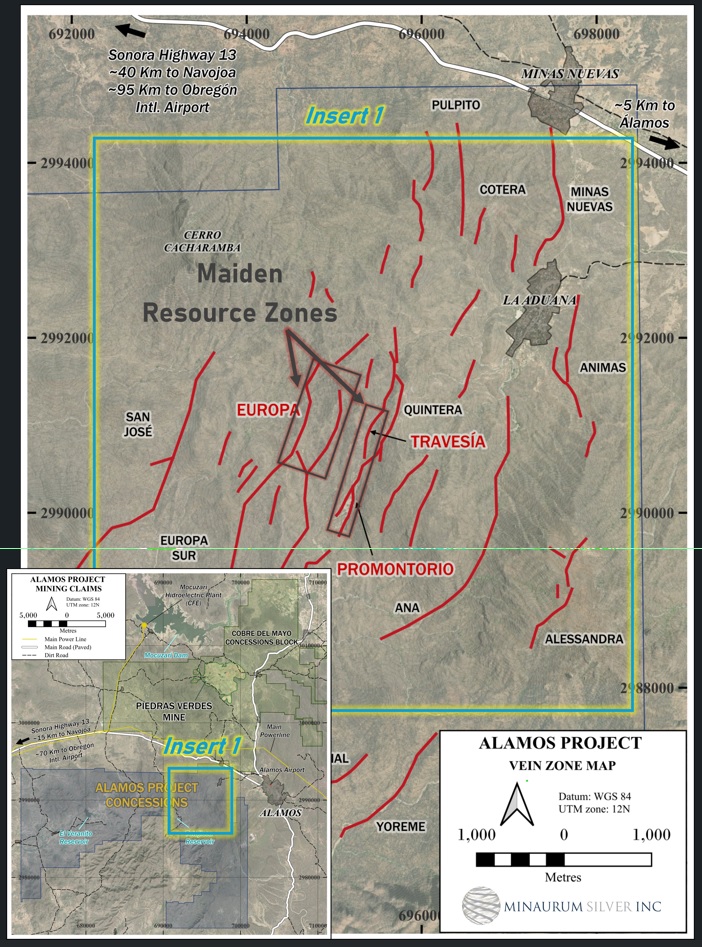
Figure 1. Alamos Silver Project Vein Zones – 55.2 Moz AgEq grading 320 g/t AgEq lies on Promontorio, Travesia, and Europa vein zones located within the black boxed outlines.
To view an enhanced version of this graphic, please visit:
https://images.newsfilecorp.com/files/3455/281507_image1.jpg
Drill hole spacing within the modeled vein domains averages approximately 80 metres, with locally tighter spacing in higher-grade portions of the Promontorio vein zone. Most of the resource occurs in unmined zones, with partially mined-out areas in the Promontorio vein zone. Interpreted void volumes associated with historical mining have been deducted from the Resource Estimate based on interpretations of historical longitudinal sections, mine maps, and drill hole data. The resource remains open in along strike and down dip on both the Promontorio and Europa vein zones. Multiple other veins in the district have high-grade intercepts that await potential resource definition.
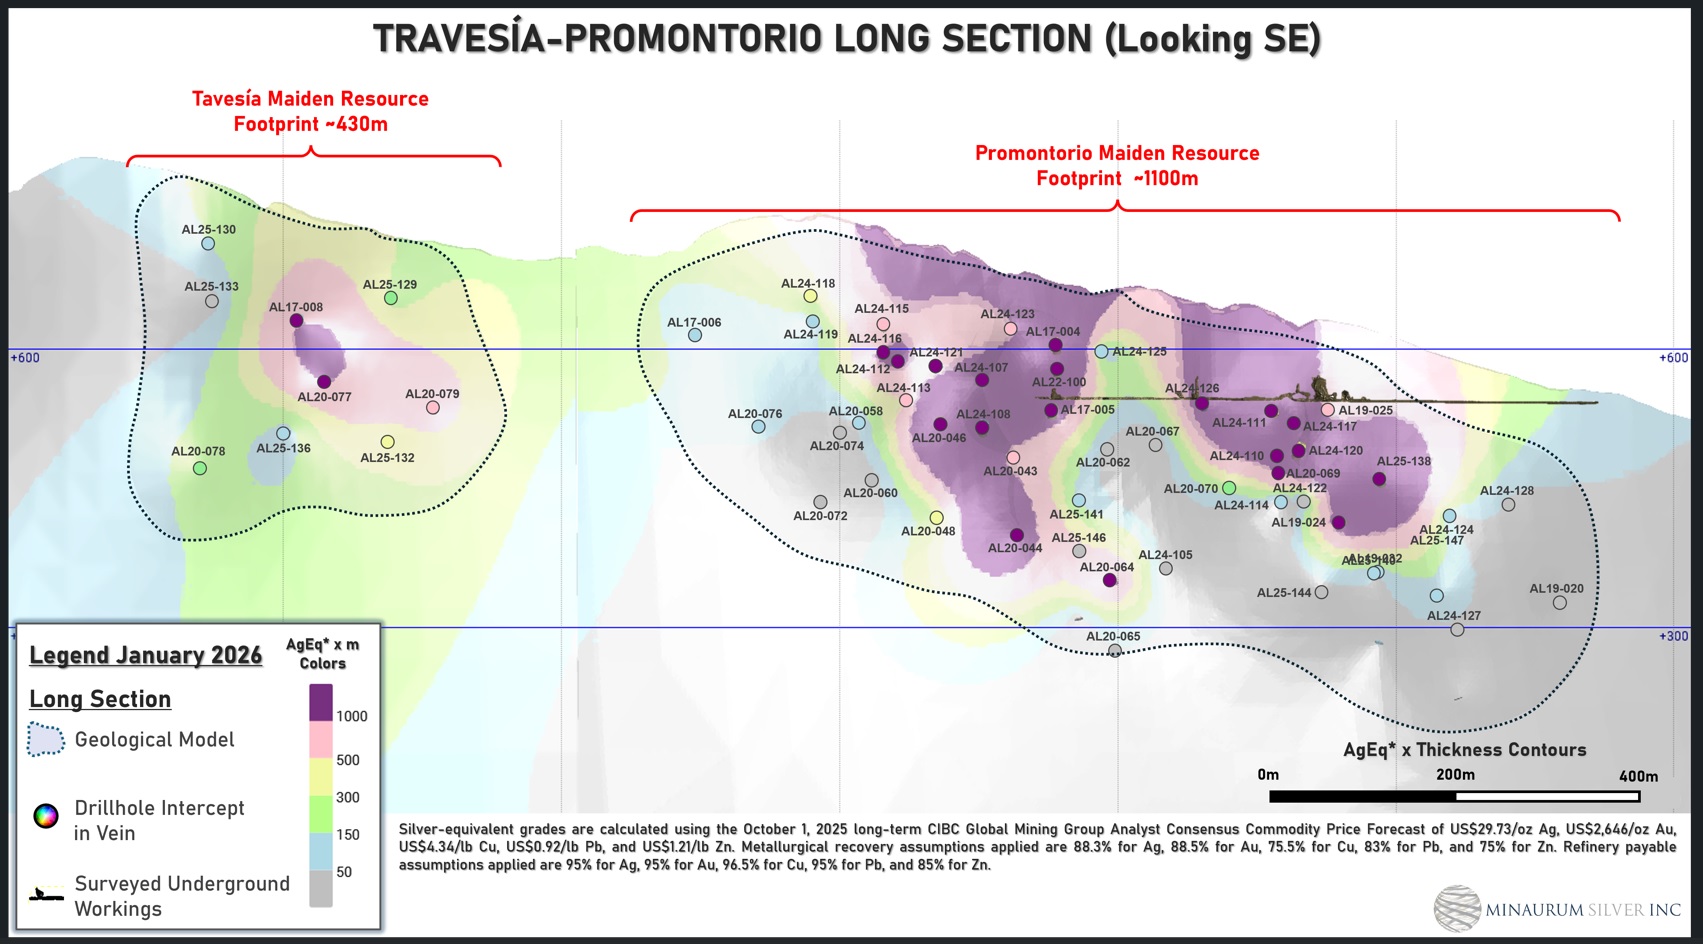
Figure 2. Travesia-Promontorio vein zone longitudinal section. Dotted line indicates the outline of the geological model used in calculating resources. This vein zone comprises 28.7 Moz AgEq grading 276 g/t AgEq. Click to enlarge.
To view an enhanced version of this graphic, please visit:
https://images.newsfilecorp.com/files/3455/281507_image2.jpg
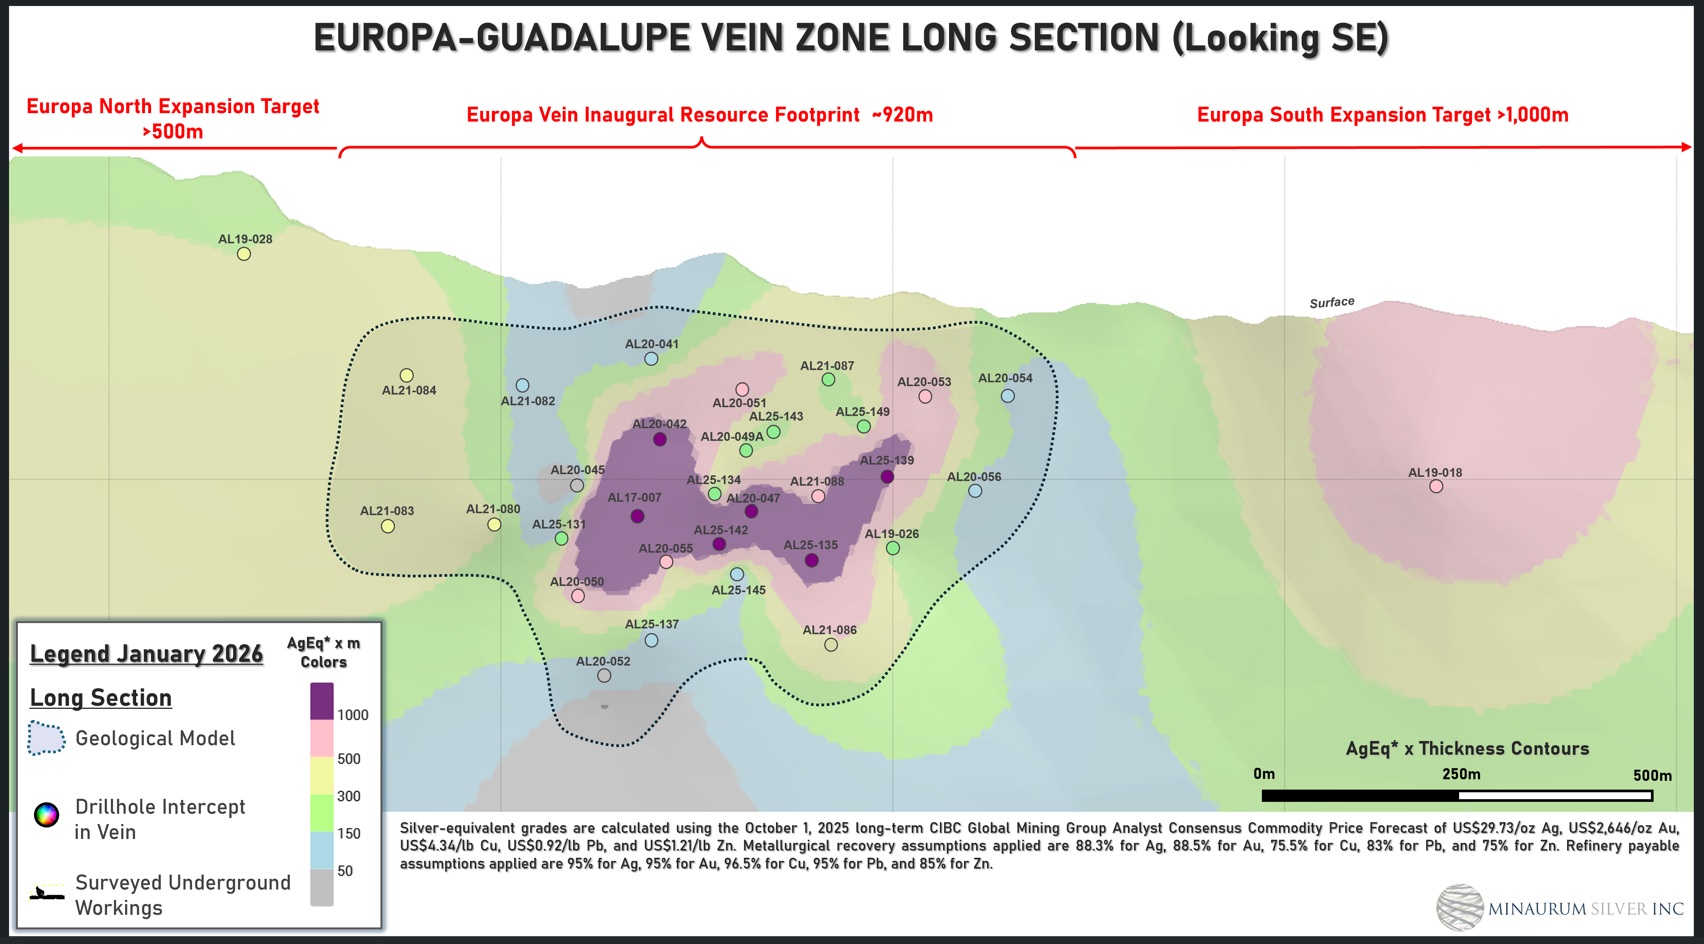
Figure 3. Europa vein zone longitudinal section. Dotted line indicates the outline of the geological model used in calculating resources. This vein zone comprises 26.5 Moz AgEq grading 386 g/t AgEq. Click to enlarge.
To view an enhanced version of this graphic, please visit:
https://images.newsfilecorp.com/files/3455/281507_image3.jpg
The Alamos Project Resource Estimate is based on the following key assumptions and parameters: specific gravity values of 2.72 for the Promontorio and Travesia veins and 2.63 for the Europa vein, derived from Minaurum’s test work based on 151 wax-coated density measurements; vein domains were modelled to reflect the interpreted vein geology, including vein continuity, thickness, and structural controls; all assays were composited to 1 metre, and grade capping was applied on a vein-by-vein basis, with silver grades capped at up to 3,000 g/t; a 5 m along strike × 1 m across strike × 2.5 m high block size was selected based on geological constraints and potential future mining methods; and block grades for gold, silver, copper, lead, and zinc were estimated using inverse distance squared interpolation; mineral resources were classified as Inferred in accordance with CIM Definition Standards, based on geological confidence, drill hole spacing, sample support, and search criteria. Additional details of the estimation methodology and classification criteria will be provided in the supporting technical report to be filed on the Company’s profile on SEDAR+.
A technical report prepared by IMC in accordance with NI 43-101 will be filed on the Company’s profile at www.sedarplus.ca within 45 days of the date of this press release.
Phase II – Resource Expansion Drill Program
Minaurum is currently conducting a 50,000-metre core drilling program aimed at expanding the resource at Europa and Promontorio-Travesia, while also completing step-out and in-fill drilling to further evaluate high-grade intercepts in additional vein zones across the Alamos district, including at San Jose, Quintera, Promontorio Sur, Pulpito-Cotera, and Minas Nuevas.
Minaurum intends to provide an updated resource estimate in the second half of 2026. There is no certainty that the Inferred Mineral Resources will be converted to the Measured and Indicated categories through further drilling.
National Instrument 43-101 Disclosure
Qualified Assurance Program and Quality Control Measures (“QA/QC”)
Minaurum has implemented QA/QC protocols including insertion of duplicate, blank and standard samples in all drill holes and underground sampling. Ninety-two percent of drill samples were submitted directly to the ALS Chemex in Hermosillo, Mexico, for preparation and sent to ALS Chemex in North Vancouver, BC, Canada, for analysis. During 2024, the Company sent drill samples to ActLabs’ facility in Zacatecas, Mexico, for preparation and analysis there, amounting to 8% of the total drill samples. Additional duplicate test work has been conducted on mineralized samples to assess variability of coarse reject and pulp samples. An IMC independent qualified person visited the Alamos project on 2 occasions, the 3-5th of September 2024, and the 18th of November 2025. IMC has reviewed the QA/QC work completed by Minaurum and believes the database is reliable for estimating Mineral Resources.
Qualified Person
The Mineral Resources for the Alamos Project disclosed in this news release have been estimated by Michael G. Hester, FAusIMMVice President of Independent Mining Consultants, Inc. and independent of Minaurum. Mr. Hester is a Qualified Person as defined in NI 43-101. The Mineral Resources have been classified in accordance with CIM Definition Standards for Mineral Resources and Mineral Reserves, adopted by CIM council, as amended. Mr. Hester has read and approved the contents of this press release as it pertains to the disclosed mineral resource estimate.
Follow us and stay updated:
YouTube: @MinaurumSilver
X: @MinaurumSilver
LinkedIn: Minaurum Silver Inc
Subscribe to our email list at www.minaurum.com
Minaurum Silver Inc. (TSXV: MGG) (OTCQX: MMRGF) (FSE: 78M) is an Americas-focused explorer concentrating on the high-grade 100% owned, production-permitted Alamos silver project in southern Sonora, Mexico and the Lone Mountain CRD Project in Nevada, USA. Minaurum is managed by one of the strongest technical and finance teams and will continue its founders’ legacy of creating shareholder value by acquiring and developing a pipeline of Tier-One precious-and base metal projects.
ON BEHALF OF THE BOARD
“Darrell A. Rader“
Darrell A. Rader
President and CEO
For more information, please contact:
Sunny Pannu – Investor Relations and Corporate Development Manager
(778) 330 0994 or via email at pannu@minaurum.com
The TSX Venture Exchange does not accept responsibility for the adequacy or accuracy of this news release.
Data review and verification: Stephen R. Maynard, Vice President of Exploration of Minaurum and a Qualified Person (QP) as defined by National Instrument 43-101, reviewed and verified the assay data, and has approved the disclosure in this news release. Verification was done by visual inspection of core samples and comparison to assay results. Assay results have not been checked by re-analysis. No factors were identified that could materially affect the accuracy or reliability of the data presented in this news release.
Analytical Procedures and Quality Assurance/Quality Control: Preparation and assaying of drilling samples from Minaurum’s Alamos project are done with strict adherence to a Quality Assurance/Quality Control (QA/QC) protocol. Core samples are sawed in half and then bagged in a secure facility near the site and then shipped either by a licensed courior by Company personnel to ALS Minerals’ preparation facility in Hermosillo, Sonora, Mexico. ALS prepares the samples, crushing them to 70% less than 2mm, splitting off 250g, and pulverizing the split to more than 85% passing 75 microns. The resulting sample pulps are prepared in Hermosillo and then shipped to Vancouver for chemical analysis by ALS Minerals. In Vancouver, the pulps are analyzed for gold by fire assay and ICP/AES on a 30-gram charge. In addition, analyses are done for silver, copper, lead, and zinc using 4-acid digestion and ICP analysis. Samples with silver values greater than 100 g/t; and copper, lead, or zinc values greater than 10,000 ppm (1%) are re-analyzed using 4-acid digestion and atomic absorption spectrometry (AAS).
Quality-control (QC) samples are inserted in the sample stream every 20 samples on average, and thus represent 5% of the total samples. QC samples include standards, blanks, and duplicate samples. Standards are pulps that have been prepared by a third-party laboratory; they have gold, silver, and base-metal values that are established by an extensive analytical process in which several commercial labs (including ALS Minerals) participate. Standards test the calibration of the analytical equipment. Blanks are rock material known from prior sampling to contain less than 0.005 ppm gold; they test the sample preparation procedure for cross-sample contamination. In the case of duplicates, the sample interval is cut in half and then quartered. The first quarter is the original sample, the second becomes the duplicate. Duplicate samples provide a test of the reproducibility of assays in the same drilled interval. When final assays are received, QC sample results are inspected for deviation from accepted values. To date, QC sample analytical results have fallen in acceptable ranges on the Alamos project.
When final assays are received, QC sample results are inspected for deviation from accepted values by the QP. To date, QC sample analytical results have fallen in acceptable ranges on the Alamos project.
ALS Minerals is independent of Minaurum Silver and is independent of the Qualified Person.
Cautionary Note Regarding Forward Looking Information: This news release contains “forward-looking information” within the meaning of applicable Canadian securities legislation. “Forward-looking information” includes, but is not limited to, statements with respect to the activities, events or developments that the Company expects or anticipates will or may occur in the future, including the Resource Estimate; the ongoing Phase II 50,000 m resource expansion drill program; and the completion of an updated resource estimate in the second half of 2026. Generally, but not always, forward-looking information and statements can be identified by the use of words such as “plans”, “expects”, “is expected”, “budget”, “scheduled”, “estimates”, “forecasts”, “intends”, “anticipates”, or “believes” or the negative connotation thereof or variations of such words and phrases or state that certain actions, events or results “may”, “could”, “would”, “might” or “will be taken”, “occur” or “be achieved” or the negative connotation thereof.
In making the forward-looking information in this release, Minaurum has applied certain factors and assumptions that are based on Minaurum’s current beliefs as well as assumptions made by and information currently available to Minaurum, including that Minaurum will be able to obtain all necessary permits and approvals for planned exploration and drilling activities; that Minaurum’s planned drilling and exploration activities will be completed on the expected timeline, or at all; that the results of the drilling and exploration activities will be as expected; that Minaurum will be able to complete the updated mineral resource estimate on the timelines expected, or at all; and that Minaurum will have the financial resources to complete its ongoing drill program and anticipated updated mineral resource estimate. Although Minaurum considers these assumptions to be reasonable based on information currently available to it, they may prove to be incorrect, and the forward-looking information in this release are subject to numerous risks, uncertainties and other factors that may cause future results to differ materially from those expressed or implied in such forward-looking information.
In making the forward-looking information in this release, Minaurum has applied certain factors and assumptions that are based on Minaurum’s current beliefs as well as assumptions made by and information currently available to Minaurum. Although Minaurum considers these assumptions to be reasonable based on information currently available to it, they may prove to be incorrect, and the forward-looking information in this release are subject to numerous risks, uncertainties and other factors that may cause future results to differ materially from those expressed or implied in such forward-looking information, including risks relating to the actual results of drilling or exploration activities, fluctuating silver prices, possibility of equipment breakdowns and delays, drilling or exploration cost overruns, availability of capital and financing, general economic, market or business conditions, regulatory changes and timeliness of government or regulatory approvals.
Readers are cautioned not to place undue reliance on forward-looking information. Minaurum does not intend, and expressly disclaims any intention or obligation to, update or revise any forward-looking information whether as a result of new information, future events or otherwise, except as required by law.

To view the source version of this press release, please visit https://www.newsfilecorp.com/release/281507
VANCOUVER, British Columbia, Jan. 28, 2026 (GLOBE NEWSWIRE) — Apollo Silver Corp. (“Apollo Silver” or the “Company”) (TSX.V:APGO, OTCQB:APGOF, Frankfurt:6ZF0) is pleased to announce that it has closed the second and final tranche of its previously announced upsized non-brokered private placement (the “Offering”), previously announced on January 21, 2026. Pursuant to the closing of the second and final tranche of the Offering, the Company issued an aggregate of 2,500,000 units (the “Units”) at a price of $5.00 per Unit for aggregate gross proceeds of $12,500,000. With the completion of this tranche, the Offering is now fully subscribed for total gross proceeds of $27,500,000.
A fund managed by Jupiter Asset Management (the “Jupiter Fund”) subscribed for all of the Units under the second and final tranche of the Offering.
As a result of closing the second and final tranche of the Offering, the Jupiter Fund now beneficially owns and controls 7,452,456 common shares and 3,807,200 common share purchase warrants of the Company, representing approximately 11.9% of the Company’s outstanding common shares on a non-diluted basis and approximately 16.9% on a partially diluted basis, assuming exercise of such warrants.
“We welcome and appreciate the continued participation of Jupiter Fund, as a key shareholder of Apollo Silver,” said Ross McElroy, President and CEO of Apollo Silver. “Jupiter Fund’s commitment is a strong statement of support as we continue to advance our large scale, high quality silver assets in stable jurisdictions.”
Each Unit issued pursuant to the Offering consists of one common share (a “Share”) in the capital of the Company and one common Share purchase warrant (a “Warrant”). Each Warrant entitles the holder thereof to purchase one Share at an exercise price of $7.00 for a period of 24 months from the closing date of the Offering.
Closing of the Offering remains subject to final acceptance of the TSX Venture Exchange.
In connection with subscriptions received in the second and final tranche of the Offering, the Company paid aggregate finder’s fees totaling $312,500 to BMO Capital Markets.
The securities issued under the second and final tranche of the Offering are subject to a four-month hold period from the date of closing. The Company intends to use the net proceeds from the Offering to continue advancing the Calico Silver Project in San Bernardino, California; support community relations initiatives at the Cinco de Mayo Silver Project in Chihuahua, Mexico; cover ongoing property maintenance costs at both projects; and for general corporate purposes.
The Shares have not been, and will not be, registered under the United States Securities Act of 1933, as amended (the “U.S. Securities Act”), or any U.S. state securities laws, and may not be offered or sold in the United States without registration under the U.S. Securities Act and all applicable state securities laws or compliance with the requirements of an applicable exemption therefrom. This news release shall not constitute an offer to sell or the solicitation of an offer to buy securities in the United States, nor shall there be any sale of these securities in any jurisdiction in which such offer, solicitation or sale would be unlawful.
About Apollo Silver Corp.
Apollo Silver is advancing one of the largest undeveloped primary silver projects in the US. The Calico project hosts a large, bulk minable silver deposit with significant barite and zinc credits – recognized as critical minerals essential to the US energy and medical sectors. The Company also holds an option on the Cinco de Mayo Project in Chihuahua, Mexico, which is host to a major carbonate replacement (CRD) deposit that is both high-grade and large tonnage. Led by an experienced and award-winning management team, Apollo Silver is well positioned to advance the assets and deliver value through exploration and development.
Please visit www.apollosilver.com for further information.
ON BEHALF OF THE BOARD OF DIRECTORS
Ross McElroy
President and CEO
For further information, please contact:
Email: info@apollosilver.com
Telephone: +1 (604) 428-6128
Neither the TSX Venture Exchange nor its Regulation Services Provider (as that term is defined in the policies of the TSX Venture Exchange) accepts responsibility for the adequacy or accuracy of this release.
Cautionary Statement Regarding “Forward-Looking” Information
This news release includes “forward-looking statements” and “forward-looking information” within the meaning of Canadian securities legislation. All statements included in this news release, other than statements of historical fact, are forward-looking statements including, without limitation, statements with respect to the final acceptance of the Offering by the TSXV, and the intended use of proceeds from the Offering. Forward-looking statements include predictions, projections and forecasts and are often, but not always, identified by the use of words such as “anticipate”, “believe”, “plan”, “estimate”, “expect”, “potential”, “target”, “budget” and “intend” and statements that an event or result “may”, “will”, “should”, “could” or “might” occur or be achieved and other similar expressions and includes the negatives thereof.
Forward-looking statements are based on the reasonable assumptions, estimates, analysis, and opinions of the management of the Company made in light of its experience and its perception of trends, current conditions and expected developments, as well as other factors that management of the Company believes to be relevant and reasonable in the circumstances at the date that such statements are made. Forward-looking information is based on reasonable assumptions that have been made by the Company as at the date of such information and is subject to known and unknown risks, uncertainties and other factors that may have caused actual results, level of activity, performance or achievements of the Company to be materially different from those expressed or implied by such forward-looking information, including but not limited to: risks associated with mineral exploration and development; metal and mineral prices; availability of capital; accuracy of the Company’s projections and estimates; realization of mineral resource estimates, interest and exchange rates; competition; stock price fluctuations; availability of drilling equipment and access; actual results of current exploration activities; government regulation; political or economic developments; environmental risks; insurance risks; capital expenditures; operating or technical difficulties in connection with development activities; personnel relations; and changes in Project parameters as plans continue to be refined. Forward-looking statements are based on assumptions management believes to be reasonable, including but not limited to the price of silver, gold and barite; the demand for silver, gold and barite; the ability to carry on exploration and development activities; the timely receipt of any required approvals; the ability to obtain qualified personnel, equipment and services in a timely and cost-efficient manner; the ability to operate in a safe, efficient and effective matter; and the regulatory framework regarding environmental matters, and such other assumptions and factors as set out herein. Although the Company has attempted to identify important factors that could cause actual results to differ materially from those contained in forward-looking information, there may be other factors that cause results not to be as anticipated, estimated or intended. There can be no assurance that forward-looking statements will prove to be accurate and actual results, and future events could differ materially from those anticipated in such statements. Accordingly, readers should not place undue reliance on forward looking information contained herein, except in accordance with applicable securities laws. The forward-looking information contained herein is presented for the purpose of assisting investors in understanding the Company’s expected financial and operational performance and the Company’s plans and objectives and may not be appropriate for other purposes. The Company does not undertake to update any forward-looking information, except in accordance with applicable securities laws.
Performance as of December 31, 2025
| Metric | 1 MO* | 3 MO* | 1 YR | 3 YR | 5 YR |
| Copper Spot Price1 | 10.86% | 21.79% | 43.93% | 14.19% | 9.95% |
| Copper Mining Equities (Nasdaq Sprott Copper Miners Index TR)2 | 16.49% | 26.28% | 74.59% | 28.53% | 18.76% |
| Copper Junior Mining Equities (Nasdaq Sprott Junior Copper Miners Index TR)3 | 16.17% | 34.77% | 132.42% | 43.42% | 26.45% |
| Broad Commodities (BCOM Index)4 | -0.65% | 4.84% | 11.07% | -0.93% | 7.04% |
| U.S. Equities (S&P 500 TR Index)5 | 0.06% | 2.65% | 17.88% | 22.98% | 14.42% |
*Performance for periods under one year is not annualized.
Source: Bloomberg as of 12/31/2025. You cannot invest directly in an index. Past performance is no guarantee of future results.
Copper is in a powerful breakout, coming off a blockbuster 2025 and pushing deeper into record territory as tight supply and trade-driven dislocation keep the market on a scarcity footing.
Copper rose 43.93% in 2025, capping a strong year that reshaped market expectations for both price and the supply-demand balance. Copper’s strength has carried into early 2026, with the copper price continuing to attain all-time highs, reaching $13,273.81 per metric ton as of this writing. Notably, this is not a typical cyclical upswing. Copper is being repriced amid tightening fundamentals. Major supply disruptions have pushed the market into a deficit sooner than expected, while long-term demand growth continues to outstrip supply, increasing the likelihood of deeper shortages ahead. Copper’s momentum has been further reinforced by the broader strength of hard assets, as deglobalization and de-dollarization are increasing the strategic premium investors assign to essential critical materials like copper.
Copper is breaking records, driven by tight supply, structural market shifts and surging demand.
Copper’s strength is also being reinforced by a structural shift in the mobility of copper inventories. In a more open system, before 2025, exchange stocks and arbitrage help move metal to where it is most needed, smoothing regional imbalances. Today, that mechanism is increasingly constrained by trade frictions and policy uncertainty, which are encouraging stockpiling behavior and redirecting deliverable inventory to specific jurisdictions. This has left U.S. inventories elevated, while availability outside the U.S. is tighter than global headline inventories imply, providing support for the copper market. The result is a copper market where location, deliverability and policy risk can heighten the impact of the traditional supply-demand balance, particularly when the supply chain is already strained, and deficits are developing earlier than many expected. In effect, copper’s inventory buffer is behaving more like a set of regional pools than a single global reservoir, which helps explain why tightness can persist even when headline inventories do not look extreme.
Copper miners were the primary beneficiaries of rising copper prices in 2025. Copper miners gained 74.59% and junior copper miners rose 132.42%, underscoring how copper mining equities can deliver operating leverage to a higher copper price. For junior copper miners, the outperformance also reflects a rising probability that projects move from optionality to execution as higher prices improve economics and financing viability. That dynamic has been especially important for U.S.-linked projects, where government actions have increased confidence that domestic copper supply can be accelerated through faster permitting and broader support mechanisms, such as a direct equity stake in one junior developer.
Looking at longer-term performance, copper and copper miners have meaningfully outpaced equities and broader commodity benchmarks, respectively, over the past five years (Figure 1).
Figure 1. Physical Copper and Copper Stocks Have Outperformed Other Asset Classes Over the Past Five Years (12/31/2020-12/31/2025)
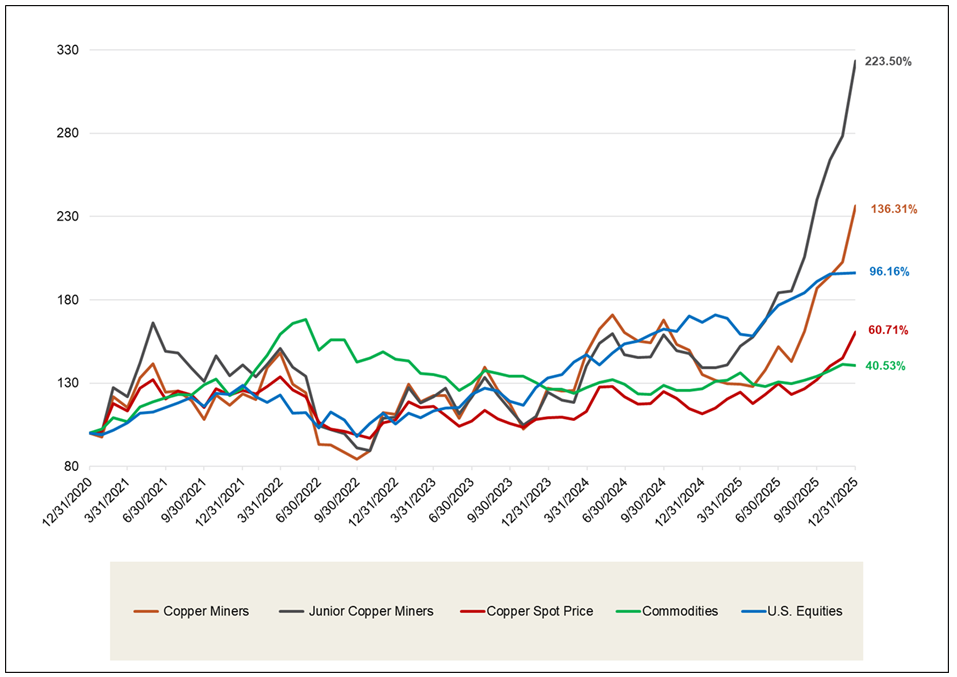
Source: Bloomberg and Sprott Asset Management. Data as of 12/31/2025. Copper Miners are measured by the Nasdaq Sprott Copper Miners™ Index (NSCOPPT index); Junior Copper Miners are measured by the Nasdaq Sprott Junior Copper Miners™ Index (NSCOPJT index); U.S. Equities are measured by the S&P 500 TR Index; the Copper Spot Price is measured by LMCADY Comdty; and Commodities are measured by the Bloomberg Commodity Index (BCOM). Definitions of the indices are provided in the footnotes. You cannot invest directly in an index. Past performance is no guarantee of future results.
Copper’s rally has been driven by an abrupt shift into a supply deficit after a cluster of major disruptions forced the market to reprice faster than expected. The most significant was the September shutdown at Grasberg, where an estimated 800,000 metric tons of mud flooded the mine. Lost output through December 2026 is expected to exceed Collahuasi’s entire annual production, effectively removing the world’s third-largest mine from the market and tightening conditions overnight. The disruption was compounded by a string of setbacks across the industry. The Kamoa-Kakula complex faced flooding-related output cuts estimated at roughly 300 thousand metric tons, Teck revised guidance lower by about 60,000 metric tons across multiple operations, Codelco’s El Teniente reduced expected output by 33 thousand metric tons after an accident, and the ongoing shutdown of Cobre Panama continues to represent a loss of over 300 thousand metric tons of supply.
Major disruptions forced the copper market to reprice faster than expected.
The market impact of these disruptions is amplified by a broader truth about copper: supply reliability has always been fragile. Historically, unplanned outages average about 5% of global supply. In prior years, this could have been absorbed more easily. Today, however, it comes at a time when inventories are fragmented, and the market has less flexibility to balance regional tightness, raising the odds that even incremental disruptions push prices higher. This is why industry-wide constraints matter so much in 2026. Years of underinvestment, long development timelines and declining ore grades have slowed the industry’s ability to respond, leaving the market increasingly exposed when disruptions occur. As a result, the market is more likely to reprice the forward deficit path rather than dismiss disruptions as short-term noise. With demand growing faster than expected and supply relatively flat, the outlook now points to larger deficits ahead (Figure 2).
Figure 2. Copper Supply and Demand Imbalance May Likely Grow
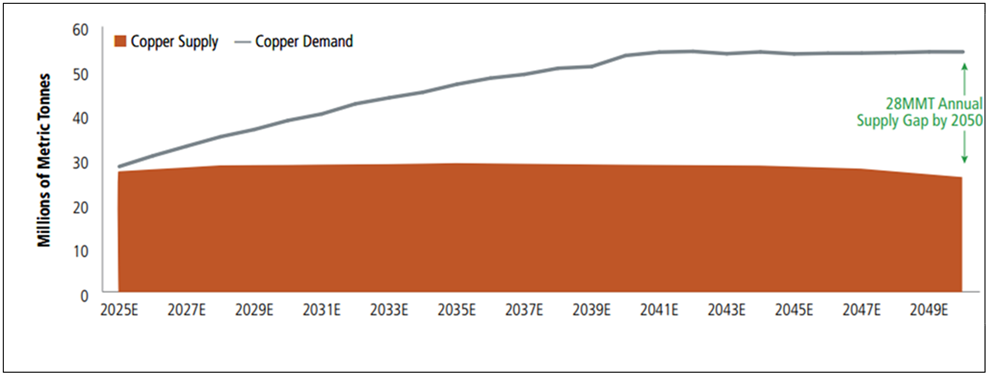
Source: BloombergNEF Transition Metals Outlook 2025. The line represents demand and the shaded area
One of the clearest signs of stress in copper right now is the concentrate market, where smelters are increasingly competing for the mined feedstock that becomes refined copper. That competition shows up directly in treatment costs (TCs), the fee smelters earn for processing copper concentrate. There are two prices to watch. The annual TC benchmark is the reference level that anchors many long-term contracts for the year. It reset to $0 for 2026, down from $21.25 in 2025, which was already considered exceptionally low versus historical norms that were often in the $80s.6 The spot TCs are the day-to-day marginal price for concentrate and it has been even more extreme, falling deeper into negative territory and pushing to fresh all-time lows (Figure 3).
These TCs matter because they signal extreme stress and scarcity in mined copper. When TCs collapse, it means concentrate is in short supply relative to processing demand, and the whole chain becomes more vulnerable. In a market already tightening, that kind of upstream stress can ultimately pressure the price of refined copper higher, because the system has less flexibility to absorb disruptions or delays. It can also boost copper miners’ earnings power, as sustained tightness in concentrate typically reflects strong demand for mined copper.
Figure 3. Treatment Costs Are the Canary in Copper’s Supply Chain (2021-2025)
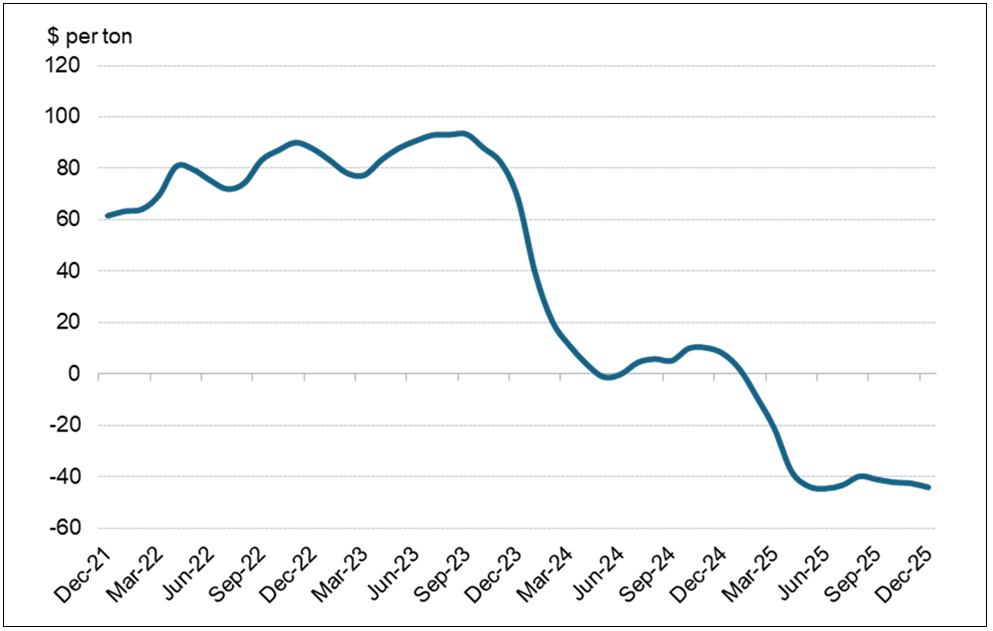
Source: Bloomberg. Data as of 12/31/2025. Includes inventories on the LME, SHFE, and COMEX. Included for illustrative purposes only.
The July 30, 2025, Section 2327 copper proclamation imposed universal 50% tariffs on semi‑finished copper products and copper‑intensive derivative products, effective August 1, 2025. Contrary to Trump’s initial messaging and the market expectations that followed, it did not result in a tariff on refined copper. That swing, from an almost 50% tariff being priced into refined copper to 0%, created a premium for U.S. copper over the rest of the world that the market had never seen before, and participants raced to ship copper into the U.S. When refined copper was ultimately exempted, that premium fell back toward normal levels. Even so, inventories have remained concentrated in the U.S. (Figure 4), and the administration outlined a clear pathway for introducing refined copper tariffs later. The outcome could have just as profound implications for the copper spot price in 2026.
Section 232 keeps U.S. copper markets on edge, with tariff risk still unresolved.
By June 30, 2026, the U.S. Secretary of Commerce will provide President Trump with an update on domestic copper markets, so that he can determine whether imposing a phased universal import duty on refined copper is warranted. The duty path contemplated is 15% starting January 1, 2027, increasing to 30% starting January 1, 2028.
While the U.S. chose in January 2026 to forgo proposing tariffs on most critical minerals in favor of negotiating critical mineral agreements, copper remains a notable outlier given its separate treatment. Moreover, the legal environment prevents this risk from fading; if the Supreme Court constrains broader tariff strategies, the Trump administration is likely to lean more heavily on Section 232 tariffs. The practical takeaway is that Section 232 risk remains unresolved. It is evolving, and it continues to fragment inventory systems in a copper market already tightened by supply disruptions and concentrate constraints.
Figure 4. Trapped Copper in the U.S. (COMEX) (2015-2025)
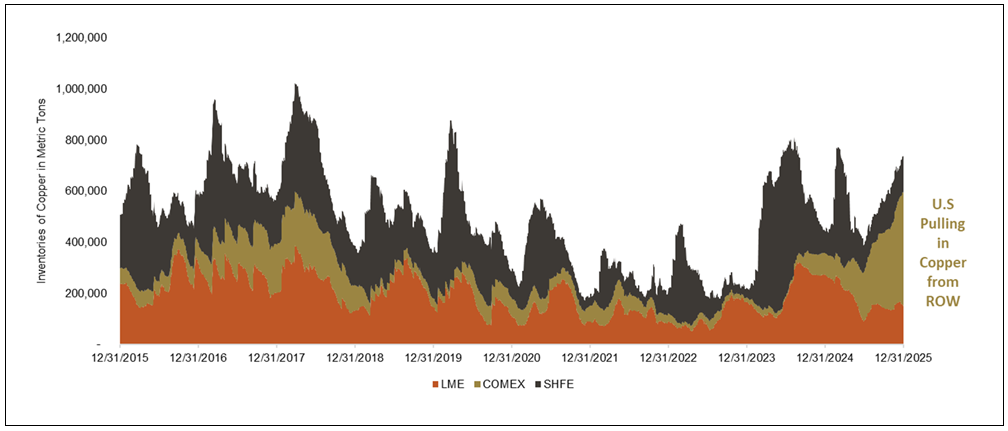
Source: Bloomberg. Data as of 12/31/2025. Includes inventories on the LME, SHFE, and COMEX. Included for illustrative purposes only.
Copper is increasingly traded as a critical material rather than an economic gauge, as markets place greater weight on policy credibility and de-dollarization. Headlines about a criminal investigation involving Federal Reserve Chair Jerome Powell and the rising political pressure on the Federal Reserve have sharpened concerns about Fed independence, reinforcing de-dollarization dynamics and supporting the broader metals complex. That same backdrop helped underpin broad strength across metals in 2025 (Figure 5), and it remains a credible tailwind into 2026, particularly for critical materials like copper that sit at the intersection of electrification, industrial security and strategic supply-chain priorities.
De-dollarization is supporting copper and critical materials performance.
Rate expectations add another layer. Markets have been focused on the likelihood of lower rates over time, including the potential for a more dovish policy stance as President Trump appoints a successor at the Fed. A lower-rate trajectory is typically supportive for commodities through both financing conditions and currency dynamics, and it can reinforce investor demand for critical materials assets. When that tailwind converges with a market already contending with multiple others, it can keep copper well supported and raise the probability that the upside pressure extends through 2026.
Figure 5. Metals Post Strong Returns in 2025
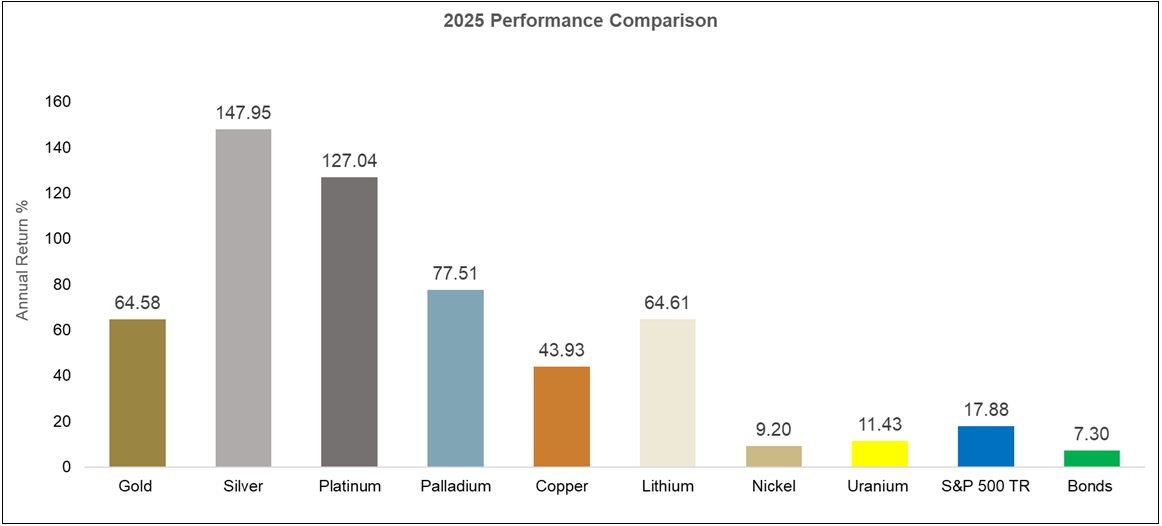
Source: Bloomberg. Data as of 12/31/2025. Gold is measured by the Gold Spot Price; Silver is measured by the Silver Spot Price; Platinum is measured by the Platinum Spot Price; Palladium is measured by the Palladium Spot Price; Copper is measured by the LME Copper Spot Price; Lithium is measured by the China Lithium Carbonate 99.5%; Nickel is measured by the LME Nickel Spot Price; the U3O8 uranium spot price is measured by a proprietary composite of U3O8 spot prices from TradeTech, UxC, S&P Platts and Numerco; the S&P 500 TR is measured by the S&P 500 Total Return Index; Bonds are measured by the Bloomberg Barclays US Agg Total Return Value Unhedged USD (LBUSTRUU Index).
Copper is increasingly being pulled by structural, strategic demand that is less price-sensitive, tied to the buildout of critical infrastructure rather than the traditional industrial cycle. Copper still faces exposure to cyclical segments, including construction-related demand, which can be influenced by China’s property downturn and uneven global growth. The difference today is that the marginal demand driver is steadily shifting toward the world’s most critical sectors, helping copper stay well supported even as parts of the conventional growth picture appear mixed.
This shift was visible in 2025. Despite China’s property slowdown and persistent concerns around global growth, copper still delivered its strongest performance in 16 years, reinforcing that the market is increasingly pricing copper on critical end uses and constrained supply responsiveness rather than on the traditional economic cycle alone. Finally, copper has further evidenced this by decisively outperforming and breaking free of its correlation with Chinese equities since 2021 (Figure 6).
Figure 6. Copper Breaks Away from Chinese Equities (2015-2025)
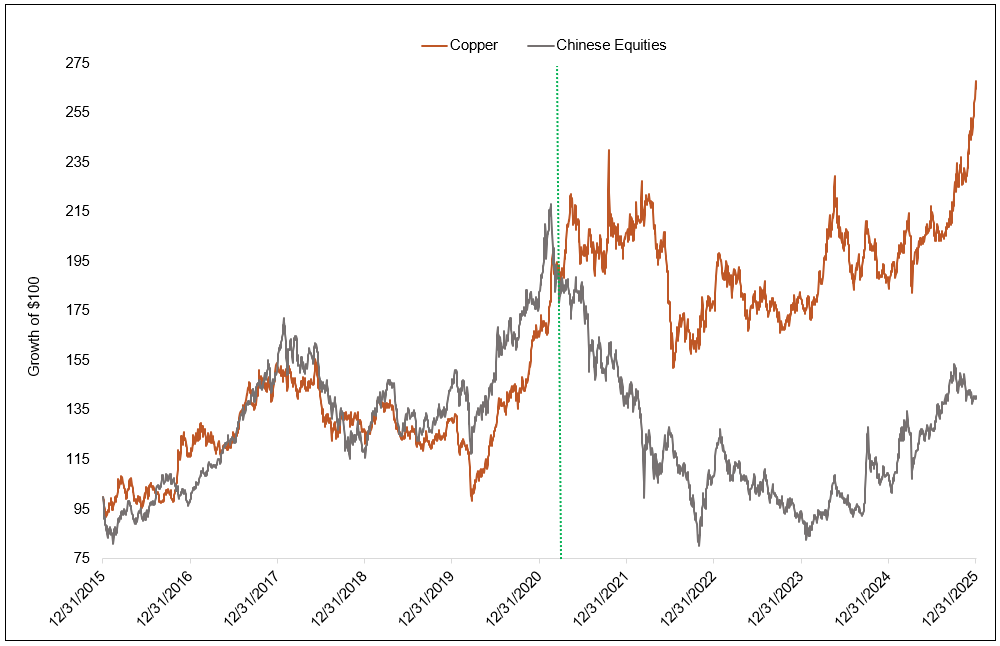
Source: Bloomberg as of 12/31/2025. Chinese equities measured by the MXCN Index. Copper measured by LMCADY Comdty.
Copper’s break from its historical correlation with Chinese equities is clearest in three demand segments that are expanding simultaneously. First, AI and data-center deployments are driving a step-change in electricity consumption, along with the copper-heavy power systems, cooling capacity, and connectivity networks required to support that load. Second, defense spending is building a more persistent layer of demand that is less sensitive to economic cycles and more aligned with national-security priorities. Third, the electricity grid is entering a long-duration modernization cycle, driven by accelerating load growth, aging infrastructure, and heightened reliability concerns.
These shifts have meaningfully reshaped copper’s demand profile. Electrical infrastructure surpassed construction as copper’s leading demand source, rising from 24% of total usage in 2020 to 30% in 2025, with further gains expected (Figure 7). A similar pattern is visible within China itself: construction-linked demand has weakened with the property downturn, yet investment in electrical infrastructure continues to more than offset this, sustaining overall demand growth. Together, these trends are linking copper more directly to strategic procurement across critical industries, supporting a constructive outlook for 2026 and amplifying upward pressure amid tight supply conditions.
Figure 7. Electrical Infrastructure Takes Over Global Copper Demand (2020-2030E)
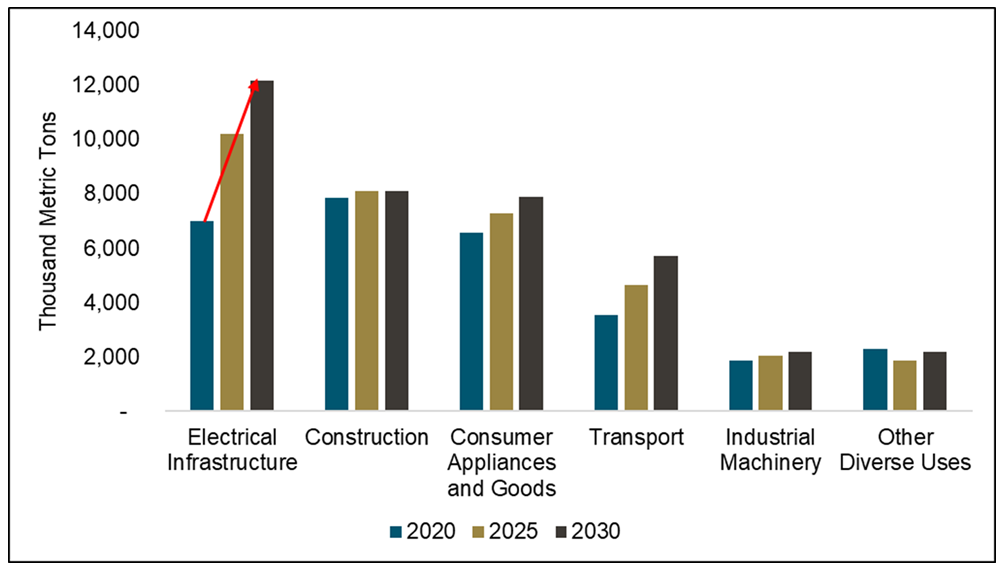
Source: Benchmark Mineral Intelligence, December 2025.
The copper market enters 2026 with several high-impact catalysts that should keep the outlook constructive. The most significant scheduled milestone is policy-related: under the Section 232 framework, the next key decision date is June 30, 2026, when the U.S. Commerce Secretary is expected to deliver an updated assessment of domestic copper markets.
Constrained supply and essential demand underpin copper’s strength.
Beyond policy, the market remains anchored by a supply chain that has shown how quickly it can tighten when disruptions hit and how slowly it can normalize when baseline supply growth is constrained. The key takeaway for 2026 is that the system continues to operate with limited flexibility, which supports a higher critical premium when participants compete for reliable units.
Copper demand continues to look increasingly durable because the marginal driver is shifting toward critical end uses that are harder to defer. The global push to expand and modernize electricity grids, the buildout of AI-related power infrastructure, and strategic industrial priorities are reinforcing copper’s role in essential systems. That demand mix is supportive in its own right, and it becomes even more powerful when paired with constrained supply responsiveness.
A final catalyst to watch is capital allocation across the mining industry. Mergers and acquisitions have increasingly reflected a strategic pivot toward copper, and the market is now openly entertaining transactions that could rival or exceed prior landmark deals (i.e., confirmed Rio Tinto and Glencore merger talks that would surpass the multibillion-dollar Anglo-Teck merger of 2025). Increased M&A reinforces the premium being placed on long-duration copper exposure and signals that the largest miners are likely to keep orienting portfolios toward copper, which tends to support sentiment across the copper complex.
Taken together, these catalysts leave copper’s move to all-time highs looking well grounded (Figure 8). With policy risk still active, supply responsiveness constrained, strategic demand tailwinds strengthening, and major miners continuing to reorient toward copper, the copper price can remain well supported near record territory through 2026.
Figure 8. Copper Hits All-Time Highs (2000-2025)
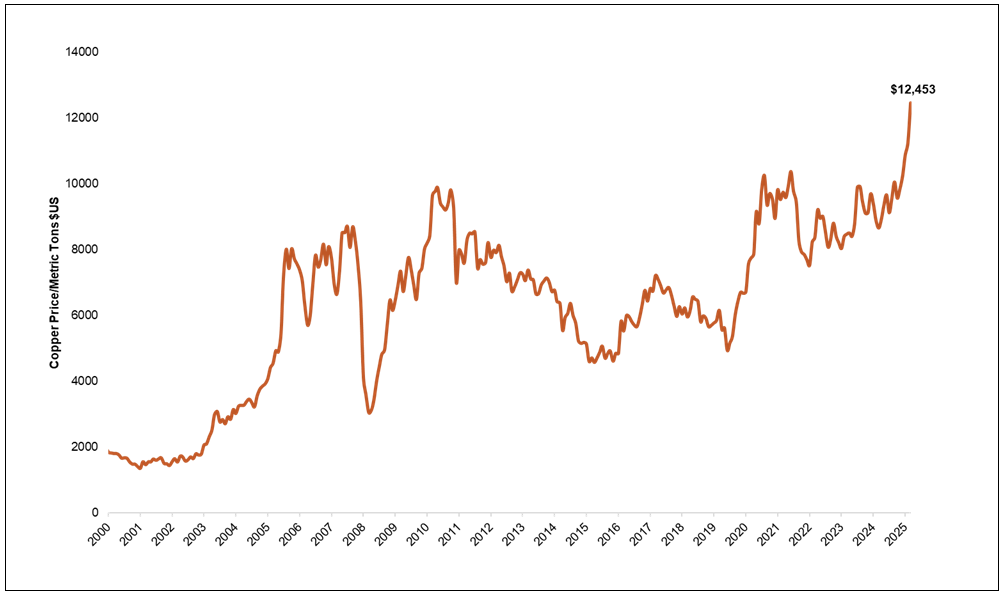
Source: Bloomberg as of 12/31/2025. Copper is measured by LMCADY Comdty. Past performance is not indicative of future results.
Footnotes
| 1 | The copper spot price is measured by the LME Copper Cash ($), Bloomberg ticker LMCADY. |
| 2 | The Nasdaq Sprott Copper Miners™ Index (NSCOPP™) is designed to track the performance of a selection of global securities in the copper industry; the Index was co-developed by Nasdaq® and Sprott Asset Management LP. |
| 3 | Nasdaq Sprott Junior Copper Miners™ Index (NSCOPJ™) is designed to track the performance of mid-, small- and micro-cap companies in copper-mining related businesses; the Index was co-developed by Nasdaq® and Sprott Asset Management LP. |
| 4 | The Bloomberg Commodity Index (BCOM) is a broadly diversified commodity price index that tracks prices of futures contracts on physical commodities and is designed to minimize concentration in any one commodity or sector. It currently has 23 commodity futures in six sectors. |
| 5 | The S&P 500 or Standard & Poor’s 500 Index is a market-capitalization-weighted index of the 500 largest U.S. publicly traded companies. |
| 6 | Source: Benchmark, Chinese smelter reportedly agrees to record low copper concentrate TC/RCs. |
| 7 | Section 232 refers to a provision in the Trade Expansion Act of 1962 that allows the U.S. President to impose tariffs or other trade restrictions on imported goods if the Secretary of Commerce finds they threaten national security, initiating investigations into product imports. |


First Name*
Last Name*
Email Address*
Investor Type* Asset Manager Financial Advisor Individual Investor Institutional Investor Other
Country* United States Canada Argentina Australia Austria Belgium Brazil China Denmark Finland France Germany India Ireland Italy Japan Netherlands New Zealand Norway South Africa Spain Sweden Switzerland United Kingdom Other
I am not a robot.
Please slide to unlock.
I consent to Sprott Inc. and its subsidiaries sending me newsletters, fund information and other electronic messages (E-Communications)*
Please refer to our Privacy Policy or Contact Us for more information.
*Required
Relative to other sectors, precious metals and natural resources investments have higher headline risk and are more sensitive to changes in economic data, political or regulatory events, and underlying commodity price fluctuations. Risks related to extraction, storage and liquidity should also be considered.
Gold and precious metals are referred to with terms of art like “store of value,” “safe haven” and “safe asset.” These terms should not be construed to guarantee any form of investment safety. While “safe” assets like gold, Treasuries, money market funds and cash generally do not carry a high risk of loss relative to other asset classes, any asset may lose value, which may involve the complete loss of invested principal.
Past performance is no guarantee of future results. You cannot invest directly in an index. Investments, commentary and opinions are unique and may not be reflective of any other Sprott entity or affiliate. Forward-looking language should not be construed as predictive. While third-party sources are believed to be reliable, Sprott makes no guarantee as to their accuracy or timeliness. This information does not constitute an offer or solicitation and may not be relied upon or considered to be the rendering of tax, legal, accounting or professional advice.
Vancouver, British Columbia–(Newsfile Corp. – January 22, 2026) – Metalsource Mining Inc. (CSE: MSM) (OTCQB: SFRIF) (FSE: E9Z) is pleased to provide an update on its ongoing diamond drilling program at the Silver Hill Project, which is located approximately 15km south of Lexington, NC.
Two recently completed drill holes, SH26-07 and SH26-08 (currently in progress), have intersected multiple intervals of sulphide mineralization at depth, located proximal to historic underground workings but within areas that have not been previously drill tested. Mineralization is hosted in tuffaceous argilites and rhyolitic volcaniclastics and massive flows.
Hole SH26-07 intersected a broad zone of mineralization between approximately 129.85m and 155.45m downhole, comprising multiple discrete intervals of semi-massive to massive sulphides with associated quartz veining, silicification, and sulphide mineralization comprised of sphalerite, galena, and pyrite.
Drilling of hole SH26-08 has now intersected sulphide mineralization beginning at approximately 185m to 191m, for an apparent thickness of 6m and an estimated true thickness of 4m. This interval occurs at depth, south of the termination of historic underground workings, within a zone that has not previously been drilled.
| Drill Hole ID | Easting mE | Northing mN | Elevation m | Azimuth | Dip | Total Depth m |
| SH25-01 | 572408 | 3951597 | 224 | 110 | -65 | 108.81 |
| SH25-02 | 572408 | 3951597 | 224 | 110 | -87 | 101.19 |
| SH25-03 | 572410 | 3951751 | 236 | 100 | -45 | 304.71 |
| SH25-04 | 572410 | 3951751 | 236 | 100 | -90 | 99.67 |
| SH25-05 | 572280 | 3951624 | 262 | 135 | -75 | 199.03 |
| SH26-06 | 572280 | 3951624 | 262 | 135 | -50 | 108.81 |
| SH26-07 | 572280 | 3951624 | 262 | 135 | -90 | 199.64 |
| SH25-08 | 572280 | 3951624 | 262 | 195 | -78 | In progress |
The Company notes that visual identification of sulphide mineralization intervals do not indicate metal grades or economic significance. Core processing is ongoing with logging, sampling, and submittal for labratory analysis underway.
The current drilling continues to test down-dip and along-strike extensions of the Silver Hill mineralized system, with step-out drilling planned to evaluate continuity and scale.
The exploration results described herein are preliminary in nature and are insufficient to define a mineral resource. Further drilling is required to determine the continuity, geometry, and grade distribution of the mineralization. At the time of this release, analytical results are still pending, the reported intervals are based on geological logging only.
Qualified Person
All scientific and technical information, has been reviewed and approved by Rory Kutluoglu, B.Sc., P.Geo., a “Qualified Person” as defined under NI 43-101 – Standards of Disclosure for Mineral Projects. Mr. Kutluoglu is an independent consultant of the company within the meaning of NI 43-101.
Silver Hill Project
Located in the Carolina Terrane, the property is underlain by volcaniclastic and volcano-sedimentary rocks predominantly of Neoproterozoic and Cambrian age. This terrane has been suggested to be an extension of the Avalon Terrane. The property is 1,128 acres located in Davidson County, North Carolina. As the first significant discovery and first silver-producing mine in America, there is an extensive drillhole database, underground mapping, historic dumps and underground chip samples which comprise the historic dataset. This mineralization is currently known to extend to 550m from surface, in a steeply trending series of lenses, which remain open in multiple directions. Bolstering these historic records, recent surface sampling contained results including SH25-003 containing 444g/t Ag, 17.7 g/t Au, 8.61% Pb and 0.507% Zn.
Byrd-Pilot Mountain Project
Located in central North Carolina, within the Carolina Terrane. Early USGS work in the 1980s flagged the area as possibly hosting a porphyry gold-copper system, subsequent work demonstrated broad gold mineralization in soils, trenches, and shallow RC drilling, coincident with strong self-potential anomalies. Geology shows intense quartz-sericite-pyrite alteration, high-sulfidation signatures, and high-alumina minerals (like Haile and Brewer deposits to the south), suggesting potential for a large epithermal or porphyry-related gold system. Geologic modelling indicates east-west trend to the identified mineralization, open in multiple directions, with oxidation noted down to a depth of 30m. No drilling has tested the Meridian discovery zone since those 1980s campaigns, leaving potential for significant resource expansion through work commitments of the agreement.
All scientific and technical information in this news release has been reviewed and prepared under the supervision of Rory Kutluoglu, P.Geo., a Qualified Person as defined in National Instrument 43-101 – Standards of Disclosure for Mineral Projects (“NI 43-101”).
About Metalsource Mining Inc.
Metalsource Mining Inc. is a Canadian mineral exploration company focused on advancing high-potential mineral assets through modern, systematic exploration and value-driven discovery.
For further information, please contact:
Joe Cullen CEO – Metalsource Mining Inc.
Tel: (778) 919-8615
Email: jcullen@metalsourcemining.com
This news release contains forward-looking statements and forward-looking information within the meaning of Canadian securities legislation (collectively, “forward-looking statements”) that relate to the Company’s current expectations and views of future events. Any statements that express, or involve discussions as to, expectations, beliefs, plans, objectives, assumptions or future events or performance (often, but not always, through the use of words or phrases such as “will likely result”, “are expected to”, “expects”, “will continue”, “is anticipated”, “anticipates”, “believes”, “estimated”, “intends”, “plans”, “forecast”, “projection”, “strategy”, “objective” and “outlook”) are not historical facts and may be forward-looking statements and may involve estimates, assumptions and uncertainties which could cause actual results or outcomes to differ materially from those expressed in such forward-looking statements. No assurance can be given that these expectations will prove to be correct and such forward-looking statements included in this material change report should not be unduly relied upon. These statements speak only as of the date they are made.
Forward-looking statements are based on a number of assumptions and are subject to a number of risks and uncertainties, many of which are beyond the Company’s control, which could cause actual results and events to differ materially from those that are disclosed in or implied by such forward-looking statements. The Company undertakes no obligation to update or revise any forward-looking statements, whether as a result of new information, future events or otherwise, except as may be required by law. New factors emerge from time to time, and it is not possible for the Company to predict all of them or assess the impact of each such factor or the extent to which any factor, or combination of factors, may cause results to differ materially from those contained in any forward-looking statement. Any forward-looking statements contained in this presentation are expressly qualified in their entirety by this cautionary statement.
To view the source version of this press release, please visit https://www.newsfilecorp.com/release/281223
Vancouver, British Columbia–(Newsfile Corp. – January 26, 2026) – West Point Gold Corp. (TSXV: WPG) (OTCQB: WPGCF) (FSE: LRA0) (“West Point Gold” or the “Company“) is pleased to announce that it has entered into an engagement letter with SCP Resource Finance LP (“SCP” or “Lead Agent“), under which SCP, acting as Lead Agent for the Company, on behalf of a syndicate of agents (collectively with SCP, the “Agents“) has agreed to offer for sale up to 18,181,900 common shares of the Company (the “Shares“) on a “commercially reasonable efforts” private placement basis at an issue price of C$1.10 per Share (the “Issue Price“), for aggregate gross proceeds of up to C$20,000,090 (the “Offering“).
The Company intends to use the net proceeds of the Offering for exploration at the Gold Chain Project in Arizona, USA and for general corporate and working capital purposes.
As consideration for its services, the Agents will receive a cash commission of 5% of the gross proceeds of the Offering, provided that Shares sold to purchasers on the Company President’s List will be subject to a reduced cash commission of 2%. The Agents may elect to receive up to 50% of their cash commission in Shares at the issue price. In addition, the Agents will receive broker warrants in an amount equal to 5% of Shares sold, provided that no broker warrants will be issued for any Shares sold to purchasers on the President’s List. Each broker warrant issued will be exercisable to purchase one Share at the Issue Price for a period of two years from the closing date of the Offering.
The closing date of the Offering is scheduled to be on or about February 17, 2026, or such other date or dates as the Company and the Lead Agent may agree. The Offering remains subject to the approval of the TSX Venture Exchange and applicable securities regulatory authorities. Certain officers and directors of the Company may participate in the Offering. Any securities issued under the Offering will be subject to a statutory hold period of four months and one day from the date of issuance.
This news release does not constitute an offer to sell or a solicitation of an offer to buy nor shall there be any sale of any of the securities in any jurisdiction in which such offer, solicitation or sale would be unlawful, including any of the securities in the United States of America. The securities have not been and will not be registered under the United States Securities Act of 1933, as amended (the “1933 Act”) or any state securities laws and may not be offered or sold within the United States or to, or for account or benefit of, U.S. Persons (as defined in Regulation S under the 1933 Act) unless registered under the 1933 Act and applicable state securities laws, or an exemption from such registration requirements is available.
About West Point Gold Corp.
West Point Gold is an exploration and development company focused on unlocking value across four strategically located projects along the prolific Walker Lane Trend in Nevada and Arizona, USA, providing shareholders with exposure to multiple discovery opportunities across one of North America’s most productive gold regions. The Company’s near-term priority is advancing its flagship Gold Chain Project in Arizona.
For further information regarding this press release, please contact:
Aaron Paterson, Corporate Communications Manager
Phone: +1 (778) 358-6173
Email: info@westpointgold.com
Stay Connected with Us:
LinkedIn: linkedin.com/company/west-point-gold
X (Twitter): atwestpointgoldUS
Facebook: facebook.com/Westpointgold/
Website: westpointgold.com/
FORWARD-LOOKING STATEMENTS:
Certain statements contained in this press release constitute forward-looking information. These statements relate to future events or future performance and the proposed Offering. Forward-looking statements include estimates and statements that describe the Company’s private placement, future plans, objectives or goals, including words to the effect that the Company or management expects a stated condition or result to occur. The use of any of the words “could”, “intend”, “expect”, “believe”, “will”, “projected”, “estimated” and similar expressions and statements relating to matters that are not historical facts are intended to identify forward-looking information and are based on the Company’s current belief or assumptions as to the outcome and timing of such future events including, among others, assumptions about future prices of gold, silver, and other metal prices, currency exchange rates and interest rates, favourable operating conditions, political stability, obtaining government approvals and financing on time, obtaining renewals for existing licenses and permits and obtaining required licenses and permits, labour stability, stability in market conditions, availability of equipment, availability of drill rigs, and anticipated costs and expenditures. The Company cautions that all forward-looking statements are inherently uncertain, and that actual performance may be affected by a number of material factors, many of which are beyond the Company’s control. Such factors include, among other things: risks and uncertainties relating to the Company’s ability to complete any payments or expenditures required under the Company’s various option agreements for its projects; and other risks and uncertainties relating to the actual results of current exploration activities, the uncertainties related to resources estimates; the uncertainty of estimates and projections in relation to production, costs and expenses; risks relating to grade and continuity of mineral deposits; the uncertainties involved in interpreting drill results and other exploration data; the potential for delays in exploration or development activities; uncertainty related to the geology, grade and continuity of mineral deposits; the possibility that future exploration, development or mining results may vary from those expected; statements about expected results of operations, royalties, cash flows, financial position may not be consistent with the Company’s expectations due to accidents, equipment breakdowns, title and permitting matters, labour disputes or other unanticipated difficulties with or interruptions in operations, fluctuating metal prices, unanticipated costs and expenses, uncertainties relating to the availability and costs of financing needed in the future and regulatory restrictions, including environmental regulatory restrictions. The possibility that future exploration, development or mining results will not be consistent with adjacent properties and the Company’s expectations; operational risks and hazards inherent with the business of mining (including environmental accidents and hazards, industrial accidents, equipment breakdown, unusual or unexpected geological or structural formations, cave-ins, flooding and severe weather); metal price fluctuations; environmental and regulatory requirements; availability of permits, failure to convert estimated mineral resources to reserves; the inability to complete a feasibility study which recommends a production decision; the preliminary nature of metallurgical test results; fluctuating gold prices; possibility of equipment breakdowns and delays, exploration cost overruns, availability of capital and financing, general economic, political risks, market or business conditions, regulatory changes, timeliness of government or regulatory approvals and other risks involved in the mineral exploration and development industry, and those risks set out in the filings on SEDAR+ made by the Company with securities regulators. Although the Company believes that the assumptions and factors used in preparing the forward-looking information in this corporate press release are reasonable, undue reliance should not be placed on such information, which only applies as of the date of this news release, and no assurance can be given that such events will occur in the disclosed time frames or at all. The Company expressly disclaims any intention or obligation to update or revise any forward-looking statements whether as a result of new information, future events or otherwise, other than as required by applicable securities legislation.
Neither the TSX Venture Exchange nor its Regulation Services Provider (as that term is defined in the policies of the TSX Venture Exchange) accepts responsibility for the adequacy or accuracy of this release.
NOT FOR DISTRIBUTION TO UNITED STATES NEWSWIRE SERVICES OR
FOR DISSEMINATION IN THE UNITED STATES

To view the source version of this press release, please visit https://www.newsfilecorp.com/release/281570
Vancouver, British Columbia–(Newsfile Corp. – January 22, 2026) – Questcorp Mining Inc. (CSE: QQQ) (OTCQB: QQCMF) (FSE: D910) (the “Company” or “Questcorp”) along with its partner Riverside Resources Inc. (TSXV: RRI) (OTCQB: RVSDF) (FSE: 5YY0) (“Riverside”), is pleased to report a high grade interval of 20.2 g/t gold and 226 g/t silver with 2.7% zinc over a 30 m long continuous chip channel sample along the decline wall at the Union Mine area, completed during the 2025 Phase I exploration and drill program at the La Union Project in Sonora, Mexico. The Company is also releasing the remaining results from the drill program following up on the 2026-Jan-12 News Release of initial results.
Final Highlights of the Phase 1 Drill and Exploration Program
“We are extremely pleased with the success of our initial Phase I drilling and chip channel sampling at La Union. The drilling and exploration continue to support the CRD model envisaged by John-Mark Staude and his team at Riverside. The unexpected Luis Hill discovery of “Carlin” type gold mineralization further enhances the productivity of the La Union project. We see flashing green to continue forward with our exploration journey,” said Saf Dhillon, President & CEO of Questcorp.
“Riverside is excited by the high grade of 600 gram-metres gold and 6,780 gram-metres silver represented by the 30 metres of continuous chip channel sampling from the Union Mine area,” said John-Mark Staude, President and CEO of Riverside Resources. “These results, together with the completed Phase 1 drill assays from Union Mine, Union Norte and El Cobre, reinforce that drilling is intersecting the types of CRD-style alteration and multi-element signatures we were targeting, including anomalous zinc, silver, gold and lead consistent with the historic mining district and also finding sediment-hosted gold (“SHGD”) indicators is a key development in progressing the Union Project and supports the technical rationale for aggressive follow-up work in 2026.”
Chip Channel Sampling, Union Mine Area
Chip channel sampling along the decline wall at the Union Mine returned high grade gold and supports follow-up exploration, with the potential to drill from the upper most mine workings or from surface to expand upon the 30 m at 20 g/t gold and 226 g/t silver zone. Table 1 discloses the full assay results of the gossan oxides with high grade zinc as is typical of CRDs in the region. The type deposit in the region is Hermosa’s South32 Taylor Deposit in southernmost Arizona near the Sonora border immediately north of the Union Project hosting probable reserves of 65Mt 4.35% zinc, 4.90% lead and 82 g/t silver and measured and indicated resources of 124Mt 3.66% zinc, 4.02% lead and 73 g/t silver. Hermosa South32 is currently investing $2.6 billion to develop the Hermosa Project. Sources: South32 2025 Annual Report; https://south32hermosa.com/wp-content/uploads/2025/05/S32_Hermosa-Project-Overview-EN_050125-Web-1.pdf.
Table 1. Chip Channel Sample Results from Union Mine Decline
30 meter continuous chip channel sampling interval Union Mine Adit
| SampleID | SampleType | Width_m | RockType | Au_ppm | Ag_ppm | Zn_% | As_ppm | Cu_ppm | Pb_ppm |
| RRI 13959 | Chip Channel | 3 | Gossan oxides of CRD Dolomite | 0.161 | 33 | 3.21 | 358 | 392 | 467 |
| RRI 13961 | Chip Channel | 3 | Gossan oxides of CRD Dolomite | 0.048 | 5 | 3.53 | 619 | 1160 | 171 |
| RRI 13962 | Chip Channel | 3 | Gossan oxides of CRD Dolomite | 11.57 | 55 | 2.8 | 3420 | 1080 | 2840 |
| RRI 13963 | Chip Channel | 3 | Gossan oxides of CRD Dolomite | 6 | 1083 | 2.31 | >5000 | 1030 | 759 |
| RRI 13964 | Chip Channel | 3 | Gossan oxides of CRD Dolomite | 12.75 | 610 | 4.06 | >5000 | 2160 | 722 |
| RRI 13965 | Chip Channel | 3 | Gossan oxides of CRD Dolomite | 0.159 | 107 | 2.25 | >5000 | 1630 | 1190 |
| RRI 13966 | Chip Channel | 3 | Gossan oxides of CRD Dolomite | 1.115 | 197 | 4.35 | >5000 | 426 | 1020 |
| RRI 13967 | Chip Channel | 3 | Gossan oxides of CRD Dolomite | 0.282 | 50 | 0.7 | >5000 | 61 | 242 |
| RRI 13968 | Chip Channel | 3 | Gossan oxides of CRD Dolomite | 14.73 | 66 | 3.11 | >5000 | 2040 | 2650 |
| RRI 13969 | Chip Channel | 3 | Gossan oxides of CRD Dolomite | 155.41 | 54 | 0.4 | 4330 | 214 | 2660 |
| Total Amounts | 30 | Total Grams over 30 m = | 202 | 2257 | 26720 | ||||
| Interval | 30 m @ 20.2g Au, 226 g Ag, 2.7% Zn | ||||||||
Table 1: Full 30m channel sampling results with the interval. For reference, using a 24 m continuous subset of the channel interval, the average weighted grade is 25 g/t gold and 290 g/t silver. The sampling is oblique to strike.
The Union Mine cross section (Figure 1) shows holes 1 and 8 along with the gold-rich channel sampling results, providing context for the 30 m gold-silver-zinc interval relative to some of the known ore bodies. Areas for follow-up and expansion at Union Mine area are clearly indicated to the right (southeast) in Figure 1 as the 2025 drilling has helped define the stratigraphy and highlighted areas of SHGD styles of mineralization similar to eastern Nevada. The bottom of hole 8 hit strong indications of CRD mineralization prior to intersecting the mine workings, as well as manto horizons along the drill hole with 15.85m @ 214 ppm Zn in dolomitized limestone. Drill hole 7, drilled north of holes 1 and 8 and the cross section hit 14m @ 0.1% Zn in the Union Mine area as well.
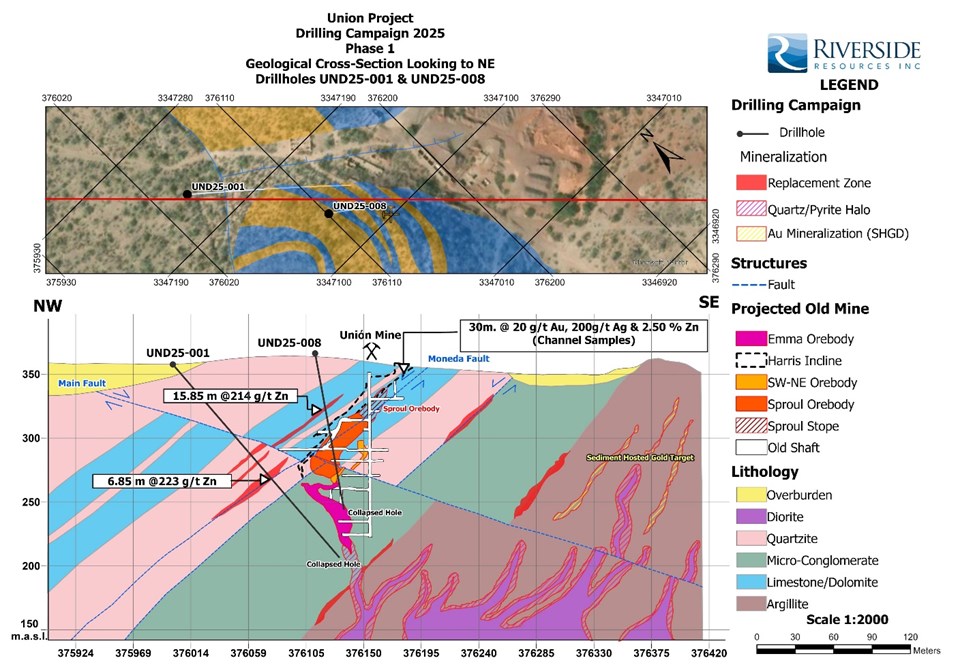
Figure 1: Cross section through the Union Mine area showing Phase 1 drill holes (including holes 1 and 8), interpreted mine workings/ore zones, and the location of the continuous channel sample along the Union Mine decline wall. The section illustrates the spatial relationship between the high-grade Au-Ag-Zn channel interval and nearby drill intercepts and provides geological context for potential follow-up targeting for both CRD and SHGD.
To view an enhanced version of this graphic, please visit:
https://images.newsfilecorp.com/files/10197/281197_44ef014414fe69cd_001full.jpg
The second Union Mine cross section (Figure 2) shows the channel sampling along with the location of historic mining, highlighting areas with remaining CRD potential.
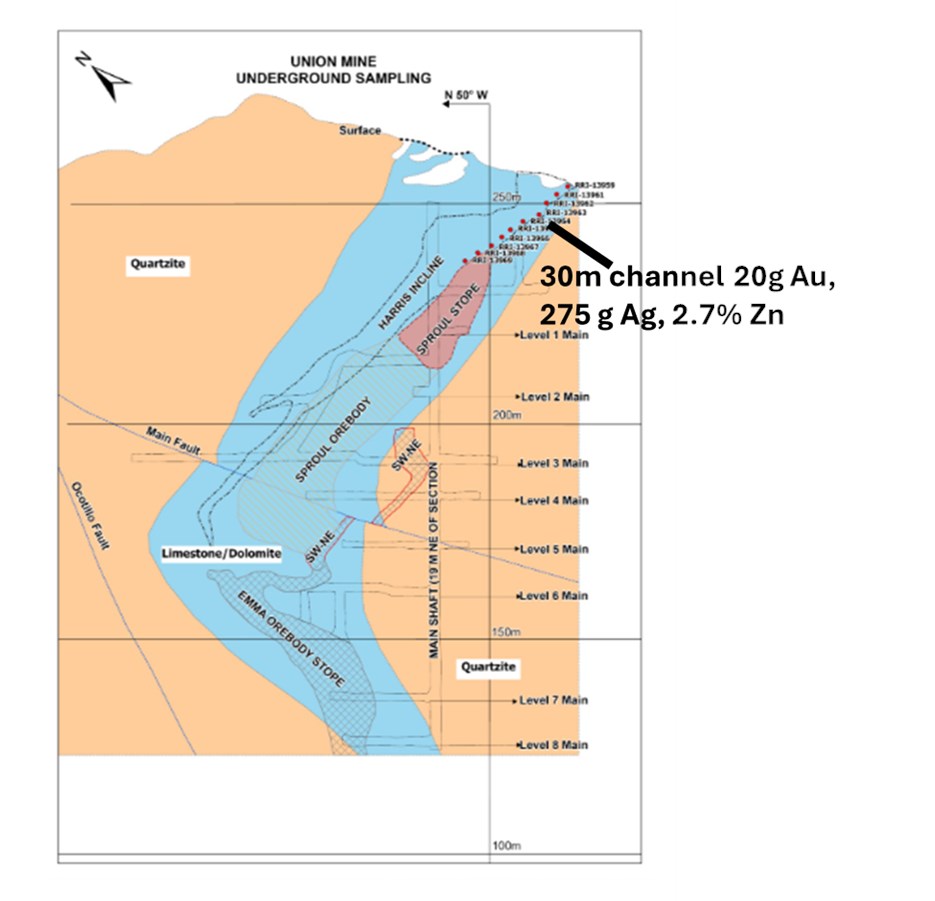
Figure 2: Cross section of the Union underground sampling and some of the orebodies previously mined that could have remaining potential as CRD targets for next round of follow up.
To view an enhanced version of this graphic, please visit:
https://images.newsfilecorp.com/files/10197/281197_44ef014414fe69cd_002full.jpg
Phase 1 Drill and Exploration Program Highlights
The location of all 12 drill holes from the 2025 Phase I programs are shown in the drill plan (Figure 3), with the channel sampling area and the Union Mine, Union Norte and El Cobre target areas highlighted.
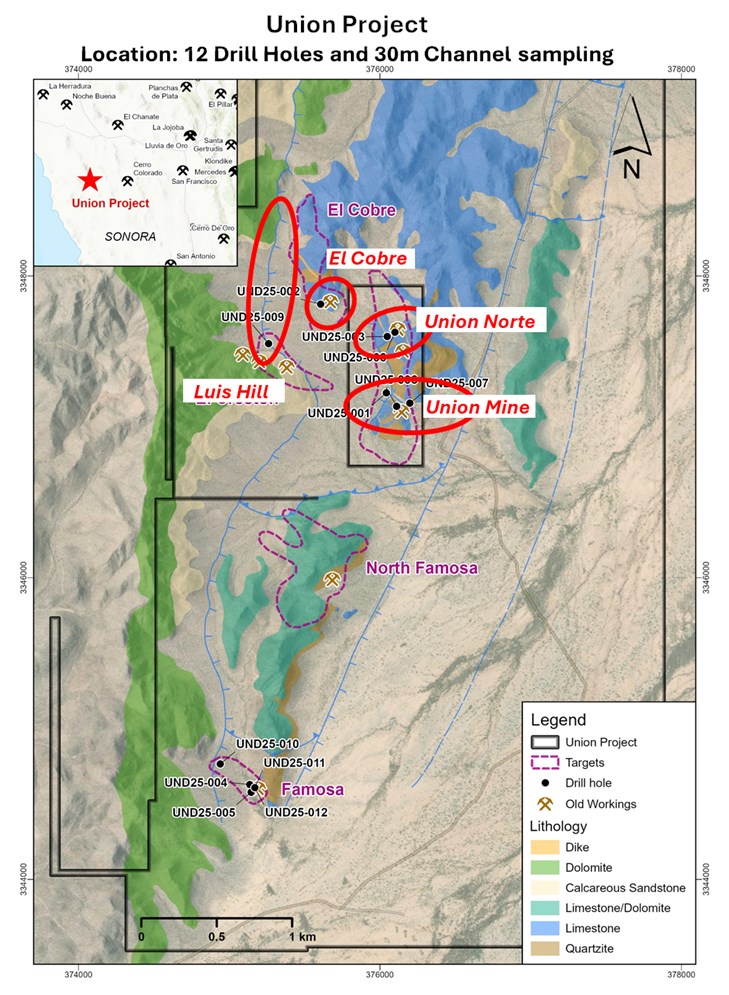
Figure 3: Union project drill hole locations for 1600m with 12 total holes in Phase 1 program with Questcorp and Riverside working together during 2025 exploration program.
To view an enhanced version of this graphic, please visit:
https://images.newsfilecorp.com/files/10197/281197_44ef014414fe69cd_003full.jpg
While the results from the Famosa Targets and Luis Hill were disclosed in the 2026-Jan-12 News Release, Table 2 discloses the full results from the 2025 program, with the previously drilled holes highlighted in yellow. Hole 3 is not shown as it is aborted early due to poor drilling conditions, it was redrilled as hole 6 to test and hit mineralization in the target area initially planned for hole 3. Further drilling at Union Norte can be pursued and is recommended for both CRD and SDHG targets.
| Target | Hole ID | From | To | Width | g/t Au | g/t Ag | ppm Pb | ppm Zn |
| Union Mine | UND25-001 | 64.8 | 65.6 | 0.8 | 227 | |||
| UND25-001 | 68.75 | 77.8 | 9.05 | 116 | ||||
| UND25-001 | 133.05 | 134.2 | 1.15 | 179 | 1148 | |||
| El Cobre | UND25-002 | 86.5 | 87.65 | 1.15 | 568 | 743 | ||
| UND25-002 | 148.5 | 149.95 | 1.45 | 749 | 2262 | |||
| Famosa Mine | UND25-004 | 19.1 | 34 | 14.9 | 120 | 141 | ||
| UND25-005 | 35.05 | 46 | 10.95 | 0.066 | 3.34 | 102 | 61 | |
| including | 39.1 | 40.95 | 1.85 | 0.354 | 13.40 | 485 | 243 | |
| Union Norte | UND25-006 | 47.5 | 49 | 1.5 | 0.382 | 1.10 | 130 | 186 |
| Union Mine | UND25-007 | 139 | 141 | 2 | 0.084 | 1.20 | 398 | 537 |
| UND25-007 | 146.85 | 147.9 | 1.05 | 175 | ||||
| UND25-007 | 152.2 | 166.2 | 14 | 0.018 | 0.96 | 70 | 1004 | |
| including | 154.75 | 156.7 | 1.95 | 1512 | ||||
| including | 161.65 | 163.15 | 1.5 | 2778 | ||||
| UND25-008 | 66.5 | 82.35 | 15.85 | 223 | ||||
| Luis Hill | UND25-009 | 64.95 | 66.95 | 2 | 0.299 | 18.60 | 53 | 24 |
| UND25-009 | 95.8 | 97.8 | 2 | 0.411 | 26.90 | 58 | 43 | |
| UND25-009 | 198.25 | 241.25 | 43 | 0.276 | 0.71 | 25 | 87 | |
| including | 211.8 | 217.8 | 6 | 0.852 | 0.69 | 29 | 100 | |
| including | 228.3 | 232.9 | 4.6 | 0.466 | 0.78 | 13 | 63 | |
| UND25-009 | 273.95 | 275 | 1.05 | 0.183 | 12.20 | 4680 | 3490 | |
| UND25-009 | 287.55 | 289.55 | 2 | 0.114 | 0.60 | 48 | 37 | |
| Famosa EM | UND25-010 | 39.5 | 87.45 | 47.95 | 90 | |||
| Famosa Mine | UND25-010 | 146.4 | 148.05 | 1.65 | 0.135 | 0.25 | 2 | 17 |
| UND25-011 | 11.5 | 23.35 | 11.85 | 0.018 | 13.09 | 224 | 157 | |
| UND25-012 | 9.65 | 25.8 | 16.15 | 0.031 | 3.65 | 138 | 124 | |
| including | 12.9 | 16.9 | 4 | 0.084 | 6.60 | 398 | 287 |
Table 2: Full 2025 assay interval results from the 2025 Phase I drill program. Note: all intervals are down hole widths as true width is unknown at this time.
Union Mine Target Detail
Union Mine, with CRD in past oxide operations, had three holes drilled this round (UND25-1, 7, 8). Drilling intersected zinc in the right types of alteration for the CRD, with the holes ending in the old underground workings. Follow-up drilling will be completed to better test these precious and base metal zones and particularly the SHGD potential as well.
Luis Hill Target Detail (Previously Announced 2026-Jan-12)
Hole 9 was drilled vertically in the southern part of the Luis Hill target, a large 1,500 m by 500 m magnetic high. Although the hole did not intersect an obvious large magnetic source, it cut several magnetic dioritic dikes, which may be related to a deeper and larger magnetic body, likely an intermediate-composition intrusion. The discovery interval comprises gold hosted in siliceously replaced, jasperoid-like dolomite and silica-flooded black shale, which is comparable to some sediment-hosted gold deposits in Nevada (Carlin Deposits, USGS Prof. Paper 1267, 1985). This represents a new finding for this part of Sonora and is significant for both the property and the region, as it indicates potential for previously unrecognized sediment-hosted gold within one of Mexico’s most prolific gold belts, the Sonora Gold Belt (also referred to as the Megashear Gold Belt in past scientific studies). Folding and Basin and Range block faulting are expected to bring the mineralized formations closer to surface, supporting additional drilling in H1 2026 within the magnetic target area. Riverside and Questcorp believe Luis Hill has the potential to become a major new discovery in Mexico.
The new discovery at Luis Hill identified previously unrecognized Carlin-like, sediment-hosted gold mineralization in black shales and carbonate strata, returning 0.3 g/t gold over 42 m, with results to date indicating sulfides, mineralization styles, and intrusions consistent with a carbonate-hosted metal system. The 42 m interval comprises 23 assay intervals ranging from 0.45 m to 2 m in width, with gold values from 0.005 g/t to 1.31 g/t; fifteen intervals returned greater than 0.1 g/t Au, including three intervals exceeding 0.5 g/t Au. This type of thick continuity is new for this part of Sonora, while further east the Santa Gertrudis mine produced 671K oz of gold and has indicated open pit resources of 19.27Mt @ 0.91 g/t Au for 563K oz gold, inferred open pit resources of 9.82Mt @ 1.36 g/t for 429K oz gold and inferred underground resources of 9.02Mt @ 3.44 g/t gold for 1.004M oz gold in siltstone, shale and carbonate sediment. Sources: Production: https://miningdataonline.com/property/1718/Santa-Gertrudis-Project.aspx, Resources: Agnico Eagle Mines Limited Detailed Mineral Reserve and Mineral Resource Data as of December 31, 2024.
The geochemistry from the gold intercepts associated with shale horizons at Luis Hill are plotted in (Figure 4) and illustrate the relationship between gold and argillite-hosted horizons. This indicates that Luis Hill is not CRD mineralization; instead, it represents an SHGD-style system This indicates that Luis Hill is not CRD mineralization; instead, it represents an SHGD-style system:
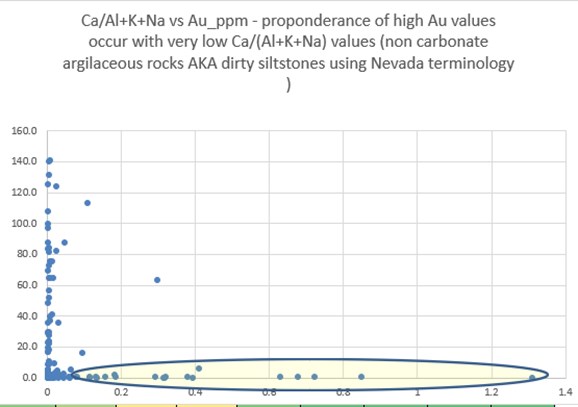
To view an enhanced version of this graphic, please visit:
https://images.newsfilecorp.com/files/10197/281197_44ef014414fe69cd_004full.jpg
Figure 3: Gold with high Al + K + Na, meaning not with the dolomite and limestone for the sediment-hosted gold aspects like Nevada. Carlin geochemistry for the Luis Hill Hole 9.
| Table for Phase 1 Drilling Union Project H2, 2025 All Holes, 162 5 m total | |||||||
| Hole _lD | East ing | Northing | Elevat ion | Azimuth | Dip | Total Depth | Target |
| UND25-001 | 376043 | 3347225 | 358.66 | 131 | -50 | 198.25 | Union Mine |
| UND25-002 | 375606 | 3347813 | 381.37 | 65 | -50 | 201.30 | El Cobre |
| UND25-003 | 376048 | 3347598 | 378.34 | 65 | -50 | 25.90 | Union Norte |
| UND25-004 | 375137 | 3344629 | 360.47 | 110 | -70 | 129.35 | Famosa Mine |
| UND25-005 | 375146 | 3344578 | 362.35 | 92 | -70 | 104 .80 | Famosa Mine |
| UND25-006 | 376099 | 3347627 | 389.13 | 100 | -80 | 118.45 | Union Norte |
| UND25-007 | 376199 | 3347156 | 355.46 | 280 | -80 | 166.20 | Union Mine |
| UND25-008 | 376111 | 3347136 | 369.34 | 125 | -80 | 128.10 | Union Mine |
| UND25-009 | 375261 | 3347551 | 400.64 | 0 | -90 | 292 .80 | Luis Hill |
| UND25-010 | 374941 | 3344765 | 363.95 | 90 | -70 | 161.60 | Famosa EM |
| UND25-011 | 375171 | 3344608 | 362.45 | 90 | -85 | 51.00 | Famosa Mine |
| UND25-012 | 375171 | 3344608 | 362.45 | 90 | -90 | 47.25 | Famosa Mine |
Table 3: Complete drill collar information. The drill results from the unshaded holes are being released today and include results from the Union Mine, Union Norte and El Cobre. The yellow-colored holes were announced 2026-Jan-12.
Geological Model and Strategy
The H2 2025 Phase I program was designed to test primary areas of historical mining and key magnetic targets. The program followed the geological model of the South32 Taylor deposit in southern Arizona. Drilling intersected gold, zinc, and silver indications consistent with vectors toward a major discovery.
Furthermore, the sediment-hosted gold style found at Luis Hill is comparable to Nevada’s carbonate platform geology, making it an intriguing new development area for the Union Project.
Sampling Procedures and QA/QC
Core was logged, saw-cut, and half-core samples were shipped for analysis. Samples from the first eight holes were delivered to Bureau Veritas (Hermosillo, Sonora) for gold fire assay, with pulps forwarded to Vancouver, Canada for Inductively Coupled Plasma-Mas Spectrometry (“ICP-MS”) following four-acid digestion to determine silver, base metals, and pathfinders. Samples from the final four holes were shipped to ACT Labs Zacatecas, where preparation, gold assay, and multi-element ICP are completed in Mexico. The final 4 holes of the program were shipped to ACT Labs where they were similarly assayed using the same processing methods but with their initial preparation and assaying completed in Zacatecas, Mexico using the same ICP and gold fire assay methods. The change in lab halfway through the program was due to assay turn around issues. Samples were maintained in chain of custody being delivered to the laboratory in sealed bags. Remaining half-cores are retained for reference. Standards were inserted every 20 samples and blanks every 100 samples. The laboratory also duplicated every 20 samples as an additional check on quality control. The QA/QC was analyzed with a check for any variations in the standards beyond 2 standard deviations and the standards passed.
Next Steps
With the interpretation and release of all assays, the Companies will work together on organizing the H1 2026 Phase 2 exploration program, building from the Phase I exploration results. Along with follow-up drilling, Phase 2 will likely include geophysics, geochemistry and mapping.
The encouraging results at Union Mine and at Luis Hill warrant further significant exploration and drilling and will be the primary focus of the next phase of La Union exploration.
The Companies are diligently working toward an expanded drill program for H1 2026, as all permits and access are in good standing. With the new data and targets ready to be further explored, the potential to immediately begin field work portions are in place for early this year.
Qualified Person
The technical content of the new release has been reviewed and approved by R. Tim Henneberry, P. Geo (British Columbia), a director of the company and a qualified person under National Instrument 43-101.
The Union Agreement
Questcorp currently holds an option to earn a 100% interest in the Union Project, on terms previously announced May 6, 2025. Questcorp and Riverside are aligned through Riverside’s equity interest in Questcorp, which is initially 9.9% and may increase to 19.9% upon Questcorp satisfying the complete earn-in, with Riverside also retaining a 2.5% NSR royalty.
About Questcorp Mining Inc.
Questcorp Mining is engaged in the business of the acquisition and exploration of mineral properties in North America, with the objective of locating and developing economic precious and base metals properties of merit. The company holds an option to acquire an undivided 100-per-cent interest in and to mineral claims totaling 1,168.09 hectares comprising the North Island copper property, on Vancouver Island, B.C., subject to a royalty obligation. The company also holds an option to acquire an undivided 100-per-cent interest in and to mineral claims totaling 2,520.2 hectares comprising the La Union project located in Sonora, Mexico, subject to a royalty obligation.
ON BEHALF OF THE BOARD OF DIRECTORS,
Saf Dhillon
President & CEO
Questcorp Mining Inc.
saf@questcorpmining.ca
Tel. (604-484-3031)
Suite 550, 800 West Pender Street
Vancouver, British Columbia
V6C 2V6.
Certain statements in this news release are forward-looking statements, which reflect the expectations of management regarding completion of survey work at the North Island Copper project. Forward-looking statements consist of statements that are not purely historical, including any statements regarding beliefs, plans, expectations or intentions regarding the future. Such statements are subject to risks and uncertainties that may cause actual results, performance or developments to differ materially from those contained in the statements. No assurance can be given that any of the events anticipated by the forward-looking statements will occur or, if they do occur, what benefits the Company will obtain from them. Except as required by the securities disclosure laws and regulations applicable to the Company, the Company undertakes no obligation to update these forward-looking statements if management’s beliefs, estimates or opinions, or other factors, should change.
To view the source version of this press release, please visit https://www.newsfilecorp.com/release/281197
Vancouver, British Columbia–(Newsfile Corp. – January 21, 2026) – Riverside Resources Inc. (TSXV: RRI) (OTCQB: RVSDF) (FSE: 5YY0) (“Riverside” or the “Company“) is excited to announce that it has used some of the recent capital raise, and more importantly, has doubled the size of the Jacket Property by optioning the Redtop property. The combined project will now be referred to as the “Red Jacket Project.” The decision to acquire the Redtop property followed Riverside’s initial exploration program in the later part of 2025. The Redtop property is contiguous with, and immediately north of Riverside’s Jacket claims.
The Red Jacket is easily accessed via paved highway and then by logging road, approximately 15 km east of Clearwater and 115 km north-northeast of Kamloops in central British Columbia. The project is north of the Taesko Mines’ feasibility-stage Yellowhead Copper Project, which hosts a large Cu-Zn-AG-Au reserve and is considered a potential near-term future mine. The Redtop property hosts at least three main outcropping and previously drilled polymetallic mineral occurrences and is located within a well mineralized prospective belt of volcanogenic massive sulphide (“VMS”) deposits. These occurrences display classic features characteristic of the large Canadian deposits of this deposit type and are similar to Taseko’s copper resource 10km to the south in the same Eagle Formation, Cambrian age geology.
The Company reviewed the historical work and expanded on historical soil sampling and trenching this autumn. This work outlines a 4 km long northwest-southeast trend that includes the Redtop, Snow and Sunrise showings. Riverside completed target sampling in late 2025 to validate mineralization in areas of past trenching and to strengthen confidence in the project’s best-known zones, where 2026 exploration work can be done on the consolidated project. Riverside’s results confirm the presence of meaningful polymetallic grades at surface supporting the view that the Red Top horizon merits systematic follow-up work to evaluate continuity and prioritize the most prospective sections for the next phases of exploration.
“Red Jacket is a compelling project in our British Columbia portfolio, and we have expanded our property footprint by acquiring the Redtop project,” said John-Mark Staude, CEO of Riverside Resources. “Our 2025 sampling returned high-grade polymetallic results from historical trenches, reinforcing that the Redtop–Snow–Sunrise trend warrants drill testing and further expansion, particularly in light of Taseko’s advanced-stage copper development project in the same geology immediately to the south. Red Jacket is positioned in a proven district that has seen significant past exploration and mining activity. We believe we are in a strong position to advance value generating work across the expanded claim package and pursue additional discoveries as we work to discover new mineral resources for the Riverside”.
Red top deal terms:
The Redtop claims are located north of, and contiguous with, Riverside’s Jacket claims. Riverside has signed an option agreement to acquire the claims from a private group called “Geo Exploration Scouts”. The terms of the option agreement are summarized in the table below.
Table 1: Option terms of the Redtop Claims
| Completion Date | Cash ($) | Additive Expenditures ($) | ||||
| On signing of Definitive Agreement | 12,000 (paid) | 0 | ||||
| At time of receiving approval of drill permit within 4 years (Approval Date) | 21,000 | 50,000 | ||||
| One year after Approval Date | 27,000 | 100,000 | ||||
| Two years after Approval Date | 45,000 | 300,000 | ||||
| Three years after Approval Date | 75,000 | 300,000 | ||||
| Total | $ | 180,000 | $ | 750,000 | ||
In addition to the cash and work expenditures, the Optionor will retain a 0.45% Net Smelter Returns Royalty, which is subject to $1,000,000 buyout. Riverside will have the first right of refusal on any sale or transaction involving the royalty. If an exploration permit cannot be obtained within 4 years of signing the definitive agreement, the project will be returned to optionor. No payments or work commitments will be required until a drill permit is acquired and all necessary agreements are in place to proceed with drilling and related exploration. The option agreement is subject to TSXV approval.
Historical Exploration Work
The historical geochemistry, geology and geophysics, including that on the optioned claims, continues to add value for the Company. This builds on key work completed by companies such as Placer Dome, and precedes the work by Taseko, which now controls the large copper resource, reserve and feasibility-staged property to the south. At Red Jacket, the combined and integrated historical soil sampling surveys confirm the continuity of the known mineralized bands, and can be traced consistently within a defined belt over 4km long northwest-southeast horizon that includes the known MinFile showings: Redtop, Snow and Sunrise (Figure 2). The prospective horizon hosting these showings has received minimal drill testing and the entire length of the horizon is considered a target. Historical work by Placer Dome Inc. shows a zinc-in-soil anomaly enveloping the areas of known mineralization, similar to the Yellowhead deposit in its early exploration history. This linear, southeast trending anomaly is roughly parallel to a potassium enrichment zone shown in the K% and eTH/eK radiometric images (Figure 1). In addition, the north-trending linear magnetic highs noted on the Total Magnetic Intensity image are likely showing mafic dikes and/or structures. Together, the airborne detailed magnetics help in refining targets, and the coincident soil anomalies provide immediate areas of interest with district-scale potential. Linking the historical showings with the consolidated land package positions the Company to advance systematic work aimed at unlocking value for shareholders.
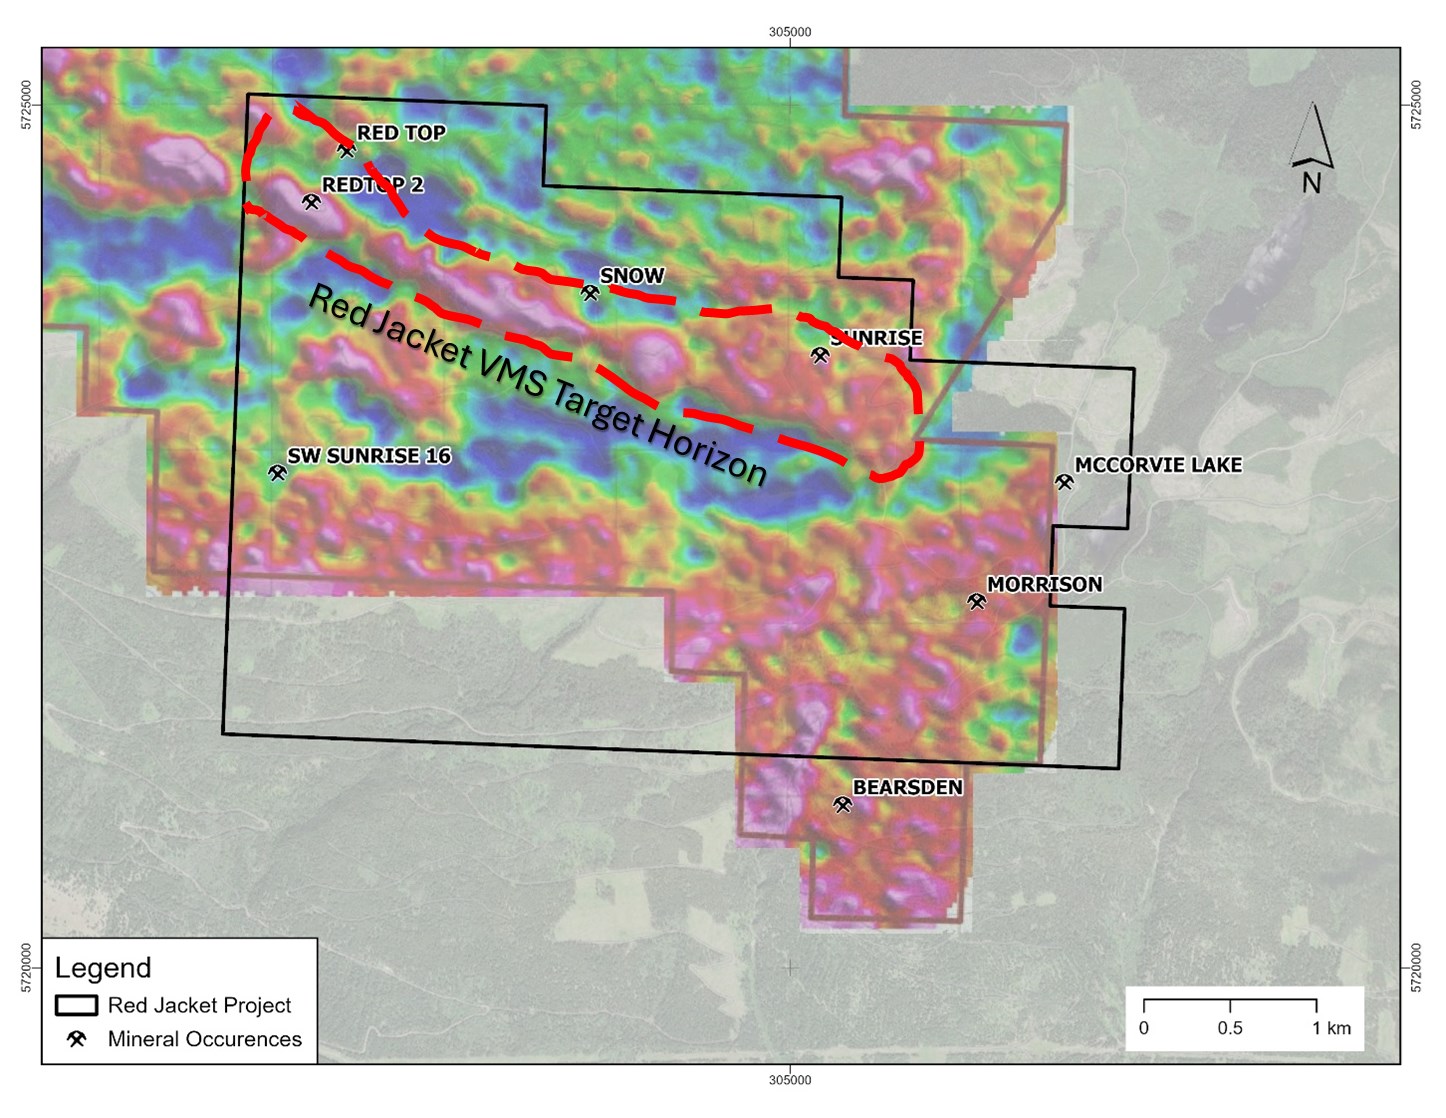
Figure 1: Radiometric Map K% of the Red Jacket project with the red northwest high showing the outcropping and very near surface potassic anomaly associated with the VMS style alteration and multiple mineral showings that have high grade base metals in trenches and dumps but with very limited shallow drilling.
To view an enhanced version of this graphic, please visit:
https://images.newsfilecorp.com/files/6101/281008_b05683e404ba7b91_002full.jpg
2025 Riverside Samples
Riverside collected samples before snowfall ended the program, and Riverside can now return early in the spring to continue follow-up work on the Redtop claims, supported by high-grade assay results. The sampling confirmed the historical range of high-grade values in the area of past trenching that are easily accessible by recent logging roads. These areas include zones affected by pine beetle tree kill, which has created extensive new exposures that were not available even a decade ago. Three main showings were sampled during the autumn field work, while the actual Redtop showing already had snow cover and will be a priority target for early 2026 field work.
Table 2: Riverside Grab samples from the Sunrise and Snow trenches.
| Sample | Au (ppb) | Ag (ppm) | Pb (%) | Zn (%) | Cu (%) | Showing |
| 472167 | 866 | 176 | 1.11 | 2.38 | 0.11 | Sunrise |
| 472168 | 513 | 86.9 | 0.63 | 0.65 | 0.04 | Sunrise |
| 472169 | 454 | 128 | 0.76 | 23.00 | 0.04 | Sunrise |
| 472170 | 714 | 22.1 | 0.14 | 24.40 | 0.03 | Sunrise |
| 472171 | 345 | 217 | 2.78 | 0.65 | 0.43 | Snow |
*Grab samples were taken in November of 2025 by Riverside Personnel.Grab samples by their nature are selected samples and the results for these selected samples may not reflect underlying mineralization.
The area of the Sunrise Occurrence contains at least six trenches, showing multiple thin bands of semi-massive to massive sulphide hosted in quartz-sericite schist. Bedding at Sunrise dips shallowly (<10°) to the east, as the showing is located in the nose of the anticline. Four samples were collected and assayed from the Sunrise trenches, with elements from the four samples returning up to 1.1% lead, up to 24% Zn, up to 0.1% Cu, and up to 128 g/t Ag and 0.8 g/t Au (Table 1).
The Snow Showing comprises of a small trench that hosts shallowly north-dipping, rusty quartz-sericite schist. A poorly exposed semi-massive sulphide layer of unknown thickness is present locally with a cherty component. This occurrence also features crosscutting, chalcopyrite-bearing veinlets. One sample was collected and assayed in 2025 that returned: 0.4% Cu, 2.8% Pb, 0.7% Zn, 0.3 g/t Au, and 217 g/t Ag (Table 1).
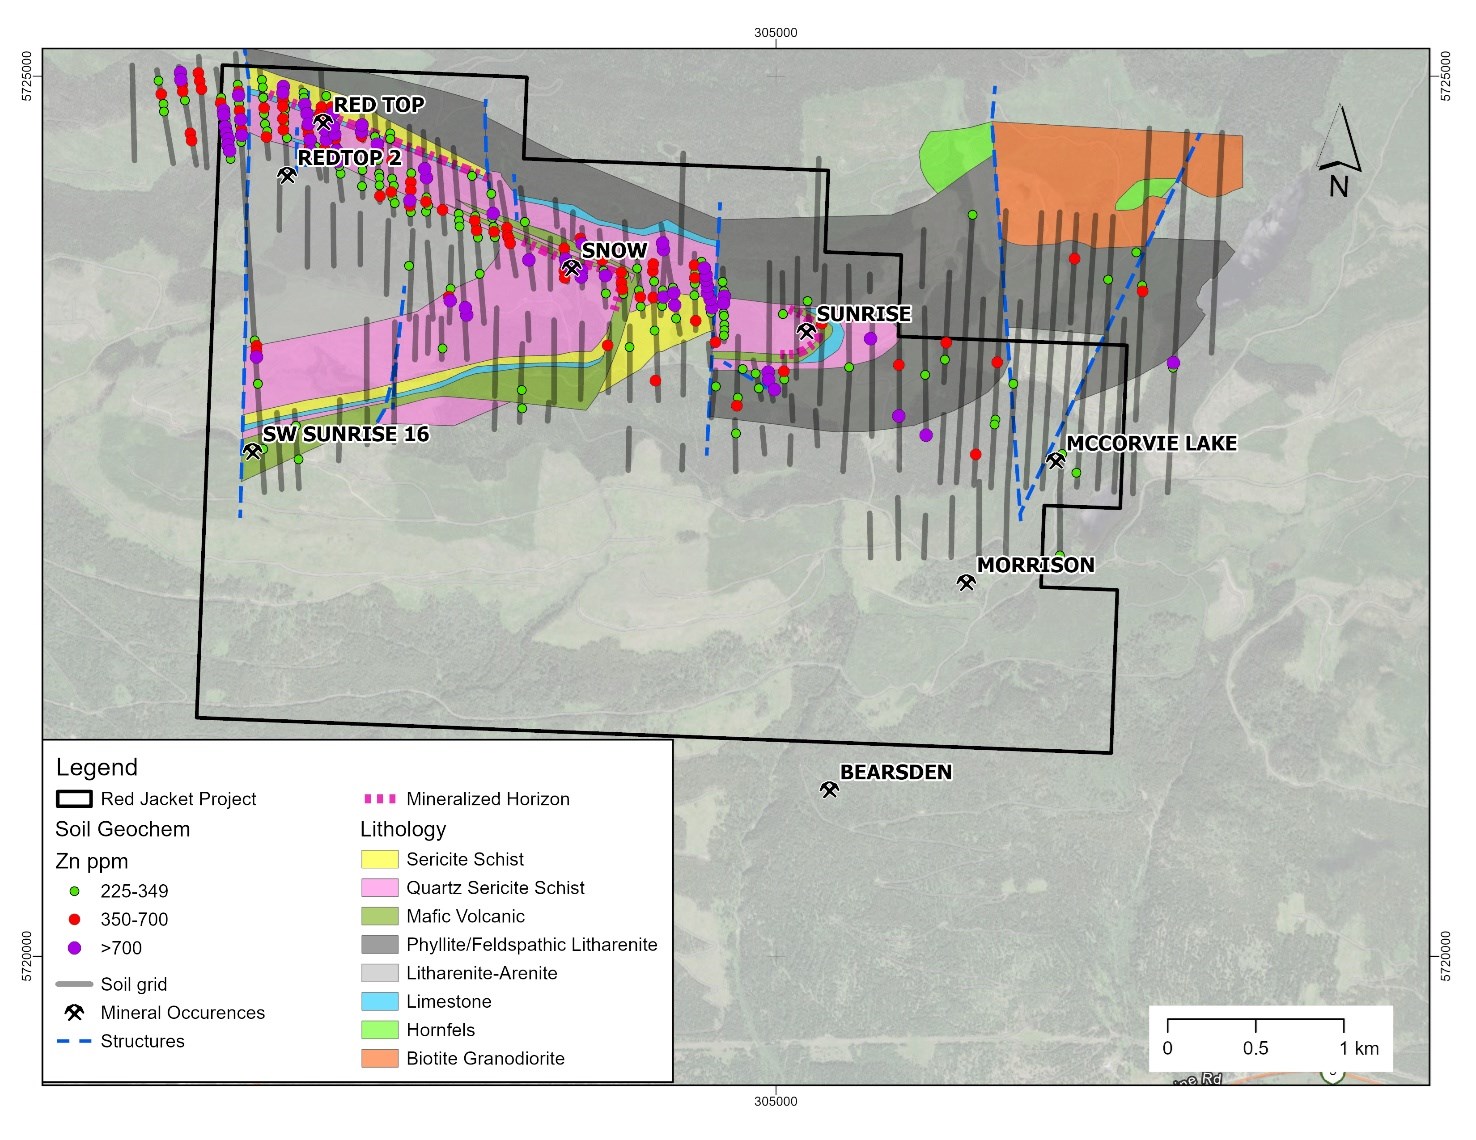
Figure 2: Bedrock geology and locations of showings sampled by Riverside with high grades of Ag, Zn, Pb, and Cu with the lines from historical Zinc-in-soil sample grid completed by Placer Dome Inc. Riverside integrating data to move toward drill targeting and potentially running ground geophysics.
To view an enhanced version of this graphic, please visit:
https://images.newsfilecorp.com/files/6101/281008_b05683e404ba7b91_003full.jpg
Geological Setting
The property is situated within the pericratonic Kootenay Terrane in the southeastern Cordillera, immediately outboard (west) of ancestral North America. This terrane is composed primarily of lower to mid-Paleozoic sedimentary and volcanic rocks and is correlative with the productive Yukon-Tanana Terrane in Alaska and the Yukon Territory. More specifically, the area is underlain by Lower Cambrian to Mississippian deformed and metamorphosed sedimentary and volcanic rocks of the Eagle Bay Assemblage. The assemblage has been intruded by the Upper Devonian to Permian felsic Raft and Baldy batholiths. Devonian to Permian mafic volcanic and intrusive rocks of the Fennell Formation have been thrust over the western part of the assemblage. Government mapping shows the property to be underlain by the “EBQ” unit of the Eagle Bay Assemblage, possibly of Lower Cambrian age. The Eagle Bay is the assemblage that hosts Taseko Mines’ copper reserves and feasibility-staged property at Yellowhead. Eagle Bay has been a mining target and productive geologic VMS unit and Riverside has targeted this unit and specific horizons for this mineral option acquisition. The mineral occurrences on adjacent or nearby properties within the Eagle Bay Assemblage may not be reflected on the Company controlled properties. Further exploration work will continue during H1 of 2026 on the Company property.
Regional VMS Context
VMS deposits are abundant within the Eagle Bay Assemblage and adjacent rocks:
The Property has seen intermittent exploration and was examined by two major companies, INCO and Placer Dome Inc. INCO undertook geological mapping, soil sampling, ground magnetometer and limited VLF surveying in 1977; this was their only program on the Property. Placer completed extensive soil geochemistry and lesser EM, magnetics and geological mapping from 1983 to 1989. They drilled four short holes but recommended drilling an additional 13 holes which were never drilled. Other work on the Property over the years has not been systematic. The Property is considered under-explored and ready for progressing work, particularly with the recent logging that has increased the access and exposures.
The Harper Creek deposit, 10 km to the southeast, is part of the Eagle Bay Formation’s metavolcanic and metasedimentary rocks. Geologically, it lies on the western margin of the Omineca Belt within the Kootenay Terrane. The mineralization is found within tabular zones in various phyllites and quartzites, including quartz-sericite, chloritic, carbonaceous phyllite, and sericitic quartzite. Mineralization occurs as disseminations and patches along rock foliations, and within quartz and quartz-carbonate veins. It is associated with minor sphalerite, galena, arsenopyrite, molybdenite, tetrahedrite-tennantite, bornite, and cubanite, with occurrences of magnetite.
The Harper Creek Fault separates the deposit into east and west domains. The west domain’s mineralization is hosted within three horizons of volcanic and volcaniclastic units. Mineral Reserves: According to a January 2020 NI 43-101 Taseko Mines technical report, the proven and probable mineral reserves are estimated at 817 million tonnes at a 0.17% copper cut-off grade. The average grades are: Copper (Cu): 0.28%; Gold (Au): 0.030 g/t; Silver (Ag): 1.3 g/t. The project is planned as a large open-pit mine with a 25-year life and a processing capacity of 90,000 tonnes of ore per day. Further technical specifications are available in the Technical Report on the Mineral Reserve Update at the Yellowhead Copper Project on the Taseko Mines website.
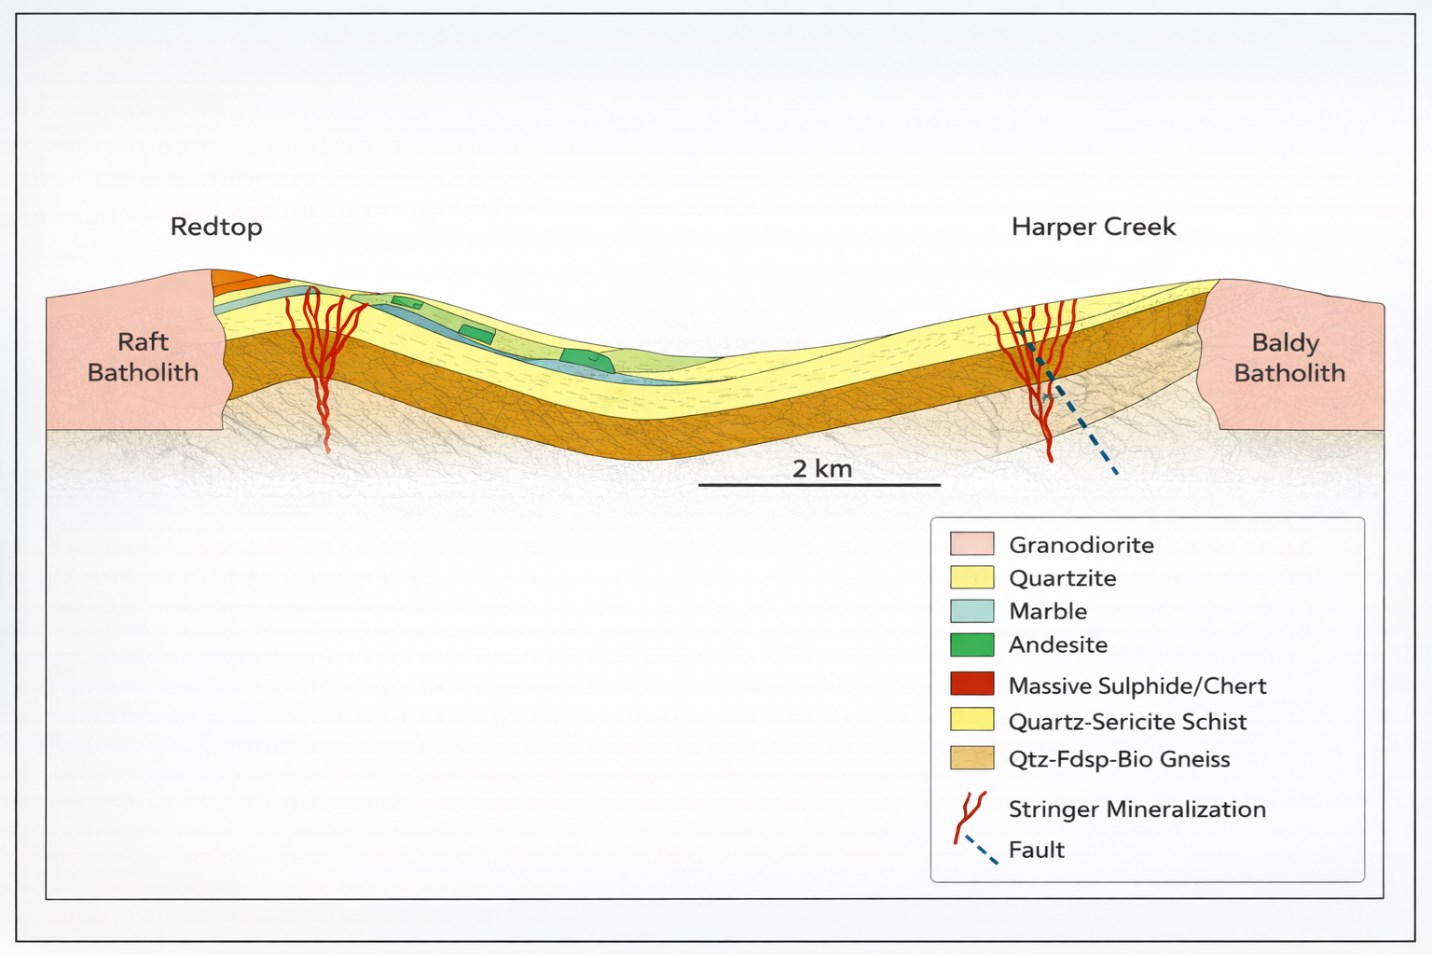
Figure 3: Schematic North – South Cross section of the North Thompson River valley showing the relationship between the Red Jacket (north side) and Harper Creek Deposit (southern side near the Baldy Batholith).
To view an enhanced version of this graphic, please visit:
https://images.newsfilecorp.com/files/6101/281008_b05683e404ba7b91_004full.jpg
Qualified Person & QA/QC:
Sample preparation was completed at ACT Labs located in Kamloops, British Columbia. ACT Labs is ISO/IEC 17025:2017 and ISO 9001:2015 certified laboratory. The “1A2-ICP fire assay” and “1E3 aqua regia” analytical protocols were used on the assay samples. Elements of interest obtained by this method include silver, copper, molybdenum, lead and zinc, amongst others. Aqua regia ICP-OES” refers to a two-step analytical technique used to dissolve solid samples using aqua regia and then analyze the resulting liquid for its elemental composition using Inductively Coupled Plasma Optical Emission Spectroscopy (ICP-OES).
The scientific and technical data contained in this news release pertaining to the Project was reviewed and approved by Freeman Smith, P.Geo, a non-independent qualified person to Riverside Resources who is responsible for ensuring that the information provided in this news release is accurate and who acts as a “qualified person” under National Instrument 43-101 Standards of Disclosure for Mineral Projects.
Capital Markets
Riverside has engaged Horizon Capital Markets Corp. (the “Service Provider“), a Vancouver-based investor relations consulting firm, to provide investor relations services to the Company. The Service Provider and its principal, Eric Negraeff, hold an interest, directly or indirectly, in common shares of the Company and may have an interest in participating in future equity financing or acquiring additional securities through market purchases. The engagement is for a minimum of six months commencing on January 15, 2026, with the Service Provider acting as part-time investor relations provider. The Service Provider will be paid a fee of $3,500 per month. The Service Provider and the Company are unrelated and unaffiliated entities save for the securities holdings of the Service Provider. In connection with the Listing, the engagement of the Service Provider will be subject to the approval of the Exchange.
About Riverside Resources Inc.:
Riverside is a well-funded exploration company driven by value generation and discovery. The Company has a solid balance sheet with over $6,000,000 cash, no debt and tight share structure with a strong portfolio of gold-silver and copper assets and royalties in North America. Further information about Riverside is available on the Company’s website at www.rivres.com.
ON BEHALF OF RIVERSIDE RESOURCES INC.
“John-Mark Staude”
Dr. John-Mark Staude, President & CEO
For additional information contact:
| John-Mark Staude President, CEO Riverside Resources Inc. info@rivres.com Phone: (778) 327-6671 Fax: (778) 327-6675 Web: www.rivres.com | Eric Negraeff Investor Relations Riverside Resources Inc. Phone: (778) 327-6671 TF: (877) RIV-RES1 Web: www.rivres.com |
Certain statements in this press release may be considered forward-looking information. These statements can be identified by the use of forward-looking terminology (e.g., “expect”, “estimates”, “intends”, “anticipates”, “believes”, “plans”). Such information involves known and unknown risks — including the availability of funds, the results of financing and exploration activities, the interpretation of exploration results and other geological data, or unanticipated costs and expenses and other risks identified by Riverside in its public securities filings that may cause actual events to differ materially from current expectations. Readers are cautioned not to place undue reliance on these forward-looking statements, which speak only as of the date of this press release.
Neither the TSX Venture Exchange nor its Regulation Services Provider (as that term is defined in the policies of the TSX Venture Exchange) accepts responsibility for the adequacy or accuracy of this release.
References:
1. https://newport-exploration.com/wp-content/uploads/2022/01/Newport_ChuChua_2021_NI43-101.pdf
2. Samatosum is a past producing polymetallic volcanogenic massive sulphide deposit located approximately 60 km northeast of Kamloops, British Columbia, Canada. Historical production records indicate that approximately 0.63 Mt of ore were mined between 1989 and 1992 grading 1,035 g/t Ag, 1.2% Cu, 1.7% Pb, 3.6% Zn and 1.9 g/t Au (British Columbia MINFILE No. 082M 244). This historical information is provided for background purposes only and the issuer has not independently verified the data. https://minfile.gov.bc.ca/summary.aspx?minfilno=082M++244
3. The Rea deposit resource of approximately 0.38 Mt grading 0.33% Cu, 2.2% Pb, 2.3% Zn, 6.1 g/t Au and 69.4 g/t Ag is considered a historical estimate reported by Sean Bailey, Suzanne Paradis and Stephen Johnston, 2000, Geological Survey of Canada Current Research 2000-A, and has not been verified by the current Qualified Person; it does not conform to current CIM (2014) Definition Standards and is not being treated as a current mineral resource. https://publications.gc.ca/collections/Collection-R/GSC-CGC/M44-2000/M44-2000-A15E.pdf
4. The Homestake deposit hosts a historical estimate of 1.01 million tonnes grading 240 g/t Ag, 2.5% Pb, 4.0% Zn, and 0.55% Cu, as reported by Kamad Silver Co. Ltd. in 1973. The mineralization is described as largely contained in barite lenses within the Eagle Bay Assemblage. The reader is cautioned that this estimate is historical in nature and does not comply with NI 43-101standards. A Qualified Person has not done sufficient work to classify the historical estimate as current mineral resources or mineral reserves. The issuer is not treating the historical estimate as current mineral resources or mineral reserves. https://minfile.gov.bc.ca/Summary.aspx?minfilno=082M++025
5. NI 43-101 Technical Report can be found on www.sedarplus.ca under Taseko Mines Limited July 10, 2025.

To view the source version of this press release, please visit https://www.newsfilecorp.com/release/281008
| Coeur d’Alene, Idaho – January 20, 2026 – Scout Discoveries Corp. (“Scout” or “the Company”) has executed a strategic partnership with Paragon Advanced Labs Inc. (through Paragon Geochemical Laboratories Inc.) to establish a sample preparation facility at Scout’s northern operations hub in Coeur d’Alene, Idaho, co-branded “Scout Analytical, Powered by Paragon.” The facility integrates local sample preparation with Paragon’s ISO-certified analytical capabilities including a Chrysos PhotonAssay™ network to compress assay turnaround time and materially improve efficiency across Scout’s exploration programs. |
| A New Standard for Exploration SpeedThe partnership integrates Scout’s exploration team, robust drilling fleet, and Idaho-based infrastructure with Paragon’s industry-leading geochemical expertise, fire assay and network of Chrysos PhotonAssay™ technology. By establishing localized sample preparation at Scout’s northern operations hub, this partnership removes the logistical bottlenecks that have traditionally hindered exploration progress in the emerging Idaho Copper Belt and adjacent Silver Valley, enabling faster and more efficient project advancement. With Paragon’s ISO-certified analytics now built into Scout, the entire exploration process – including targeting, drilling, logging, core imaging, processing, and assaying – is available to Scout and its partners in a single package. |
| Key Highlights of the PartnershipFully Vertically Integrated: Adding another crucial element to Scout’s vertically integrated model, enabling Scout and its partners to benefit from a seamless workflow, from drilling through to high-precision, independently validated assay results.Priority Processing: Samples from Scout’s exploration projects, along with its partner’s projects, will receive Tier-1 priority at the Coeur d’Alene facility, along with access to Scout’s core processing ensuring rapid data-driven drilling adjustments.Technology-First Approach: The facility will feature advanced Orbis crushing and pulverizing systems, with specialized workflows optimized for PhotonAssay™ — the fastest, most sustainable gold analysis method in the industry.Assay Credits: Scout will receive assay credits equal to the sale amount of its currently operated Orbis OM50WM crusher and pulverizer being transferred to Paragon for use in the new prep facility.Expansion into Nevada: The agreement includes provisions for Scout to assist Paragon in establishing a reciprocal core-processing facility in Sparks, NV, further expanding the partnership’s geographic footprint and expanding the Paragon facility in Sparks to include core-cutting services. |
| “This partnership is exactly the kind of strategic move that defines Scout’s approach to vertical integration of the discovery process,” said Dr. Curtis Johnson, President & CEO of Scout. “By bringing Paragon’s world-class lab capabilities and standards directly into our operations, we are not just improving efficiency, we are fundamentally changing the pace of exploration for our own projects and for our partners, by cutting weeks off the assay turnaround time. In a competitive market, speed is our greatest asset.” |
| Peter Shippen, CEO of Paragon added: “Paragon is committed to being where the discovery action is. Coeur d’Alene is a premier mining jurisdiction, and partnering with Scout—a leader in US exploration—allows us to deploy our ‘Powered by Paragon’ model in a way that benefits the entire regional mining community.” |
| The Coeur d’Alene facility is expected to be fully operational by Q1 2026 for Scout and its partners, Paragon, customers, and all third parties – coinciding with the launch of the spring drilling season. |
| About ParagonParagon Advanced Labs Inc. provides innovative analytical technologies to the global mining industry. By embracing new technology, the Company is addressing critical capacity bottlenecks in mineral assaying through the deployment of PhotonAssay™ technology and complementary analytical solutions. The Company delivers faster, more accurate, and cost-effective mineral analysis for mining operators worldwide. |
| About Scout Discoveries Corp.Scout Discoveries Corp., headquartered in Coeur d’Alene, Idaho, is a private U.S. mineral exploration company with rights to twelve separate precious and base metal projects in the western U.S.A., comprising one of the largest unpatented claim holdings in the region, totaling over 50,000 acres. Scout’s vision is to bring the full discovery process in-house from idea generation through resource drilling, lowering costs and increasing efficiency. With this model, the Company can rapidly advance its project portfolio through discovery by leveraging its five internal core drill rigs and experienced technical teams.For further information, visit: https://www.scoutdiscoveries.com/ |