Tokenization Was Supposed to Stop Fraud. It Didn’t. Here’s Why.
For the last decade, tokenization has been the “big fix” everyone was promised.
One legacy card rail has issued more than 10 billion tokens. Another states, of its ~5 billion tokens issued, one in four of its transactions is now tokenized and growing. Analysts project that more than 80% of global ecommerce will be tokenized within a few years.
And tokenization delivered real gains. Breach liability shifted away from merchants. PANs stopped sitting in databases where they didn’t belong.
Defenders will point to lower fraud rates on tokenized transactions – and they’re right. But when absolute fraud dollars keep climbing year after year, “less bad” isn’t good enough.
But here’s the problem: fraud keeps climbing.
U.S. card fraud hit $14.3B last year, up from $13.6B the year before. In the U.S., card-not-present fraud – where tokenization was supposed to help most – now represents 65–70% of all fraud losses. Roughly $10B a year.
During Cyber 5 alone, over 4% of ecommerce transactions were flagged as suspected fraud attempts. And for guest checkout – nearly half of all e-commerce – tokenization doesn’t even apply. The PAN still travels in the clear.
So if token adoption is exploding…why isn’t fraud collapsing?
Because tokens didn’t remove the problem.
They relocated it. A token is still a credential – a value that exists, travels, and can be intercepted or replayed. It still maps back to a PAN – and every system that touches that mapping becomes an attack surface.
Tokens don’t expire in any meaningful way. They sit in merchant systems for months, years – persistent targets waiting to be found.
When attackers find the seams – replay vulnerabilities, wallet provisioning exploits, fallback-to-PAN routing – the fraud vector reopens. Tokenization reduces certain categories of fraud.
But it doesn’t address the root cause: We still move reusable credentials through the system.
Attackers don’t care whether the credential is a PAN, a token, or a session key. If it works tomorrow, it’s worth stealing today.
That’s why even as tokenization expands, the U.S. remains the global outlier – 25% of global card volume, but 42% of global fraud.
You still pay the price: time lost, accounts frozen, funds drained through a system that was never designed for today’s attack surface.
Tokenization wasn’t a breakthrough. It was a bandaid for decades of payment infrastructure debt – a failure of imagination dressed up as innovation. It solved the edges. It never solved the architecture.
And it was built for a world before quantum computing and effective artificial intelligence. That world is ending faster than legacy networks or merchants can keep up.
The real question was never “How do we protect credentials?”
This press release constitutes a “designated news release” for the purposes of the Sprott Physical Copper Trust’s prospectus supplement dated July 8, 2024 to its base shelf prospectus dated July 3, 2024.
TORONTO, Feb. 17, 2026 (GLOBE NEWSWIRE) — Sprott Asset Management LP (“Sprott Asset Management”), a wholly-owned subsidiary of Sprott Inc. (“Sprott”) (NYSE/TSX: SII), on behalf of the Sprott Physical Copper Trust (TSX: COP.UN) (TSX: COP.U) (the “Trust” or “COP”), a closed-end trust created to invest and hold substantially all of its assets in physical copper metal, today announced that, in connection with the previously announced approval by the United States’ Securities and Exchange Commission (the “SEC”) of a Rule 19b-4 application filed by the NYSE Arca to list and trade COP’s trust units (the “Units”) on NYSE Arca, amendments have been made to the Trust’s trust agreement (the “Trust Agreement”).
The amendments to the Trust Agreement (i) provide that, following COP unitholder approval at a meeting of unitholders as required under applicable Canadian securities laws, COP’s current semi-annual redemption feature will become a monthly redemption feature and the current cap on the number of Units that can be redeemed each redemption period (currently capped at 1.5% of the outstanding Units at the end of the applicable notice period) will be removed, and (ii) make certain consequential changes related to the foregoing and the potential listing of the Units on the NYSE Arca. The date of the COP unitholder meeting will be announced in due course, but the Trust’s intention is to closely align the date of the unitholder meeting and the effectiveness of a registration statement to be filed under the U.S. Securities Exchange Act of 1934 in respect of the listing of the Units on the NYSE Arca (the “Registration Statement”).
The summary of the amendments in this press release is qualified in its entirety by the provisions of Amendment No. 1 to the Trust Agreement, a copy of which will be filed under the Trust’s profile on SEDAR+ at www.sedarplus.ca. Additional details regarding the COP unitholder meeting will be provided in meeting materials made available at a later date and will also be filed under the Trust’s profile on SEDAR+ at www.sedarplus.ca.
The listing of the Units on the NYSE Arca remains subject to the filing and effectiveness of the Registration Statement. The Trust cannot provide any assurance that it will be successful in achieving a listing of the Units on the NYSE Arca.
About Sprott Sprott is a global asset manager focused on precious metals and critical materials. At Sprott, we are specialists. We believe our in-depth knowledge, experience and relationships separate us from the generalists. Our investment strategies include Exchange Listed Products, Managed Equities and Private Strategies. Sprott has offices in Toronto, New York, Connecticut and California and Sprott’s common shares are listed on the New York Stock Exchange and the Toronto Stock Exchange under the symbol “SII”. For more information, please visit www.sprott.com. Sprott Asset Management is a wholly-owned subsidiary of Sprott and is the investment manager to the Trust.
About the Trust
Important information about the Trust, including the investment objectives and strategies, applicable management fees, and expenses, is contained in the current annual information form for the Trust and the Trust’s prospectus. Please read these documents carefully before investing. You will usually pay brokerage fees to your dealer if you purchase or sell units of the Trust on a stock exchange. If the units are purchased or sold on a stock exchange, investors may pay more than the current net asset value when buying units or shares of the Trust and may receive less than the current net asset value when selling them. Investment funds are not guaranteed, their values change frequently and past performance may not be repeated.
Forward-Looking Statements This press release contains “forward-looking information” and “forward-looking statements” within the meaning of applicable Canadian and U.S. securities laws (collectively, “forward-looking statements”). Forward-looking statements in this press release include, without limitation, statements regarding the listing of the Units on NYSE Arca, the filing and effectiveness of the Registration Statement, and amendments to COP’s redemption feature. With respect to the forward-looking statements contained in this press release, the Trust has made numerous assumptions regarding, among other things: subsequent U.S. listing of the Units, ability to obtain unitholder approval for amendments to COP’s redemption feature, as well as dynamics in the copper market. While the Trust considers these assumptions to be reasonable, these assumptions are inherently subject to significant business, economic, competitive, market and social uncertainties and contingencies. Additionally, there are known and unknown risk factors and uncertainties that could cause the Trust’s actual results, performance or achievements to be materially different from any future results, performance or achievements expressed or implied by the forward-looking statements contained in this press release. A discussion of certain risks and uncertainties facing the Trust appears in the Trust’s Annual Information Form for the year ended December 31, 2024, and its prospectus supplement dated July 8, 2024 and related short-form base shelf prospectus dated July 3, 2024, as updated by the Trust’s continuous disclosure filings, which are available at www.sedarplus.ca. All forward-looking statements herein are qualified in their entirety by this cautionary statement, and the Trust disclaims any obligation to revise or update any such forward-looking statements or to publicly announce the result of any revisions to any of the forward-looking statements contained herein to reflect future results, events or developments, except as required by law.
Contact: Glen Williams Senior Managing Partner Investor and Institutional Client Relations Direct: 416-943-4394 gwilliams@sprott.com
Elemental Royalty signaled on Tuesday that investors will be able to receive dividends in the form of Tether’s XAUT, establishing a novel use case for tokenized gold on Wall Street.
The move is aimed at providing investors with direct ownership of physical gold, stemming from investments in gold royalties, the Colorado-based firm said in a press release. In total, investors are expected to receive a 12 cent dividend across several quarterly payments.
The company’s investors can still receive distributions in cash, as is traditional. But Elemental CEO David Cole described the company’s support of Tether’s product as innovative.
“The decision to offer investors a dividend in kind, in the form of Tether Gold, further differentiates Elemental as a forward-thinking, growth-oriented investment,” he said.
Elemental’s stock price fell 7.8% on Tuesday to $19.41, according to Yahoo Finance. The firm makes money by acquiring royalties tied to mining projects. Elemental said its approach avoids risks associated with owning and operating a mine, while maintaining the upside.
Tether’s legacy was built on tokens pegged to the U.S. dollar, but the stablecoin issuer has embraced tokenized gold as the precious metal’s price has surged 66% over the past year. Meanwhile, XAUT’s market capitalization has swelled to $2.5 billion from $714 million.
Earlier this month, the token’s total value peaked at $3.5 billion, according to CoinGecko, as the price of gold rose to new highs.
In January, YouTube rival Rumble said that it had adopted XAUT as a medium of exchange on its platform, allowing users to tip the token to creators alongside Bitcoin and Tether’s flagship stablecoin, USDT. To bolster the token’s use in payments, Tether also introduced the term Scudo, which represents 1/1,000th of a troy ounce of gold and its XAUT token.
Those moves were focused on consumers, but Elemental shows how tokenized gold can be used as a tool in real-world corporate finance, according to Tether CEO Paolo Ardoino.
“This marks a major step forward for the gold industry and shows how tokenized assets can unlock new financial models that were previously out of reach,” he said in a press release, describing previous efforts to integrate the token on Wall Street as difficult.
Earlier this month, Ardoino estimated that the company’s gold holdings stood at 140 tons, nestled within a former nuclear bunker in Switzerland. At the time, that sum was worth an estimated $24 billion. Tether partially backs its $183 billion USDT stablecoin with gold.
At a market capitalization of $2.2 billion, Tether’s XAUT faces competition from PAX Gold. The products debuted within months of each other more than six years ago.
Despite their time in the market, Wintermute is among market makers that have only recently moved to support the token. Last week, the company said that it had begun executing over-the-counter trades in XAUT and PAX Gold on behalf of financial institutions.
The firm that handles billions of dollars in daily trading volume noted that there is robust demand for trading tokenized gold round-the-clock amid de-dollarization pressures. Along those lines, the company forecast that tokenized gold could become a $15 billion market by year-end.
MONTREAL, Feb. 18, 2026 (GLOBE NEWSWIRE) — Aya Gold & Silver Inc. (TSX: AYA; OTCQX: AYASF) (“Aya” or the “Corporation”) is pleased to announce high-grade silver drill results from its at-depth drill exploration program at the Zgounder Silver Mine in the Kingdom of Morocco.
Highlights (all intersections are in core lengths)
Intersections in the Open-Pit Area:
Hole ZG-RC-25-853 intercepted 781 grams per tonne (“g/t”) silver (“Ag”) over 9.0 metres (“m”), including 1,295 g/t Ag over 5.0m
Hole ZG-RC-25-855 intercepted 1,454 g/t Ag over 3.0m
Intersections at Depth Near the Western Fault contact:
Hole ZG-SF-25-340 intercepted 336 g/t Ag over 5.5m
Hole ZG-SF-25-350 intercepted 2,198 g/t Ag over 1.0m
Intersections in the Central Area:
Hole ZG-SF-25-347 intercepted 3,581 g/t Ag over 4.5m, including 5,893 g/t Ag over 2.5m
Hole ZG-SF-25-347 intercepted 1,729 g/t Ag over 4.1m, including 4,480 g/t Ag over 1.5m
Hole T28-26-1072 intercepted 6,223 g/t Ag over 3.6m
Hole T28-26-1104 intercepted 4,489 g/t Ag over 6.0m
3,117m or 10.3% of the 2026 exploration program has been drilled year to date.
“Today’s high-grade results once again confirm the strong continuity of silver mineralization both at depth and around the open-pit area,” said Benoit La Salle, President & CEO. “Moreover, the new intersection at depth near the Western Fault contact in hole ZG-SF-25-340 extends mineralization further west, continuing to push the boundary of our current resource model.”
This release contains results from 256 holes, which include 13 surface diamond drill holes (“DDH”), 69 underground DDH, 41 reverse circulation drill hole (“RC”), 101 T28 and 32 YAK holes (T28 and YAK: percussion drilling using an air-compressed hammer). For a full summary of today’s results, refer to Appendix 1.
Table 1 – Best Intercepts at Zgounder in 2025 (core lengths)
Hole ID
From
To
Ag
Length*
Ag x width
(g/t)
(m)
Underground DDH
ZG-SF-25-339
251.5
253.0
1 733
1.5
2 600
ZG-SF-25-340
254.4
259.9
336
5.5
1 848
ZG-SF-25-341
341.0
345.0
1 075
4.0
4 300
Including
342.0
344.0
1 928
2.0
3 856
ZG-SF-25-342
282.5
286.0
652
3.5
2 282
ZG-SF-25-343
284.5
289.0
3 581
4.5
16 116
Including
284.5
287.0
5 893
2.5
14 732
ZG-SF-25-347
40.4
44.5
1 729
4.1
7 089
Including
43.0
44.5
4 480
1.5
6 720
ZG-SF-25-347
65.0
66.5
1 535
1.5
2 302
ZG-SF-25-347
127.0
128.5
1 228
1.5
1 842
ZG-SF-26-348
63.5
65.0
2 025
1.5
3 038
ZG-SF-26-348
129.0
133.5
1 366
4.5
6 149
ZG-SF-26-350
257.5
258.5
2 198
1.0
2 198
DZG-SF-25-776
43.0
48.5
1 138
5.5
6 260
Including
45.0
47.0
2 766
2.0
5 532
DZG-SF-25-777
53.5
58.0
844
4.5
3 798
Including
53.5
55.5
1 597
2.0
3 194
Surface RC
ZG-RC-25-853
103.0
112.0
781
9.0
7 029
Including
106.0
111.0
1 295
5.0
6 474
ZG-RC-25-854
114.0
116.0
895
2.0
1 789
ZG-RC-25-855
85.0
88.0
1 454
3.0
4 362
Underground T28
T28-25-1047
0.0
12.0
155
12.0
1 865
T28-25-1049
2.4
8.4
476
6.0
2 858
T28-25-1059
22.8
26.4
6 223
3.6
22 404
T28-26-1072
9.6
14.4
961
4.8
4 612
Including
9.6
12.0
1 790
2.4
4 296
T28-26-1075
0.0
4.8
2 934
4.8
14 083
Including
0.0
2.4
5 725
2.4
13 740
T28-26-1103
24.0
26.4
988
2.4
2 371
T28-26-1104
19.2
25.2
4 489
6.0
26 933
T28-26-1119
8.4
13.2
285
4.8
1 368
T28-26-1127
19.2
25.2
273
6.0
1 637
T28-26-1130
7.2
12.0
373
4.8
1 790
Underground YAK
YAK-25-408
3.6
4.8
6 060
1.2
7 272
* True widths are undetermined; all values are uncut.
Location of Drill Results at Zgounder
Figure 1: Location of Drill Results at Zgounder
Quality Assurance
For core drilling, all individual samples represent approximately one meter in length of core, which is halved. Half of the core is kept on site for reference, and its counterpart is sent for preparation and assaying to African Laboratory for Mining and Environment (“Afrilab”) in Marrakech, Morocco or to ALS Laboratory at the Zgounder Mine site. All samples are analyzed for silver, copper, iron, lead, and zinc using Aqua regia and finished by atomic absorption spectroscopy (“AAS”). Samples grading above 200 g/t Ag are reanalyzed by fire assay.
For definition drilling using RC, all individual samples represent 1.0m in length and for T28 drilling equipment, all individual samples represent 1.2m in length. Samples are assayed at either the ALS Mine laboratory or at Afrilab. All samples are analyzed for silver, copper, iron, lead, and zinc using Aqua regia and finished by AAS. Samples grading above 200 g/t Ag are reanalyzed by fire assay. Rigorous quality controls (QaQc) are applied at both locations.
David Lalonde, B.Sc. P. Geo, Vice-President Exploration, is Aya Gold & Silver’s Qualified Person and has reviewed this press release for accuracy and compliance with National Instrument 43-101.
About Aya Gold & Silver Inc.
Aya Gold & Silver is a Canadian precious metals mining company anchored in Morocco and active across the full mining value chain. The Corporation has established an exploration track record through a systematic, technology-led, data-driven approach and is focused on expanding its resource base and land package along the Anti-Atlas Fault — one of Africa’s most geologically rich, underexplored and mining-friendly regions.
Aya operates Zgounder, a rare, silver-only mine, producing silver doré from its newly expanded processing facility. Aya’s growth pipeline includes the Boumadine polymetallic project, where feasibility study work is underway. The project hosts a substantial mineral resource, an extensive mineralized footprint, and significant potential for further discovery.
Led by a proven team of mining professionals, Aya is guided by a vision of responsible mining and is committed to delivering sustainable value for shareholders, employees and host communities.
This press release contains certain statements that constitute forward-looking information within the meaning of applicable securities laws (“forward-looking statements”), which reflects management’s expectations regarding Aya’s future growth and business prospects (including the timing and development of new deposits and the success of exploration activities) and other opportunities. Wherever possible, words such as “aim”, “anticipate”, “assume”, “believe”, “estimate”, “expect”, “goal”, “intend”, “objective”, “plan”, “potential”, “strategy”, “target”, and similar expressions or statements that certain actions, events or results “may”, “could”, “would”, “might”, “will”, or are “likely” to be taken, occur or be achieved, have been used to identify such forward-looking information. Specific forward-looking statements in this press release include, but are not limited to, statements and information with respect to the potential to confirm continuity of mineralization and extent mineralization to the west and other assumptions and factors generally associated with the mining industry.
Forward-looking information is based upon certain assumptions and other important factors that, if untrue, could cause the actual results, performance or achievements of the Corporation to be materially different from future results, performance or achievements expressed or implied by such information or statements. There can be no assurance that such information or statements will prove to be accurate. Key assumptions upon which the Corporation’s forward-looking information is based include without limitation, the Corporation’s ability to timely receive any requisite approvals, permits or licences; the Corporation’s ability to import goods and machinery; the Corporation’s ability to engage and retain all necessary personnel in order to operate its business properly and without interruption; the accuracy and reliability of estimates, projections, forecasts, studies and assessments, including the Mineral Reserve and Mineral Resource Estimates (including, but not limited to, ore tonnage and ore grade estimates); the Corporation’s ability to meet or achieve estimates, projections and forecasts; assumptions regarding development and exploration activities; the timing, extent, duration and economic viability of such explorations activities; the price of silver; the price of gold; exchange rates; taxation levels; fuel and energy costs; future economic conditions; the Corporation’s ability to meet current and future obligations; the Corporation’s ability to obtain timely financing on reasonable terms when required; anticipated future estimates of free cash flow; estimate future production; the current and future social, economic and political conditions and environment in which the Corporation operates; and other assumptions and factors generally associated with the mining industry.
Readers are cautioned that the foregoing list is not exhaustive of all factors and assumptions which may have been used. Forward-looking statements are also subject to risks and uncertainties facing the Corporation’s business, any of which could have a material adverse effect on the Corporation’s business, financial condition, results of operations and growth prospects. Some of the risks the Corporation faces and the uncertainties that could cause actual results to differ materially from those expressed in the forward-looking statements include, among others: the inherent risks involved in exploration and development of mineral properties, including (1) there being no significant disruptions affecting the operations of the Corporation whether due to artisanal miners, access to water, extreme weather events and other or related natural disasters, labour disruptions, supply disruptions, power disruptions, damage to equipment or otherwise; (2) permitting, development, operations and production from the Project being consistent with the Corporation’s expectations; (3) political and legal developments in the Kingdom of Morocco being consistent with its current expectations; (4) the exchange rate between the U.S. dollar and the Moroccan Dirham being approximately consistent with current levels; (5) certain price assumptions for gold and silver; (6) prices for diesel, process reagents, fuel oil, electricity and other key supplies being approximately consistent with current levels; (7) production and cost of sales forecasts meeting expectations; (8) the accuracy of the current mineral resource estimates of the Corporation; (9) labour and materials costs increasing on a basis consistent with the Corporation’s current expectations; and (10) asset impairment (or reversal) potential, being consistent with the Corporation’s current expectations.
In addition, readers are directed to carefully review the detailed risk discussion in the Corporation’s Annual Information Form and Management’s Discussion & Analysis for the year ended December 31, 2024, filed on SEDAR+, which discussions are incorporated by reference in this presentation, for a fuller understanding of the risks and uncertainties that affect the Corporation’s business and operations.
Although the Corporation believes its expectations are based upon reasonable assumptions and has attempted to identify important factors that could cause actual actions, events or results to differ materially from those described in forward-looking statements, there may be other factors that cause actions, events or results not to be as anticipated, estimated or intended. There can be no assurance that forward-looking information will prove to be accurate, as actual results and future events could differ materially from those anticipated in such information. As such, these risks are not exhaustive; however, they should be considered carefully. If any of these risks or uncertainties materialize, actual results may vary materially from those anticipated in the forward-looking statements found herein. Due to the risks, uncertainties, and assumptions inherent in forward-looking statements, readers should not place undue reliance on forward-looking statements.
Forward-looking statements contained herein are presented for the purpose of assisting investors in understanding the Corporation’s business plans, financial performance and condition and may not be appropriate for other purposes.
The forward-looking statements contained herein are made only as of the date hereof. The Corporation disclaims any intention or obligation to update or revise any forward-looking statements, whether as a result of new information, future events or otherwise, except to the extent required by applicable law. The Corporation qualifies all of its forward-looking statements by these cautionary statements.
Nothing in this document should be construed as either an offer to sell or a solicitation to buy or sell Aya securities. All references to Aya include its subsidiaries unless the context requires otherwise.
Appendix 1 – Mineral Intercepts from Drilling at Zgounder (core lengths)
Hole ID
From
To
Ag (g/t)
Length (m)*
Ag x width
Surface DDH
ZG-25-167
520.2
521.2
212
1.0
212
ZG-25-170
212.0
212.5
92
0.5
46
ZG-25-170
216.0
216.5
128
0.5
64
ZG-25-170
220.5
221.0
84
0.5
42
ZG-25-172
181.0
182.5
177
1.5
266
ZG-25-172
202.0
203.0
76
1.0
76
ZG-25-173
23.5
29.5
101
6.0
606
ZG-25-173
34.0
35.5
320
1.5
480
ZG-25-178
229.5
230.2
86
0.7
60
ZG-26-180
209.5
211.0
240
1.5
359
Underground DDH
ZG-SF-25-339
251.5
253.0
1 733
1.5
2 600
ZG-SF-25-339
261.0
264.0
164
3.0
492
ZG-SF-25-340
254.4
259.9
336
5.5
1 848
ZG-SF-25-340
262.9
264.9
264
2.0
528
ZG-SF-25-341
286.0
287.0
372
1.0
372
ZG-SF-25-341
341.0
345.0
1 075
4.0
4 300
Including
342.0
344.0
1 928
2.0
3 856
ZG-SF-25-342
260.0
262.0
133
2.0
267
ZG-SF-25-342
282.5
286.0
652
3.5
2 282
ZG-SF-25-342
360.5
362.0
76
1.5
114
ZG-SF-25-342
366.0
370.0
77
4.0
308
ZG-SF-25-342
381.0
382.5
92
1.5
138
ZG-SF-25-342
391.0
392.5
156
1.5
234
ZG-SF-25-343
284.5
289.0
3 581
4.5
16 116
Including
284.5
287.0
5 893
2.5
14 732
ZG-SF-25-344
302.5
303.4
916
0.9
824
ZG-SF-25-344
313.5
315.0
216
1.5
324
ZG-SF-25-344
318.0
319.5
104
1.5
156
ZG-SF-25-346
276.5
279.5
384
3.0
1 152
ZG-SF-25-347
40.4
44.5
1 729
4.1
7 089
Including
43.0
44.5
4 480
1.5
6 720
ZG-SF-25-347
65.0
66.5
1 535
1.5
2 302
ZG-SF-25-347
119.5
121.0
152
1.5
228
ZG-SF-25-347
127.0
128.5
1 228
1.5
1 842
ZG-SF-26-348
63.5
65.0
2 025
1.5
3 038
ZG-SF-26-348
129.0
133.5
1 366
4.5
6 149
ZG-SF-26-349
143.0
144.0
89
1.0
89
ZG-SF-26-349
157.0
158.0
76
1.0
76
ZG-SF-26-349
186.0
188.5
215
2.5
538
ZG-SF-26-350
257.5
258.5
2 198
1.0
2 198
ZG-SF-26-350
308.2
309.2
88
1.0
88
DZG-SF-25-747
85.0
85.6
272
0.6
163
DZG-SF-25-772
12.5
14.0
240
1.5
360
DZG-SF-25-772
51.5
52.0
2 000
0.5
1 000
DZG-SF-25-776
43.0
48.5
1 138
5.5
6 260
Including
45.0
47.0
2 766
2.0
5 532
DZG-SF-25-777
48.0
50.0
163
2.0
326
DZG-SF-25-777
53.5
58.0
844
4.5
3 798
Including
53.5
55.5
1 597
2.0
3 194
DZG-SF-25-778
7.5
11.3
310
3.8
1 178
DZG-SF-25-780
48.0
49.0
175
1.0
175
DZG-SF-25-780
59.0
60.5
82
1.5
123
DZG-SF-25-828
3.7
5.7
92
2.0
184
DZG-SF-25-840
32.0
35.5
143
3.5
499
DZG-SF-25-844
12.0
13.5
76
1.5
114
DZG-SF-26-832
18.9
20.5
146
1.6
234
DZG-SF-26-833
13.0
15.0
112
2.0
224
DZG-SF-26-858
102.0
103.5
155
1.5
232
DZG-SF-26-858
134.5
136.0
96
1.5
144
Surface RC
ZG-RC-25-849
104.0
105.0
503
1.0
503
ZG-RC-25-850
113.0
114.0
87
1.0
87
ZG-RC-25-852
98.0
99.0
95
1.0
95
ZG-RC-25-853
92.0
95.0
332
3.0
995
ZG-RC-25-853
101.0
102.0
124
1.0
124
ZG-RC-25-853
103.0
112.0
781
9.0
7 029
Including
106.0
111.0
1 295
5.0
6 474
ZG-RC-25-853
134.0
135.0
83
1.0
83
ZG-RC-25-853
137.0
138.0
93
1.0
93
ZG-RC-25-854
9.0
10.0
110
1.0
110
ZG-RC-25-854
17.0
18.0
119
1.0
119
ZG-RC-25-854
114.0
116.0
895
2.0
1 789
ZG-RC-25-855
10.0
11.0
167
1.0
167
ZG-RC-25-855
77.0
78.0
86
1.0
86
ZG-RC-25-855
85.0
88.0
1 454
3.0
4 362
ZG-RC-25-855
97.0
100.0
139
3.0
416
ZG-RC-25-855
102.0
103.0
86
1.0
86
ZG-RC-25-857
49.0
51.0
184
2.0
367
ZG-RC-25-857
77.0
78.0
89
1.0
89
ZG-RC-25-857
91.0
92.0
159
1.0
159
ZG-RC-26-753
54.0
55.0
79
1.0
79
ZG-RC-26-806
10.0
11.0
85
1.0
85
ZG-RC-26-841
42.0
43.0
180
1.0
180
ZG-RC-26-841
70.0
71.0
192
1.0
192
ZG-RC-26-841
92.0
93.0
102
1.0
102
ZG-RC-26-920
57.0
58.0
80
1.0
80
Underground T28
T28-25-965
9.6
10.8
556
1.2
667
T28-25-970
9.6
12.0
99
2.4
238
T28-25-970
18.0
19.2
119
1.2
143
T28-25-971
3.6
6.0
390
2.4
935
T28-25-973
6.0
9.6
146
3.6
526
T28-25-977
3.6
6.0
114
2.4
272
T28-25-985
16.8
18.0
201
1.2
241
T28-25-987
22.8
26.4
132
3.6
474
T28-25-991
24.0
26.4
142
2.4
341
T28-25-998
2.4
3.6
93
1.2
112
T28-25-1000
16.8
18.0
188
1.2
226
T28-25-1001
2.4
3.6
94
1.2
113
T28-25-1040
9.6
12.0
192
2.4
461
T28-25-1046
10.8
12.0
82
1.2
98
T28-25-1047
0.0
12.0
155
12.0
1 865
T28-25-1047
14.4
15.6
113
1.2
136
T28-25-1048
0.0
2.4
118
2.4
283
T28-25-1048
7.2
8.4
91
1.2
109
T28-25-1048
9.6
10.8
101
1.2
121
T28-25-1049
2.4
8.4
476
6.0
2 858
T28-25-1049
18.0
19.2
76
1.2
91
T28-25-1050
20.4
22.8
211
2.4
505
T28-25-1055
14.4
15.6
113
1.2
136
T28-25-1057
10.8
12.0
216
1.2
259
T28-25-1057
14.4
18.0
180
3.6
647
T28-25-1059
22.8
26.4
6 223
3.6
22 404
T28-25-1062
24.0
25.2
91
1.2
109
T28-26-1066
3.6
4.8
203
1.2
244
T28-26-1070
7.2
8.4
94
1.2
113
T28-26-1072
9.6
14.4
961
4.8
4 612
Including
9.6
12.0
1 790
2.4
4 296
T28-26-1074
0.0
2.4
108
2.4
259
T28-26-1075
0.0
4.8
2 934
4.8
14 083
Including
0.0
2.4
5 725
2.4
13 740
T28-26-1101
2.4
6.0
105
3.6
379
T28-26-1103
24.0
26.4
988
2.4
2371
T28-26-1104
19.2
25.2
4 489
6.0
26 933
T28-26-1119
8.4
13.2
285
4.8
1 368
T28-26-1127
19.2
25.2
273
6.0
1 637
T28-26-1128
15.6
19.2
128
3.6
461
T28-26-1130
7.2
12.0
373
4.8
1 790
T28-26-1131
10.8
15.6
100
4.8
480
Underground YAK
YAK-25-408
3.6
4.8
6 060
1.2
7 272
YAK-25-408
27.6
28.8
146
1.2
175
YAK-25-414
20.4
21.6
448
1.2
538
YAK-25-414
36.0
37.2
488
1.2
586
YAK-25-415
10.8
12.0
137
1.2
164
YAK-25-415
15.6
18.0
262
2.4
629
YAK-25-415
27.6
28.8
177
1.2
212
YAK-25-416
24.0
25.2
162
1.2
194
YAK-25-417
4.8
7.2
94
2.4
226
YAK-25-418
3.6
4.8
78
1.2
94
YAK-25-419
2.4
3.6
159
1.2
191
YAK-25-420
4.8
6.0
99
1.2
119
YAK-25-436
45.6
46.8
108
1.2
130
YAK-26-426
27.6
28.8
247
1.2
296
YAK-26-433
20.4
21.6
152
1.2
182
YAK-26-440
24.0
25.2
656
1.2
787
* True widths are undetermined; all values are uncut.
Appendix 2 – Drillhole Coordinates of Zgounder Drill Hole with Significant Results
VANCOUVER, British Columbia, Feb. 18, 2026 (GLOBE NEWSWIRE) — Apollo Silver Corp. (“Apollo Silver” or the “Company”) (TSX.V:APGO; OTCQB:APGOF; Frankfurt:6ZF) is pleased to announce that it has been recognized as a 2026 Top 50 Company by the TSX Venture Exchange (“TSXV”).
The TSX Venture 50™ is an annual ranking of the top performing companies from the past year on TSXV based on three equally weighted criteria: market capitalization growth, share price appreciation and trading value. The TSX Venture 50™ showcases the top 50 of the over 1,600 TSXV issuers.
“We are honoured to be recognized as a member of the 2026 TSX Venture 50™,” said Ross McElroy, President and CEO of Apollo Silver. “This recognition reflects the strong performance of our shares over the past year, including 383% share price appreciation, a 484% growth in market capitalization and a 460% increase in total trading value in Canada. We thank our shareholders for their ongoing support.”
Over the past year, Apollo Silver has advanced exploration and technical programs at its flagship Calico Project in California and continued community engagement efforts and social-licence initiatives at its Cinco de Mayo Project in Mexico. With silver increasingly recognized as a critical mineral and growing industrial demand supporting a constructive market environment, Apollo Silver remains focused on disciplined execution and long-term value creation for shareholders.
ABOUT APOLLO SILVER CORP.
Apollo Silver is advancing the second largest undeveloped primary silver project in the US. The Calico Project hosts a large, bulk minable silver deposit with significant barite and zinc credits – recognized as critical minerals essential to the U.S. energy, industrial and medical sectors. The Company also holds an option on the Cinco de Mayo Project in Chihuahua, Mexico, which is host to a major carbonate replacement (CRD) deposit that is both high-grade and large tonnage. Led by an experienced and award-winning management team, Apollo is well positioned to advance the assets and deliver value through exploration and development.
Neither the TSX Venture Exchange nor its Regulation Services Provider (as that term is defined in the policies of the TSX Venture Exchange) accepts responsibility for the adequacy or accuracy of this release.
Cautionary Statement Regarding “Forward-Looking” Information
This news release includes “forward-looking statements” and “forward-looking information” within the meaning of Canadian securities legislation. All statements included in this news release, other than statements of historical fact, are forward-looking statements including, without limitation, statements with respect to the continued advancement and development potential of the Company’s projects, including the Calico Project and the Cinco de Mayo Project and the Company’s future plans, objectives and expectations. Forward-looking statements include predictions, projections and forecasts and are often, but not always, identified by the use of words such as “anticipate”, “believe”, “plan”, “estimate”, “expect”, “potential”, “target”, “budget” and “intend” and statements that an event or result “may”, “will”, “should”, “could” or “might” occur or be achieved and other similar expressions and includes the negatives thereof.
Forward-looking statements are based on the reasonable assumptions, estimates, analysis, and opinions of the management of the Company made in light of its experience and its perception of trends, current conditions and expected developments, as well as other factors that management of the Company believes to be relevant and reasonable in the circumstances at the date that such statements are made. Forward-looking information is based on reasonable assumptions that have been made by the Company as at the date of such information and is subject to known and unknown risks, uncertainties and other factors that may have caused actual results, level of activity, performance or achievements of the Company to be materially different from those expressed or implied by such forward-looking information, including but not limited to: risks associated with mineral exploration and development; metal and mineral prices; availability of capital; accuracy of the Company’s projections and estimates; realization of mineral resource estimates, interest and exchange rates; competition; stock price fluctuations; availability of drilling equipment and access; actual results of current exploration activities; government regulation; political or economic developments; environmental risks; insurance risks; capital expenditures; operating or technical difficulties in connection with development activities; personnel relations; and changes in project parameters as plans continue to be refined. Forward-looking statements are based on assumptions management believes to be reasonable, including but not limited to the price of silver, gold and barite; the demand for silver, gold and barite; the ability to carry on exploration and development activities; the timely receipt of any required approvals; the ability to obtain qualified personnel, equipment and services in a timely and cost-efficient manner; the ability to operate in a safe, efficient and effective matter; and the regulatory framework regarding environmental matters, and such other assumptions and factors as set out herein. Although the Company has attempted to identify important factors that could cause actual results to differ materially from those contained in forward-looking information, there may be other factors that cause results not to be as anticipated, estimated or intended. There can be no assurance that forward-looking statements will prove to be accurate and actual results, and future events could differ materially from those anticipated in such statements. Accordingly, readers should not place undue reliance on forward looking information contained herein, except in accordance with applicable securities laws. The forward-looking information contained herein is presented for the purpose of assisting investors in understanding the Company’s expected financial and operational performance and the Company’s plans and objectives and may not be appropriate for other purposes. The Company does not undertake to update any forward-looking information, except in accordance with applicable securities laws.
February 17, 2026 – Denver, Colorado: Elemental Royalty Corporation (“Elemental” or “the Company”) (TSX-V: ELE, NASDAQ: ELE) is pleased to announce that its Board of Directors has approved an inaugural dividend policy (the “Dividend Policy”). In accordance with the Policy, Elemental expects to declare an annual cash dividend to its shareholders of US$0.12 per Elemental common share, to be paid in quarterly instalments of US$0.03 per share, with the record date for the inaugural dividend to be paid at the end of the first calendar quarter of 2026, and at the end of each calendar quarter following for subsequent dividends.
The Company is also pleased to announce that it anticipates that qualifying registered shareholders will be able to elect to receive their dividend in the form of Tether Gold XAU₮ tokens, of par value to the dividend price, thereby providing Elemental shareholders with direct ownership of physical gold through their investment in gold royalties.
Highlights
Maiden Dividend Policy approved by the Board of Directors
Expected annual cash dividend of US$0.12 per Elemental share, paid quarterly
Anticipated that qualifying registered shareholders will be able to elect that their cash dividends be invested in Tether Gold’s XAU₮ token
The Dividend to shareholders is supported by Elemental’s strong projected revenue and cash flow growth profile in 2026 and beyond
Further information on how shareholders may elect to receive the dividend or dividend in kind, will be provided in due course
David M. Cole, Chief Executive Officer of Elemental Royalty, commented: “The approval of this dividend policy marks an important milestone in Elemental’s strategic trajectory and reflects our confidence in the strength and momentum of the business; we believe this is the right time to introduce a sustainable, long-term, dividend. The decision to offer investors a dividend in kind, in the form of Tether Gold, further differentiates Elemental as a forward-thinking, growth-oriented investment.”
Stefan Wenger, Chief Financial Officer of Elemental Royalty Corporation, commented: “Our inaugural dividend is underpinned by Elemental’s strong balance sheet and future revenue outlook in the near and longer-term: as of December 31, 2025, we had approximately US$53 million of cash and no debt, providing substantial financial flexibility as we continue to invest in growth. We will continue to maintain a disciplined approach to capital allocation, balancing returning capital to shareholders through a progressive dividend which we intend to maintain, or even increase, without compromising on our strategy of accretive growth through the acquisition and generation of precious metals streams and royalties.”
Juan Sartori, Executive Chairman of Elemental Royalty Corporation, commented: “We believe the initiation of this dividend policy is a world first for a royalty company: we anticipate enabling qualifying shareholders to elect to have their cash dividend invested in the purchase of the Tether XAU₮ token, thereby facilitating for shareholders greater exposure to physical gold through Tether Gold’s stablecoin and retaining real long-term value storage via a practical mechanism for gold-denominated investment returns.”
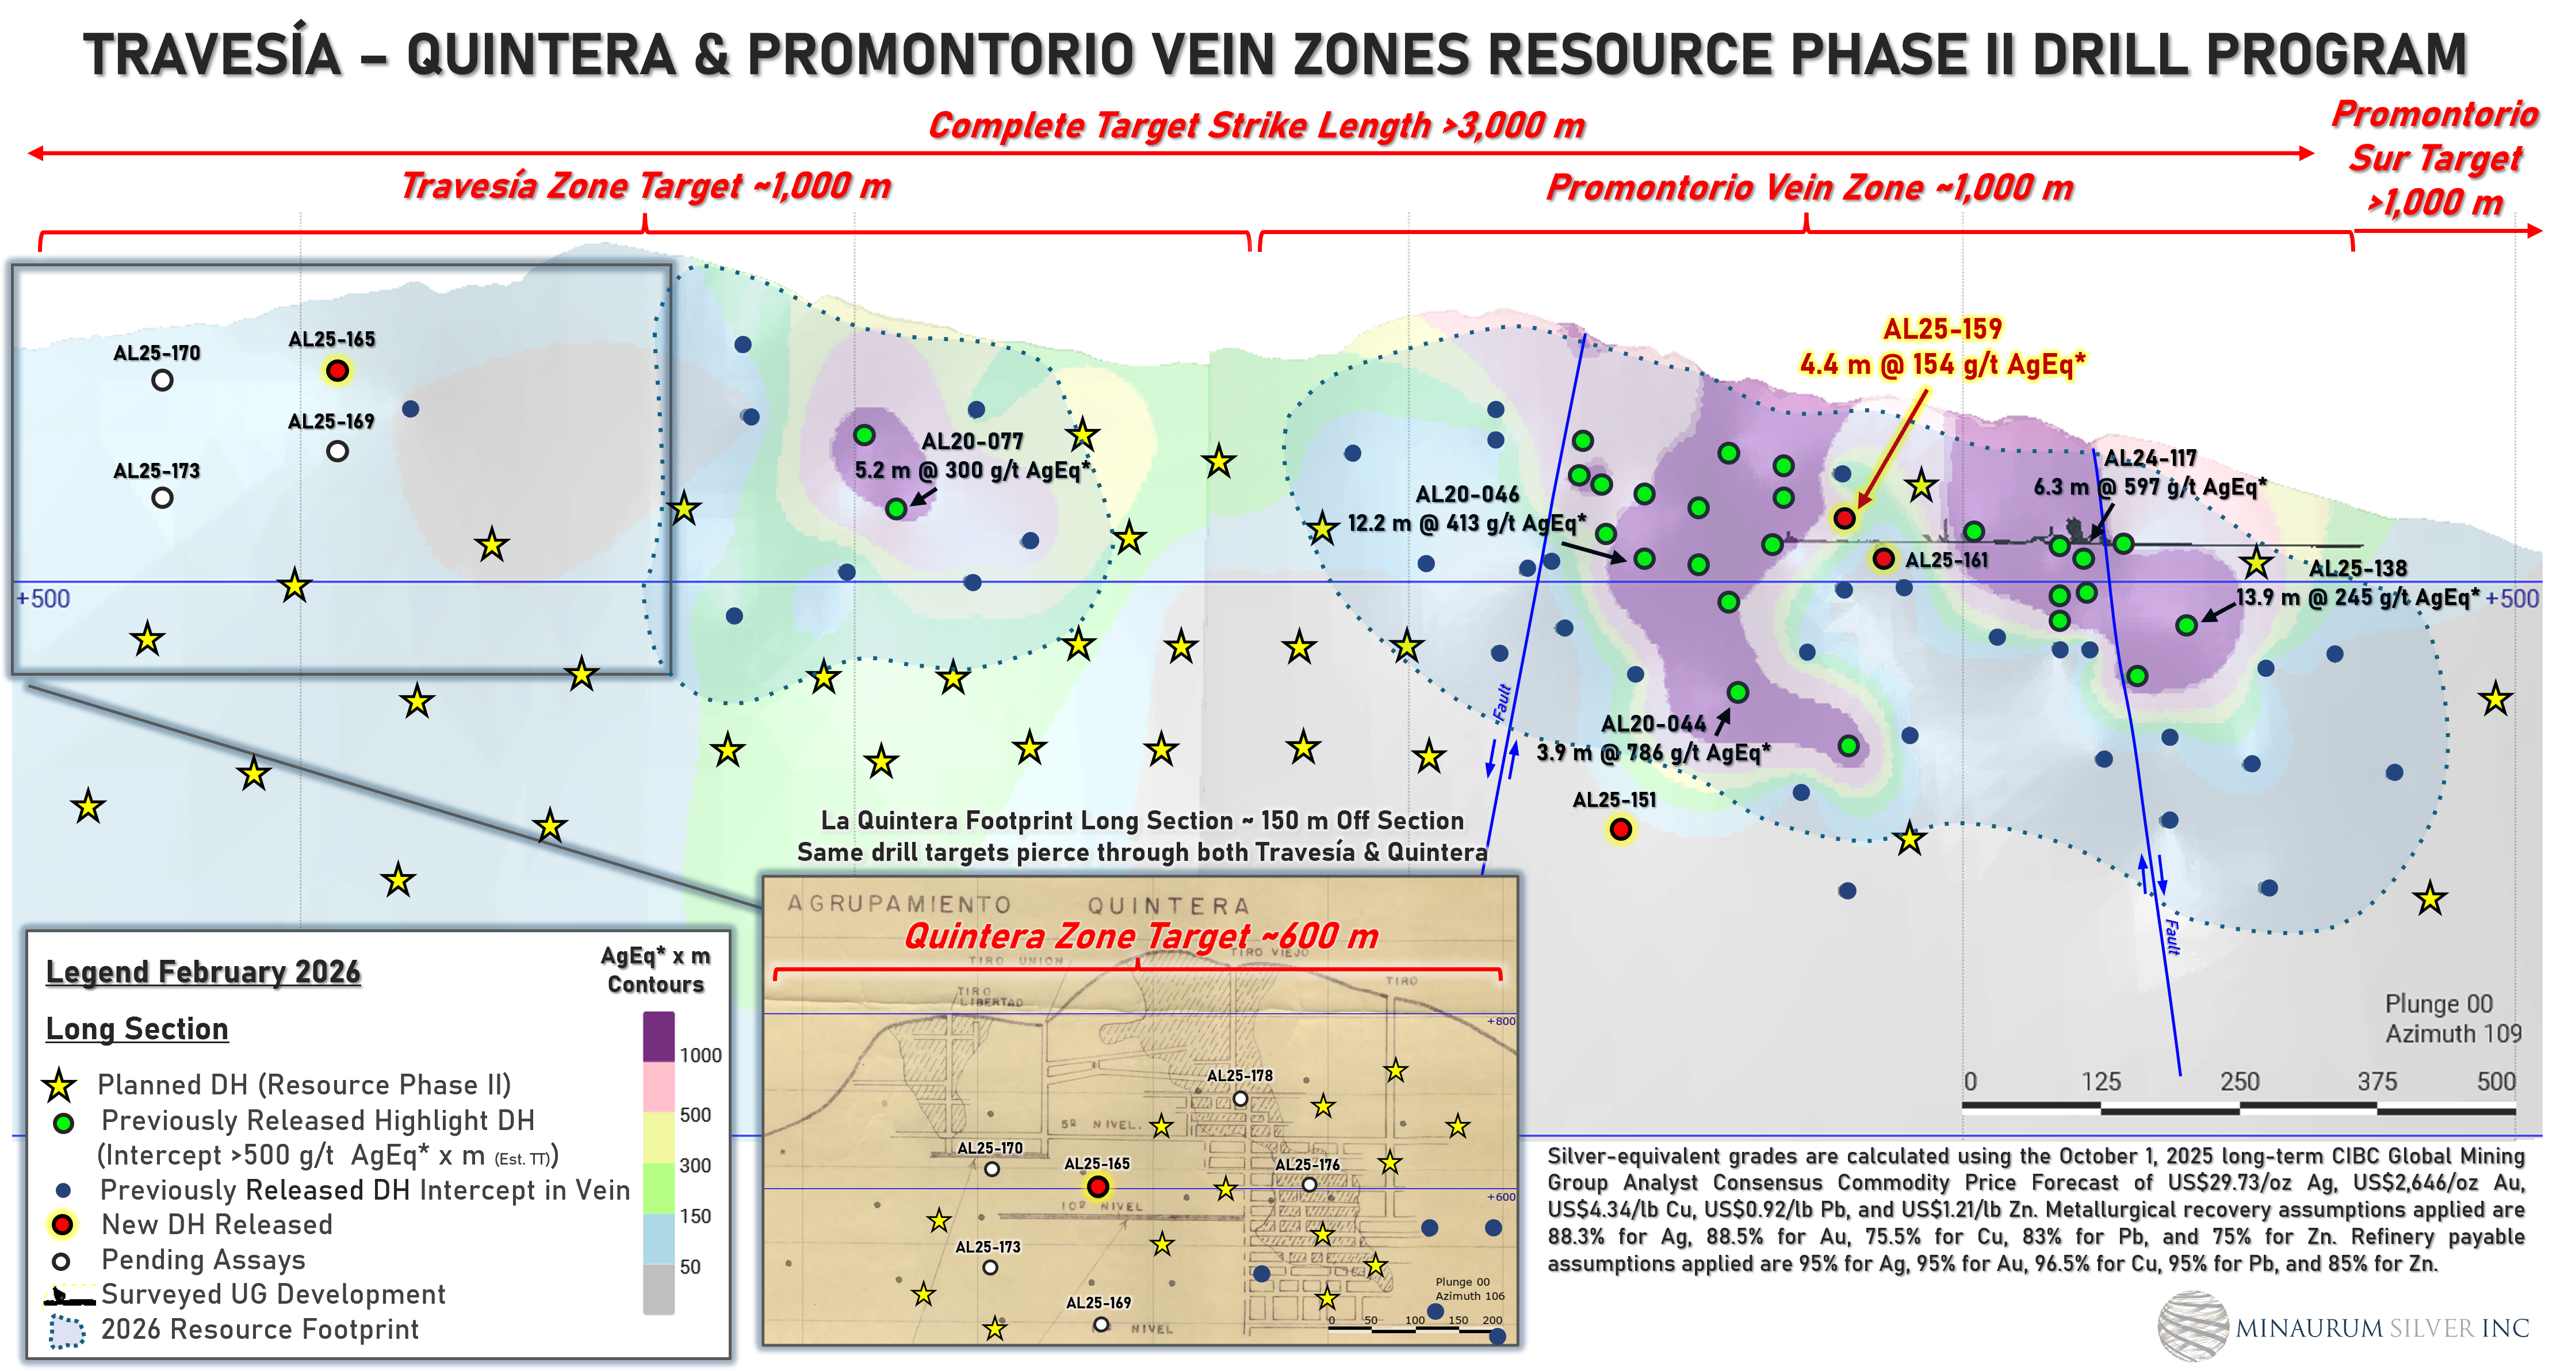
Vancouver, British Columbia–(Newsfile Corp. – February 10, 2026) – Minaurum Silver Inc. (TSXV: MGG) (OTCQX: MMRGF)(“Minaurum”) is pleased to report results from the first holes of its Phase 2, 50,000-meter resource-expansion drill program at the Alamos Silver Project (“Alamos”) in Sonora, Mexico. The program is targeting the Europa, Promontorio, and Travesia vein zones and has returned multiple high-grade silver intersections (Table 1, Figures 1-4).
Highlights include:
12.35 m of 408 g/t silver equivalent (“AgEq”), including 3.20 m of 1,277 g/t AgEq (Hole AL25-163)
2.35 m of 374 g/t AgEq (Hole AL25-153)
“Hole AL25-163 confirms the continuity of high-grade silver mineralization well beyond the current inferred resource in the Europa Vein Zone,” said Darrell Rader, President and CEO of Minaurum Silver. “Stepping out 250 metres and intersecting strong grades and widths demonstrates the scale of the system. With the mineralization remaining open both down dip and along strike, these results support our strategy to significantly expand the Alamos resource with continued drilling.”
Europa Vein Zone
The defined resource of the Europa vein zone occupies about 1 km of its surface-traced 3-km strike length. Recent assay results extend high-grade mineralization along strike, particularly the 1 km extension to the south at Europa. Hole AL25-163 intersected a significant wide interval of 12.35 m zone averaging 408 g/t AgEq, including 3.20 m of 1,277 g/t AgEq (1,032 g/t Ag, 0.278 g/t Au, 0.692% Cu, 5.477% Pb, 2.379% Zn). Hole AL25-154 returned 1.05 m of 231 g/t AgEq, including 0.25 m of 700 g/t AgEq (355 g/t Ag, 1.86 g/t Au, 1.45% Cu, 0.77% Pb, 1.89% Zn) (See Table 1, Figures 2 and 3).
Figure 1. Plan view showing locations of Travesia, Quintera, Promontorio, and Europa vein zones. Click to enlarge.
Figure 3. Cross section of Europa and Nueva Europa vein zones, showing hole AL25-163. EV=volcanic rocks, CZ=marble and skarn, GR=granodiorite. Click to enlarge.
Table 1. Assay Highlights for Europa Vein Zone – Europe Sur, Europa and Europa Norte. Hole locations are shown in Figure 2 and 3.
Weight-averaged silver-equivalent grades are based on 1) October 1, 2025 Long-term CIBC Global Mining Group Analyst Consensus Commodity Price Forecast: Ag $29.73/tr oz, Au $2,646/tr oz, Cu $4.34/lb, Pb $0.92/lb, Zn $1.21/lb; 2) Metallurgical recovery assumptions:88.3% for Ag, 88.5% for Au, 75.5% for Cu, 83% for Pb, and 75% for Zn; and 3) Refinery payable assumptions: 95% for Ag, 95% for Au, 96.5% for Cu, 95% for Pb, and 85% for Zn.
EUROPA SUR
Hole
From (m)
To (m)
Interval (m)
Ag g/t
Au g/t
Cu %
Pb %
Zn %
AgEq g/t
AL25-154
99.50
100.65
1.15
95
0.01
0.19
0.32
1.11
143
131.55
131.75
0.20
349
0.05
0.31
0.48
1.58
425
220.20
221.25
1.05
132
0.45
0.44
0.25
0.69
231
including
220.20
220.45
0.25
355
1.86
1.45
0.67
1.89
700
263.70
265.20
1.50
4
0.87
0.01
0.02
0.20
89
AL25-155
174.25
175.35
1.10
57
0.09
0.12
0.74
1.59
125
AL25-156
440.30
441.00
0.70
35
0.00
0.09
0.40
1.13
75
AL25-157
245.10
248.45
3.35
43
0.02
0.11
0.30
0.90
80
including
247.15
248.10
0.95
107
0.07
0.16
0.89
2.22
193
AL25-158
45.75
47.30
1.55
41
0.00
0.02
0.12
0.11
49
AL25-163
280.20
292.55
12.35
318
0.09
0.35
1.60
0.90
408
including
280.20
287.20
7.00
523
0.14
0.44
2.78
1.36
659
which includes
280.20
283.40
3.20
1032
0.27
0.69
5.47
2.37
1277
and
285.80
287.20
1.40
149
0.05
0.38
0.90
0.68
220
and
289.80
292.55
2.75
85
0.02
0.39
0.05
0.42
132
AL25-164
121.45
123.00
1.55
41.2
0.00
0.02
0.08
0.03
46
AL25-166
255.35
255.70
0.35
46.4
0.00
0.23
0.47
1.19
102
280.30
281.35
1.05
110
0.05
0.85
0.14
0.36
199
including
281.00
281.35
0.35
155
0.12
2.41
0.31
0.92
402
AL25-167
289.40
289.75
0.35
64
0.02
0.18
0.10
0.75
101
298.35
298.85
0.50
236
0.05
0.27
0.78
1.77
318
EUROPA
Hole
From (m)
To (m)
Interval (m)
Ag g/t
Au g/t
Cu %
Pb %
Zn %
AgEq g/t
AL25-150
368
370.25
2.25
107
0.02
0.20
1.61
1.55
193
including
368.5
369.05
0.55
272
0.03
0.26
4.72
1.84
432
AL25-152
161.5
166.1
4.6
77
0.07
0.32
0.39
1.15
144
including
164.5
165.45
0.95
90
0.11
0.63
0.49
1.74
202
AL25-153
129.05
131.4
2.35
240
0.06
0.70
1.76
1.46
374
including
130.85
131.4
0.55
487
0.16
0.95
4.25
2.09
714
AL25-164
121.45
123.00
1.55
41.2
0.00
0.02
0.08
0.03
46
EUROPA NORTE
HoleID
From (m)
To (m)
Interval (m)
Ag g/t
Au g/t
Cu %
Pb %
Zn %
AgEq g/t
AL25-162
450.00
450.40
0.40
48
0.01
0.17
0.47
0.68
88
Promontorio Vein Zone
The 1 km-long Promontorio vein zone consists of multiple veins including the Veta Grande and Veta Las Guijas veins. Drilling to date at Promontorio and Promontorio Sur has intersected mineralization in epithermal vein-hosted cutting volcanic and intrusive rocks in addition to skarn/carbonate-replacement (CRD) mineralization hosted by limestone in the footwall of the vein zones. Hole AL25-159 continued mineralization and intersected 4.40 m of 154 g/t AgEq including 1.35 m of 189 g/t AgEq in an epithermal vein (Table 2, Figure 4).
Travesia – La Quintera Vein Zones
The Travesia vein zone lies to the north of the Promontorio zone and continues north in the hanging wall of the La Quintera vein zone. Hole AL25-165 aimed at the Travesia and La Quintera vein zones in the northern part of the Travesia-Quintera zone, and intersected narrow but encouraging mineralization of 0.95 m of 148 g/t AgEq, including 0.40 m of 221 g/t AgEq in the extension of the Travesia vein.
Figure 4. Longitudinal section of Travesia-Promontorio vein zones, showing locations of highlighted mineralized intersections. Click to enlarge.
Table 2. Assay Highlights for Travesia-Promontorio Vein Zone. Hole locations are shown in Figure 4.
Weight-averaged silver-equivalent grades are based on October 1, 2025 Long-term CIBC Global Mining Group Analyst Consensus Commodity Price Forecast: Ag $29.73/tr oz, Au $2,646/tr oz, Cu $4.34/lb, Pb $0.92/lb, Zn $1.21/lb. Metallurgical recovery assumptions applied are 88.3% for Ag, 88.5% for Au, 75.5% for Cu, 83% for Pb, and 75% for Zn. Refinery payable assumptions applied are 95% for Ag, 95% for Au, 96.5% for Cu, 95% for Pb, and 85% for Zn.
PROMONTORIO
Hole
From (m)
To (m)
Interval (m)
Ag g/t
Au g/t
Cu %
Pb %
Zn %
AgEq g/t
AL25-151
390.85
391.35
0.5
32
0.00
0.03
0.23
0.02
40
AL25-159
102.35
106.75
4.40
28
0.04
0.32
1.03
3.43
154
including
104.60
105.95
1.35
35
0.03
0.37
1.01
4.62
189
AL25-161
182.30
182.80
0.50
96.3
0.16
0.18
0.22
0.63
145
AL25-162
450.00
450.40
0.40
48
0.01
0.17
0.47
0.68
88
TRAVESIA
Hole
From (m)
To (m)
Interval (m)
Ag g/t
Au g/t
Cu %
Pb %
Zn %
AgEq g/t
AL25-165
72.80
73.75
0.95
105
0.00
0.37
0.23
0.24
148
Share Issuance Update
The Company wishes to clarify its news release filed on December 11, 2025 and material change report filed on December 18, 2025. The aggregate number of units issued pursuant to the Company’s brokered private placement which closed on December 11, 2025 was understated by one unit and the Company now wishes to correct this disclosure to reference a total of 69,444,443 units (previously disclosed as 69,444,442 units). In addition, insider participation was understated by one unit and should be corrected to a total of 191,223 units (previously disclosed as 191,222 units). Please refer to the Company’s December 11, 2025 news release for additional details relating to the private placement.
Minaurum Silver Inc. (TSXV: MGG) (OTCQX: MMRGF) (FSE: 78M) is focused on advancing and expanding its high-grade, 100% owned, production-permitted Alamos Silver Project in southern Sonora, Mexico. The Alamos Project hosts a National Instrument 43-101-compliant inferred mineral resource of 55 million ounces of silver equivalent, grading 320 g/t AgEq. Led by a team of proven silver-mine builders with a track record of advancing projects from discovery through development, Minaurum has assembled a strong pipeline of exploration and development assets across Mexico and the United States.
ON BEHALF OF THE BOARD
“Darrell A. Rader“
Darrell A. Rader President and CEO
For more information, please contact: Sunny Pannu – Investor Relations and Corporate Development Manager (778) 330 0994 or via email at pannu@minaurum.com
The TSX Venture Exchange does not accept responsibility for the adequacy or accuracy of this news release.
Data review and verification: Stephen R. Maynard, Vice President of Exploration of Minaurum and a Qualified Person (QP) as defined by National Instrument 43-101, reviewed and verified the assay data, and has approved the disclosure in this News Release. Verification was done by visual inspection of core samples and comparison to assay results. Assay results have not been checked by re-analysis. No factors were identified that could materially affect the accuracy or reliability of the data presented in this news release.
Analytical Procedures and Quality Assurance/Quality Control: Preparation and assaying of drilling samples from Minaurum’s Alamos project are done with strict adherence to a Quality Assurance/Quality Control (QA/QC) protocol. Core samples are sawed in half and then bagged in a secure facility near the site and then shipped either by a licensed courieror by Company personnel to ALS Minerals’ preparation facility in Hermosillo, Sonora, Mexico. ALS prepares the samples, crushing them to 70% less than 2mm, splitting off 250g, and pulverizing the split to more than 85% passing 75 microns. The resulting sample pulps are prepared in Hermosillo, and then shipped to Vancouver for chemical analysis by ALS Minerals. In Vancouver, the pulps are analyzed for gold by fire assay and ICP/AES on a 30-gram charge. In addition, analyses are done for silver, copper, lead, and zinc using 4-acid digestion and ICP analysis. Samples with silver values greater than 100 g/t; and copper, lead, or zinc values greater than 10,000 ppm (1%) are re-analyzed using 4-acid digestion and atomic absorption spectrometry (AAS).
Quality-control (QC) samples are inserted in the sample stream every 20 samples on average, and thus represent 5% of the total samples. QC samples include standards, blanks, and duplicate samples. Standards are pulps that have been prepared by a third-party laboratory; they have gold, silver, and base-metal values that are established by an extensive analytical process in which several commercial labs (including ALS Minerals) participate. Standards test the calibration of the analytical equipment. Blanks are rock material known from prior sampling to contain less than 0.005 ppm gold; they test the sample preparation procedure for cross-sample contamination. In the case of duplicates, the sample interval is cut in half and then quartered. The first quarter is the original sample, the second becomes the duplicate. Duplicate samples provide a test of the reproducibility of assays in the same drilled interval. When final assays are received, QC sample results are inspected for deviation from accepted values. To date, QC sample analytical results have fallen in acceptable ranges on the Alamos project.
When final assays are received, QC sample results are inspected for deviation from accepted values by the QP. To date, QC sample analytical results have fallen in acceptable ranges on the Alamos project.
ALS Minerals is independent of Minaurum Silver and is independent of the Qualified Person.
Cautionary Note Regarding Forward-Looking Information: This news release contains “forward-looking information” within the meaning of applicable Canadian securities legislation. “Forward-looking information” includes, but is not limited to, statements with respect to activities, events or developments that the Company expects or anticipates will or may occur in the future. Generally, but not always, forward-looking information and statements can be identified by the use of words such as “plans”, “expects”, “is expected”, “budget”, “scheduled”, “estimates”, “forecasts”, “intends”, “anticipates”, or “believes” or the negative connotation thereof or variations of such words and phrases or state that certain actions, events or results “may”, “could”, “would”, “might” or “will be taken”, “occur” or “be achieved” or the negative connotation thereof.
In making the forward-looking information in this release, Minaurum has applied certain factors and assumptions that are based on Minaurum’s current beliefs as well as assumptions made by and information currently available to Minaurum. Although Minaurum considers these assumptions to be reasonable based on information currently available to it, they may prove to be incorrect, and the forward-looking information in this release are subject to numerous risks, uncertainties and other factors that may cause future results to differ materially from those expressed or implied in such forward-looking information.
Readers are cautioned not to place undue reliance on forward-looking information. Minaurum does not intend, and expressly disclaims any intention or obligation to, update or revise any forward-looking information whether as a result of new information, future events or otherwise, except as required by law.
Edmonton, Alberta–(Newsfile Corp. – February 4, 2026) – Grizzly Discoveries Inc. (TSXV: GZD) (FSE: G6H) (OTCQB: GZDIF) (“Grizzly” or the “Company”) is pleased to announce that a crew from Peter E. Walcott and Associates has mobilized to Greenwood to commence an Induced Polarization (IP) program in early 2026 to follow up excellent prior results from both surface sampling and historical drilling at the Sappho Critical Minerals Target (Figure 1). In light of the current escalating metal prices for critical minerals/metals including copper (Cu), platinum (Pt), palladium (Pd), gold (Au) and silver (Ag), the Sappho Skarn/Porphyry Target warrants follow-up exploration including drilling. Three lines of IP are planned prior to the commencement of drilling. The drilling is slated to begin approximately mid-February.
Highlights
The Geological Setting is the East Fault Contact of the Toroda Graben with numerous pyroxenite-monzonite-diorite (older) and younger QFP-diorite (Tertiary) intrusions into intermediate-mafic volcanics along with a complex magnetic feature at the Sappho CG area (Figure 1).
The East and West Faults of the Toroda Graben likely played a role in controlling the Au-Ag mineralization for the Buckhorn Skarn and Mine to the southwest and the Cu-Au-Ag mineralization for the Motherlode/Greyhound skarns to the north (Figure 2).
Skarn and porphyry style alteration and mineralization along with Cu-PGE’s-Au-Ag are observed in outcrop and drill core along with a complex magnetic signature in the Main Sappho CG area.
Five (5) new sulphide showings were discovered during 2022 field work, with 4 of the 5 showings yielding rock grab samples with >1% copper (Cu) up to as high as 7.25% Cu (Figure 1 and see Grizzly news release dated November 3rd, 2022).
A total of 17 rock grab samples returned values >1% Cu up to 9.06% Cu, many also with anomalous gold (Au), silver (Ag), platinum (Pt) and palladium (Pd).
A total of 11 samples have yielded >500 parts per billion (ppb) Pt and Pd up to 4.64 grams per tonne (g/t) Pt and up to 2.28 g/t Pd.
The Sappho area is being targeted for copper-gold skarn and porphyry type targets associated with a Jurassic alkalic intrusive complex and several younger diorite intrusions (Figure 1). A total of five new showings of copper oxide mineralization were found during the 2022 program (Figure 1). Previous surface sampling and drilling by Grizzly has yielded significant anomalous copper, gold, silver along with platinum and palladium. Numerous historical and new rock grab samples have yielded greater than 1% Cu, 1 g/t Au, 1 g/t Ag, 1 g/t Pt and 1 g/t Pd (Figure 1).
Historical 2010 drilling by the Company (4 core holes) yielded up to 0.31% Cu, 0.75 g/t Au, 0.34 g/t Pt, 0.39 g/t Pd and 6.57 g/t Ag over 6.5 m core length in skarn at Sappho (in hole 10SP03), including a 1 m core length intersections of 3.82 g/t Au and 199 g/t Ag, and in a separate sample 1.83 g/t Pt and 2.09 g/t Pd across 1 m – these results all are associated with >1% Cu in those samples. These higher grade zones were contained within a 63.5 m core length zone logged as a pyroxene – sulphide skarn with a grade approaching 0.7% copper equivalent derived from current metal prices for Cu, Au, Ag, Pt and Pd. Drillhole 10SP03 targeted a magnetic anomaly and had no indications of surface mineralization at the time of drilling. One of the new 2022 showings has been found proximal to drillhole 10SP03 and the targeted magnetic anomaly.
Figure 1: Sappho Rock Sampling Summary 2026 and Planned IP and Drillhole Locations.
Brian “Griz” Testo, President & CEO of Grizzly Discoveries, states, “New results are providing significant targets indicated by high-grade copper samples at surface. Anomalous ground magnetics has also outlined multiple new targets across the Sappho Project. I am excited to see what IP might indicate – Grizzly will continue to refine these targets to the drill ready stage for anticipated drilling in the next month and potentially identifying some new discoveries.”
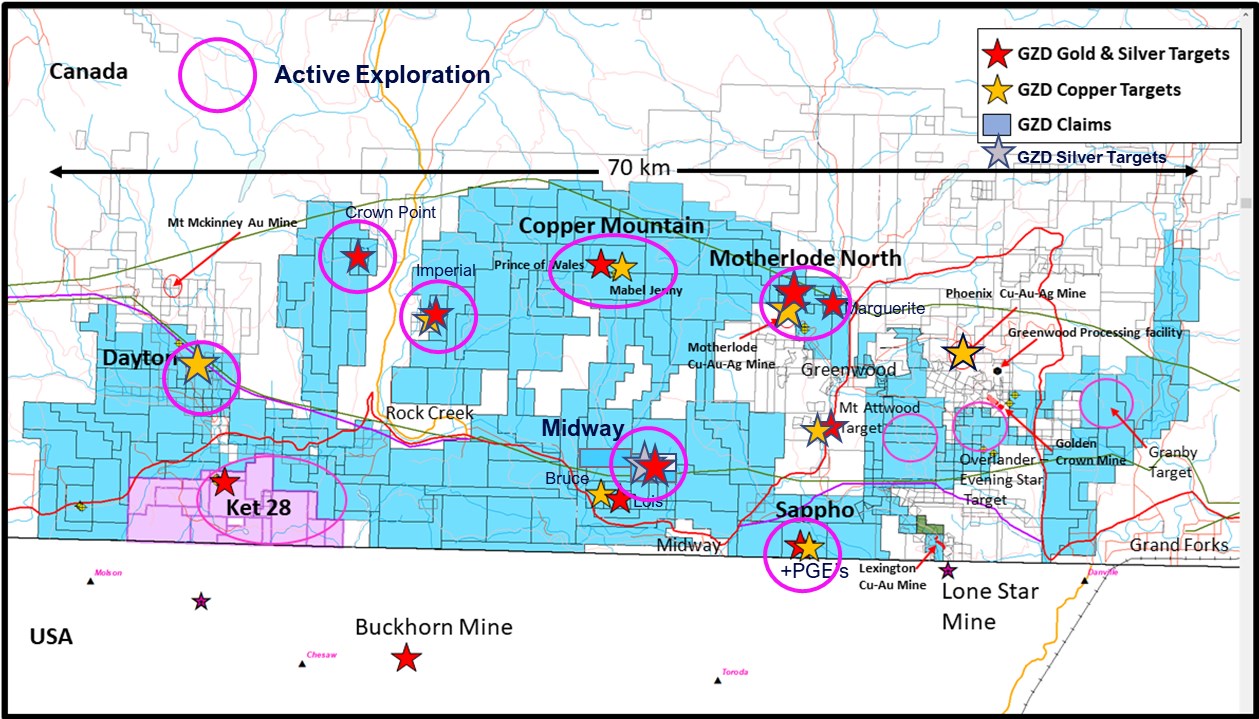
The Company is continuing with surface exploration in the Greenwood area. Crews from APEX Geoscience Ltd. completed soil and rock sampling in August through to October and the exploration work is ongoing. Work including prospecting, rock and soil sampling has been conducted at targets in the Rock Creek area, the Midway area, the Copper Mountain area, the Overlander-Attwood area and the Sappho area to date (Figure 2). Additional groundwork including ground geophysical surveys are being planned and will comprise IP, magnetics and Loupe electromagnetics (EM) for the Sappho, the Midway and Motherlode areas (Figure 2).
Rock (>200 samples) and soil sampling results from the 2025 fieldwork are pending and will be released as they are received.
Grizzly is a diversified Canadian mineral exploration company with its primary listing on the TSX Venture Exchange focused on developing its approximately 72,700 ha (approximately 180,000 acres) of precious and base metals properties in southeastern British Columbia. Grizzly is run by a highly experienced junior resource sector management team, who have a track record of advancing exploration projects from early exploration stage through to feasibility stage.
QUALIFIED PERSON STATEMENT
The technical content of this news release and the Company’s technical disclosure has been reviewed and approved by Michael B. Dufresne, M. Sc., P. Geol., P.Geo., who is a non-independent Qualified Person as defined by National Instrument 43-101 Standards of Disclosure for Mineral Projects.
On behalf of the Board,
GRIZZLY DISCOVERIES INC. Brian Testo, CEO, President
Suite 363-9768 170 Street NW Edmonton, Alberta T5T 5L4
Neither the TSX Venture Exchange nor its Regulation Services Provider (as that term is defined in the policies of the TSX Venture Exchange) accepts responsibility for the adequacy or accuracy of this release.
Caution concerning forward-looking information
This press release contains “forward-looking information” and “forward-looking statements” within the meaning of applicable securities laws. This information and statements address future activities, events, plans, developments and projections. All statements, other than statements of historical fact, constitute forward-looking statements or forward-looking information. Such forward-looking information and statements are frequently identified by words such as “may,” “will,” “should,” “anticipate,” “plan,” “expect,” “believe,” “estimate,” “intend” and similar terminology, and reflect assumptions, estimates, opinions and analysis made by management of Grizzly in light of its experience, current conditions, expectations of future developments and other factors which it believes to be reasonable and relevant. Forward-looking information and statements involve known and unknown risks and uncertainties that may cause Grizzly’s actual results, performance and achievements to differ materially from those expressed or implied by the forward-looking information and statements and accordingly, undue reliance should not be placed thereon.
Risks and uncertainties that may cause actual results to vary include but are not limited to the availability of financing; fluctuations in commodity prices; changes to and compliance with applicable laws and regulations, including environmental laws and obtaining requisite permits; political, economic and other risks; as well as other risks and uncertainties which are more fully described in our annual and quarterly Management’s Discussion and Analysis and in other filings made by us with Canadian securities regulatory authorities and available at www.sedarplus.ca. Grizzly disclaims any obligation to update or revise any forward-looking information or statements except as may be required by law.
Vancouver, British Columbia, February 02, 2026 – Apollo Silver Corp. (“Apollo Silver” or the “Company”) (TSX.V:APGO, OTCQB:APGOF, Frankfurt:6ZF) is pleased to announce that it has received acceptance into the U.S. Defense Industrial Base Consortium (“DIBC”), a U.S. Department of Defense-supported initiative designed to support collaboration across industry, academia, and government in advancing solutions relevant to U.S. defense and national security priorities.
The DIBC focuses on strategic and critical materials and technologies essential to U.S. national security, including initiatives to improve the resilience and security of domestic critical mineral supply chains that support defense and industrial applications[1].
Apollo Silver’s U.S.-based Calico Project hosts significant silver mineralization alongside barite and zinc, which are classified as critical minerals on the USGS List of Critical Minerals and play important roles in industrial, infrastructure, and defense-related applications.
As a member of the DIBC, Apollo Silver joins a network of traditional and non-traditional defense contractors, research institutions, and federal agencies working to advance innovation at speed. Membership provides the Company with opportunities to engage in federally sponsored initiatives related to critical materials supply chains, including the mining and processing of silver, zinc, and barite.
“Apollo Silver’s acceptance into the DIBC reflects the growing strategic importance of U.S.-based critical mineral assets, including silver, following its inclusion on the USGS List of Critical Minerals in November 2025,” said Ross McElroy, President and CEO of Apollo Silver. “With one of the largest undeveloped primary silver assets in the United States and meaningful exposure to industrial critical minerals such as barite and zinc, we believe Apollo Silver is well positioned to align with U.S. priorities focused on supply-chain security, industrial resilience, and national defense.”
About Apollo Silver Corp.
Apollo Silver is advancing the second largest undeveloped primary silver projects in the US. The Calico Project hosts a large, bulk minable silver deposit with significant barite and zinc credits – recognized as critical minerals essential to the U.S. energy, industrial and medical sectors. The Company also holds an option on the Cinco de Mayo Project in Chihuahua, Mexico, which is host to a major carbonate replacement (CRD) deposit that is both high-grade and large tonnage. Led by an experienced and award-winning management team, Apollo is well positioned to advance the assets and deliver value through exploration and development.
Neither the TSX Venture Exchange nor its Regulation Services Provider (as that term is defined in the policies of the TSX Venture Exchange) accepts responsibility for the adequacy or accuracy of this release.
Cautionary Statement Regarding “Forward-Looking” Information
This news release includes “forward-looking statements” and “forward-looking information” within the meaning of Canadian securities legislation. All statements included in this news release, other than statements of historical fact, are forward-looking statements including, without limitation, statements with respect to the expected benefits of the Company’s acceptance into the U.S. Defense Industrial Base Consortium (“DIBC”), the Company’s ability to maintain its membership in the DIBC and pursue opportunities arising therefrom, and the advancement and development potential of the Company’s projects, including the Calico Project and the Cinco de Mayo Project. Forward-looking statements include predictions, projections and forecasts and are often, but not always, identified by the use of words such as “anticipate”, “believe”, “plan”, “estimate”, “expect”, “potential”, “target”, “budget” and “intend” and statements that an event or result “may”, “will”, “should”, “could” or “might” occur or be achieved and other similar expressions and includes the negatives thereof.
Forward-looking statements are based on the reasonable assumptions, estimates, analysis, and opinions of the management of the Company made in light of its experience and its perception of trends, current conditions and expected developments, as well as other factors that management of the Company believes to be relevant and reasonable in the circumstances at the date that such statements are made. Forward-looking information is based on reasonable assumptions that have been made by the Company as at the date of such information and is subject to known and unknown risks, uncertainties and other factors that may have caused actual results, level of activity, performance or achievements of the Company to be materially different from those expressed or implied by such forward-looking information, including but not limited to: risks associated with the Company’s ability to maintain DIBC membership and realize anticipated benefits therefrom; changes in government priorities, programs, funding or procurement processes; the risk that membership in the DIBC does not result in any specific contracts, funding, or other opportunities; risks associated with mineral exploration and development; metal and mineral prices; availability of capital; accuracy of the Company’s projections and estimates; realization of mineral resource estimates, interest and exchange rates; competition; stock price fluctuations; availability of drilling equipment and access; actual results of current exploration activities; government regulation; political or economic developments; environmental risks; insurance risks; capital expenditures; operating or technical difficulties in connection with development activities; personnel relations; and changes in Project parameters as plans continue to be refined. Forward-looking statements are based on assumptions management believes to be reasonable, including but not limited to the price of silver, gold and barite; the demand for silver, gold and barite; the ability to carry on exploration and development activities; the timely receipt of any required approvals; the ability to obtain qualified personnel, equipment and services in a timely and cost-efficient manner; the ability to operate in a safe, efficient and effective matter; and the regulatory framework regarding environmental matters, and such other assumptions and factors as set out herein. Although the Company has attempted to identify important factors that could cause actual results to differ materially from those contained in forward-looking information, there may be other factors that cause results not to be as anticipated, estimated or intended. There can be no assurance that forward-looking statements will prove to be accurate and actual results, and future events could differ materially from those anticipated in such statements. Accordingly, readers should not place undue reliance on forward looking information contained herein, except in accordance with applicable securities laws. The forward-looking information contained herein is presented for the purpose of assisting investors in understanding the Company’s expected financial and operational performance and the Company’s plans and objectives and may not be appropriate for other purposes. The Company does not undertake to update any forward-looking information, except in accordance with applicable securities laws.
Apollo Silver: Capitalized, Strategically Backed, and Positioned for the Next Silver Cycle
In a recent episode of Proven and Probable, host Maurice Jackson spoke with Ross McElroy President and CEO of Apollo Silver, to discuss the company’s latest financing, strategic shareholder support, and its growth strategy amid a strengthening silver market.
Apollo Silver recently completed a $27.5 million financing, increasing its treasury to nearly $60 million. The raise was led primarily by strategic investors and insiders, most notably Eric Sprott and Jupiter Asset Management, Apollo Silver’s two largest shareholders. Their continued participation and increased ownership underscore strong institutional confidence in the company’s assets, leadership, and execution capability.
The majority of the capital will be deployed at Apollo Silver’s Calico Project in San Bernardino County, California, one of the largest primary silver deposits in the United States. Calico hosts an updated mineral resource totaling approximately 125 million ounces of silver in the Measured and Indicated category, with an additional 58 million ounces inferred. Planned work includes advanced metallurgical testing, geotechnical studies, recovery optimization, mine planning, and exploration across an expanded land package.
Mr. McElroy addressed investor concerns regarding California as a mining jurisdiction, emphasizing that San Bernardino County is mining-friendly, with a long history of active mining operations and strong local support for responsible resource development.
In addition to Calico, Apollo Silver controls the Cinco de Mayo Project in Chihuahua, Mexico, a high-grade carbonate replacement deposit originally discovered by MAG Silver. The project hosts a substantial historic resource and significant expansion potential. Should Apollo Silver secure a long-term access agreement with the local community, Cinco de Mayo has the potential to become a company-making flagship asset, given its scale, grade, and jurisdiction.
The conversation also explored silver’s evolving role as both a precious and industrial metal, particularly following its designation as a U.S. critical mineral. With rising demand from solar energy, electronics, defense applications, and persistent global supply deficits, Apollo Silver is positioning itself to benefit from favorable long-term market fundamentals.
With a strong balance sheet, top-tier shareholders, two world-class silver assets in stable jurisdictions, and an experienced management team, Apollo Silver enters the coming year with multiple catalysts and a clear path forward.