Categories
Capitalism Morality Exclusive Interviews Junior Mining Precious Metals

(VIDEO) Goldshore Resources – Moss Lake has Depth, Width and Along Strike

Goldshore Resources – (TSX.V: GSHR | OTCQB: GSHRF)
Website: https://goldshoreresources.com/
3D Deck: https://goldshoreresources.com/investors/#corporate-presentation

Goal: To Create the Next Tier One Asset in Ontario, Canada.

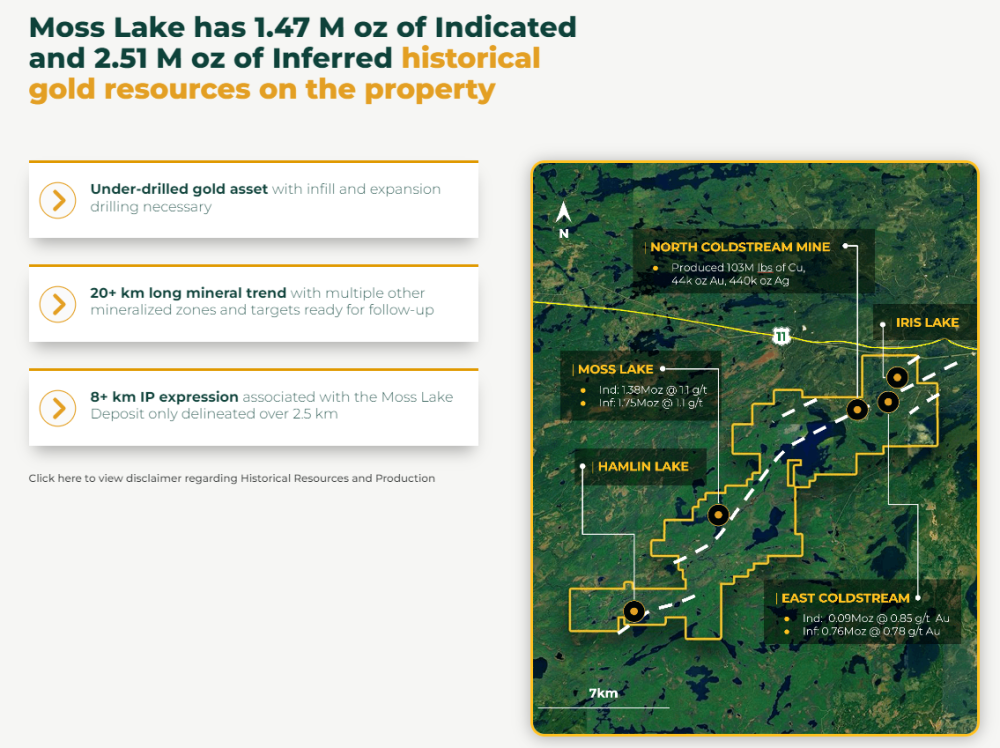
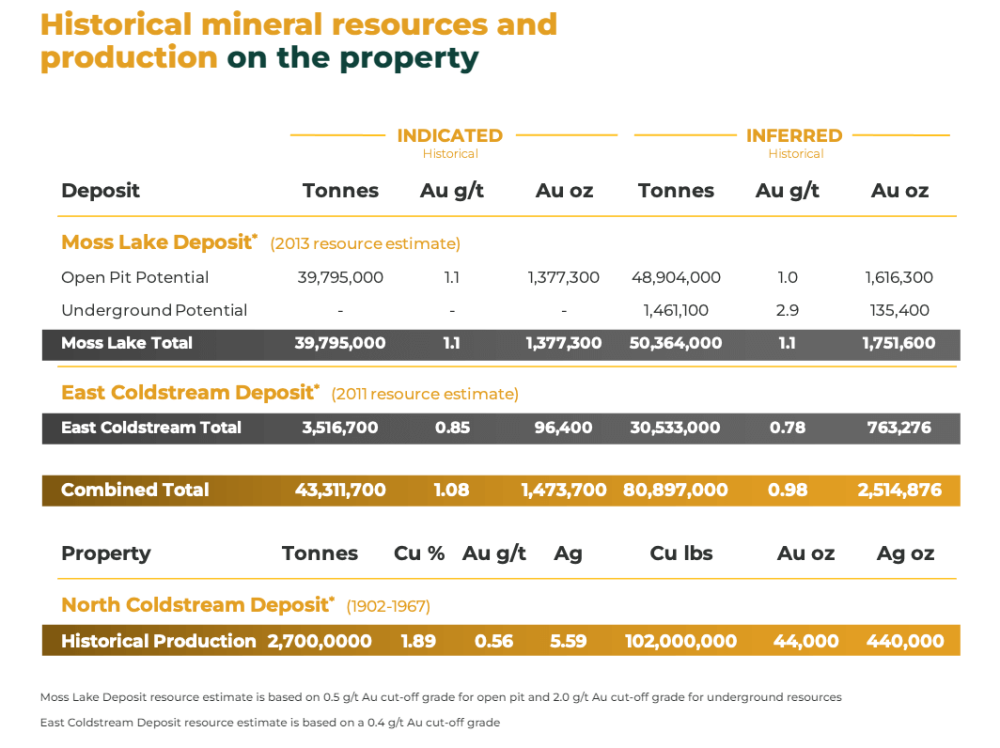
Flagship Project: The Moss Lake Property located in Ontario, Canada has 1.47 M oz of Indicated and 2.51 M oz of Inferred historical gold resources, along with a robust Preliminary Economic Assessment conducted in 2020.

Joining us for our conversation is Brett Richards, the CEO of Goldshore Resources.

Maurice Jackson: Mr. Richards, it’s a pleasure to be speaking with you today as Goldshore Resources has some exciting news for shareholders, as the company continues on its path to creating the next Tier One asset in Ontario, Canada. Mr. Richards, for someone new to the story, please introduce us to Goldshore Resources and the exciting opportunity the company presents to shareholders.

Brett Richards: Goldshore is a company that was formed last year. We’ve been trading for just over a year now, and on the back of acquiring the Moss Lake Project from Wesdome Gold Mines for $52 million in cash and shares last year, we have put together a strategy over the last nine months to drill this up to let’s call it critical mass. What we acquired in the Moss Lake Project was a 4 million-ounce historic resource, and our view is that the extensions of this resource, both laterally along strike and at depth, are significant, particularly along strike.

Our original strategy was let’s put together a 100,000-meter drill program. Let’s get financed and let’s get on with it, and that’s what we’ve been doing for the past nine months, and most recent results are starting to I’ll say support the original thesis we had about Moss Lake being much bigger than first thought.

Maurice Jackson: Before we deep dive into the press release, some important competitive advantages distinguish Goldshore Resources from its peers and truly make the Moss Lake property a unique value proposition. Mr. Richards, for someone new to the flagship Moss Lake property, please acquaint us with the deposit, beginning with your location and some of your neighbors in the region.

Brett Richards: The Moss Lake Property is about 120 kilometers northwest of Thunder Bay in Ontario. We are probably in the most mining-friendly jurisdiction in the world, plus we are on the Trans-Canada Highway, Yonge Street in Toronto, which happens to be the longest street in the world, going all the way to Manitoba. Our concession is adjoined to Trans-Canada Highway.

And why is that important? It’s important for several reasons, particularly about infrastructure. When I look at mining projects, at the end of the day, obviously there’s the technical side of things, but there’s also what I call the do-ability factor. Is this mine really doable? Can you get this into production easily? And the answer for Moss Lake is yes.

Being on the Trans-Canada Highway means we’re afforded 10-cent kilowatt-hour power, which goes right by our doorstep. We have a four-lane highway, so access to our site is as good as it gets. We have power, water, rail, people, consultants, contractors, and government, all within nothing more than an hour’s drive into the City of Thunder Bay, and an international port and an international airport. So, we tick all the boxes when it comes to infrastructure, so that is kind of, I’ll say the description of where we are, and why I think it’s so compelling to be where we are.

There are a lot of people around us as well. The Shebandowan Greenstone Belt where we’re located has been a bit under-explored over the years because low-grade bulk tonnage style deposits were not in favor when gold was $1,500. But now gold is kind of trading on a floor of $1,800, they seem to be much more appealing to investors. Certainly, after the success of Detour Lake, I think you’ll see these types of deposits more and more come into production.

Maurice Jackson: You referenced Goldshore Resources as having a historical resource, and the company also completed a robust Preliminary Economic Assessment (PEA) back in 2020. Can you share some of those highlights with us?

Brett Richards: Historically the area has been, let’s, so-called cobbled together as a big land package. There are three distinct areas within our domain, the Moss Lake area being kind of the flagship. It is what carries three and a half million ounces of that historical resource. Up in the Northeast, up near the highway, we have Coldstream and North Coldstream and Iris Lake against all kinds of compartmentalized land packages that were cobbled together by Wesdome.

There’s a 500,000-ounce historical resource on Coldstream, and a former actual operating mine at North Coldstream that ran for about 30 years in the, about 40 or 50 years ago. We have a very interesting kind of, I’ll say land package, and the work that has been done on this culminated in 2013 when a PEA was done on the property by Moss Lake Gold Mines.

Again, the PEA was updated in 2020 by WesDome before kind of launching a sale process and let’s face it, PEAs are a snapshot in time, and the time in 2013 and the time in 2020, and the time today are all very, very different, knowing that we are in a hyperinflationary environment today, what CAPEX might have been $500 million back in 2020, might be 600 million or $650 million today.

We have to keep that in mind as we go through. But I think back in 2013, and back in 2020, this project, at these gold levels, at $1,800 to $2,200 gold, and trades between a 27% and a 40% IRR. So, after-tax, the internal rate of return, is very, very compelling. We can look at the new present values of these projects, but again, they’re snapshots in time. What that tells me is that this is a robust project that when tested, even with inflation, even with different input assumptions, relative to the economic circumstances at the time, it is going to be a robust project.

Maurice Jackson: Goldshore Resources currently is embarked on a 100,000-meter drill program. Are you twinning the holes, and conducting step-out drilling on this?

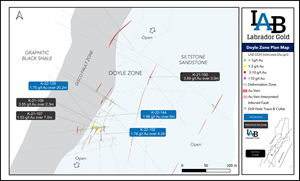
Brett Richards: We are doing some verification drilling of the existing historical resource. We are stepping out laterally. We are stepping out along strike, and we have identified a parallel zone to the Moss Lake deposit, which is very exciting, and some high-grade structural areas within the deposit, which we’ll look to improve the overall grade and volume as we get further down the road, and get closer to a resource estimate.

Maurice Jackson: Speaking of your drill program, some of the initial assay results have just been released. What do they seem to indicate thus far?

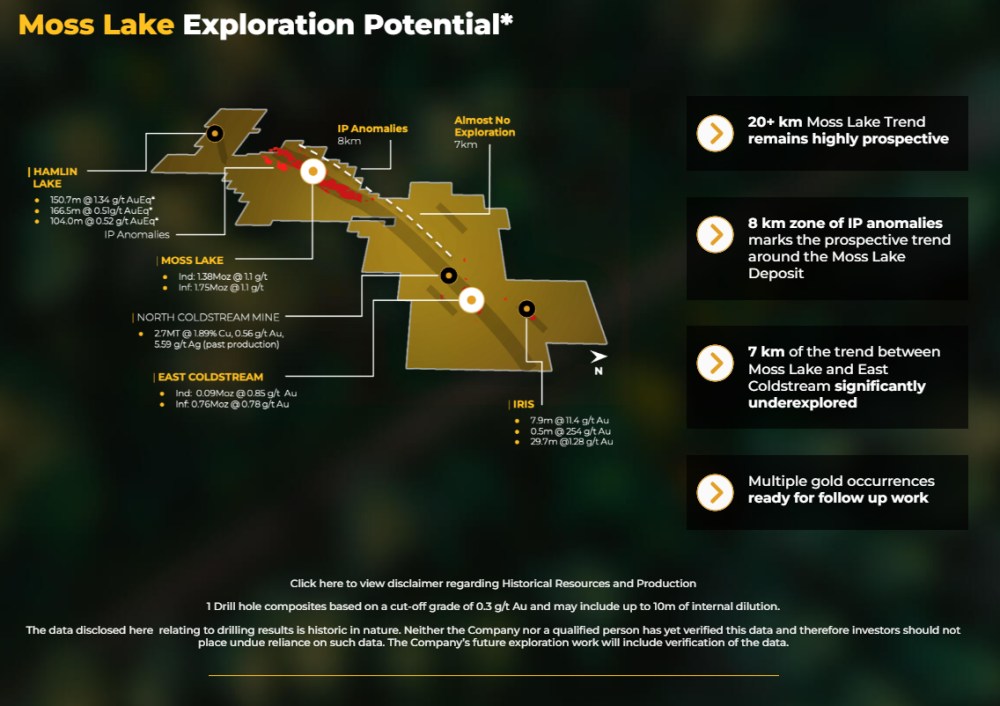
Brett Richards: Well, I think they, we’ve always been trying to test our thesis that this is bigger and much more robust as a deposit than the historical resource illustrates. We’ve done that through a geophysical survey, and you can see that on our website, the 3D model of it, where you can see the potential for future mineralization up along strike, that goes 7 to 12 kilometers further than where Moss Lake is now.

But I think the results that we started to put out from the very beginning show between one, 1.1, 1.2, and 1.3 grams over long intervals, long intercepts of 50, 60, 70, 100, and 120 meters in some cases. I’ll say, some good intercepts, but I think what the surprise has been where we have gone kind of not twining holes, but stepping out a little bit, and stepping into an area that might be classified as inferred.

We’ve hit some high-grade structures, and I think that’s simply because of the geophysical work we’ve done, the structural work we’ve done with a structural geologist by the name of Brett Davis, who’s on-site currently. Pete Flindell, who is our VP of Exploration, he and the team have kind of figured this out. Targeting of some of these higher grade holes has been something that we wanted to do, because ultimately when we kind of go to, I’ll say, interpret all of this data, I don’t think the market is going to want another kind of $1.5 or $2 billion project that does 60,000 tons a day and produces 600,000 ounces of gold. That’s just not viable in this current economic environment.

You’re not going to be able to raise that kind of money. You’re not going to be able to get traction on that type of project. I think we have to start pivoting and looking at alternatives, and what are those? Is there a higher-grade starter pit alternative here within the deposit? I think that’s what we’re going to try and kind of focus on over the next little while. Therefore, there will be more infill and more delineation drilling than anything. But, we are still doing some step-out as well.

Maurice Jackson: All right. Well, let’s get to the press release. Goldshore Resources just received some welcoming news from the assay labs, which identify significant downhole gold intercepts. What can you share with us, Sir?

Brett Richards: We just announced, 78 meters at 1.17 grams from about 170 meters depth. This is a great hole. It’s all going to get contained within an open-pit mine. It’s going to pull a lot of tonnage in. I think, there were some high-grade areas within that, including 22 meters at 2.3 grams and 5.6 meters at 5.69 grams, in and around the 200 to the 220-meter range.

So, this is encouraging, and there are some other intercepts on some other holes that we announced, but it’s all more of the same. There’s anywhere from 20 to a hundred meters at over a gram.

Our objective is to try to maximize the grade. A little bit of grade, 0.1 grams here is going to add 10% to our resource. Even 1 gram or 1.1 gram, it’s quite meaningful at the end of the day. We’ll figure all this out once we get all the data and get towards a mineral source update at the end of the year. But I think right now, and I can talk a lot about the current market dynamics, but sadly, putting good results out into the market has not moved our share price. It’s actually, we have been impacted like all the other junior minors and we’ve been trading downwards.

Maurice Jackson: Looking forward, what can you share with us regarding optionality and economic open pit shells as you model your resource?

Brett Richards: I think we’re going to see a lot of results come out over the next six months or more of the same, illustrating our thesis that this is going to be a real project. Also, I think better delineation on defining this higher-grade starting project, but we can’t lose sight that this is, I think, this is a Tier One asset. This is going to be 10 million ounces by the time the drilling has wrapped up. Whether that’s a year or two or three from now. This is such a large area. There’s probably going to be another 100,000 meters as this gets towards a feasibility study.

Like I’ve said, we’ve got a footprint here that is a Tier One asset at the end of the day, but I think we need to start focusing on what the market is going to respond to. The market is going to respond to, is this a project that has a smaller CAPEX option, a smaller starter with that positive cash flow as soon as possible. Those types of questions need to be addressed and need to be presented to the market. So, we’re going to be looking at some permutations at the end of the day, when we do a PEA next year.

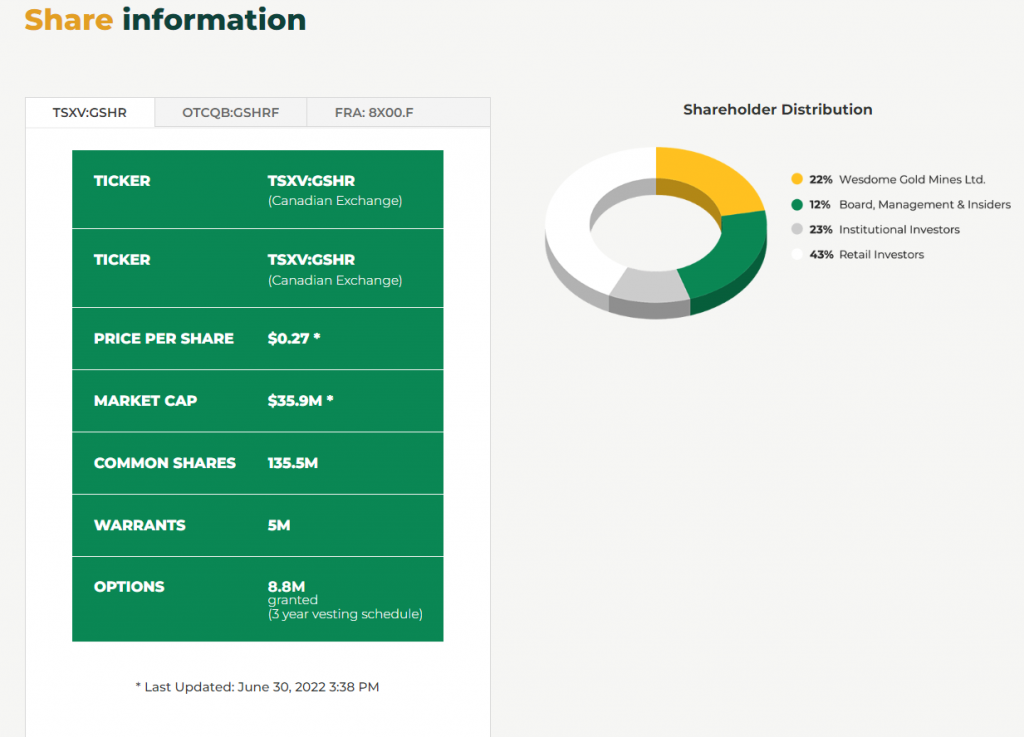
Maurice Jackson: Let’s get into some numbers. Mr. Richards, please provide the capital structure for Goldshore Resource.

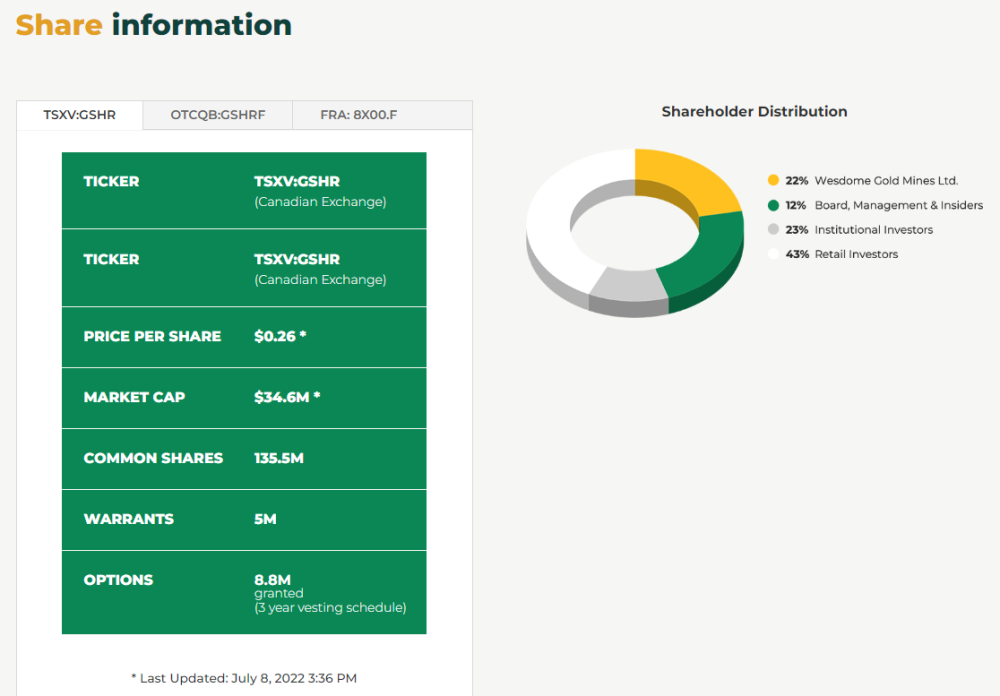
Brett Richards: Goldshore Resources has about 143 million shares outstanding today, and only 5 million out warrants outstanding, and we’ve got about $13 million in the bank as of June. We’re well-positioned here and can ride this out.

As I’ve said before, we got caught in a bit of the whole market dynamics. We wanted to play a bit of catch-up, and get ahead of the curve on drilling, so we ramped up our drilling just before the whole market started crashing.

Our team took our foot off the pedal, and we put the brakes on it a little bit. We did scale up to seven rigs, but we’ve pulled back now to a couple of rigs. I want to ride this out. Preservation of cash and preservation of this company is first and foremost.

The capital markets are so volatile and so unpredictable right now, I’m very comfortable just burning a couple of million dollars a month and just watching this, or less than a couple of million dollars a month, and just watching how this unfolds to the fall because we don’t want to be in a situation where, where we have to go to the market and the market is not there for us.

Maurice Jackson: Speaking of being comfortable, I just want to share with everyone that I am a proud shareholder, and I’m looking to add to my position under these circumstances. The value proposition is extremely compelling, and I’m not discouraged by the price. I understand how markets work, and I never complain about a sale when it comes to capital goods. Now, since we’re covering numbers, how does Goldshore Resources compare with some of your peers?

Brett Richards: Well, we’ve never been able to kind of figure this one out, but we’re trading today somewhere kind of in order of magnitude around $10 an ounce, it’s crazy, but that is kind of where we are today. Our peers have also been impacted, but they also had a higher starting point. We’ve got a trading comparable sheet in our presentation that has us at the bottom of our peer group, and this is a peer group put together by a bank. At trading at $10 today, and our peers trading anywhere from $15, $20, $25, all the way up to $100 an ounce for Marathon.Looking at a pure comparison basis, Goldshore Resources is the least expensive among our peers. When you start looking at what it costs to bring ounces onto a resource statement, to put ounces into the inferred category costs about $30 an ounce. If you have a million ounces of inferred resource, it’ll probably cost $30 million to get there, then drilling in other activities.

So we’re trading at a third of that, a third of what it costs to do it. So, I think from an investment opportunity standpoint, there’s one way here, and it’s up.

Maurice Jackson: In closing, Sir, what would you like to say to shareholders?

Brett Richards: I think the really compelling investment case here is how we have performed against the general market, and where we are today. I’ll say the leverage that we have on the way back up. This is not going to go on forever. We may still feel some pain in the capital markets going forward, but we are going to recover, and commodities and equity, gold equities are going to accelerate, and probably much faster than the market when it does turn around, and when it does come back. We are actually leveraged to that even greater than the normal gold equity market, because of our size and our scale, and our potential to bring this up to a Tier One status.

So, there are some compounding, compelling investment reasons why to choose Goldshore, and I am also a major shareholder of this company. I have never continued to lose sight of the fact that this is a real project, and this is going to get into production one day.

Maurice Jackson: Mr. Richards, it’s been a pleasure speaking with you today. Wishing you and Goldshore Resources, the absolute best, Sir.

Brett Richards: Thanks, Maurice.

Maurice Jackson is the founder of Proven and Probable, a site that aims to enrich its subscribers through education in precious metals and junior mining companies that will improve the world.

Categories
Exclusive Interviews Junior Mining Precious Metals

(VIDEO) Dolly Varden Silver | 3 Rigs, 30,000 Meter Drill Program on the Kitsault Valley Project

Dolly Varden Silver Corporation is a mineral exploration company focused on advancing its 100% held Kitsault Valley Project located in the Golden Triangle of British Columbia, Canada, 25kms by road to deep tide water. The 163 sq. km. project hosts the high-grade silver and gold resources of Dolly Varden and Homestake Ridge along with the past producing Dolly Varden and Torbrit silver mines.

It is considered to be prospective for hosting further precious metal deposits, being on the same structural and stratigraphic belts that host numerous other, on-trend, high-grade deposits, such as Eskay Creek and Brucejack. The project also contains the Big Bulk property which is prospective for porphyry and skarn style copper and gold mineralization, similar to other such deposits in the region (Red Mountain, KSM, Red Chris).

Dolly Varden Silver Corp: (TSX.V: DV | OTCQX: DOLLF)
Website: https://www.dollyvardensilver.com/
Corporate Presentation: https://bit.ly/3atGLuq
Email: info@dollyvardensilver.com
Phone: 604-602-1440

Categories
Junior Mining

Gold Assets Could Help Secure Nation’s Shores

Original Source: https://www.streetwisereports.com/article/2022/06/06/gold-assets-could-help-secure-nations-shores.html

By advancing the potential of its gold projects in the Northwest Territories of Canada, 

Rover Metals Corp.

(ROVR:TSX.V – ROVMF:OTCQB – 4X0:FRA)

$0.04

2022/6/8 8:23:44

Volume: 1,500
Market Cap: 6.3m
PE Ratio: -1.60
Year High: $0.12
Year Low: $0.03
Shares Out: 157,435,212
Float: 157,435,212
Institute Hold’gs:
3.30% (as of 08/31/17)
Institutions Bought Prev 3 Mo: 0

Analyst coverage

Fundamental Research Corp. — Siddharth Rajeev

Newsletter coverage

Clive Maund — CliveMaund.com

Company News

 View Latest News

Streetwise Reports Articles

06/08/2022 – View Article
03/29/2021 – View Article
03/26/2021 – View Article
01/19/2021 – View Article
11/23/2020 – View Article

 See More Live DataRover Metals Corp., (ROVR:TSX.V; ROVMF:OTCQB; 4X0:FRA) said it is helping to assert Canada’s Arctic borders and safeguard the nation’s northern sovereignty above the 60th parallel.

Within the Arctic region’s 21 million square kilometers, eight countries — Canada, Russia, the United States, Denmark, Sweden, Finland, Norway, and Iceland — have exclusive economic rights to resources up to 200 nautical miles from their shores.

But as rising ocean temperatures disrupt shorelines and shipping routes, heavy hitters like China are eying assets and deep seaports along Canada’s Northwest Arctic Passage.

Potential at the 60th Parallel

Global gold production is expected to grow at a compound annual rate of more than 3% through 2026, with Canada being the largest contributor to the increase. Over the forecast period 2022-2026, Canadian gold mine production is expected to grow at a compound annual growth rate (CAGR) of 18.7% to reach 15.5 Moz.

Global Data

But action is needed to capitalize on these trends. “If there are no new mines coming online in the Northwest Territories, the population, taxes, and government needed to assert Canada’s northern border dwindles creating a potential power vacuum in the arctic,” said Rover Metals Chief Executive Officer and Director Judson Culter.

With its strategic proximity to the key city of Yellowknife, Rover’s 100%-owned Cabin Gold asset and minority owned Up Town Gold asset could be the catalysts that build a critical mass of population, infrastructure, employment, and income, he said.

Cabin Gold Project

Cabin Gold is located 110 km northwest of the city of Yellowknife, close to hydro lines and to the Tlicho All Season Road (TASR), the newest corridor of mining infrastructure in the Northwest Territories. Two new gold mines along the TASR are scheduled to see advanced-stage mine development over the next five years: Fortune Minerals Ltd.’s (FT:TSX) NICO Project and Nighthawk Gold Corp.’s (NHK:TSX.V) Indin Lake project.

Supported by a grant from the government of the Northwest Territories’ Mining Incentive Program, under a mandate to ensure that mineral resource exploration and development continues to flourish in the north, Rover commenced Phase 3 exploration in Cabin Gold in March 2022.

“The project will be a success even if we prove up only 500,000 ounces of gold because we can do a milling offtake agreement with either Nighthawk or Fortune,” Culter said.

New drilling results are expected sometime this summer, but for now, Culter considers Sabina Gold & Silver Corp.’s (SBB:TSX; RXC:FSE; SGSVF:OTCPK) Back River project to be “the closest geological analog in terms of how we’re going to follow on our discoveries. Plus, we’re in the same neighborhood and with relatively the same type of rocks.”

Up Town Gold Project

Located on the outskirts of the city limits of the city of Yellowknife, this Archean lode-gold prospect adjoins the historic 7.2 Moz Giant Mine gold deposit and Gold Terra Resource Corp.’s (YGT:TSX.V; YGTFF:OTC; TXO:FRANKFURT) 2.2 Moz Yellowknife City Gold Project.

“We believe the Up Town Gold project has the potential for a million-plus ounces,” Culter said.

If exploration continues to be successful in proving up ounces of gold, Up Town has a high chance of resale within the next two years. Newmont Corp. (NEM:NYSE) is active in the Yellowknife area, having optioned their gold claims at the southern city limits to Gold Terra in 2021.

In addition, Culter said, “A new producing gold mine pushes the demand for new exploration and discoveries in the northern territories, paving the way for shipping and airborne logistics, new jobs, and the potential for new highways and hydro infrastructure. For every new head hired into a junior mining company, there’s a multiplier of two and a half new jobs hired into the supply chain that supports that company.”

‘We’re Pretty, Pretty Confident’

With assets in all the right places, Rover Metals is relatively under-appreciated and undervalued, Culter said.

“We’re at the very bottom of the Pierre Lassonde discovery curve, with only one direction but moving up ,” he said. “We need another $4 million or $5 million in drilling, but over the next two years, there’s critical ounces and value in our Cabin Gold project.”

The company has just raised $2 million dollars at a time when other junior miners have struggled to raise anything.

“Here’s a company with high-grade gold resources in the right neighborhood. We’re fully financed, with drill results coming, so we’re pretty, pretty confident,” Culter said. “I think investors should be taking note.”

Newsletter writer Clive Maund agreed, writing when the share price was $0.04 that Rover Metals was an immediate speculative buy. The price hovered at $0.04 on Monday.

“This, therefore, looks like a good low price to pick it up and this is said in the knowledge that it could temporarily break even lower,” he wrote. “As it is only at 4 cents now, it can’t drop much lower.”

Rover Metals has a market cap of $5.51 million and 157.44 million shares outstanding. It trades in a range of $0.12 and $0.03 over 52 weeks.

Want to be the first to know about interesting Gold investment ideas? Sign up to receive the FREE Streetwise Reports’ newsletter.Subscribe

Disclosures

1) Wendy Hubbert and Steve Sobek compiled this article for Streetwise Reports LLC and provide services to Streetwise Reports as an independent contractor/employee, respectively. They or members of their household own securities of the following companies mentioned in the article: None. They or members of their household are paid by the following companies mentioned in this article: None.

2) The following companies mentioned in this article are billboard sponsors of Streetwise Reports: Rover Metals Corp. Click here for important disclosures about sponsor fees. The information provided above is for informational purposes only and is not a recommendation to buy or sell any security.

3) The article does not constitute investment advice. Each reader is encouraged to consult with his or her individual financial professional and any action a reader takes as a result of information presented here is his or her own responsibility. By opening this page, each reader accepts and agrees to Streetwise Reports’ terms of use and full legal disclaimer. This article is not a solicitation for investment. Streetwise Reports does not render general or specific investment advice and the information on Streetwise Reports should not be considered a recommendation to buy or sell any security. Streetwise Reports does not endorse or recommend the business, products, services or securities of any company mentioned on Streetwise Reports.

4) From time to time, Streetwise Reports LLC and its directors, officers, employees or members of their families, as well as persons interviewed for articles and interviews on the site, may have a long or short position in securities mentioned. Directors, officers, employees or members of their immediate families are prohibited from making purchases and/or sales of those securities in the open market or otherwise from the time of the decision to publish an article until three business days after the publication of the article. The foregoing prohibition does not apply to articles that in substance only restate previously published company releases. As of the date of this article, officers and/or employees of Streetwise Reports LLC (including members of their household) own securities of Rover Metals Corp. and Gold Terra Resource, a company mentioned in this article.

Categories
Junior Mining Precious Metals Uncategorized

Labrador Gold Intersects 6.22 G/T Gold Over 4 Metres in First Hole at Golden Glove Including 10.31 G/T Over 2 Metres

Labrador Gold Corp.
Labrador Gold Corp.

Figure 1.

Doyle Zone plan map.

TORONTO, June 07, 2022 (GLOBE NEWSWIRE) — Labrador Gold Corp. (TSX.V:LAB | OTCQX:NKOSF | FNR: 2N6) (“LabGold” or the “Company”) is pleased to announce results from seven drill holes, including the first hole drilled at the Golden Glove Target in the south end of its 100% owned Kingsway project near Gander, Newfoundland. These holes were drilled as part of the Company’s ongoing 100,000 metre drill program at Kingsway.

Hole K-22-150 intersected 6.22 g/t Au over 4 metres that included 10.31 g/t Au over 2m at a vertical depth of 246 metres. This intersection is located approximately 160 m south of the Golden Glove discovery outcrop where six grab samples, three of which contained visible gold, assayed between 2.99 g/t and 338.1 g/t Au (see news release dated September 21, 2021). This intersection at Golden Glove is the fourth of four targets drilled by LabGold to return significant gold intercepts.

While there are many similarities between the mineralization observed at Golden Glove and that at Big Vein, a significant difference is that while Big Vein occurs on the west side of the Appleton Fault Zone, Golden Glove is situated on the East Side. This is the first drilling on the east side of the fault at the Kingsway Property.https://embed.fireplace.yahoo.com/embed?ctrl=Monalixa&m_id=monalixa&m_mode=document&site=sports&os=android&pageContext=%257B%2522ctopid%2522%253A%25221542500%253B1577000%2522%252C%2522hashtag%2522%253A%25221542500%253B1577000%2522%252C%2522wiki_topics%2522%253A%2522Labrador%253BFault_(geology)%253BGold%2522%252C%2522lmsid%2522%253A%2522a0770000002m0AbAAI%2522%252C%2522revsp%2522%253A%2522globenewswire.com%2522%252C%2522lpstaid%2522%253A%252256728853-316a-31bc-a98d-be02627be93e%2522%252C%2522pageContentType%2522%253A%2522story%2522%257D

Six holes drilled at the Pristine target intersected near surface gold mineralization over significant widths in the Doyle Zone, including 1.86 g/t Au over 8m in hole K-22-144 and 1.75 g/t over 20.2m that included 2.76 g/t Au over 6.2m in Hole K-22-139.

“We are very pleased with the results from the first hole drilled at Golden Glove especially considering that the intersection is approximately 160m south of the discovery outcrop. This indicates excellent potential for the area between this hole and the outcrop and we are certainly looking forward to the results from the remaining five holes drilled there to date,” said Roger Moss, President and CEO of LabGold. “The continued near surface gold intercepts extending the strike length of the Doyle Zone are nice to see especially those with wider intersections. We are encouraged by the successful drilling of our four initial targets, all of which have delivered significant gold mineralization. We will continue to test the new targets developed along the Appleton Fault Zone through the summer, starting with the CSAMT target approximately eight kilometres northeast of Big Vein.”

Hole IDFrom (m)To (m)Interval (m)Au (g/t)Zone
K-22-1526670.244.241.78Doyle
 879032.24
 939631.17
K-22-15034835246.22Golden Glove
including348350210.31
K-22-149131411.27Doyle
K-22-1465757.950.951.12Doyle
K-22-144647281.86Doyle
including697123.32
K-22-14392.2930.81.42Doyle
K-22-13957.277.420.21.75Doyle
including62.268.46.22.76
 89.492.431.59

Table 1. Summary of Assay Results. All intersections are downhole length
as there is insufficient Information to calculate true width.

Hole numberEastingNorthingElevationAzimuthDipDepth
K-22-15266180454360205430050221
K-22-15066053954317764826545452.57
K-22-14966180454360216226045227
K-22-14666180354360326426062176
K-22-14466180854360706528045200.27
K-22-14366180154360345426045299.06
K-22-13966180254360335430045215

Table 2. Drill hole collar details

Figure 1. Doyle Zone plan map.

https://www.globenewswire.com/NewsRoom/AttachmentNg/5909d35d-b977-40ba-81da-f664988cc5e1

QA/QC

True widths of the reported intersections have yet to be calculated. Assays are uncut. Samples of HQ split core are securely stored prior to shipping to Eastern Analytical Laboratory in Springdale, Newfoundland for assay. Eastern Analytical is an ISO/IEC17025 accredited laboratory. Samples are routinely analyzed for gold by standard 30g fire assay with atomic absorption finish as well as by ICP-OES for an additional 34 elements. Samples containing visible gold are assayed by metallic screen/fire assay, as are any samples with fire assay results greater than 1g/t Au. The company submits blanks and certified reference standards at a rate of approximately 5% of the total samples in each batch.

Qualified Person

Roger Moss, PhD., P.Geo., President and CEO of LabGold, a Qualified Person in accordance with Canadian regulatory requirements as set out in NI 43-101, has read and approved the scientific and technical information that forms the basis for the disclosure contained in this release.

The Company gratefully acknowledges the Newfoundland and Labrador Ministry of Natural Resources’ Junior Exploration Assistance (JEA) Program for its financial support for exploration of the Kingsway property.

About Labrador Gold
Labrador Gold is a Canadian based mineral exploration company focused on the acquisition and exploration of prospective gold projects in Eastern Canada.

In early 2020, Labrador Gold acquired the option to earn a 100% interest in the Kingsway project in the Gander area of Newfoundland. The three licenses comprising the Kingsway project cover approximately 12km of the Appleton Fault Zone which is associated with gold occurrences in the region, including those of New Found Gold immediately to the south of Kingsway. Infrastructure in the area is excellent located just 18km from the town of Gander with road access to the project, nearby electricity and abundant local water. LabGold is drilling a projected 50,000 metres targeting high-grade epizonal gold mineralization along the Appleton Fault Zone following encouraging early results. The Company has approximately $28 million in working capital and is well funded to carry out the planned program.

The Hopedale property covers much of the Florence Lake greenstone belts that stretches over 60 km. The belt is typical of greenstone belts around the world but has been underexplored by comparison. Work to date by Labrador Gold show gold anomalies in rocks, soils and lake sediments over a 3 kilometre section of the northern portion of the Florence Lake greenstone belt in the vicinity of the known Thurber Dog gold showing where grab samples assayed up to 7.8g/t gold. In addition, anomalous gold in soil and lake sediment samples occur over approximately 40 km along the southern section of the greenstone belt (see news release dated January 25th 2018 for more details). Labrador Gold now controls approximately 40km strike length of the Florence Lake Greenstone Belt.

The Company has 159,199,026 common shares issued and outstanding and trades on the TSX Venture Exchange under the symbol LAB.

For more information please contact:

Roger Moss, President and CEOTel: 416-704-8291

Or visit our website at: www.labradorgold.com

Twitter: @LabGoldCorp

Neither TSX Venture Exchange nor its Regulation Services Provider (as that term is defined in policies of the TSX Venture Exchange) accepts responsibility for the adequacy or accuracy of this release.

Forward-Looking Statements: This news release contains forward-looking statements that involve risks and uncertainties, which may cause actual results to differ materially from the statements made. When used in this document, the words “may”, “would”, “could”, “will”, “intend”, “plan”, “anticipate”, “believe”, “estimate”, “expect” and similar expressions are intended to identify forward-looking statements. Such statements reflect our current views with respect to future events and are subject to risks and uncertainties. Many factors could cause our actual results to differ materially from the statements made, including those factors discussed in filings made by us with the Canadian securities regulatory authorities. Should one or more of these risks and uncertainties, such as actual results of current exploration programs, the general risks associated with the mining industry, the price of gold and other metals, currency and interest rate fluctuations, increased competition and general economic and market factors, occur or should assumptions underlying the forward looking statements prove incorrect, actual results may vary materially from those described herein as intended, planned, anticipated, or expected. We do not intend and do not assume any obligation to update these forward-looking statements, except as required by law. Shareholders are cautioned not to put undue reliance on such forward-looking statements.

Categories
Junior Mining Lion One Metals Precious Metals Uncategorized

Lion One Discovers Major New Gold Feeder Structure – 20.86 G/t Au over 75.9 Meters at Depth Beneath the Current Resource at Tuvatu, Fiji

North Vancouver, British Columbia–(Newsfile Corp. – June 6, 2022) – Lion One Metals Limited (TSXV: LIO) (OTCQX: LOMLF) (ASX: LLO) (“Lion One” or the “Company”) is delighted to announce the discovery of a major new feeder structure at its Tuvatu Alkaline Gold Project in Fiji. Hole TUG-141, targeting a complex network of high-grade structures called the 500 Zone, has encountered the longest high-grade intercept yet recorded at Tuvatu, 20.86 g/t Au over 75.9m, including 43.62 g/t Au over 30.0m which includes 90.35 g/t Au over 7.2m. The new discovery is located at depth beneath the current resource fully within the permit boundaries of the Tuvatu mining lease.

High-grade intercepts from TUG-141 include:

  • 20.86 g/t Au over 75.9m from 443.4-519.3m
  • including 35.25 g/t Au over 37.5m from 471.3-508.8m
  • including 43.62 g/t Au over 30.0m from 477.6-507.6m
  • including 90.35 g/t Au over 7.2m from 494.4-501.6m
  • and notable individual high-grade assay intervals including:

– 138.15 g/t Au over 0.30m from 450.9-451.2m

– 396.16 g/t Au over 0.30m from 479.1-479.4m

– 103.54 g/t Au over 0.30m from 498.6-498.9m

– 340.07 g/t Au over 0.30m from 498.9-499.2m

– 600.42 g/t Au over 0.30m from 499.5-499.8m

– 244.37 g/t Au over 0.30m from 502.5- 503.1m

– 230.18 g/t Au over 0.30m from 507.3-507.6m

– 105.58 g/t Au over 0.30m from 518.7-519.0m

Lion One CEO, Walter Berukoff, stated: “Like the initial discovery of the high-grade 500 Zone drilled two years ago, I believe this new robust high-grade gold feeder mineralization encountered by hole TUG-141 represents a substantial discovery for Lion One. The notable high grades and continuity of mineralization of this intercept demonstrate Tuvatu’s potential to become a large-scale, high-grade underground gold mine. I have long encouraged our team to find that “gold room” at Tuvatu, and hole TUG-141 leads me to believe they have found it. We have only to look at other notable large alkaline Au deposits as direct analogues to better understand what this latest discovery tells us, and it is clear that the discovery of a major high-grade feeder such as this should be viewed as very promising. I am confident that Tuvatu will one day fall in the ranks of notable multi-million ounce Au deposits such as Porgera and Vatukoula. I commend our team on this truly outstanding discovery and I look forward to continued successful execution of both our exploration strategy to realize growth at Tuvatu and our development strategy targeting the commencement of gold production in the second half of 2023.”

Lion One Senior VP of Exploration, Sergio Cattalani, commented: “The mineralized intercepts reported by TUG-141 represent a highly significant development. The grades and continuity observed by the intercepts in hole TUG-141 are of a magnitude not previously documented at Tuvatu, and highlights the largely untapped potential of this deposit. The significance of having identified what may be a new principal feeder conduit for Tuvatu confirms the model that has driven this deep exploration program since the discovery of hole TUDDH-500 in July 2020. Our immediate priority is to follow up of this significant discovery with additional drilling in what remains a relatively poorly drilled portion of the Tuvatu system. Lion One, is now more than ever, convinced of the potential of Tuvatu to become a prominent, multi-million ounce Au deposit at the top of the Au grade distribution worldwide.”

Lion One Technical Advisor, Quinton Hennigh, commented: “Alkaline gold systems tend to be deep-rooted and very structurally complex. Exploring them can be analogous to drilling a tree from the top down. In the shallow part of the system, one finds the upper “branches,” or gold-bearing lodes, but as exploration persists to depth, bigger and bigger “branches,” or lodes, are encountered ultimately leading to the “trunk,” the feeder. The way this remarkable discovery at Tuvatu has unfolded is quite similar to the experience at Porgera, where after approximately ten years of diligent drilling, the high-grade Romane Fault Zone was discovered beneath a myriad of smaller lodes. What is most exciting about this discovery is that now that we have a clear idea where the deep fluid-tapping conduit of this system is located, we can effectively chase it to depth, and alkaline gold systems are known to persist to great depths, sometimes as deep as 2 km. Considering this intercept is only approximately 500m below surface, this discovery is wide open for growth at depth.”

TUG-141 was drilled in the area between modelled 500 Zone lodes 500A, 500C and 500F (Figure 1) where it intersected continuous high-grade Au mineralization grading 20.86 g/t Au over 75.9m that is predominantly hosted by intensely altered, fractured and brecciated andesite. The highest grade core of this zone is characterized by hydrothermal breccia displaying extreme silicification, potassic alteration and sulfidation with regular occurrences of visible gold (Figure 2). In addition, the presence of abundant roscoelite (a vanadium mica mineral) is very encouraging and is a mineral synonymous with the high-grade zones of world-class alkali gold systems such as Cripple Creek in Colorado and Porgera in Papua New Guinea. Some fragments within portions of this breccia are visibly milled, or rounded, indicating vigorous fluid flow. Observations of fracture patterns and textures ranging from incipient and in-situ to full-on brecciation (Figure 2) point to this zone being a dilational breccia that likely formed along a major structural intersection where stresses were being released at the time of mineralization. Rapid depressurisation accompanying seismic movement along such a dilational zone would allow rapid ascent of hydrothermal fluids resulting in silicification, K-metasomatism, sulfidation and rapid precipitation of Au. Textures of minerals observed in veins and open spaces is consistent with a rapid depositional regime.

Lion One is concurrently undertaking a two-pronged exploration drill campaign: 1) shallow infill drilling to enhance definition of its current resource in preparation for mine planning, and 2) deep drilling focussed on better understanding the geometry and extent of the underlying high-grade feeder network. As part of the latter program, hole TUG-141 targeted the upper portion of the 500 Zone at depths between approximately 450-550m where it is projected to connect with the base of lodes making up the Inferred resource. As discussed above, TUG-141 drilled into a very wide and exceptionally high-grade zone, 20.86 g/t Au over 75.9m, cored by hydrothermal breccia (Figure 2). Such a zone of extreme fracturing and brecciation has never before been observed at Tuvatu. It is significant to note that the bulk of this mineralized interval is hosted within andesite rather than by intrusive monzonite, the typical host rock for many lodes at Tuvatu. The significance of this observation has yet to be determined.

Furthermore, it is also notable that the nearest drill holes to TUG-141 are TUG-135 (70m below), TUG-136 (45m to the E), and TUG-138 (60m to the W), indicating that there is considerable space for a substantial increase in the ultimate size of the feeder conduit. All three of these holes have returned previously reported bonanza grade mineralization, similar in tenor and texture to that in TUG-141, including:

24.92 g/t Au over 3.70m from 415.7-419.4m in hole TUG-135 including 159.3 g/t Au over 0.30m;

87.83 g/t Au over 1.5m from 445.1-446.6m in hole TUG-136 including 108.41 g/t Au over 0.60m;

and 23.14 g/t Au over 3.0m from 571.5-574.5m in hole TUG-138 including 118.6 g/t Au over 0.30m.

The area remains open at depth. This target has now become of utmost importance for follow up drilling.

In addition to the impressive intercept of 20.86 g/t Au over 75.9m discussed above, hole TUG-141 encountered numerous other significant mineralized intercepts both above and below this interval including:

Above the high-grade intercept

  • 3.93 g/t Au over 5.7m from 101.7-107.4m including 12.17 g/t Au over 0.30m
  • 4.48 g/t Au over 10.2m from 109.8-120.0m including 38.27 g/t Au over 0.30m
  • 10.98 g/t Au over 1.5m from 291.3-292.8m including 17.20 g/t Au over 0.60m
  • 5.63 g/t Au over 19.2m from 311.7-330.9m including 20.50 g/t Au over 3.00m from 322.2-325.2m, which includes 71.01 g/t Au over 0.30m and 13.75 g/t Au over 0.60m
  • 3.33 g/t Au over 4.50m from 366.3-370.8m including 7.40 g/t Au over 1.20m
  • 11.38 g/t Au over 2.1m from 380.7-382.8m including 22.30 g/t Au over 0.90m
  • 1.97 g/t Au over 13.5m from 391.8-405.3m including 15.25 g/t Au over 0.30m
  • 2.82 g/t Au over 3.90m from 425.1-429.0m including 8.47 g/t Au over 0.30m

Below the high-grade intercept

  • 3.08 g/t Au over 1.50m from 524.1-525.6m including 7.50 g/t Au over 0.30m

In aggregate, all mineralized intercepts reported from hole TUG-141 total 1,909 g/t Au-meters.

Complete results, received to date, from hole TUG-141 are summarized below in Table 1. This is the first drill hole in this part of the Tuvatu alkaline gold system, and as such, orientation and true thicknesses of mineralized intercepts discussed above are not known at this time. Further drilling is required to better understand this new discovery. At the time of writing, hole TUG-141 is still being drilled, and is currently >600m in depth with other mineralised structures yet to be assayed.


Figure 1. Plan view (upper) and vertical section looking E (lower) of the trace of TUG-141 and selected drill holes relative to the 500 Zone lodes modeled to date. TUG-141 was drilled from underground along the Tuvatu exploration decline. The traces of known lodes UR2 and UR4, and modelled lodes of the 500 Zone feeder are shown in red.

To view an enhanced version of Figure 1, please visit:
https://orders.newsfilecorp.com/files/2178/126617_fig%201ed%20lm.jpg.


Figure 2. Compilation of photographs from TUG-141. (A) Abundant visible gold grains (0.2-2mm) in highly altered potassium metasomatized groundmass and roscoelite. (B) Visible gold (~2mm grains) associated with coarse pyrite in a silicified breccia. (C & D) Intensely silicified and pyritized andesite with microfractures of visible gold (~0.5mm grains).

To view an enhanced version of Figure 2, please visit:
https://orders.newsfilecorp.com/files/2178/126617_81354d06c4e0dad0_003full.jpg.


Figure 2 (continued). (E) Vuggy breccia with coarse pyrite and silicified-sulfidized ground mass. Breccia clasts are angular to sub-rounded. (F) Coarse pyrite breccia with silicified-sulfidized ground mass. (G) Network fracture stockwork ~1-5mm veins with two generations of pyrite. The clasts are highly altered silicified andesite, with the veins containing quartz-pyrite. (H) Network fracture stockwork veins at multiple angles, with intense silicification, quartz-carbonate infill and pyrite.

To view an enhanced version of Figure 2 continued, please visit:
https://orders.newsfilecorp.com/files/2178/126617_81354d06c4e0dad0_004full.jpg.

Mineralization is observed as two generations of pyrite; an earlier bright euhedral pyrite that forms coarse crystals in the core of the veins and breccia, and a darker brownish, spongy pyrite that typically forms extremely fine-grained encrustations or overgrowths on earlier pyrite and wallrock fragments, as well as lining the edges of most veins (Figure 2). Quartz occurs commonly as bluish grey, amorphous to locally colloform silica. Open space vuggy textures are common, as are visible gold grains. Highest grades (up to 600 g/t Au) appear to be associated with an interval of intense pervasive silicification and sulfidation by up to 30% or more extremely fine-grained pyrite developed throughout the host rock, giving the rock an overall massive chocolate brown appearance (Figure 2). The intensity of replacement suggests this is a zone of very high and sustained fluid flux.

Table 1: Table showing all drilling intervals returning >0.5 g/t Au for hole TUG-141. Intervals > 3.0 g/t Au, which is the cutoff grade used for the current resource, are shown in red, and intervals >9.0 g/t Au, which is the average grade of the resource, are bolded.

Sample IDFrom (m)To (m)Interval (m)Grade (g/t Au)
TUG0858471.7720.30.96
TUG08535101.71020.33.96
TUG08536102102.30.312.17
TUG08537102.3102.60.35.35
TUG08538102.6102.90.31.42
TUG08539102.9103.20.33.09
TUG08541103.5103.80.31.19
TUG08542103.8104.10.38.64
TUG08543104.1104.40.37.67
TUG08544104.4104.70.37.56
TUG08545104.71050.37.90
TUG08546105105.30.33.53
TUG08548105.6105.90.30.60
TUG08549105.9106.50.64.83
TUG08452107.1107.40.31.42
TUG08456109.8110.10.315.41
TUG08457110.1110.40.30.74
TUG08458110.4110.70.31.12
TUG08459110.71110.35.28
TUG08460111111.30.30.80
TUG08462111.6111.90.32.66
TUG08463111.9112.20.31.45
TUG08464112.2112.50.31.22
TUG08466112.5112.80.31.50
TUG08467112.8113.10.32.67
TUG08468113.1113.40.33.47
TUG08469113.4113.70.32.92
TUG08470113.71140.32.93
TUG08471114114.30.38.74
TUG08473114.6114.90.37.36
TUG08474114.9115.50.60.90
TUG08475115.5115.80.37.20
TUG08476115.8116.10.33.14
TUG08477116.1116.40.30.92
TUG08479116.71170.33.62
TUG08481117117.30.315.85
TUG08482117.3117.60.32.06
TUG08483117.6117.90.31.95
TUG08484117.9118.20.30.58
TUG08485118.2118.50.35.51
TUG08486118.5118.80.36.35
TUG08487118.8119.10.338.27
TUG08488119.1119.40.33.02
TUG08489119.4119.70.31.41
TUG08490119.71200.32.19
TUG08494122.4122.70.31.35
TUG08946213.6213.90.32.11
TUG08947213.9214.20.30.97
TUG08948214.2214.50.33.03
TUG09446214.5214.80.30.82
TUG08949214.8215.10.31.50
TUG09401215.1215.40.31.61
TUG09402215.4215.70.31.75
TUG09407216.9217.20.33.22
TUG09408217.2217.50.30.18
TUG09409217.5217.80.30.62
TUG09423222.9223.20.30.72
TUG09432226.5226.80.31.41
TUG09444233.4233.70.31.32
TUG09445233.72340.33.13
TUG09447234234.30.36.30
TUG09448234.3234.60.32.08
TUG09529274.8275.10.30.77
TUG09536276.6276.90.30.59
TUG09540277.8278.10.30.64
TUG09566291.3291.60.314.77
TUG09567291.6291.90.34.01
TUG09568291.9292.20.316.55
TUG09569292.2292.50.317.85
TUG09570292.5292.80.31.75
TUG09582299.1299.40.32.12
TUG09583299.4299.70.31.94
TUG09584299.73000.30.63
TUG09585300300.30.31.13
TUG09586300.3300.60.30.99
TUG09587300.6300.90.30.79
TUG09588300.9301.20.34.31
TUG09591301.8302.10.31.58
TUG09594302.73030.30.92
TUG09595303303.30.30.78
TUG09605308.1308.40.31.28
TUG09614311.73120.31.35
TUG09616312312.30.32.61
TUG09617312.3312.60.30.08
TUG09619313.2313.50.34.56
TUG09620313.5313.80.33.54
TUG09621313.8314.10.32.47
TUG09622314.1314.40.31.65
TUG09625315.3315.60.31.25
TUG09626315.6315.90.37.71
TUG09628316.8317.10.30.54
TUG09629317.1317.40.32.57
TUG09631317.4317.70.31.00
TUG09633318318.30.31.42
TUG09634318.3318.60.33.11
TUG09635318.6318.90.35.42
TUG09636318.9319.20.34.25
TUG09637319.2319.50.37.68
TUG09638319.5319.80.35.78
TUG09639319.8320.10.30.85
TUG09641320.4320.70.33.19
TUG09642320.73210.33.49
TUG09643321321.30.37.93
TUG09644321.3321.60.32.40
TUG09645321.6321.90.32.04
TUG09646321.9322.20.37.42
TUG09647322.2322.50.318.75
TUG09648322.5322.80.312.75
TUG09650322.8323.10.312.55
TUG09651323.1323.40.315.64
TUG09652323.4323.70.319.67
TUG09653323.73240.313.55
TUG09654324324.30.315.18
TUG09655324.3324.60.311.27
TUG09656324.6324.90.314.62
TUG09657324.9325.20.371.01
TUG09658325.2325.50.35.61
TUG09659325.5326.40.90.60
TUG09660326.4326.70.33.97
TUG09661326.73270.34.93
TUG09662327327.30.311.64
TUG09663327.3327.60.315.86
TUG09667328.5329.40.90.98
TUG09668329.4329.70.32.77
TUG09669329.73300.32.58
TUG09670330330.30.36.51
TUG09671330.3330.60.34.28
TUG09672330.6330.90.36.21
TUG09694345.3345.60.30.60
TUG09695345.6345.90.34.62
TUG09696345.9346.20.34.07
TUG09697346.2346.50.31.76
TUG09699346.8347.10.32.13
TUG09703348.3348.60.333.25
TUG09704348.6348.90.33.52
TUG09703348.3348.60.333.25
TUG09707350.1350.40.312.62
TUG09710351.3351.60.33.20
TUG09711351.6351.90.30.51
TUG09733366.3366.60.31.26
TUG09734366.6366.90.32.37
TUG09736367.5367.80.30.80
TUG09737367.8368.10.311.02
TUG09738368.1368.40.37.96
TUG09739368.4368.70.33.68
TUG09740368.73690.36.95
TUG09741369369.30.31.82
TUG09742369.3369.60.31.29
TUG09744369.9370.20.34.11
TUG09745370.2370.50.33.89
TUG09746370.5370.80.34.54
TUG09759380.73810.32.63
TUG09760381381.60.623.15
TUG09761381.6381.90.320.60
TUG09762381.9382.20.36.13
TUG09763382.2382.50.33.37
TUG09764382.5382.80.30.64
TUG09777391.8392.10.31.08
TUG09778392.1392.40.31.08
TUG09779392.4392.70.30.89
TUG09781392.73930.30.55
TUG09783393.6393.90.30.65
TUG09784393.9394.20.30.54
TUG09785394.2394.50.32.90
TUG09786394.5394.80.32.34
TUG09787394.8395.10.33.74
TUG09788395.1395.40.32.82
TUG09789395.4395.70.31.98
TUG09790395.73960.31.55
TUG09792396.3396.60.32.25
TUG09794396.9397.20.30.44
TUG09795397.2397.50.31.78
TUG09796397.5397.80.33.20
TUG09797397.8398.10.31.27
TUG09798398.1398.40.315.27
TUG09799398.4398.70.32.96
TUG09801398.73990.35.34
TUG09802399399.30.32.38
TUG09803399.3399.60.32.93
TUG09804399.6400.50.94.00
TUG09805400.5400.80.30.68
TUG09806400.8401.10.32.41
TUG09807401.1401.40.32.06
TUG09808401.4401.70.31.61
TUG09809401.74020.31.67
TUG09811402.3402.60.31.46
TUG09812402.6402.90.30.91
TUG09814403.2403.50.33.71
TUG09817403.8404.10.30.77
TUG09819405405.30.31.56
TUG09811402.3402.60.31.40
TUG09812402.6402.90.30.95
TUG09814403.2403.50.33.57
TUG09817403.8404.10.30.83
TUG09819405405.30.31.61
TUG09824406.8407.10.32.78
TUG09827408408.30.31.21
TUG09828408.3408.60.30.72
TUG09829408.6409.20.61.14
TUG09831409.2409.50.33.27
TUG09832409.5409.80.30.90
TUG09836410.74110.31.86
TUG09837411411.30.32.11
TUG09838411.3411.60.33.40
TUG09839411.6411.90.30.70
TUG09842412.8413.10.30.93
TUG09843413.1413.40.30.76
TUG09848416.14170.90.63
TUG10354418.8419.10.30.82
TUG10355419.1419.40.30.65
TUG10360420.6420.90.30.75
TUG10361420.9421.20.31.05
TUG10362421.2421.50.31.59
TUG10363421.5421.80.31.23
TUG10367422.74230.30.68
TUG10368423423.30.30.72
TUG10373425.1425.40.32.48
TUG10374425.4425.70.32.83
TUG10375425.74260.33.52
TUG10376426426.30.33.77
TUG10377426.3426.60.38.47
TUG10378426.6426.90.31.64
TUG10379426.9427.20.31.53
TUG10381427.2427.80.64.11
TUG10382427.8428.10.31.65
TUG10383428.14290.90.86
TUG10387429.9430.20.30.72
TUG10393433.2433.50.32.04
TUG10394433.5433.80.30.85
TUG10395433.8434.10.30.76
TUG10408440.4440.70.32.36
TUG10413443.1443.40.31.02
TUG10414443.4443.70.36.82
TUG10417444.9445.20.317.94
TUG10418445.2445.50.35.83
TUG10423447447.30.31.16
TUG10425448.2448.50.34.54
TUG10426448.5448.80.30.76
TUG10428450450.30.34.94
TUG10429450.3450.60.31.53
TUG10431450.6450.90.30.97
TUG10432450.9451.20.3138.15
TUG10434451.5451.80.30.76
TUG10435451.8452.10.31.25
TUG10436452.1452.40.31.35
TUG10438452.74530.31.65
TUG10439453453.30.34.70
TUG10440453.3453.60.32.57
TUG10441453.6453.90.34.99
TUG10444454.8455.10.314.02
TUG10445455.1455.40.32.07
TUG10446455.4455.70.31.09
TUG10447455.74560.31.28
TUG10448456456.30.32.55
TUG10453459460.21.21.14
TUG10454460.2460.80.61.00
TUG10455460.84621.21.74
TUG10456462462.30.31.28
TUG10457462.3462.60.324.98
TUG10458462.6462.90.387.13
TUG10459462.9463.80.911.34
TUG10461464.44650.60.67
TUG10463465.9466.20.30.91
TUG10464466.2466.50.31.36
TUG10466466.5466.80.31.27
TUG10467466.8467.10.31.28
TUG10468467.1467.40.33.79
TUG10469467.4467.70.320.93
TUG10470467.74680.320.64
TUG10471468468.30.319.40
TUG10473468.6468.90.33.46
TUG10474468.9469.20.32.78
TUG10475469.2469.50.32.10
TUG10482471.3471.60.30.81
TUG10483471.6471.90.31.03
TUG10484471.9472.20.36.72
TUG10485472.2472.50.30.88
TUG10486472.5472.80.31.45
TUG10487472.8473.10.39.05
TUG10488473.1473.40.31.35
TUG10490473.74740.30.48
TUG10492474.3474.60.30.78
TUG10493474.6474.90.31.37
TUG10494474.9475.20.31.43
TUG10496475.5475.80.31.67
TUG10497475.84771.21.80
TUG10498477477.60.62.64
TUG10500477.6477.90.393.49
TUG10501477.9478.20.31.01
TUG10502478.2478.50.334.17
TUG10503478.5478.80.394.57
TUG10504478.8479.10.335.04
TUG10505479.1479.40.3396.16
TUG10506479.4479.70.325.06
TUG10507479.74800.37.09
TUG10508480480.30.34.06
TUG10509480.3480.60.331.63
TUG10510480.6480.90.35.3
TUG10511480.9481.20.3114.95
TUG10512481.2481.50.31.90
TUG10513481.5481.80.30.83
TUG10514481.8482.10.39.99
TUG10516482.1482.40.30.71
TUG10517482.4482.70.36.64
TUG10518482.74830.36.05
TUG10519483483.30.36.64
TUG10520483.3483.60.32.47
TUG10521483.6483.90.30.93
TUG10522483.9484.20.35.15
TUG10523484.2484.50.310.90
TUG10524484.5484.80.314.76
TUG10525484.8485.10.320.24
TUG10526485.1485.40.321.93
TUG10527485.4485.70.320.79
TUG10528485.74860.332.89
TUG10529486486.30.316.13
TUG10531486.3486.60.32.55
TUG10532486.6486.90.313.04
TUG10533486.9487.20.35.42
TUG10534487.2487.50.33.95
TUG10535487.5487.80.34.89
TUG10536487.8488.10.34.24
TUG10537488.1488.40.34.41
TUG10538488.4488.70.35.21
TUG10539488.74890.31.80
TUG10540489489.30.316.42
TUG10541489.3489.60.37.17
TUG10542489.6489.90.36.47
TUG10543489.9490.20.34.07
TUG10544490.2490.50.34.75
TUG10545490.5490.80.34.86
TUG10546490.8491.10.37.13
TUG10547491.1491.40.311.64
TUG10548491.4491.70.335.68
TUG10549491.74920.322.53
TUG10551492492.30.310.72
TUG10552492.3492.60.325.23
TUG10553492.6492.90.316.77
TUG10554492.9493.20.320.86
TUG10555493.2493.50.323.61
TUG10556493.5493.80.35.85
TUG10557493.8494.10.36.41
TUG10558494.1494.40.34.25
TUG10559494.4494.70.336.13
TUG10560494.74950.319.66
TUG10561495495.30.372.65
TUG10562495.3495.60.3241.21
TUG10563495.6495.90.331.77
TUG10564495.9496.20.351.52
TUG10566496.2496.50.325.17
TUG10567496.5496.80.3100.35
TUG10568496.8497.10.312.86
TUG10569497.1497.40.34.68
TUG10570497.4497.70.333.81
TUG10571497.74980.337.11
TUG10572498498.30.320.74
TUG10573498.3498.60.326.29
TUG10574498.6498.90.3103.54
TUG10575498.9499.20.3340.07
TUG10576499.2499.50.3269.25
TUG10577499.5499.80.3600.42
TUG10578499.8500.10.373.02
TUG10579500.1500.40.313.41
TUG10581500.4500.70.31.85
TUG10582500.7501.30.613.32
TUG10583501.3501.60.326.54
TUG10584501.6501.90.39.04
TUG10585501.9502.20.34.79
TUG10586502.2502.50.33.93
TUG10587502.5502.80.3126.85
TUG10588502.8503.10.3361.90
TUG10589503.1503.40.31.95
TUG10590503.4503.70.33.27
TUG10591503.75040.332.78
TUG10592504504.30.323.63
TUG10596505.2505.50.38.07
TUG10598505.8506.10.318.51
TUG10599506.1506.40.353.78
TUG10602506.75070.37.50
TUG10604507.3507.60.3234.39
TUG10605507.6507.90.32.22
TUG10606507.9508.80.90.58
TUG10612510.3510.60.33.37
TUG10613510.6510.90.31.32
TUG10614510.9511.20.35.53
TUG10616511.2511.50.324.91
TUG10617511.5511.80.364.47
TUG10618511.8512.10.372.56
TUG10619512.1512.40.313.35
TUG10620512.4512.70.32.08
TUG10621512.75130.31.59
TUG10622513513.30.30.74
TUG10623513.3513.60.30.94
TUG10624513.6513.90.30.53
TUG10625513.9514.20.31.17
TUG10626514.2514.50.323.17
TUG10627514.5514.80.30.85
TUG10628514.8515.10.32.39
TUG10629515.1515.40.31.03
TUG10631515.4515.70.30.83
TUG10632515.75160.31.74
TUG10633516516.30.33.50
TUG10634516.3516.60.30.59
TUG10636516.9517.20.30.80
TUG10637517.2517.50.32.99
TUG10638517.5517.80.30.76
TUG10639517.8518.10.33.34
TUG10640518.1518.40.38.94
TUG10641518.4518.70.312.80
TUG10642518.75190.3105.58
TUG10643519519.30.334.42
TUG10644519.3519.60.30.55
TUG10645519.6519.90.30.80
TUG10656522.6522.90.30.59
TUG10657522.9523.20.30.88
TUG10658523.2523.50.30.76
TUG10659523.5523.80.31.09
TUG10660523.8524.10.30.61
TUG10661524.1524.40.32.11
TUG10664525525.30.35.56
TUG10666525.3525.60.37.50
TUG10667525.6525.90.30.87
TUG10668525.9526.20.30.78
TUG10693543.9544.20.30.63
TUG10695544.5544.80.30.75
TUG10696544.8545.10.30.59
TUG10699545.75460.30.81
TUG10701546546.30.30.63
TUG10702546.3546.60.30.59
TUG10706547.5547.80.30.52
TUG10719554.1554.40.30.84

Table 2: Survey details of diamond drill holes referenced in this release

Hole NoCoordinates (Fiji map grid)RLfinal depthdipazimuth
NEm(TN)
TUG-13539207591876459139.2689.4-64149
TUG-13639207591876459139.2617.4-58151
TUG-13839207591876459139.2746.4-64163
TUG-14139207591876459139.2633.0 *-55°162°

* Current depth, hole is still drilling

Qualified Person
In accordance with National Instrument 43-101 – Standards of Disclosure for Mineral Projects (“NI 43-101”), Sergio Cattalani, P.Geo, Senior Vice President Exploration, is the Qualified Person for the Company and has reviewed and is responsible for the technical and scientific content of this news release.

QAQC Procedures
Lion One adheres to rigorous QAQC procedures above and beyond basic regulatory guidelines in conducting its sampling, drilling, testing, and analyses. The Company utilizes its own fleet of diamond drill rigs, using PQ, HQ and NQ sized drill core rods. Drill core is logged and split by Lion One personnel on site. Samples are delivered to and analysed at the Company’s geochemical and metallurgical laboratory in Fiji. Duplicates of all samples with grades above 0.5 g/t Au are both re-assayed at Lion One’s lab and delivered to ALS Global Laboratories in Australia (ALS) for check assay determinations. All samples for all high-grade intercepts are sent to ALS for check assays. All samples are pulverized to 80% passing through 75 microns. Gold analysis is carried out using fire assay with an AA finish. Samples that have returned grades greater than 10.00 g/t Au are then re-analysed by gravimetric method. For samples that return greater than 0.50 g/t Au, repeat fire assay runs are carried out and repeated until a result is obtained that is within 10% of the original fire assay run. For samples with multiple fire assay runs, the average of duplicate runs is presented. Lion One’s laboratory can also assay for a range of 71 other elements through Inductively Coupled Plasma Optical Emission Spectrometry (ICP-OES), but currently focuses on a suite of 9 important pathfinder elements. All duplicate anomalous samples are sent to ALS labs in Townsville QLD and are analysed by the same methods (Au-AA26, and Au-GRA22 where applicable). ALS also analyses for 33 pathfinder elements by HF-HNO3-HClO4 acid digestion, HCl leach and ICP-AES (method ME-ICP61).

About Lion One Metals Limited
Lion One’s flagship asset is 100% owned, fully permitted high grade Tuvatu Alkaline Gold Project, located on the island of Viti Levu in Fiji. Lion One envisions a low-cost high-grade underground gold mining operation at Tuvatu coupled with exciting exploration upside inside its tenements covering the entire Navilawa Caldera, an underexplored yet highly prospective 7km diameter alkaline gold system. Lion One’s CEO Walter Berukoff leads an experienced team of explorers and mine builders and has owned or operated over 20 mines in 7 countries. As the founder and former CEO of Miramar Mines, Northern Orion, and La Mancha Resources, Walter is credited with building over $3 billion of value for shareholders.

On behalf of the Board of Directors of
Lion One Metals Limited
Walter Berukoff
Chairman and CEO

For further information
Contact Investor Relations
Toll Free (North America) Tel: 1-855-805-1250
Email: info@liononemetals.com
Website: www.liononemetals.com

Neither the TSX Venture Exchange nor its Regulation Service Provider
accepts responsibility for the adequacy or accuracy of this release.

This press release may contain statements that may be deemed to be “forward-looking statements” within the meaning of applicable Canadian securities legislation. All statements, other than statements of historical fact, included herein are forward-looking information. Generally, forward-looking information may be identified by the use of forward-looking terminology such as “plans”, “expects” or “does not expect”, “proposed”, “is expected”, “budget”, “scheduled”, “estimates”, “forecasts”, “intends”, “anticipates” or “does not anticipate”, or “believes”, or variations of such words and phrases, or by the use of words or phrases which state that certain actions, events or results may, could, would, or might occur or be achieved. This forward-looking information reflects Lion One Metals Limited’s current beliefs and is based on information currently available to Lion One Metals Limited and on assumptions Lion One Metals Limited believes are reasonable. These assumptions include, but are not limited to, the actual results of exploration projects being equivalent to or better than estimated results in technical reports, assessment reports, and other geological reports or prior exploration results. Forward-looking information is subject to known and unknown risks, uncertainties and other factors that may cause the actual results, level of activity, performance or achievements of Lion One Metals Limited or its subsidiaries to be materially different from those expressed or implied by such forward-looking information. Such risks and other factors may include, but are not limited to: the stage development of Lion One Metals Limited, general business, economic, competitive, political and social uncertainties; the actual results of current research and development or operational activities; competition; uncertainty as to patent applications and intellectual property rights; product liability and lack of insurance; delay or failure to receive board or regulatory approvals; changes in legislation, including environmental legislation, affecting mining, timing and availability of external financing on acceptable terms; not realizing on the potential benefits of technology; conclusions of economic evaluations; and lack of qualified, skilled labour or loss of key individuals. Although Lion One Metals Limited has attempted to identify important factors that could cause actual results to differ materially from those contained in forward-looking information, there may be other factors that cause results not to be as anticipated, estimated or intended. Accordingly, readers should not place undue reliance on forward-looking information. Lion One Metals Limited does not undertake to update any forward-looking information, except in accordance with applicable securities laws.

Categories
Energy Junior Mining Precious Metals

Palladium: The Secret Weapon in Fighting Pollution

Source: https://www.visualcapitalist.com/palladium-the-secret-weapon-in-fighting-pollution/

Despite the growing hype around electric vehicles, conventional gas-powered vehicles are expected to be on the road well into the future.

As a result, exhaust systems will continue to be a critical tool in reducing harmful air pollution.

The Power of Palladium

Today’s infographic comes to us from North American Palladium, and it demonstrates the unique properties of the precious metal, and how it’s used in catalytic converters around the world.

In fact, palladium enables car manufacturers to meet stricter emission standards, making it a secret weapon for fighting pollution going forward.

Palladium: The Secret Weapon in Fighting Pollution

The world is in critical need of palladium today.

It’s the crucial metal in reducing harmful emissions from gas powered vehicles—as environmental standards tighten, cars are using more and more palladium, straining global supplies.

What is Palladium?

Palladium is one of six platinum group metals which share similar chemical, physical, and structural features. Palladium has many uses, but the majority of global consumption comes from the autocatalyst industry.

In 2018, total gross demand for the metal was 10,121 million ounces (Moz), of which 8,655 Moz went to autocatalysts. These were the leading regions by demand:

  • North America: 2,041 Moz
  • Europe: 1,883 Moz
  • China: 2,117 Moz
  • Japan: 859 Moz
  • Rest of the World: 1,755 Moz

Catalytic Converters: Palladium vs. Platinum

The combustion of gasoline creates three primary pollutants: hydrocarbons, nitrogen oxides, and carbon monoxide. Catalytic converters work to alter these poisonous and often dangerous chemicals into safer compounds.

In order to control emissions, countries around the world have come up with strict emissions standards that auto manufacturers must meet, but these are far from the reality of how much pollutants are emitted by drivers every day.

Since no one drives in a straight line or in perfect conditions, stricter emissions testing is coming into effect. Known as Real Driving Emissions (RDE), these tests reveal that palladium performs much better than platinum in a typical driving situation.

In addition, the revelation of the Volkswagen emission scandal (known as Dieselgate) further undermines platinum use in vehicles. As a result, diesel engines are being phased out in favor of gas-powered vehicles that use palladium.

Where does Palladium Come From?

If the world is using all this palladium, where is it coming from?

Approximately, 90% of the world’s palladium production comes as a byproduct of mining other metals, with the remaining 10% coming from primary production.

In 2018, there was a total of 6.88 million ounces of mine supply primarily coming from Russia and South Africa. Conflicts in these jurisdictions present significant risks to the global supply chain. There are few North American jurisdictions, such as Ontario and Montana, which present an opportunity for more stable primary production of palladium.

Long Road to Extinction

The current price of palladium is driven by fundamental supply and demand issues, not investor speculation. Between 2012 and 2018, an accumulated deficit of five million ounces has placed pressures on readily available supplies of above-ground palladium.

Vehicles with internal combustion engines (ICE) will continue to dominate the roads well into the future. According to Bloomberg New Energy Finance, it will not be until 2040 that ICE vehicles will dip below 50% of new car sales market, in favor of plug-in and hybrid vehicles. Stricter emissions standards will further bolster palladium demand.

The world needs stable and steady supplies of palladium today, and well into the future.

Categories
Energy Junior Mining Precious Metals

Silver Demand and Supply Trends to Watch

BY MARIA SMIRNOVA | THURSDAY, MAY 26, 2022

My colleague Paul Wong wrote about silver’s recent flat performance in his recent monthly, April Pressures Risk Assets. Wong aptly explained silver’s interesting role: “Silver has a distinct duality pricing function that, at times, may be contradictory due to its industrial component and its monetary role.”

In this report, we provide our current outlook for silver. Ultimately, we believe recent market dynamics are creating short-term headwinds for precious metals from a monetary standpoint, but those trends could reverse – and silver supply constraints are likely to become more relevant in the face of sustained demand, with notable momentum in silver’s industrial uses related to the green energy transition.The strength of silver’s fundamentals has been fueled by strong gains across all demand components.

Silver’s Behavior Since COVID

Silver bullion1 posted a 47% gain in 2020 (see red oval in Figure 1) and has recently been in a holding pattern. Despite this,  silver traded in the range of $22-$28 in 2021, and its average price for the year reached a nine-year high of $25.14.

Since silver’s outperformance in 2020, the global macroeconomic environment has changed dramatically and become increasingly volatile. Markets continue to grapple with the impacts of the COVID pandemic, geopolitical concerns have increased substantially, and the recent sell-off of stocks has not yet found a stopping point. Rising interest rates have created a headwind for precious metals assets, particularly gold and silver.

Silver is More Volatile than Gold

Silver’s response to current macroeconomic challenges has been to follow its traditional pattern of reacting with more volatility than gold. Silver is down modestly YTD; priced at $23.35 per ounce on December 31, 2021, it was $21.72 as of May 23, 2022, a decline of 7.02%. Gold, by contrast, gained 1.38% YTD2 through May 23. Both are strong showings, given the S&P 5003 declined 16.65% in the same period.

Figure 1. Silver Price vs. Gold Price (2000-2022)

Silver Chart Figure 1 Source: Bloomberg. Data as of 4/30/2022. Included for illustrative purposes only. Past performance is no guarantee of future results.

But to fully understand our current positive outlook for silver, we should revisit the supply-demand dynamics of the silver market — the fundamental relationship that directs long-term pricing trends. To assess these dynamics, we looked to the annual silver outlook published by the Silver Institute and Metals Focus in April, the World Silver Survey 2022.

Although the risk-off tenor of the moment may be a headwind for short-term silver pricing trends, over the longer term, we believe silver supply constraints will become more relevant in the face of sustained, growing demand.

Silver Supply Headwinds in the Post-COVID Era

As expected on the back of silver’s price rise in 2020, silver mining rebounded in 2021 — but to a lesser degree than forecasted. Mine production was up about 5% in 2021 from 2020 levels. Recycling volumes grew by 7% as higher pricing attracted more scrap to the market. Still, Metals Focus analysts had predicted growth for mining supply to be higher, in the range of 8%. As shown in Figure 2, silver supplies have dropped into a deficit since last year, and Metals Focus analysts predict another sizeable deficit of 72 million ounces in 2022.

Figure 2. Silver Supply Dives into Deficit in 2021

Silver Chart Figure 2
Source: Metals Focus, April 2022. Included for illustrative purposes only. Past performance is no guarantee of future results.

In addition to tighter silver supply, silver grades have been declining for several years. Ore grades depend on several things, including rising silver prices (which make it profitable to accept lower grades) and how the silver is mined. Going forward, mining companies will likely have to invest more in exploration and development in order to increase or even maintain supply.

Figure 3. Grades of Mined Silver Ore have Declined ~55% Since 2005

Silver Chart Figure 3

Source: CPM Group. Average grade data on seven primary silvers mines unsubstantiated by SPM Group, 3/16/2021. Included for illustrative purposes only. Past performance is no guarantee of future results. 

Byproduct prices are also a big input for total silver mining activity. More than 70% of silver mining supply is a result of byproduct mining. Higher prices for byproduct metals — lead, zinc and copper, for instance — drive higher mining activity for those metals, essentially subsidizing silver mining in the process. That impact has contributed to supply in recent quarters. But, it’s a tailwind to supply that is potentially at risk. If macroeconomic conditions soften in the medium-term and price support eases for those byproduct metals, silver mining supply is also vulnerable. Without the subsidy effect of higher byproduct prices, the outlook for silver supply could be even weaker than expected.

Figure 4. Higher Prices for Byproduct Metals have Helped Silver Mining Output

Silver Chart Figure 4
Source: Bloomberg, as of 5/13/2022. Orange = Copper Futures. Green = Zinc Futures (3 month contracts). Blue = Silver Spot. Gold = Gold Spot. Included for illustrative purposes only. Past performance is no guarantee of future results.

Miners must also contend with inflation, which directly impacts their fuel costs in production and exploration. If costs are expected to increase and silver miners aren’t sufficiently confident in higher silver prices, it’s difficult to envision a scenario where they are likely to ramp up mining activity substantially. There are also continued reports of worker shortages in silver mining as the tight labor market and waves of COVID outbreaks hamper operations in some locations.

These supply trends have already resulted in a drop in global silver reserves. In 2021, 122 million ounces (Moz) of silver were added to reserves, but 270 Moz were taken in production, as shown in Figure 5. Reserves dropped by about 4% to 3,412 Moz at yearend. Exploration and discoveries were also underwhelming in 2021. Globally, total identified silver resources (excluding reserves) only grew 1% last year. At the same time, there was subdued merger and acquisition activity in 2021 in the primary silver sector, with only eight deals totaling just US$11 million.

Figure 5. Global Silver Mine Reserves Drop in 2021

Primary silver reserves declined as mining depletion exceeded additions.


Source: Metals Focus, April 2022. Included for illustrative purposes only. Past performance is no guarantee of future results.

Silver Demand: Green Technologies Support Sustained Growth

While silver supply faces some constricting trends, the rebound in demand could prove sustainable, thanks to silver’s critical role in growing green energy initiatives.

Photovoltaic demand — silver inputs for solar panel production — is a prime example, growing 13% as a category in 2021 and contributing to a new record high for global silver demand in 2021. This rebound, even in the face of the supply-chain constraints that have plagued global manufacturing since COVID began, reflects the substantial green-energy investment that is underway.

We believe this trend could drive continued demand growth even if other manufacturing activity softens incrementally. Industrial demand overall accounts for about half of annual silver demand, and photovoltaic demand is about a fifth of all industrial offtake (and growing in share, since photovoltaic is growing faster than overall industrial use at large).

Figure 6. Silver Industrial Demand Tops Pre-COVID Highs, with Higher Photovoltaic (PV) Fabrication

Silver Chart Figure 6
Source: Metals Focus, April 2022. Included for illustrative purposes only. Past performance is no guarantee of future results.

The outlook for green energy investment has only strengthened in the face of the Russia-Ukraine conflict, which is pushing global sentiment towards energy security and renewables. Vehicle electrification and renewable energy demand could have more staying power in an environment where developed economies are turning a corner toward weaker growth or even recession. Industry forecasts project that silver demand for electric vehicles is likely to eventually surpass the volume of silver used in photovoltaics. As Paul Wong discussed last month, silver prices have demonstrated a growing correlation to energy transition equities. According to Wong, “Silver pricing has become highly correlated (R-square4 of 0.82) with energy transition equities, as illustrated in Figure 7. This Energy Transition Index is comprised of 12 large ETFs in the energy transition space (solar, renewables, wind, carbon, infrastructure, uranium, etc.).”

Figure 7. Silver Correlates with Energy Transition Equities

Silver Chart Figure 7
Source: Bloomberg and Sprott Asset Management LP. Data as of 4/30/2022. Included for illustrative purposes only. You cannot invest directly in an index. Past performance is no guarantee of future results.

The Energy Transition Story is a Large Force for Silver

The current environment may be dominated by risk-off behavior, but that’s not the primary factor for longer-term silver demand, particularly given its dual nature as a precious metal and an industrial metal.

We see the energy transition story as a large force for silver demand — this year and in future years. The geopolitical issues dominating the current environment only strengthen that trend, even as they weaken other components of silver demand. The pandemic and the war in Ukraine have both served to reinforce investment in energy-transition initiatives. 

Silver is a critical component of electric vehicles (EVs), which are experiencing strong demand growth globally. EV sales are slated to represent >30% of total light-vehicle sales by 2030, mainly stemming from China, Europe and the U.S. EVs are going to require a new set of manufacturing materials versus traditional ICE (internal combustion vehicles) vehicles. Silver’s high conductivity and ductility make EVs more efficient by establishing lightweight but strong electrical connections between batteries and other car components. Battery electric vehicles use between ~25-50 grams of silver per vehicle.

At present, EV inventories remain backlogged. Ford announced in January that it would double production of its electric F-150 pickup truck to work through a three-year backlog. Tesla reported that some models were backlogged until 2023, even after price increases. Solar panels have also been backlogged in recent months, according to some reports.

Figure 8. A Surge in EVs

Silver Chart Figure 8
Source: BMO Capital Markets, HIS, CAAM, InsideEVs, Industry Reports as of 2/07/2022.

Positive Non-Industrial Demand Trends

Looking at non-industrial demand for silver, trends have been milder but positive. In photography — which represents a small and declining share of silver demand — there was a small post-COVID rebound related to the catch-up trend of X-rays in healthcare after lockdowns subsided. Jewelry and silverware are more closely tied to economic growth, and both rebounded substantially in 2021. The return of weddings and social events in India supported higher jewelry production. Italy and China also accounted for healthy rebounding demand for jewelry amid economic recoveries. Silverware also reflected these trends. However, jewelry and silverware purchases both remained below pre-COVID levels.

Physical demand for silver coins and bars is the most volatile category of demand (and hard to get real-time data for mid-year). Physical demand grew 36% in 2021 over the year prior, driving the category up to represent a full quarter of global demand for the year. Bar and coin investments have not retreated since 2016/17.

Figure 9. Silver Bar and Coin Investment Surged by 36% in 2021

Silver Chart Figure 9
Source: Metals Focus, April 2022. Included for illustrative purposes only. Past performance is no guarantee of future results.

Why We Remain Bullish on Silver

From a pricing standpoint, silver is historically undervalued relative to gold right now, and offers an attractive investment opportunity. We see a picture of silver fundamentals where supply trends cannot keep up with longer-term demand. Overall, the silver market has been in a physical deficit since 2019, and silver mine supply has been in decline since 2016. There has been a lack of funds going into silver mine development and the timelines from discovery to production have gotten longer. On the demand side, all segments of silver demand are rebounding, led by industrial, jewelry and physical investment. We continue to believe that silver is likely to benefit from supply constraints in the face of growing demand. We expect green technology and de-carbonization trends to continue and increase, even if economic growth slows globally.

1Silver bullion is measured by Bloomberg Silver (XAG Curncy) U.S. dollar spot rate.
2Gold bullion is measured by the Bloomberg GOLDS Comdty Spot Price.
3The S&P 500 or Standard & Poor’s 500 Index is a market-capitalization-weighted index of the 500 largest U.S. publicly traded companies.
4R-squared values range from 0 to 1 and are commonly stated as percentages from 0% to 100%. An R-squared of 100% means that all movements of a security (or another dependent variable) are completely explained by movements in the index (or the independent variable(s) you are interested in). Source: Investopedia.

Maria Smirnova
Maria Smirnova, MBA, CFA
Managing Director, Sprott Inc.; Senior Portfolio Manager & Chief Investment Officer, Sprott Asset Management

Read Full Bio

Sprott Physical
Silver Trust

Important Disclosure

Past performance is no guarantee of future results. You cannot invest directly in an index. Investments, commentary and statements are that of the author and may not be reflective of investments and commentary in other strategies managed by Sprott Asset Management USA, Inc., Sprott Asset Management LP, Sprott Inc., or any other Sprott entity or affiliate. Opinions expressed in this commentary are those of the author and may vary widely from opinions of other Sprott affiliated Portfolio Managers or investment professionals.

This content may not be reproduced in any form, or referred to in any other publication, without acknowledgment that it was produced by Sprott Asset Management LP and a reference to sprott.com. The opinions, estimates and projections (“information”) contained within this content are solely those of Sprott Asset Management LP (“SAM LP”) and are subject to change without notice. SAM LP makes every effort to ensure that the information has been derived from sources believed to be reliable and accurate. However, SAM LP assumes no responsibility for any losses or damages, whether direct or indirect, which arise out of the use of this information. SAM LP is not under any obligation to update or keep current the information contained herein. The information should not be regarded by recipients as a substitute for the exercise of their own judgment. Please contact your own personal advisor on your particular circumstances. Views expressed regarding a particular company, security, industry or market sector should not be considered an indication of trading intent of any investment funds managed by Sprott Asset Management LP. These views are not to be considered as investment advice nor should they be considered a recommendation to buy or sell. SAM LP and/or its affiliates may collectively beneficially own/control 1% or more of any class of the equity securities of the issuers mentioned in this report. SAM LP and/or its affiliates may hold short position in any class of the equity securities of the issuers mentioned in this report. During the preceding 12 months, SAM LP and/or its affiliates may have received remuneration other than normal course investment advisory or trade execution services from the issuers mentioned in this report.

SAM LP is the investment manager to the Sprott Physical Bullion Trusts (the “Trusts”). Important information about the Trusts, including the investment objectives and strategies, purchase options, applicable management fees, and expenses, is contained in the prospectus. Please read the document carefully before investing. Investment funds are not guaranteed, their values change frequently and past performance may not be repeated. This communication does not constitute an offer to sell or solicitation to purchase securities of the Trusts. You will usually pay brokerage fees to your dealer if you purchase or sell units of the Trusts on the Toronto Stock Exchange (“TSX”) or the New York Stock Exchange (“NYSE”). If the units are purchased or sold on the TSX or the NYSE, investors may pay more than the current net asset value when buying units or shares of the Trusts and may receive less than the current net asset value when selling them.

The risks associated with investing in a Trust depend on the securities and assets in which the Trust invests, based upon the Trust’s particular objectives. There is no assurance that any Trust will achieve its investment objective, and its net asset value, yield and investment return will fluctuate from time to time with market conditions. There is no guarantee that the full amount of your original investment in a Trust will be returned to you. The Trusts are not insured by the Canada Deposit Insurance Corporation or any other government deposit insurer. Please read a Trust’s prospectus before investing.

The information contained herein does not constitute an offer or solicitation to anyone in the United States or in any other jurisdiction in which such an offer or solicitation is not authorized or to any person to whom it is unlawful to make such an offer or solicitation. Prospective investors who are not resident in Canada or the United States should contact their financial advisor to determine whether securities of the Funds may be lawfully sold in their jurisdiction.

The information provided is general in nature and is provided with the understanding that it may not be relied upon as, nor considered to be, the rendering or tax, legal, accounting or professional advice. Readers should consult with their own accountants and/or lawyers for advice on their specific circumstances before taking any action.

Categories
Energy Junior Mining Precious Metals

Metallic Minerals Drills 4.6 Meters of 983 g/t Silver Equivalent at the Keno Silver Project in Yukon, Canada

VANCOUVER, BC / ACCESSWIRE / May 26, 2022 / Metallic Minerals (TSX.V:MMG)(OTCQB:MMNGF) (“Metallic Minerals“, or the “Company“) is pleased to report the final set of assay results from its 2021 drilling completed at the Company’s 100%-owned, 166-square-kilometer Keno Silver Project located within the historic, high-grade Keno Hill silver district in Canada’s Yukon Territory. These drill tests were targeted at extending high-grade silver-gold-lead-zinc mineralization at the Formo deposit in the West Keno target area, one of several advanced stage targets moving toward an initial NI 43-101 mineral resource estimate for the Keno Silver project.

Highlights

  • Drilling in 2021 and 2020 by Metallic Minerals at the Formo deposit intercepted both high-grade Keno-style Ag-Au-Pb-Zn veins and broader zones of potentially bulk mineable mineralization.
  • FOR21-05 returned three intervals at over 1,000 g/t silver equivalent (“Ag Eq”) from 92.7 m to 115.5 m for a total of 22.8 m grading 219.5 g/t Ag Eq including 0.5 m of 1,657.8 g/t Ag Eq with up to 17 g/t Au, 0.7 m of 1,408.8 g/t Ag Eq and 0.5 m of 1,649.9 g/t Ag Eq.
  • FOR21-06 intercepted multiple zones of mineralization with 4.6 m of 938.3 g/t Ag Eq including 3,229.9 g/t Ag Eq over 1.0 m within a broader zone of 11.4 m grading 413.7 g/t Ag Eq.

The Formo target area hosts multiple parallel vein structures and mineralized zones within a broader structural envelope that remains open to expansion and shows excellent opportunities for resource delineation. Results from 2021 drilling intercepted extremely high grades, including FOR21-05 returning three intervals over 1,000 g/t silver Ag Eq and FOR21-06 with 3,229.9 g/t Ag Eq over 1.0 m within an interval of 4.6 m of 938.3 g/t Ag Eq (see Table 1 below). Both zones were encountered at shallow depths of less than 150 m down hole and these intersections extend high-grade silver mineralization below the 2020 drilling and the historically productive Formo mine. Geophysical and geochemical surveys, enhanced by the 2021 fieldwork, demonstrate significant resource potential opportunities in the Formo target area.

The Formo vein structure lies at the intersection of a north-easterly extension of the Bermingham-Calumet and the Elsa vein system, which are hosts to the some of the largest historic producing mines and current resources and reserves in the Keno Hill silver district (see Figure 1). The Formo Target remains open for expansion along trend and down dip and has several untested surface targets.

Metallic Minerals President, Scott Petsel, stated, “These exciting results from this most recent follow-up drilling program at the Formo target area in the western Keno Hill District, combined with the exceptional 2020 drill results, demonstrate the potential to delineate significant, high-grade resources at the Keno Silver project. Our team has done remarkable work to build on our understanding of the geology and the important controls to mineralization in the highly productive Keno Hill silver district.”

“As we prepare to embark on our upcoming exploration campaign, we recognize the importance of moving toward the definition of an inaugural resource estimates at Keno Silver, with Formo and Caribou being the two most advanced in that regard. We are also very focused on and enthusiastic about conducting robust follow-up work on our recent discoveries of both high-grade silver veins and bulk mineable mineralization in the East Keno area. We expect to provide updates with respect to planned programs at both Keno Silver and the La Plata project in Colorado over the coming weeks and look forward to meeting with investors during the upcoming Prospectors and Developers Conference in Toronto in mid-June.”

Upcoming Events

PDAC 2022 – Metallic will join fellow Metallic Group members at PDAC in Toronto, May 13-15 (Booth IE2851).

Yukon Property Tours & Conference – Metallic will be in Dawson City June 20-24 for the 2022 Yukon Property Tours

Figure 1. Keno Silver Project

Metallic Minerals Corp., Wednesday, May 25, 2022, Press release picture

West Keno Exploration Program and Formo Target

The Western Keno Hill district is host to the largest historic production and current resources in the prolific Keno Hill silver district. The Formo target is located at the intersection of a north-easterly structural zone extending from the Hector-Calumet mine, which was the largest producer in the district producing nearly 100 million ounces of silver and the Elsa structural trend, which was the second largest silver producer in the district (see Figure 2). The historic Formo mine produced silver at various times since the 1930s from high-grade vein structures that graded an average of over 5,000 g/t silver1. The majority of this historic production came from an open pit located alongside of the Silver Trail highway between the Elsa townsite and Keno City.

Metallic Minerals’ exploration efforts at the Formo target area have integrated recent drilling with surface and underground sampling into a 3D geologic model, along with multi-spectral studies and geophysical surveys covering the area (see Figure 3). In addition to the mineralization at the known Formo deposit, two new surface targets have been identified through surface soil and rock sampling along the same structural corridors that show potential to host high-grade and bulk tonnage Keno-style Ag-Au-Pb-Zn. The opportunity to significantly expand the known mineralization defined from underground sampling and surface drilling, as well as the potential to define new high-grade deposits along the main mineralized structural corridor, positions Formo as a top priority target for near-term resource definition at the Keno Silver project.

Table 1 – Significant Drill Results from 2020-2021 at the Formo Target Area

DDH Hole IDFrom (m)To (m)Width (m)Ag Eq (g/t)Ag (g/t)Au (g/t)Pb (%)Zn (%)
FOR21-0592.7115.522.8219.5690.40.302.07
94.695.10.51,657.82517.00.010.44
98.81089.2430.51640.10.694.85
102.4103.10.71,408.83610.02.1720.09
107107.50.51,649.94210.11.5324.20
FOR21-0696971.0221.81550.00.451.03
111.612311.4413.72340.01.972.07
114.41194.6938.35280.14.484.82
1161171.03,229.91,9780.413.0914.97
121.21231.8202.81280.01.000.76
FOR-20-00150.9576.1284.52180.00.31.14
including50.953.953.05447.53690.00.111.52
FOR-20-00249.4552.32.8548220.00.180.39
FOR-20-00396100.14.12,536.01,1650.021.7411.32
including96993.03,425.91,5680.029.4515.35
FOR-20-00489.895.96.1367.62250.02.041.35
including91.893.71.9698.44540.03.482.32
including93.293.70.51,083.66010.07.334.25
FOR-20-005104.76105.450.69365.01460.01.323.52
152.17152.670.585.560.40.010.76
FOR-20-006137.63139.782.15740.63320.03.066.04
including139.13139.780.652,255.91,0010.18.9218.92
FOR-20-00798.198.650.5577120.00.121.2
107.65108.150.586.1460.20.240.34
125.55126.050.575.510.201.23
FOR-20-008116.45116.950.5289.21780.12.20.42
including168.6169.61.079.2570.00.250.25
FOR-20-00969.770.140.4467.4150.00.210.91
113.2113.70.5211.6260.40.063
FOR-20-01155.359.74.475.630.00.050.04
including57.758.60.9307.71950.02.790.1

Silver equivalent (Ag Eq) values assume Ag $19/oz, Pb $1.05/lb, Zn $1.30/lb, Au $1,800/oz and 100% metallurgical recovery. Sample intervals are based on measured drill intersect lengths and are believed to be representative of true widths.

Figure 2 – West Keno Plan Map

Metallic Minerals Corp., Wednesday, May 25, 2022, Press release picture

Figure 3 – Formo Vein Long Section (Looking NW)

Metallic Minerals Corp., Wednesday, May 25, 2022, Press release picture

About Metallic Minerals

Metallic Minerals Corp. is a growth-stage exploration company, focused on high-grade silver and gold projects in underexplored, brownfields mining districts of North America. Our objective is to create shareholder value through a systematic, entrepreneurial approach to exploration in the Keno Hill silver district, La Plata silver-gold-copper district, and Klondike gold district through new discoveries and advancing resources to development. Metallic Minerals has consolidated the second-largest land position in the historic Keno Hill silver district of Canada’s Yukon Territory, directly adjacent to Alexco Resource Corp’s operations, with nearly 300 million ounces of high-grade silver in past production and current M&I resources. In addition, exploration at the recently acquired La Plata silver-gold-copper project in southwestern Colorado is targeting a silver and gold-enriched copper porphyry and adjacent high-grade silver and gold epithermal systems. The Company also continues to add new production royalty leases on its holdings in the Klondike gold district in the Yukon. All three districts have seen significant mineral production and have existing infrastructure, including power and road access. Metallic Minerals is led by a team with a track record of discovery and exploration success on several major precious and base metal deposits, as well as having large-scale development, permitting and project financing expertise.

About the Metallic Group of Companies

The Metallic Group is a collaboration of leading precious and base metals exploration and development companies, with a portfolio of large, brownfields assets in established mining districts adjacent to some of the industry’s highest-grade producers of silver and gold, platinum and palladium, and copper. Member companies include Metallic Minerals in the Yukon’s high-grade Keno Hill silver district and La Plata silver-gold-copper district of Colorado, Granite Creek Copper in the Yukon’s Minto copper district, and Group Ten Metals in the Stillwater PGM-nickel-copper district of Montana and Kluane district in the Yukon. The founders and team members of the Metallic Group include highly successful explorationists formerly with some of the industry’s leading explorer/developers and major producers. With this expertise, the companies are undertaking a systematic approach to exploration and development using new models and technologies to facilitate discoveries in these proven, but under-explored, mining districts. Members of the Metallic Group have been recognized as recipients of awards for excellence in environmental stewardship demonstrating commitment to responsible resource development and appropriate ESG practices. The Metallic Group is headquartered in Vancouver, BC, Canada, and its member companies are listed on the Toronto Venture, US OTCQB and Frankfurt stock exchanges.

FOR FURTHER INFORMATION, PLEASE CONTACT:

Website: mmgsilver.com
Email: cackerman@mmgsilver.com
Phone: 604-629-7800
Toll Free: 1-888-570-4420

Qualified Person

The disclosure in this news release of scientific and technical information regarding exploration projects on Metallic Minerals’ mineral properties has been reviewed and approved by Scott Petsel, P.Geo., President, who is a Qualified Person as defined by National Instrument 43-101 – Standards of Disclosure for Mineral Projects (“NI 43-101”).

Quality Assurance / Quality Control

All samples were assayed by 36 Element Aqua Regia Digestion ICP-MS methods at Bureau Veritas labs in Vancouver. with sample preparation in Whitehorse, Yukon and geochemical analysis in Vancouver, British Columbia. Samples with over limit silver and gold were re-analyzed using a 30-gram fire assay fusion with a gravimetric finish. Over-limit lead and zinc samples were analyzed by multi-acid digestion and atomic absorption spectrometry. All results have passed the QAQC screening by the lab and the company utilized a quality control and quality assurance protocol for the project, including blank, duplicate, and standard reference samples.

Forward-Looking Statements

Forward Looking Statements: This news release includes certain statements that may be deemed “forward-looking statements”. All statements in this release, other than statements of historical facts including, without limitation, statements regarding potential mineralization, historic production, estimation of mineral resources, the realization of mineral resource estimates, interpretation of prior exploration and potential exploration results, the timing and success of exploration activities generally, the timing and results of future resource estimates, permitting time lines, metal prices and currency exchange rates, availability of capital, government regulation of exploration operations, environmental risks, reclamation, title, and future plans and objectives of the company are forward-looking statements that involve various risks and uncertainties. Although Metallic Minerals believes the expectations expressed in such forward-looking statements are based on reasonable assumptions, such statements are not guarantees of future performance and actual results or developments may differ materially from those in the forward-looking statements. Forward-looking statements are based on a number of material factors and assumptions. Factors that could cause actual results to differ materially from those in forward-looking statements include failure to obtain necessary approvals, unsuccessful exploration results, changes in project parameters as plans continue to be refined, results of future resource estimates, future metal prices, availability of capital and financing on acceptable terms, general economic, market or business conditions, risks associated with regulatory changes, defects in title, availability of personnel, materials and equipment on a timely basis, accidents or equipment breakdowns, uninsured risks, delays in receiving government approvals, unanticipated environmental impacts on operations and costs to remedy same, and other exploration or other risks detailed herein and from time to time in the filings made by the companies with securities regulators. Readers are cautioned that mineral resources that are not mineral reserves do not have demonstrated economic viability. Mineral exploration and development of mines is an inherently risky business. Accordingly, the actual events may differ materially from those projected in the forward-looking statements. For more information on Metallic Minerals and the risks and challenges of their businesses, investors should review their annual filings that are available at www.sedar.com

Neither the TSX Venture Exchange nor its Regulation Services Provider (as that term is defined in the policies of the TSX Venture Exchange) accepts responsibility for the adequacy or accuracy of this release.

SOURCE: Metallic Minerals Corp.

Categories
Base Metals Energy Junior Mining

Noram Receives Results for CVZ-71: High-Grade Intercept of 280.0 ft (85.3 m) Averaging 1050 ppm & High of 1560 ppm

VANCOUVER, BC / ACCESSWIRE / May 26, 2022 / Sandy MacDougall, CEO of Noram Lithium Corp. (“Noram” or the “Company“) (TSXV:NRM)(OTCQB:NRVTF)(Frankfurt:N7R) is pleased to announce the successful completion of CVZ-71 (PH-10) and release of the final assay results. The Company completed core hole CVZ-71 at a depth of 453.5 feet (138.2 m). Sampling for assay began at 30 ft (9.1 m) and continued to the bottom of the hole. An interval thickness of 280 ft (85.3 m) was intersected from 140 ft (42.7 m) to 420 ft (128.0 m). The hole ended in mineralization and the weighted average lithium values present were as follows:

Noram Lithium Corp., Thursday, May 26, 2022, Press release picture

“As Noram moves toward completion of the Zeus property’s PFS, now on schedule for completion in October 2022, the assay results from CVZ-71 provide another long, high-grade intercept to the list of drillholes that is expected to upgrade a major portion of the deposit from an inferred resource to the indicated resource category” comments Brad Peek, VP of Exploration and geologist on all six phases of Noram’s Clayton Valley exploration drilling.

Noram Lithium Corp., Thursday, May 26, 2022, Press release picture

Table 1 – Sample results from CVZ-71 from 30 ft (9.1 m) to depth of 453.5 ft (138.2 m).https://embed.fireplace.yahoo.com/embed?ctrl=Monalixa&m_id=monalixa&m_mode=document&site=sports&os=android&pageContext=%257B%2522ctopid%2522%253A%25221542500%253B1577000%2522%252C%2522hashtag%2522%253A%25221542500%253B1577000%2522%252C%2522wiki_topics%2522%253A%2522Clayton_Valley_Charter_High_School%253BLithium_carbonate%253BNor-Am_Cup%253BMineral_resource_classification%2522%252C%2522lmsid%2522%253A%2522a077000000LnOyOAAV%2522%252C%2522revsp%2522%253A%2522accesswire.ca%2522%252C%2522lpstaid%2522%253A%25221869a662-45fa-37a9-a47a-ba4e81a1165c%2522%252C%2522pageContentType%2522%253A%2522story%2522%257D

The samples were analyzed by the ALS laboratory in Reno, Nevada. Certified reference standard samples were included in the sample batch and returned values that were within their expected ranges.

The technical information contained in this news release has been reviewed and approved by Brad Peek., M.Sc., CPG, who is a Qualified Person with respect to Noram’s Clayton Valley Lithium Project as defined under National Instrument 43-101.

About Noram Lithium Corp.

Noram Lithium Corp. (TSXV:NRM),(OTCQB: NRVTF),(Frankfurt:N7R) is a well-financed Canadian based advanced Lithium development stage company with less than 90 million shares issued and a fully funded treasury. Noram is aggressively advancing its Zeus Lithium Project in Nevada from the development-stage level through the completion of a Pre-Feasibility Study in 2022.

The Company’s flagship asset is the Zeus Lithium Project (“Zeus”), located in Clayton Valley, Nevada. The Zeus Project contains a current 43-101 measured and indicated resource estimate* of 363 million tonnes grading 923 ppm lithium, and an inferred resource of 827 million tonnes grading 884 ppm lithium utilizing a 400 ppm Li cut-off. In December 2021, a robust PEA** indicated an After-Tax NPV(8) of US$1.3 Billion and IRR of 31% using US$9,500/tonne Lithium Carbonate Equivalent (LCE). Using the LCE long term forecast of US$14,000/tonne, the PEA indicates an NPV (8%) of approximately US$2.6 Billion and an IRR of 52% at US$14,000/tonne LCE.

Please visit our web site for further information: www.noramlithiumcorp.com.

ON BEHALF OF THE BOARD OF DIRECTORS

Sandy MacDougall
Chief Executive Officer and Director
C: 778.999.2159

For additional information please contact:
Peter A. Ball
President and Chief Operating Officer
peter@noramlithiumcorp.com
C: 778.344.4653

Neither the TSX Venture Exchange nor its Regulation Services Provider (as that term is defined in the policies of the TSX Venture Exchange) accepts responsibility for the adequacy or accuracy of this release. This news release may contain forward-looking information which is not comprised of historical facts. Forward-looking information involves risks, uncertainties and other factors that could cause actual events, results, performance, prospects and opportunities to differ materially from those expressed or implied by such forward-looking information. Forward-looking information in this news release includes statements regarding, among other things, the completion transactions completed in the Agreement. Factors that could cause actual results to differ materially from such forward-looking information include, but are not limited to, regulatory approval processes. Although Noram believes that the assumptions used in preparing the forward-looking information in this news release are reasonable, including that all necessary regulatory approvals will be obtained in a timely manner, undue reliance should not be placed on such information, which only applies as of the date of this news release, and no assurance can be given that such events will occur in the disclosed time frames or at all. Noram disclaims any intention or obligation to update or revise any forward-looking information, whether as a result of new information, future events or otherwise, other than as required by applicable securities laws. *Updated Lithium Mineral Resource Estimate, Zeus Project, Clayton Valley, Esmeralda County, Nevada, USA (August 2021) **Preliminary Economic Assessment Zeus Project, ABH Engineering (December 2021).

SOURCE:Noram Lithium Corp.


View source version on accesswire.com:
https://www.accesswire.com/702737/Noram-Receives-Results-for-CVZ-71-High-Grade-Intercept-of-2800-ft-853-m-Averaging-1050-ppm-High-of-1560-ppm