Despite the growing hype around electric vehicles, conventional gas-powered vehicles are expected to be on the road well into the future.
As a result, exhaust systems will continue to be a critical tool in reducing harmful air pollution.
The Power of Palladium
Today’s infographic comes to us from North American Palladium, and it demonstrates the unique properties of the precious metal, and how it’s used in catalytic converters around the world.
In fact, palladium enables car manufacturers to meet stricter emission standards, making it a secret weapon for fighting pollution going forward.
The world is in critical need of palladium today.
It’s the crucial metal in reducing harmful emissions from gas powered vehicles—as environmental standards tighten, cars are using more and more palladium, straining global supplies.
What is Palladium?
Palladium is one of six platinum group metals which share similar chemical, physical, and structural features. Palladium has many uses, but the majority of global consumption comes from the autocatalyst industry.
In 2018, total gross demand for the metal was 10,121 million ounces (Moz), of which 8,655 Moz went to autocatalysts. These were the leading regions by demand:
North America: 2,041 Moz
Europe: 1,883 Moz
China: 2,117 Moz
Japan: 859 Moz
Rest of the World: 1,755 Moz
Catalytic Converters: Palladium vs. Platinum
The combustion of gasoline creates three primary pollutants: hydrocarbons, nitrogen oxides, and carbon monoxide. Catalytic converters work to alter these poisonous and often dangerous chemicals into safer compounds.
In order to control emissions, countries around the world have come up with strict emissions standards that auto manufacturers must meet, but these are far from the reality of how much pollutants are emitted by drivers every day.
Since no one drives in a straight line or in perfect conditions, stricter emissions testing is coming into effect. Known as Real Driving Emissions (RDE), these tests reveal that palladium performs much better than platinum in a typical driving situation.
In addition, the revelation of the Volkswagen emission scandal (known as Dieselgate) further undermines platinum use in vehicles. As a result, diesel engines are being phased out in favor of gas-powered vehicles that use palladium.
Where does Palladium Come From?
If the world is using all this palladium, where is it coming from?
Approximately, 90% of the world’s palladium production comes as a byproduct of mining other metals, with the remaining 10% coming from primary production.
In 2018, there was a total of 6.88 million ounces of mine supply primarily coming from Russia and South Africa. Conflicts in these jurisdictions present significant risks to the global supply chain. There are few North American jurisdictions, such as Ontario and Montana, which present an opportunity for more stable primary production of palladium.
Long Road to Extinction
The current price of palladium is driven by fundamental supply and demand issues, not investor speculation. Between 2012 and 2018, an accumulated deficit of five million ounces has placed pressures on readily available supplies of above-ground palladium.
Vehicles with internal combustion engines (ICE) will continue to dominate the roads well into the future. According to Bloomberg New Energy Finance, it will not be until 2040 that ICE vehicles will dip below 50% of new car sales market, in favor of plug-in and hybrid vehicles. Stricter emissions standards will further bolster palladium demand.
The world needs stable and steady supplies of palladium today, and well into the future.
My colleague Paul Wong wrote about silver’s recent flat performance in his recent monthly, April Pressures Risk Assets. Wong aptly explained silver’s interesting role: “Silver has a distinct duality pricing function that, at times, may be contradictory due to its industrial component and its monetary role.”
In this report, we provide our current outlook for silver. Ultimately, we believe recent market dynamics are creating short-term headwinds for precious metals from a monetary standpoint, but those trends could reverse – and silver supply constraints are likely to become more relevant in the face of sustained demand, with notable momentum in silver’s industrial uses related to the green energy transition.The strength of silver’s fundamentals has been fueled by strong gains across all demand components.
Silver’s Behavior Since COVID
Silver bullion1 posted a 47% gain in 2020 (see red oval in Figure 1) and has recently been in a holding pattern. Despite this, silver traded in the range of $22-$28 in 2021, and its average price for the year reached a nine-year high of $25.14.
Since silver’s outperformance in 2020, the global macroeconomic environment has changed dramatically and become increasingly volatile. Markets continue to grapple with the impacts of the COVID pandemic, geopolitical concerns have increased substantially, and the recent sell-off of stocks has not yet found a stopping point. Rising interest rates have created a headwind for precious metals assets, particularly gold and silver.
Silver is More Volatile than Gold
Silver’s response to current macroeconomic challenges has been to follow its traditional pattern of reacting with more volatility than gold. Silver is down modestly YTD; priced at $23.35 per ounce on December 31, 2021, it was $21.72 as of May 23, 2022, a decline of 7.02%. Gold, by contrast, gained 1.38% YTD2 through May 23. Both are strong showings, given the S&P 5003 declined 16.65% in the same period.
Figure 1. Silver Price vs. Gold Price (2000-2022)
Source: Bloomberg. Data as of 4/30/2022. Included for illustrative purposes only. Past performance is no guarantee of future results.
But to fully understand our current positive outlook for silver, we should revisit the supply-demand dynamics of the silver market — the fundamental relationship that directs long-term pricing trends. To assess these dynamics, we looked to the annual silver outlook published by the Silver Institute and Metals Focus in April, the World Silver Survey 2022.
Although the risk-off tenor of the moment may be a headwind for short-term silver pricing trends, over the longer term, we believe silver supply constraints will become more relevant in the face of sustained, growing demand.
Silver Supply Headwinds in the Post-COVID Era
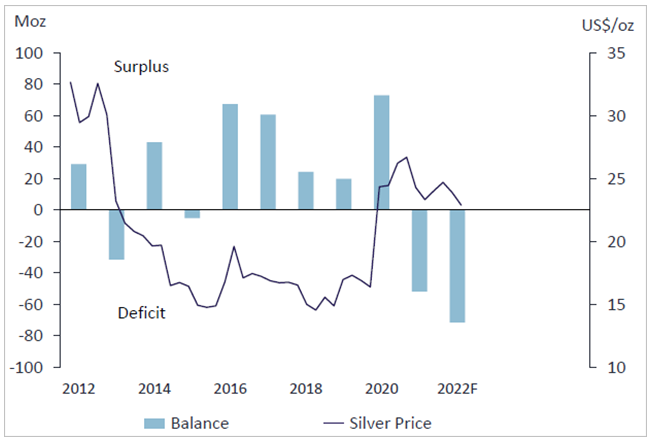
As expected on the back of silver’s price rise in 2020, silver mining rebounded in 2021 — but to a lesser degree than forecasted. Mine production was up about 5% in 2021 from 2020 levels. Recycling volumes grew by 7% as higher pricing attracted more scrap to the market. Still, Metals Focus analysts had predicted growth for mining supply to be higher, in the range of 8%. As shown in Figure 2, silver supplies have dropped into a deficit since last year, and Metals Focus analysts predict another sizeable deficit of 72 million ounces in 2022.
Figure 2. Silver Supply Dives into Deficit in 2021
Source: Metals Focus, April 2022. Included for illustrative purposes only. Past performance is no guarantee of future results.
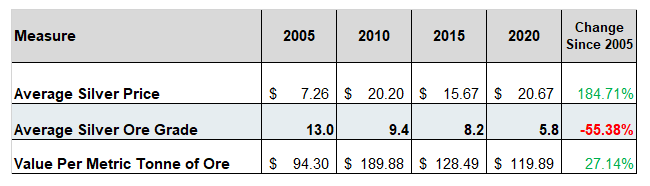
In addition to tighter silver supply, silver grades have been declining for several years. Ore grades depend on several things, including rising silver prices (which make it profitable to accept lower grades) and how the silver is mined. Going forward, mining companies will likely have to invest more in exploration and development in order to increase or even maintain supply.
Figure 3. Grades of Mined Silver Ore have Declined ~55% Since 2005
Byproduct prices are also a big input for total silver mining activity. More than 70% of silver mining supply is a result of byproduct mining. Higher prices for byproduct metals — lead, zinc and copper, for instance — drive higher mining activity for those metals, essentially subsidizing silver mining in the process. That impact has contributed to supply in recent quarters. But, it’s a tailwind to supply that is potentially at risk. If macroeconomic conditions soften in the medium-term and price support eases for those byproduct metals, silver mining supply is also vulnerable. Without the subsidy effect of higher byproduct prices, the outlook for silver supply could be even weaker than expected.
Figure 4. Higher Prices for Byproduct Metals have Helped Silver Mining Output
Source: Bloomberg, as of 5/13/2022. Orange = Copper Futures. Green = Zinc Futures (3 month contracts). Blue = Silver Spot. Gold = Gold Spot. Included for illustrative purposes only. Past performance is no guarantee of future results.
Miners must also contend with inflation, which directly impacts their fuel costs in production and exploration. If costs are expected to increase and silver miners aren’t sufficiently confident in higher silver prices, it’s difficult to envision a scenario where they are likely to ramp up mining activity substantially. There are also continued reports of worker shortages in silver mining as the tight labor market and waves of COVID outbreaks hamper operations in some locations.
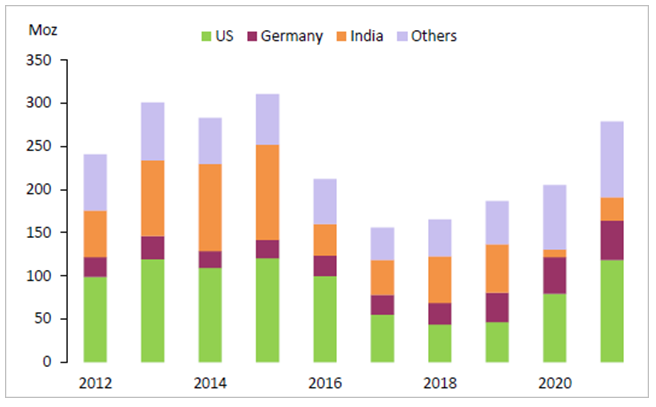
These supply trends have already resulted in a drop in global silver reserves. In 2021, 122 million ounces (Moz) of silver were added to reserves, but 270 Moz were taken in production, as shown in Figure 5. Reserves dropped by about 4% to 3,412 Moz at yearend. Exploration and discoveries were also underwhelming in 2021. Globally, total identified silver resources (excluding reserves) only grew 1% last year. At the same time, there was subdued merger and acquisition activity in 2021 in the primary silver sector, with only eight deals totaling just US$11 million.
Figure 5. Global Silver Mine Reserves Drop in 2021
Primary silver reserves declined as mining depletion exceeded additions.
Source: Metals Focus, April 2022. Included for illustrative purposes only. Past performance is no guarantee of future results.
Silver Demand: Green Technologies Support Sustained Growth
While silver supply faces some constricting trends, the rebound in demand could prove sustainable, thanks to silver’s critical role in growing green energy initiatives.
Photovoltaic demand — silver inputs for solar panel production — is a prime example, growing 13% as a category in 2021 and contributing to a new record high for global silver demand in 2021. This rebound, even in the face of the supply-chain constraints that have plagued global manufacturing since COVID began, reflects the substantial green-energy investment that is underway.
We believe this trend could drive continued demand growth even if other manufacturing activity softens incrementally. Industrial demand overall accounts for about half of annual silver demand, and photovoltaic demand is about a fifth of all industrial offtake (and growing in share, since photovoltaic is growing faster than overall industrial use at large).
Source: Metals Focus, April 2022. Included for illustrative purposes only. Past performance is no guarantee of future results.
The outlook for green energy investment has only strengthened in the face of the Russia-Ukraine conflict, which is pushing global sentiment towards energy security and renewables. Vehicle electrification and renewable energy demand could have more staying power in an environment where developed economies are turning a corner toward weaker growth or even recession. Industry forecasts project that silver demand for electric vehicles is likely to eventually surpass the volume of silver used in photovoltaics. As Paul Wong discussed last month, silver prices have demonstrated a growing correlation to energy transition equities. According to Wong, “Silver pricing has become highly correlated (R-square4 of 0.82) with energy transition equities, as illustrated in Figure 7. This Energy Transition Index is comprised of 12 large ETFs in the energy transition space (solar, renewables, wind, carbon, infrastructure, uranium, etc.).”
Figure 7. Silver Correlates with Energy Transition Equities
Source: Bloomberg and Sprott Asset Management LP. Data as of 4/30/2022. Included for illustrative purposes only. You cannot invest directly in an index. Past performance is no guarantee of future results.
The Energy Transition Story is a Large Force for Silver
The current environment may be dominated by risk-off behavior, but that’s not the primary factor for longer-term silver demand, particularly given its dual nature as a precious metal and an industrial metal.
We see the energy transition story as a large force for silver demand — this year and in future years. The geopolitical issues dominating the current environment only strengthen that trend, even as they weaken other components of silver demand. The pandemic and the war in Ukraine have both served to reinforce investment in energy-transition initiatives.
Silver is a critical component of electric vehicles (EVs), which are experiencing strong demand growth globally. EV sales are slated to represent >30% of total light-vehicle sales by 2030, mainly stemming from China, Europe and the U.S. EVs are going to require a new set of manufacturing materials versus traditional ICE (internal combustion vehicles) vehicles. Silver’s high conductivity and ductility make EVs more efficient by establishing lightweight but strong electrical connections between batteries and other car components. Battery electric vehicles use between ~25-50 grams of silver per vehicle.
At present, EV inventories remain backlogged. Ford announced in January that it would double production of its electric F-150 pickup truck to work through a three-year backlog. Tesla reported that some models were backlogged until 2023, even after price increases. Solar panels have also been backlogged in recent months, according to some reports.
Figure 8. A Surge in EVs
Source: BMO Capital Markets, HIS, CAAM, InsideEVs, Industry Reports as of 2/07/2022.
Positive Non-Industrial Demand Trends
Looking at non-industrial demand for silver, trends have been milder but positive. In photography — which represents a small and declining share of silver demand — there was a small post-COVID rebound related to the catch-up trend of X-rays in healthcare after lockdowns subsided. Jewelry and silverware are more closely tied to economic growth, and both rebounded substantially in 2021. The return of weddings and social events in India supported higher jewelry production. Italy and China also accounted for healthy rebounding demand for jewelry amid economic recoveries. Silverware also reflected these trends. However, jewelry and silverware purchases both remained below pre-COVID levels.
Physical demand for silver coins and bars is the most volatile category of demand (and hard to get real-time data for mid-year). Physical demand grew 36% in 2021 over the year prior, driving the category up to represent a full quarter of global demand for the year. Bar and coin investments have not retreated since 2016/17.
Figure 9. Silver Bar and Coin Investment Surged by 36% in 2021
Source: Metals Focus, April 2022. Included for illustrative purposes only. Past performance is no guarantee of future results.
Why We Remain Bullish on Silver
From a pricing standpoint, silver is historically undervalued relative to gold right now, and offers an attractive investment opportunity. We see a picture of silver fundamentals where supply trends cannot keep up with longer-term demand. Overall, the silver market has been in a physical deficit since 2019, and silver mine supply has been in decline since 2016. There has been a lack of funds going into silver mine development and the timelines from discovery to production have gotten longer. On the demand side, all segments of silver demand are rebounding, led by industrial, jewelry and physical investment. We continue to believe that silver is likely to benefit from supply constraints in the face of growing demand. We expect green technology and de-carbonization trends to continue and increase, even if economic growth slows globally.
1
Silver bullion is measured by Bloomberg Silver (XAG Curncy) U.S. dollar spot rate.
2
Gold bullion is measured by the Bloomberg GOLDS Comdty Spot Price.
3
The S&P 500 or Standard & Poor’s 500 Index is a market-capitalization-weighted index of the 500 largest U.S. publicly traded companies.
4
R-squared values range from 0 to 1 and are commonly stated as percentages from 0% to 100%. An R-squared of 100% means that all movements of a security (or another dependent variable) are completely explained by movements in the index (or the independent variable(s) you are interested in). Source: Investopedia.
Maria Smirnova, MBA, CFA Managing Director, Sprott Inc.; Senior Portfolio Manager & Chief Investment Officer, Sprott Asset Management
Past performance is no guarantee of future results. You cannot invest directly in an index. Investments, commentary and statements are that of the author and may not be reflective of investments and commentary in other strategies managed by Sprott Asset Management USA, Inc., Sprott Asset Management LP, Sprott Inc., or any other Sprott entity or affiliate. Opinions expressed in this commentary are those of the author and may vary widely from opinions of other Sprott affiliated Portfolio Managers or investment professionals.
This content may not be reproduced in any form, or referred to in any other publication, without acknowledgment that it was produced by Sprott Asset Management LP and a reference to sprott.com. The opinions, estimates and projections (“information”) contained within this content are solely those of Sprott Asset Management LP (“SAM LP”) and are subject to change without notice. SAM LP makes every effort to ensure that the information has been derived from sources believed to be reliable and accurate. However, SAM LP assumes no responsibility for any losses or damages, whether direct or indirect, which arise out of the use of this information. SAM LP is not under any obligation to update or keep current the information contained herein. The information should not be regarded by recipients as a substitute for the exercise of their own judgment. Please contact your own personal advisor on your particular circumstances. Views expressed regarding a particular company, security, industry or market sector should not be considered an indication of trading intent of any investment funds managed by Sprott Asset Management LP. These views are not to be considered as investment advice nor should they be considered a recommendation to buy or sell. SAM LP and/or its affiliates may collectively beneficially own/control 1% or more of any class of the equity securities of the issuers mentioned in this report. SAM LP and/or its affiliates may hold short position in any class of the equity securities of the issuers mentioned in this report. During the preceding 12 months, SAM LP and/or its affiliates may have received remuneration other than normal course investment advisory or trade execution services from the issuers mentioned in this report.
SAM LP is the investment manager to the Sprott Physical Bullion Trusts (the “Trusts”). Important information about the Trusts, including the investment objectives and strategies, purchase options, applicable management fees, and expenses, is contained in the prospectus. Please read the document carefully before investing. Investment funds are not guaranteed, their values change frequently and past performance may not be repeated. This communication does not constitute an offer to sell or solicitation to purchase securities of the Trusts. You will usually pay brokerage fees to your dealer if you purchase or sell units of the Trusts on the Toronto Stock Exchange (“TSX”) or the New York Stock Exchange (“NYSE”). If the units are purchased or sold on the TSX or the NYSE, investors may pay more than the current net asset value when buying units or shares of the Trusts and may receive less than the current net asset value when selling them.
The risks associated with investing in a Trust depend on the securities and assets in which the Trust invests, based upon the Trust’s particular objectives. There is no assurance that any Trust will achieve its investment objective, and its net asset value, yield and investment return will fluctuate from time to time with market conditions. There is no guarantee that the full amount of your original investment in a Trust will be returned to you. The Trusts are not insured by the Canada Deposit Insurance Corporation or any other government deposit insurer. Please read a Trust’s prospectus before investing.
The information contained herein does not constitute an offer or solicitation to anyone in the United States or in any other jurisdiction in which such an offer or solicitation is not authorized or to any person to whom it is unlawful to make such an offer or solicitation. Prospective investors who are not resident in Canada or the United States should contact their financial advisor to determine whether securities of the Funds may be lawfully sold in their jurisdiction.
The information provided is general in nature and is provided with the understanding that it may not be relied upon as, nor considered to be, the rendering or tax, legal, accounting or professional advice. Readers should consult with their own accountants and/or lawyers for advice on their specific circumstances before taking any action.
VANCOUVER, BC / ACCESSWIRE / May 26, 2022 / Metallic Minerals (TSX.V:MMG)(OTCQB:MMNGF) (“Metallic Minerals“, or the “Company“) is pleased to report the final set of assay results from its 2021 drilling completed at the Company’s 100%-owned, 166-square-kilometer Keno Silver Project located within the historic, high-grade Keno Hill silver district in Canada’s Yukon Territory. These drill tests were targeted at extending high-grade silver-gold-lead-zinc mineralization at the Formo deposit in the West Keno target area, one of several advanced stage targets moving toward an initial NI 43-101 mineral resource estimate for the Keno Silver project.
Highlights
Drilling in 2021 and 2020 by Metallic Minerals at the Formo deposit intercepted both high-grade Keno-style Ag-Au-Pb-Zn veins and broader zones of potentially bulk mineable mineralization.
FOR21-05 returned three intervals at over 1,000 g/t silver equivalent (“Ag Eq”) from 92.7 m to 115.5 m for a total of 22.8 m grading 219.5 g/t Ag Eq including 0.5 m of 1,657.8 g/t Ag Eq with up to 17 g/t Au, 0.7 m of 1,408.8 g/t Ag Eq and 0.5 m of 1,649.9 g/t Ag Eq.
FOR21-06 intercepted multiple zones of mineralization with 4.6 m of 938.3 g/t Ag Eq including 3,229.9 g/t Ag Eq over 1.0 m within a broader zone of 11.4 m grading 413.7 g/t Ag Eq.
The Formo target area hosts multiple parallel vein structures and mineralized zones within a broader structural envelope that remains open to expansion and shows excellent opportunities for resource delineation. Results from 2021 drilling intercepted extremely high grades, including FOR21-05 returning three intervals over 1,000 g/t silver Ag Eq and FOR21-06 with 3,229.9 g/t Ag Eq over 1.0 m within an interval of 4.6 m of 938.3 g/t Ag Eq (see Table 1 below). Both zones were encountered at shallow depths of less than 150 m down hole and these intersections extend high-grade silver mineralization below the 2020 drilling and the historically productive Formo mine. Geophysical and geochemical surveys, enhanced by the 2021 fieldwork, demonstrate significant resource potential opportunities in the Formo target area.
The Formo vein structure lies at the intersection of a north-easterly extension of the Bermingham-Calumet and the Elsa vein system, which are hosts to the some of the largest historic producing mines and current resources and reserves in the Keno Hill silver district (see Figure 1). The Formo Target remains open for expansion along trend and down dip and has several untested surface targets.
Metallic Minerals President, Scott Petsel, stated, “These exciting results from this most recent follow-up drilling program at the Formo target area in the western Keno Hill District, combined with the exceptional 2020 drill results, demonstrate the potential to delineate significant, high-grade resources at the Keno Silver project. Our team has done remarkable work to build on our understanding of the geology and the important controls to mineralization in the highly productive Keno Hill silver district.”
“As we prepare to embark on our upcoming exploration campaign, we recognize the importance of moving toward the definition of an inaugural resource estimates at Keno Silver, with Formo and Caribou being the two most advanced in that regard. We are also very focused on and enthusiastic about conducting robust follow-up work on our recent discoveries of both high-grade silver veins and bulk mineable mineralization in the East Keno area. We expect to provide updates with respect to planned programs at both Keno Silver and the La Plata project in Colorado over the coming weeks and look forward to meeting with investors during the upcoming Prospectors and Developers Conference in Toronto in mid-June.”
Upcoming Events
PDAC 2022 – Metallic will join fellow Metallic Group members at PDAC in Toronto, May 13-15 (Booth IE2851).
Metallic Minerals Corp., Wednesday, May 25, 2022, Press release picture
West Keno Exploration Program and Formo Target
The Western Keno Hill district is host to the largest historic production and current resources in the prolific Keno Hill silver district. The Formo target is located at the intersection of a north-easterly structural zone extending from the Hector-Calumet mine, which was the largest producer in the district producing nearly 100 million ounces of silver and the Elsa structural trend, which was the second largest silver producer in the district (see Figure 2). The historic Formo mine produced silver at various times since the 1930s from high-grade vein structures that graded an average of over 5,000 g/t silver1. The majority of this historic production came from an open pit located alongside of the Silver Trail highway between the Elsa townsite and Keno City.
Metallic Minerals’ exploration efforts at the Formo target area have integrated recent drilling with surface and underground sampling into a 3D geologic model, along with multi-spectral studies and geophysical surveys covering the area (see Figure 3). In addition to the mineralization at the known Formo deposit, two new surface targets have been identified through surface soil and rock sampling along the same structural corridors that show potential to host high-grade and bulk tonnage Keno-style Ag-Au-Pb-Zn. The opportunity to significantly expand the known mineralization defined from underground sampling and surface drilling, as well as the potential to define new high-grade deposits along the main mineralized structural corridor, positions Formo as a top priority target for near-term resource definition at the Keno Silver project.
Table 1 – Significant Drill Results from 2020-2021 at the Formo Target Area
DDH Hole ID
From (m)
To (m)
Width (m)
Ag Eq (g/t)
Ag (g/t)
Au (g/t)
Pb (%)
Zn (%)
FOR21-05
92.7
115.5
22.8
219.5
69
0.4
0.30
2.07
94.6
95.1
0.5
1,657.8
25
17.0
0.01
0.44
98.8
108
9.2
430.5
164
0.1
0.69
4.85
102.4
103.1
0.7
1,408.8
361
0.0
2.17
20.09
107
107.5
0.5
1,649.9
421
0.1
1.53
24.20
FOR21-06
96
97
1.0
221.8
155
0.0
0.45
1.03
111.6
123
11.4
413.7
234
0.0
1.97
2.07
114.4
119
4.6
938.3
528
0.1
4.48
4.82
116
117
1.0
3,229.9
1,978
0.4
13.09
14.97
121.2
123
1.8
202.8
128
0.0
1.00
0.76
FOR-20-001
50.9
57
6.1
284.5
218
0.0
0.3
1.14
including
50.9
53.95
3.05
447.5
369
0.0
0.11
1.52
FOR-20-002
49.45
52.3
2.85
48
22
0.0
0.18
0.39
FOR-20-003
96
100.1
4.1
2,536.0
1,165
0.0
21.74
11.32
including
96
99
3.0
3,425.9
1,568
0.0
29.45
15.35
FOR-20-004
89.8
95.9
6.1
367.6
225
0.0
2.04
1.35
including
91.8
93.7
1.9
698.4
454
0.0
3.48
2.32
including
93.2
93.7
0.5
1,083.6
601
0.0
7.33
4.25
FOR-20-005
104.76
105.45
0.69
365.0
146
0.0
1.32
3.52
152.17
152.67
0.5
85.5
6
0.4
0.01
0.76
FOR-20-006
137.63
139.78
2.15
740.6
332
0.0
3.06
6.04
including
139.13
139.78
0.65
2,255.9
1,001
0.1
8.92
18.92
FOR-20-007
98.1
98.65
0.55
77
12
0.0
0.12
1.2
107.65
108.15
0.5
86.1
46
0.2
0.24
0.34
125.55
126.05
0.5
75.5
1
0.2
0
1.23
FOR-20-008
116.45
116.95
0.5
289.2
178
0.1
2.2
0.42
including
168.6
169.6
1.0
79.2
57
0.0
0.25
0.25
FOR-20-009
69.7
70.14
0.44
67.4
15
0.0
0.21
0.91
113.2
113.7
0.5
211.6
26
0.4
0.06
3
FOR-20-011
55.3
59.7
4.4
75.6
3
0.0
0.05
0.04
including
57.7
58.6
0.9
307.7
195
0.0
2.79
0.1
Silver equivalent (Ag Eq) values assume Ag $19/oz, Pb $1.05/lb, Zn $1.30/lb, Au $1,800/oz and 100% metallurgical recovery. Sample intervals are based on measured drill intersect lengths and are believed to be representative of true widths.
Figure 2 – West Keno Plan Map
Metallic Minerals Corp., Wednesday, May 25, 2022, Press release picture
Figure 3 – Formo Vein Long Section (Looking NW)
Metallic Minerals Corp., Wednesday, May 25, 2022, Press release picture
About Metallic Minerals
Metallic Minerals Corp. is a growth-stage exploration company, focused on high-grade silver and gold projects in underexplored, brownfields mining districts of North America. Our objective is to create shareholder value through a systematic, entrepreneurial approach to exploration in the Keno Hill silver district, La Plata silver-gold-copper district, and Klondike gold district through new discoveries and advancing resources to development. Metallic Minerals has consolidated the second-largest land position in the historic Keno Hill silver district of Canada’s Yukon Territory, directly adjacent to Alexco Resource Corp’s operations, with nearly 300 million ounces of high-grade silver in past production and current M&I resources. In addition, exploration at the recently acquired La Plata silver-gold-copper project in southwestern Colorado is targeting a silver and gold-enriched copper porphyry and adjacent high-grade silver and gold epithermal systems. The Company also continues to add new production royalty leases on its holdings in the Klondike gold district in the Yukon. All three districts have seen significant mineral production and have existing infrastructure, including power and road access. Metallic Minerals is led by a team with a track record of discovery and exploration success on several major precious and base metal deposits, as well as having large-scale development, permitting and project financing expertise.
About the Metallic Group of Companies
The Metallic Group is a collaboration of leading precious and base metals exploration and development companies, with a portfolio of large, brownfields assets in established mining districts adjacent to some of the industry’s highest-grade producers of silver and gold, platinum and palladium, and copper. Member companies include Metallic Minerals in the Yukon’s high-grade Keno Hill silver district and La Plata silver-gold-copper district of Colorado, Granite Creek Copper in the Yukon’s Minto copper district, and Group Ten Metals in the Stillwater PGM-nickel-copper district of Montana and Kluane district in the Yukon. The founders and team members of the Metallic Group include highly successful explorationists formerly with some of the industry’s leading explorer/developers and major producers. With this expertise, the companies are undertaking a systematic approach to exploration and development using new models and technologies to facilitate discoveries in these proven, but under-explored, mining districts. Members of the Metallic Group have been recognized as recipients of awards for excellence in environmental stewardship demonstrating commitment to responsible resource development and appropriate ESG practices. The Metallic Group is headquartered in Vancouver, BC, Canada, and its member companies are listed on the Toronto Venture, US OTCQB and Frankfurt stock exchanges.
The disclosure in this news release of scientific and technical information regarding exploration projects on Metallic Minerals’ mineral properties has been reviewed and approved by Scott Petsel, P.Geo., President, who is a Qualified Person as defined by National Instrument 43-101 – Standards of Disclosure for Mineral Projects (“NI 43-101”).
Quality Assurance / Quality Control
All samples were assayed by 36 Element Aqua Regia Digestion ICP-MS methods at Bureau Veritas labs in Vancouver. with sample preparation in Whitehorse, Yukon and geochemical analysis in Vancouver, British Columbia. Samples with over limit silver and gold were re-analyzed using a 30-gram fire assay fusion with a gravimetric finish. Over-limit lead and zinc samples were analyzed by multi-acid digestion and atomic absorption spectrometry. All results have passed the QAQC screening by the lab and the company utilized a quality control and quality assurance protocol for the project, including blank, duplicate, and standard reference samples.
Forward-Looking Statements
Forward Looking Statements: This news release includes certain statements that may be deemed “forward-looking statements”. All statements in this release, other than statements of historical facts including, without limitation, statements regarding potential mineralization, historic production, estimation of mineral resources, the realization of mineral resource estimates, interpretation of prior exploration and potential exploration results, the timing and success of exploration activities generally, the timing and results of future resource estimates, permitting time lines, metal prices and currency exchange rates, availability of capital, government regulation of exploration operations, environmental risks, reclamation, title, and future plans and objectives of the company are forward-looking statements that involve various risks and uncertainties. Although Metallic Minerals believes the expectations expressed in such forward-looking statements are based on reasonable assumptions, such statements are not guarantees of future performance and actual results or developments may differ materially from those in the forward-looking statements. Forward-looking statements are based on a number of material factors and assumptions. Factors that could cause actual results to differ materially from those in forward-looking statements include failure to obtain necessary approvals, unsuccessful exploration results, changes in project parameters as plans continue to be refined, results of future resource estimates, future metal prices, availability of capital and financing on acceptable terms, general economic, market or business conditions, risks associated with regulatory changes, defects in title, availability of personnel, materials and equipment on a timely basis, accidents or equipment breakdowns, uninsured risks, delays in receiving government approvals, unanticipated environmental impacts on operations and costs to remedy same, and other exploration or other risks detailed herein and from time to time in the filings made by the companies with securities regulators. Readers are cautioned that mineral resources that are not mineral reserves do not have demonstrated economic viability. Mineral exploration and development of mines is an inherently risky business. Accordingly, the actual events may differ materially from those projected in the forward-looking statements. For more information on Metallic Minerals and the risks and challenges of their businesses, investors should review their annual filings that are available at www.sedar.com
Neither the TSX Venture Exchange nor its Regulation Services Provider (as that term is defined in the policies of the TSX Venture Exchange) accepts responsibility for the adequacy or accuracy of this release.
VANCOUVER, BC / ACCESSWIRE / May 26, 2022 / Sandy MacDougall, CEO of Noram Lithium Corp. (“Noram” or the “Company“) (TSXV:NRM)(OTCQB:NRVTF)(Frankfurt:N7R) is pleased to announce the successful completion of CVZ-71 (PH-10) and release of the final assay results. The Company completed core hole CVZ-71 at a depth of 453.5 feet (138.2 m). Sampling for assay began at 30 ft (9.1 m) and continued to the bottom of the hole. An interval thickness of 280 ft (85.3 m) was intersected from 140 ft (42.7 m) to 420 ft (128.0 m). The hole ended in mineralization and the weighted average lithium values present were as follows:
Noram Lithium Corp., Thursday, May 26, 2022, Press release pictureNoram Lithium Corp., Thursday, May 26, 2022, Press release pictureNoram Lithium Corp., Thursday, May 26, 2022, Press release picture
“As Noram moves toward completion of the Zeus property’s PFS, now on schedule for completion in October 2022, the assay results from CVZ-71 provide another long, high-grade intercept to the list of drillholes that is expected to upgrade a major portion of the deposit from an inferred resource to the indicated resource category” comments Brad Peek, VP of Exploration and geologist on all six phases of Noram’s Clayton Valley exploration drilling.
Noram Lithium Corp., Thursday, May 26, 2022, Press release picture
Table 1 – Sample results from CVZ-71 from 30 ft (9.1 m) to depth of 453.5 ft (138.2 m).https://embed.fireplace.yahoo.com/embed?ctrl=Monalixa&m_id=monalixa&m_mode=document&site=sports&os=android&pageContext=%257B%2522ctopid%2522%253A%25221542500%253B1577000%2522%252C%2522hashtag%2522%253A%25221542500%253B1577000%2522%252C%2522wiki_topics%2522%253A%2522Clayton_Valley_Charter_High_School%253BLithium_carbonate%253BNor-Am_Cup%253BMineral_resource_classification%2522%252C%2522lmsid%2522%253A%2522a077000000LnOyOAAV%2522%252C%2522revsp%2522%253A%2522accesswire.ca%2522%252C%2522lpstaid%2522%253A%25221869a662-45fa-37a9-a47a-ba4e81a1165c%2522%252C%2522pageContentType%2522%253A%2522story%2522%257D
The samples were analyzed by the ALS laboratory in Reno, Nevada. Certified reference standard samples were included in the sample batch and returned values that were within their expected ranges.
The technical information contained in this news release has been reviewed and approved by Brad Peek., M.Sc., CPG, who is a Qualified Person with respect to Noram’s Clayton Valley Lithium Project as defined under National Instrument 43-101.
About Noram Lithium Corp.
Noram Lithium Corp. (TSXV:NRM),(OTCQB: NRVTF),(Frankfurt:N7R) is a well-financed Canadian based advanced Lithium development stage company with less than 90 million shares issued and a fully funded treasury. Noram is aggressively advancing its Zeus Lithium Project in Nevada from the development-stage level through the completion of a Pre-Feasibility Study in 2022.
The Company’s flagship asset is the Zeus Lithium Project (“Zeus”), located in Clayton Valley, Nevada. The Zeus Project contains a current 43-101 measured and indicated resource estimate* of 363 million tonnes grading 923 ppm lithium, and an inferred resource of 827 million tonnes grading 884 ppm lithium utilizing a 400 ppm Li cut-off. In December 2021, a robust PEA** indicated an After-Tax NPV(8) of US$1.3 Billion and IRR of 31% using US$9,500/tonne Lithium Carbonate Equivalent (LCE). Using the LCE long term forecast of US$14,000/tonne, the PEA indicates an NPV (8%) of approximately US$2.6 Billion and an IRR of 52% at US$14,000/tonne LCE.
Sandy MacDougall Chief Executive Officer and Director C: 778.999.2159
For additional information please contact: Peter A. Ball President and Chief Operating Officer peter@noramlithiumcorp.com C: 778.344.4653
Neither the TSX Venture Exchange nor its Regulation Services Provider (as that term is defined in the policies of the TSX Venture Exchange) accepts responsibility for the adequacy or accuracy of this release. This news release may contain forward-looking information which is not comprised of historical facts. Forward-looking information involves risks, uncertainties and other factors that could cause actual events, results, performance, prospects and opportunities to differ materially from those expressed or implied by such forward-looking information. Forward-looking information in this news release includes statements regarding, among other things, the completion transactions completed in the Agreement. Factors that could cause actual results to differ materially from such forward-looking information include, but are not limited to, regulatory approval processes. Although Noram believes that the assumptions used in preparing the forward-looking information in this news release are reasonable, including that all necessary regulatory approvals will be obtained in a timely manner, undue reliance should not be placed on such information, which only applies as of the date of this news release, and no assurance can be given that such events will occur in the disclosed time frames or at all. Noram disclaims any intention or obligation to update or revise any forward-looking information, whether as a result of new information, future events or otherwise, other than as required by applicable securities laws. *Updated Lithium Mineral Resource Estimate, Zeus Project, Clayton Valley, Esmeralda County, Nevada, USA (August 2021) **Preliminary Economic Assessment Zeus Project, ABH Engineering (December 2021).
Vancouver, British Columbia–(Newsfile Corp. – May 18, 2022) – Goldshore Resources Inc. (TSXV: GSHR) (OTCQB: GSHRF) (FSE: 8X00) (“Goldshore” or the “Company“), is pleased to announce that it is working with Dr. Russell Birrell of Globex on implementing his innovative ionic leach soil sampling technique that will enable the Company to detect bedrock anomalies beneath muskeg swamp and glacial till. Initial sampling will be conducted across known mineralization at the QES Zone to calibrate the geochemical response and enable a more accurate assessment of results in new areas.
Peter Flindell, Vice President Exploration, comments: “I have worked with Dr. Birrell and the ionic leach technique in Scotland where we successfully identified several mineralized targets. This technique is well suited to the type of cover at Moss Lake and I look forward to reviewing the first results over the QES Zone. The ionic leach program will continue throughout the 2022 summer field season and focus on the targets developed from last year’s VTEM/magnetics survey. This will help us to rank and rate all targets, and to prioritize the scout drilling program, outside the historical Moss Lake deposit.”
Dr. Birrell was part of the team that developed the Mobile Metal Ion (MMI) sampling technique at CSIRO. The MMI technique has been widely used in exploration programs for the past three decades. His work on ionic leach marks an order of magnitude increase in sensitivity that has mapped several concealed mineralized targets in similar terranes.
Closing of Non-Brokered Financing
The Company is also pleased to announce that it has closed a non-brokered private placement of 1,000,000 units (each, a “Unit“) at a price of $0.50 per Unit for gross proceeds of $500,000 (the “Financing“). Each Unit issued in connection with the Financing is comprised of one common share of the Company (each, a “Common Share“) and one-half common share purchase warrant (each whole warrant, a “Warrant“). Each Warrant shall entitle the holder thereof to acquire one Common Share at an exercise price of $0.75, for a period of 24 months following the date hereof, subject to acceleration if the Common Shares trade above $1.10 on the TSX Venture Exchange (the “Exchange“) for twenty (20) consecutive days.
The Company intends to use the proceeds raised from the Financing for future exploration work on its Moss Lake gold deposit in Northwest Ontario, Canada and for general working capital purposes.
The securities issued pursuant to the Financing will be subject to a four-month and one day hold period under applicable securities laws in Canada. Closing of the Financing is subject to final approval by the Exchange.
About Goldshore
Goldshore is an emerging junior gold development company, and owns the Moss Lake Gold Project located in Ontario. Wesdome Gold Mines Ltd. is currently a strategic shareholder of Goldshore with an approximate 22% equity position in the Company. Well-financed and supported by an industry-leading management group, board of directors and advisory board, Goldshore is positioned to advance the Moss Lake Gold Project through the next stages of exploration and development.
About the Moss Lake Gold Project
The Moss Lake Gold Project is located approximately 100 km west of the city of Thunder Bay, Ontario. It is accessed via Highway 11 which passes within 1 km of the property boundary to the north. The Moss Lake Gold Project covers 14,292 hectares and consists of 282 unpatented and patented mining claims.
Moss Lake hosts a number of gold and base metal rich deposits including the Moss Lake Deposit, the East Coldstream Deposit (Table 1), the historically producing North Coldstream Mine (Table 2), and the Hamlin Zone, all of which occur over a mineralized trend exceeding 20 km in length. A historical preliminary economic assessment was completed on Moss Lake in 2013 and published by Moss Lake Gold1. A historical mineral resource estimate was completed on the East Coldstream Deposit in 2011 by Foundation Resources Inc2,3. In addition to these zones, the Moss Lake Gold Project also hosts a number of under-explored mineral occurrences which are reported to exist both at surface and in historically drilled holes. The Moss Lake Deposit is a shear-hosted disseminated-style gold deposit which outcrops at surface. It has been drilled over a 2.5 km length and to depths of 300 m with 376 holes completed between 1983 and 2017. The last drilling program conducted in 2016 and 2017 by Wesdome Gold Mines Ltd. (“Wesdome“), which consisted of widely spaced holes along the strike extension of the deposit was successful in expanding the mineralized footprint and hydrothermal system 1.6 km to the northeast. Additionally, the deposit remains largely open to depth. In 2017, Wesdome completed an induced polarization survey which traced the potential extensions of pyrite mineralization associated with the Moss Lake Deposit over a total strike length of 8 km and spanning the entire extent of the survey grids.
The East Coldstream Deposit is a shear-hosted disseminated-style gold deposit which locally outcrops at surface. It has been drilled over a 1.3 km length and to depths of 200 m with 138 holes completed between 1988 and 2017. The deposit remains largely open at depth and may have the potential for expansion along strike. Historic drill hole highlights from the East Coldstream Deposit include 4.86 g/t Au over 27.3 m in C-10-15.
The historically producing North Coldstream Mine is reported to have produced significant amounts of copper, gold and silver4 from mineralization with potential iron-oxide-copper-gold deposit style affinity. The exploration potential immediately surrounding the historic mining area is not currently well understood and historic data compilation is required.
The Hamlin Zone is a significant occurrence of copper and gold mineralization, and also of potential iron-oxide-copper-gold deposit style affinity. Between 2008 and 2011, Glencore tested Hamlin with 24 drill holes which successfully outlined a broad and intermittently mineralized zone over a strike length of 900 m. Historic drill hole highlights from the Hamlin Zone include 0.9 g/t Au and 0.35% Cu over 150.7 m in HAM-11-75.
The Moss Lake, East Coldstream and North Coldstream deposits sit on a mineral trend marked by a regionally significant deformation zone locally referred to as the Wawiag Fault Zone in the area of the Moss Lake Deposit. This deformation zone occurs over a length of approximately 20 km on the Moss Lake Gold Project and there is an area spanning approximately 7 km between the Moss Lake and East Coldstream deposits that is significantly underexplored.
Table 1: Historical Mineral Resources1,2,3
INDICATED
INFERRED
Deposit
Tonnes
Au g/t
Au oz
Tonnes
Au g/t
Au oz
Moss Lake Deposit1 (2013 resource estimate)
Open Pit Potential
39,795,000
1.1
1,377,300
48,904,000
1.0
1,616,300
Underground Potential
–
–
–
1,461,100
2.9
135,400
Moss Lake Total
39,795,000
1.1
1,377,300
50,364,000
1.1
1,751,600
East Coldstream Deposit2 (2011 resource estimate)
East Coldstream Total
3,516,700
0.85
96,400
30,533,000
0.78
763,276
Combined Total
43,311,700
1.08
1,473,700
80,897,000
0.98
2,514,876
Notes:
(1) Source: Poirier, S., Patrick, G.A., Richard, P.L., and Palich, J., 2013. Technical Report and Preliminary Economic Assessment for the Moss Lake Project, 43-101 technical report prepared for Moss Lake Gold Mines Ltd. Moss Lake Deposit resource estimate is based on 0.5 g/t Au cut-off grade for open pit and 2.0 g/t Au cut-off grade for underground resources.
(2) Source: McCracken, T., 2011. Technical Report and Resource Estimate on the Osmani Gold Deposit, Coldstream Property, Northwestern Ontario, 43-101 technical report prepared for Foundation Resources Inc. and Alto Ventures Ltd. East Coldstream Deposit resource estimate is based on a 0.4 g/t Au cut-off grade.
(3) The reader is cautioned that the above referenced “historical mineral resource” estimates are considered historical in nature and as such is based on prior data and reports prepared by previous property owners. A qualified person has not done sufficient work to classify the historical estimates as current resources and Goldshore is not treating the historical estimates as current resources. Significant data compilation, re-drilling, re-sampling and data verification may be required by a qualified person before the historical estimate on the Moss Lake Gold Project can be classified as a current resource. There can be no assurance that any of the historical mineral resources, in whole or in part, will ever become economically viable. In addition, mineral resources are not mineral reserves and do not have demonstrated economic viability. Even if classified as a current resource, there is no certainty as to whether further exploration will result in any inferred mineral resources being upgraded to an indicated or measured mineral resource category.
Table 2: Reported Historical Production from the North Coldstream Deposit4
Deposit
Tonnes
Cu %
Au g/t
Ag
Cu lbs
Au oz
Ag oz
Historical Production
2,700,0000
1.89
0.56
5.59
102,000,000
44,000
440,000
Note:
(4) Source: Schlanka, R., 1969. Copper, Nickel, Lead and Zinc Deposits of Ontario, Mineral Resources Circular No. 12, Ontario Geological Survey, pp. 314-316.
Peter Flindell, MAusIMM, MAIG, Vice President – Exploration of the Company, a qualified person under NI 43-101 has approved the scientific and technical information contained in this news release.
Neither the TSXV nor its Regulation Services Provider (as that term is defined in the policies of the TSXV) accepts responsibility for the adequacy or accuracy of this release.
For More Information – Please Contact:
Brett A. Richards President, Chief Executive Officer and Director Goldshore Resources Inc.
This news release contains statements that constitute “forward-looking statements.” Such forward-looking statements involve known and unknown risks, uncertainties and other factors that may cause the Company’s actual results, performance or achievements, or developments to differ materially from the anticipated results, performance or achievements expressed or implied by such forward-looking statements. Forward-looking statements are statements that are not historical facts and are generally, but not always, identified by the words “expects,” “plans,” “anticipates,” “believes,” “intends,” “estimates,” “projects,” “potential” and similar expressions, or that events or conditions “will,” “would,” “may,” “could” or “should” occur.
Forward-looking statements in this news release include, among others, statements relating to expectations regarding the exploration and development of the Moss Lake Gold Project, the use of proceeds from the Financing, and other statements that are not historical facts. By their nature, forward-looking statements involve known and unknown risks, uncertainties and other factors which may cause our actual results, performance or achievements, or other future events, to be materially different from any future results, performance or achievements expressed or implied by such forward-looking statements. Such factors and risks include, among others: the Company may require additional financing from time to time in order to continue its operations which may not be available when needed or on acceptable terms and conditions acceptable; compliance with extensive government regulation; domestic and foreign laws and regulations could adversely affect the Company’s business and results of operations; the stock markets have experienced volatility that often has been unrelated to the performance of companies and these fluctuations may adversely affect the price of the Company’s securities, regardless of its operating performance; and the impact of COVID-19.
The forward-looking information contained in this news release represents the expectations of the Company as of the date of this news release and, accordingly, is subject to change after such date. Readers should not place undue importance on forward-looking information and should not rely upon this information as of any other date. The Company undertakes no obligation to update these forward-looking statements in the event that management’s beliefs, estimates or opinions, or other factors, should change.
This news release does not constitute an offer to sell, or a solicitation of an offer to buy, any securities in the United States. The securities have not been and will not be registered under the United States Securities Act of 1933, as amended (the “U.S. Securities Act”) or any state securities laws and may not be offered or sold within the United States or to U.S. Persons unless registered under the U.S. Securities Act and applicable state securities laws or an exemption from such registration is available.
VANCOUVER, BC / ACCESSWIRE / May 18, 2022 / Metallic Minerals Corp. (TSX-V:MMG) (OTCQB:MMNGF) (“Metallic Minerals” or the “Company”) is pleased to announce a non-brokered private placement offering of 9,600,000 flow-through units (“Units”) at a price of $0.42 per Unit for aggregate gross proceeds of $4,032,000 (the “Offering”), which represents a premium to the May 17th closing price of the Company’s common shares on the TSX Venture Exchange (the “Exchange”). The Units consist of a flow-through share and a half warrant and are being issued as part of a charity arrangement structured by Peartree Securities Inc.
All net proceeds from the Offering are planned to be used to incur Canadian Exploration Expenses (“CEE”) under the Income Tax Act (Canada) primarily at Metallic Minerals’ Keno Silver project in the historic, high-grade Keno Hill Silver District in Canada’s Yukon Territory.
Greg Johnson, CEO & Chairman, stated, “We are very pleased to add these new investors to our supportive shareholder base and are in a position to complete important follow-up programs at the Company’s Keno Silver and the La Plata projects, using a combination of existing funding and new flow-through funds. We remain positive on the underlying fundamentals for commodities as the current cycle continues to build and look forward to providing additional project updates as our exploration programs get underway.”
Each whole share purchase warrant is exercisable into one additional common share of the Company at a price of $0.50 per share for a period of 30 months from the date of closing. Subject to approval by the Exchange, if the closing share price five (5) trading days prior to the end of the 30-month warrant period is at or below $0.50, the Company shall, upon written request by a warrant holder, extend expiry of such warrants for an additional six (6) months.
Closing of the Offering is expected on or about June 8, 2022, subject to certain customary conditions, including, but not limited to, acceptance of the Exchange. All securities issued under the Offering will be subject to a statutory hold period of four months plus a day following the date of closing.
The securities offered have not been registered under the U.S. Securities Act of 1933, as amended, and may not be offered or sold in the United States absent registration or an applicable exemption from the registration requirements. This press release shall not constitute an offer to sell or the solicitation of an offer to buy nor shall there be any sale of the securities in any State in which such offer, solicitation or sale would be unlawful.
About Metallic Minerals
Metallic Minerals Corp. is an exploration and development stage company, focused on silver, gold and copper in the high-grade Keno Hill and La Plata mining districts of North America. Our objective is to create shareholder value through a systematic, entrepreneurial approach to making exploration discoveries, growing resources and advancing projects toward development. Metallic Minerals has consolidated the second-largest land position in the historic Keno Hill silver district of Canada’s Yukon Territory, directly adjacent to Alexco Resource Corp’s operations, with more than 300 million ounces of high-grade silver in past production and current M&I resources. In addition, the Company recently announced the inaugural resource estimate for the La Plata silver-gold-copper project in southwestern Colorado. All of the districts in which the Company works have seen significant mineral production and have existing infrastructure, including power and road access. Metallic Minerals is led by a team with a track record of discovery and exploration success on several major precious and base metal deposits, as well as having large-scale development, permitting and project financing expertise.
About the Metallic Group of Companies
The Metallic Group is a collaboration of leading precious and base metals exploration and development companies, with a portfolio of large, brownfields assets in established mining districts adjacent to some of the industry’s highest-grade producers of silver and gold, platinum and palladium, and copper. Member companies include Metallic Minerals in the Yukon’s high-grade Keno Hill silver district and La Plata silver-gold-copper district of Colorado, Granite Creek Copper in the Yukon’s Minto copper district, and Group Ten Metals in the Stillwater PGM-nickel-copper district of Montana and Kluane district in the Yukon. The founders and team members of the Metallic Group include highly successful explorationists formerly with some of the industry’s leading explorer/developers and major producers. With this expertise, the companies are undertaking a systematic approach to exploration and development using new models and technologies to facilitate discoveries in these proven, but under-explored, mining districts. Members of the Metallic Group have been recognized as recipients of awards for excellence in environmental stewardship demonstrating commitment to responsible resource development and appropriate ESG practices. The Metallic Group is headquartered in Vancouver, BC, Canada, and its member companies are listed on the Toronto Venture, US OTCQB and Frankfurt stock exchanges.
Forward Looking Statements: This news release includes certain statements that may be deemed “forward-looking statements”. All statements in this release, other than statements of historical facts including, without limitation, statements regarding the completion of the financing and the gross proceeds raised therefrom, the use of proceeds from the financing and their qualification as CEE, the date of closing of the financing, potential mineralization, historic production, estimation of mineral resources, the realization of mineral resource estimates, interpretation of prior exploration and potential exploration results, the timing and success of exploration activities generally, the timing and results of future resource estimates, permitting time lines, metal prices and currency exchange rates, availability of capital, government regulation of exploration operations, environmental risks, reclamation, title, trends in commodities prices and future plans and objectives of the Company are forward-looking statements that involve various risks and uncertainties. Although Metallic Minerals believes the expectations expressed in such forward-looking statements are based on reasonable assumptions, such statements are not guarantees of future performance and actual results or developments may differ materially from those in the forward-looking statements. Forward-looking statements are based on a number of material factors and assumptions. Factors that could cause actual results to differ materially from those in forward-looking statements include failure to obtain necessary approvals, unsuccessful exploration results, changes in project parameters as plans continue to be refined, results of future resource estimates, future metal prices, availability of capital and financing on acceptable terms, general economic, market or business conditions, risks associated with regulatory changes, defects in title, availability of personnel, materials and equipment on a timely basis, accidents or equipment breakdowns, uninsured risks, delays in receiving government approvals, unanticipated environmental impacts on operations and costs to remedy same, and other exploration or other risks detailed herein and from time to time in the filings made by the companies with securities regulators. Readers are cautioned that mineral resources that are not mineral reserves do not have demonstrated economic viability. Mineral exploration and development of mines is an inherently risky business. Accordingly, the actual events may differ materially from those projected in the forward-looking statements. For more information on Metallic Minerals and the risks and challenges of their businesses, investors should review their annual filings that are available at www.sedar.com.
Neither the TSX Venture Exchange nor its Regulation Services Provider (as that term is defined in the policies of the TSX Venture Exchange) accepts responsibility for the adequacy or accuracy of this release.
10 HIGH-VALUE GOLD PROJECTS: Ten properties cover a total of 1091 km² and 106 historic gold mines and prospects within the highly mineralized but relatively under explored New England Orogenic Terrane and prolifically mineralized Lachlan Orogenic Belt. Mineralizaton is mostly of an orogenic type associated with large scale structures making for large attractive targets and lesser intrusion related types. Potential for listwanite hosted gold mineralization of the Bralorne and Motherlode type along the Peel-Manning suture zone.
4 HIGH-VALUE SILVER PROJECTS: Four properties cover a total of 289 km² and 31 historic gold-silver mines and prospects within the prolifically mineralized but relatively under explored New England Orogenic Terrane. All properties remain largely under explored since their discovery in the early 1900’s. Little to no historic drilling and almost no exploration Several styles of mineralization present including intrusion related vein stock work targets and low sulphidation epithermal types.
Proven and Probable Where we deliver Mining Insights & Bullion Sales. I’m a licensed broker for Miles Franklin Precious Metals Investments (https://www.milesfranklin.com/contact/) Where we provide unlimited options to expand your precious metals portfolio, from physical delivery, offshore depositories, and precious metals IRA’s. Call me directly at (855) 505-1900 or you may email maurice@milesfranklin.com. Proven and Probable provides insights on mining companies, junior miners, gold mining stocks, uranium, silver, platinum, zinc & copper mining stocks, silver and gold bullion in Canada, the US, Australia, and beyond.
Labrador Gold Intersects 54.17 G/T Au Over 0.95m at the Big Vein Target
TORONTO, May 05, 2022 (GLOBE NEWSWIRE) — Labrador Gold Corp. (TSX.V:LAB | OTCQX:NKOSF | FNR: 2N6) (“LabGold” or the “Company”) is pleased to announce the continued extension of the Big Vein Zone to the southwest with an intersection of 54.17 g/t Au over 0.95m as well as the intersection of near surface gold mineralization from initial diamond drilling of the Pristine target at its 100% controlled Kingsway project near Gander, Newfoundland. These holes were drilled as part of the Company’s ongoing 100,000 metre drill program at Kingsway.
At Big Vein, the intercept of 54.17g/t Au over 0.95m in hole K-22-122 contains visible gold and is the furthest intersection of the Big Vein Zone to the southwest drilled to date. This extends the strike length of the zone to 320m and it remains open in this direction. Hole K-22-116 targeted the HTC zone and intersected 14.67 g/t over a 1m interval that also contained visible gold.
At the Pristine target the first six holes all intersected significant near surface gold mineralization, including hole K-21-109 that assayed 3.55 g/t Au over 2.33m from 17.15m that contained visible gold and hole K-21-100 that intersected 3.89 g/t Au over 3m from 53m downhole.
The initial assays from the Pristine target, located approximately 800m northeast of Big Vein along the Appleton Fault Zone, are very similar to the first reported holes from Big Vein that assayed 1.11 g/t Au over 5.50m, 5.0 g/t Au over 0.9m and 2.26 g/t Au over 7.0m in Hole K-21-01 and 1.72 g/t Au over 3.0min Hole K-21-02 (see news release dated May 10, 2021).
The stratigraphy encountered is also very similar to Big Vein, with the mineralized Doyle Zone defined by a network of shear veining that is associated with a highly fractured sandstone in fault contact with a deformed black graphitic shale.
“We are very pleased with the initial results from the Pristine target which proves our interpretation of the existence of a gold occurrence not too far up ice from the pristine gold grains found in till. Pristine is the third of three targets tested to date to show significant near surface gold assays, a result of our systematic exploration strategy at Kingsway and the prospectivity of the Appleton Fault Zone,” said Roger Moss, President and CEO of the LabGold. “We have named the mineralized zone at Pristine the Doyle Zone after our friend and strong supporter James Doyle, who passed away suddenly, and much too early, in late 2020. James helped and advised us in every financing since the start of Labrador Gold in 2017, and gave us support in the market, often when no-one else was interested. James would have loved witnessing all the exploration activity in central Newfoundland over the last two years and would have been working the telephones daily. We will endeavour to ensure that the Doyle Zone lives up to the big personality of its namesake.”
Pristine Target and Appleton Fault Zone
The visible gold found in hole K-21-109 drilled into the Doyle Zone is the third occurrence of visible gold found, after Big Vein and Golden Glove, along the Appleton Fault Zone. The Doyle Zone is the furthest northeast, approximately 4.5km from Golden Glove which lies close to the southern property boundary. The Doyle Zone lies to the east of a fault with a major damage zone approximately 30m wide which may represent the expression of the Appleton Fault Zone in this area. Further work is necessary to determine if this is, in fact, the the case or if it is a major splay of the Appleton Fault Zone. In either case it is a significant structure associated with gold mineralization in the Doyle Zone.
The most detailed exploration along the Appleton Fault Zone to date has been over an approximately 2km section from just southwest of Big Vein to the Pristine target, leaving the remaining 10km length of the fault zone relatively underexplored. This will be a major focus of LabGold’s upcoming field program.
Hole ID
from (m)
to (m)
width (m)
Au (g/t)
Target
K-22-142
96
100
4
3.44
Big Vein
including
97
99
2
5.37
K-22-125
70
77
7
1.72
HTC
K-22-124
264
266
2
2.03
Big Vein
283
284
1
7.68
K-22-122
99
114
15
1.46
Big Vein
123.33
124.28
0.95
54.17*
K-22-116
178
179
1
14.67*
HTC
194
196
2
4.18
207
208
1
3.25
K-22-143
75
82
7
1.53
Pristine
K-22-123
23
24
1
1.98
Pristine
43
44
1
2.3
K-22-119
31
33
2
1.92
Pristine
K-21-109
17.15
18.3
2.3
3.55*
Pristine
47.45
50.45
3
1.31
54.45
59.45
5
1.48
K-21-107
48
52
4
1.16
Pristine
86
89
3
1.58
96
103
7
1.81
K-21-100
53
56
3
3.89
Pristine
Table 1. Summary of Assay Results * Interval contains visible gold. All intersections are downhole length as there is insufficient Information to calculate true width.
True widths of the reported intersections have yet to be calculated. Assays are uncut. Samples of HQ split core are securely stored prior to shipping to Eastern Analytical Laboratory in Springdale, Newfoundland for assay. Eastern Analytical is an ISO/IEC17025 accredited laboratory. Samples are routinely analyzed for gold by standard 30g fire assay with atomic absorption finish as well as by ICP-OES for an additional 34 elements. Samples containing visible gold are assayed by metallic screen/fire assay, as are any samples with fire assay results greater than 1g/t Au. The company submits blanks and certified reference standards at a rate of approximately 5% of the total samples in each batch.
Qualified Person
Roger Moss, PhD., P.Geo., President and CEO of LabGold, a Qualified Person in accordance with Canadian regulatory requirements as set out in NI 43-101, has read and approved the scientific and technical information that forms the basis for the disclosure contained in this release.
The Company gratefully acknowledges the Newfoundland and Labrador Ministry of Natural Resources’ Junior Exploration Assistance (JEA) Program for its financial support for exploration of the Kingsway property.
About Labrador Gold Labrador Gold is a Canadian based mineral exploration company focused on the acquisition and exploration of prospective gold projects in Eastern Canada.
In early 2020, Labrador Gold acquired the option to earn a 100% interest in the Kingsway project in the Gander area of Newfoundland. The three licenses comprising the Kingsway project cover approximately 12km of the Appleton Fault Zone which is associated with gold occurrences in the region, including those of New Found Gold immediately to the south of Kingsway. Infrastructure in the area is excellent located just 18km from the town of Gander with road access to the project, nearby electricity and abundant local water. LabGold is drilling a projected 50,000 metres targeting high-grade epizonal gold mineralization along the Appleton Fault Zone following encouraging early results. The Company has approximately $28 million in working capital and is well funded to carry out the planned program.
The Hopedale property covers much of the Florence Lake greenstone belts that stretches over 60 km. The belt is typical of greenstone belts around the world but has been underexplored by comparison. Work to date by Labrador Gold show gold anomalies in rocks, soils and lake sediments over a 3 kilometre section of the northern portion of the Florence Lake greenstone belt in the vicinity of the known Thurber Dog gold showing where grab samples assayed up to 7.8g/t gold. In addition, anomalous gold in soil and lake sediment samples occur over approximately 40 km along the southern section of the greenstone belt (see news release dated January 25 th 2018 for more details). Labrador Gold now controls approximately 40km strike length of the Florence Lake Greenstone Belt.
The Company has 156,439,526 common shares issued and outstanding and trades on the TSX Venture Exchange under the symbol LAB.
Neither TSX Venture Exchange nor its Regulation Services Provider (as that term is defined in policies of the TSX Venture Exchange) accepts responsibility for the adequacy or accuracy of this release .
Forward-Looking Statements: This news release contains forward-looking statements that involve risks and uncertainties, which may cause actual results to differ materially from the statements made. When used in this document, the words “may”, “would”, “could”, “will”, “intend”, “plan”, “anticipate”, “believe”, “estimate”, “expect” and similar expressions are intended to identify forward-looking statements. Such statements reflect our current views with respect to future events and are subject to risks and uncertainties. Many factors could cause our actual results to differ materially from the statements made, including those factors discussed in filings made by us with the Canadian securities regulatory authorities. Should one or more of these risks and uncertainties, such as actual results of current exploration programs, the general risks associated with the mining industry, the price of gold and other metals, currency and interest rate fluctuations, increased competition and general economic and market factors, occur or should assumptions underlying the forward looking statements prove incorrect, actual results may vary materially from those described herein as intended, planned, anticipated, or expected. We do not intend and do not assume any obligation to update these forward-looking statements, except as required by law. Shareholders are cautioned not to put undue reliance on such forward-looking statements .
Vancouver, British Columbia–(Newsfile Corp. – May 5, 2022) – Goldshore Resources Inc. (TSXV: GSHR) (OTCQB: GSHRF) (FSE: 8X00) (“Goldshore” or the “Company“), is pleased to announce assay results in hole MQD-22-014 from its ongoing 100,000-meter drill program at the Moss Lake Project in Northwest Ontario, Canada. Drilling is aiming to better define and expand high-grade structural zones within the Moss Lake deposit to improve the overall grade and volume beyond that of the historic mineral resource.
Highlights:
Broad zone of high-grade mineralization confirming the tenor of mineralization modeled in the QES Zone with best intercepts of:
128.3m at 1.05 g/t Au from 121.3m, including
40.6m at 1.99 g/t Au from 139.4m,
3.6m at 1.80 g/t Au from 199.0m, and
22.0m at 1.25 g/t Au from 227.0m.
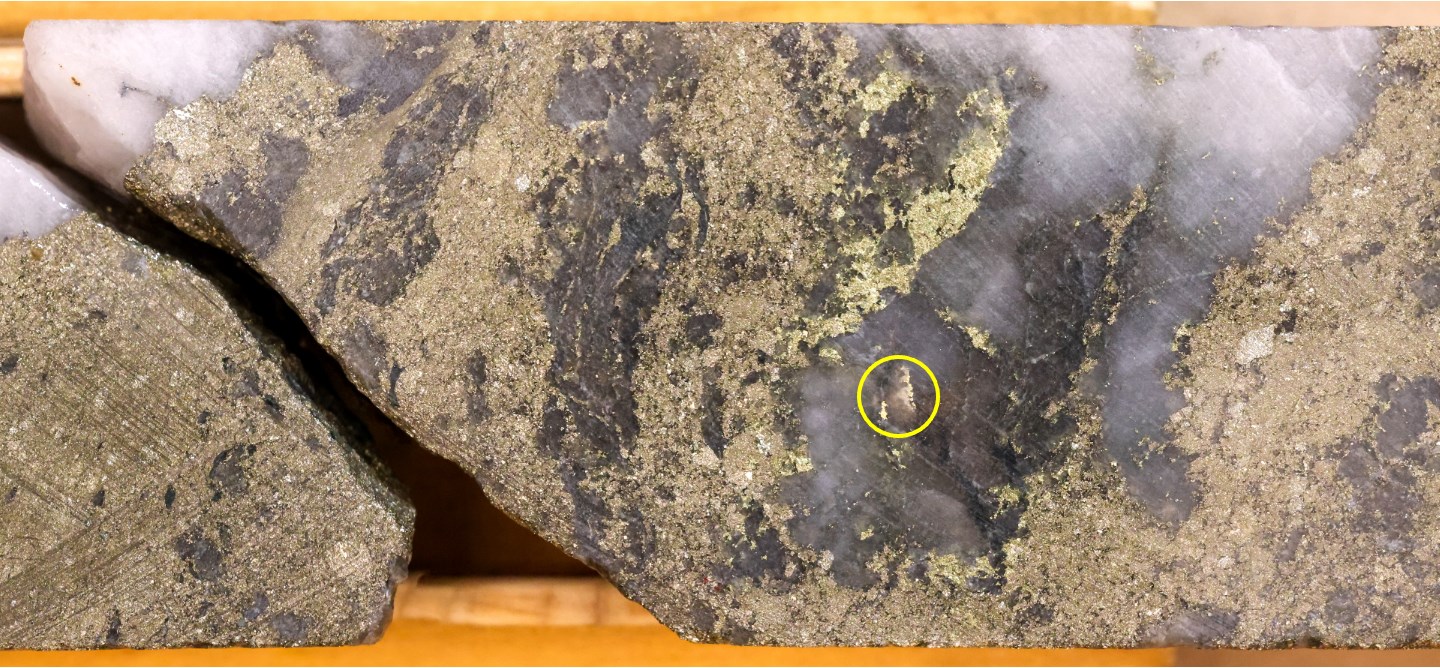
New high grade gold mineralization open in all directions with visible gold intersected in a northern parallel structure. This northern structure is interpreted to be the same parallel structure intersected over 100 metres further to the east (see press release dated January 28, 2022). In addition, the identification of VG in this northern structure could provide elevated milling recoveries in any future operation. The drilling returned:
16.0m at 5.31 g/t Au from 477.0m, including
5.25m at 15.8 g/t Au from 477.75m
Expanding Drill Capacity through the engagement of two additional drill contractors who are mobilizing three rigs to site in the coming week. This will enable Goldshore to increase the drilling rate at the Moss Lake gold deposit and expand the drill program to the Coldstream area to evaluate the gold deposit at East Coldstream and copper-gold-cobalt mineralization at North Coldstream.
Brett Richards, President and Chief Executive Officer of Goldshore, commented: “The drilling intercept of 128.3m at 1.05 g/t Au reaffirms our view that the Moss Lake gold project contains a significant volume of +1 g/t Au mineralization that can underpin a meaningful, economic gold deposit. The fact that we are continuing to intersect gold mineralization outside of the volume modelled in 2013 also affirms our belief that the deposit is significantly larger than previously interpreted. Separately, we are pleased to be bringing in additional drill contractors that will enable us to increase our drilling rate at Moss Lake while commencing drilling at Coldstream.”
Technical Overview
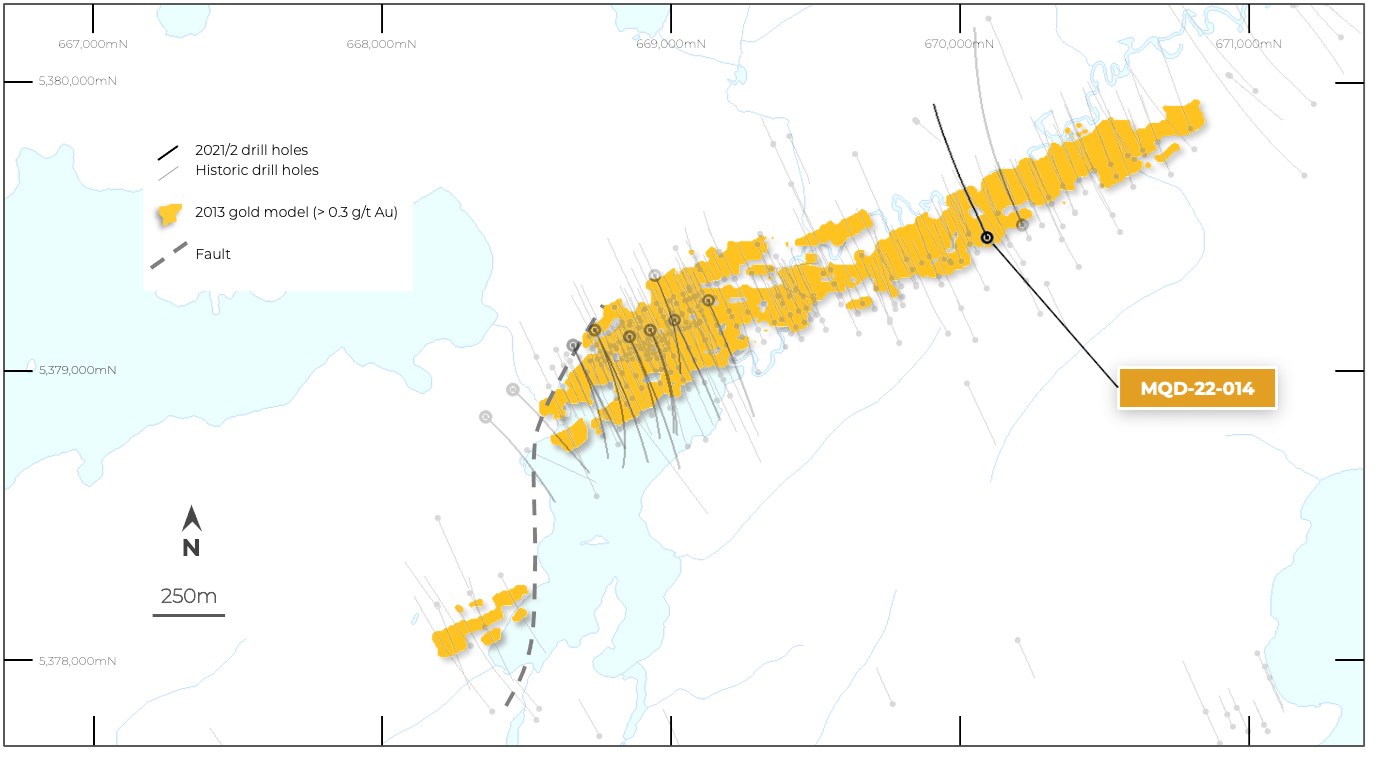
Figure 1 and Table 1 summarize the significant intercepts in MQD-22-014. Figure 2 shows the visible gold seen at 478.1 meters depth, which corresponds to the high-grade parallel structure. Figure 3 and Table 2 show the drill hole location.
Figure 1: Drill section through MQD-22-014 showing mineralized intercepts relative to the 2013 grade model
Table 1: Significant downhole gold intercepts in MQD-22-014
HOLE ID
FROM
TO
HOLE LENGTH (m)
TRUE WIDTH (m)
CUT GRADE (g/t Au)
UNCUT GRADE (g/t Au)
MQD-22-014
59.00
97.05
38.05
25
0.36
0.36
121.30
249.60
128.30
92
1.05
1.05
including
139.40
180.00
40.60
29
1.99
1.99
and
199.00
202.60
3.60
3
1.80
1.80
and
227.00
249.00
22.00
16
1.25
1.25
363.75
373.10
9.35
7
0.57
0.57
477.00
493.00
16.00
12
2.69
5.31
including
477.75
483.00
5.25
4
7.87
15.8
including
477.75
479.20
1.45
1
25.30
54.1
561.00
563.95
2.95
2
0.42
0.42
570.75
573.75
3.00
2
0.57
0.57
607.10
614.45
7.35
6
0.36
0.36
619.40
621.55
2.15
2
0.39
0.39
Intersections calculated above a 0.3 g/t Au cut off with a top cut of 30 g/t Au and a maximum internal waste interval of 10 metres. Shaded intervals are intersections calculated above a 1.0 g/t Au cut off. Intervals in bold are those with a grade thickness factor exceeding 20 gram x metres / tonne gold. True widths are approximate and assume a subvertical body.
Table 2: Location of drill holes in this press release
HOLE
EAST
NORTH
RL
AZIMUTH
DIP
EOH
MQD-22-014
670106
5379466
428
335°
-45°
686.0m
Approximate collar coordinates in NAD 83, Zone 15N
MQD-22-014 was drilled 120 meters west of MQD-21-009 (see press release dated January 28, 2022) at a -45° dip and 335° azimuth to test the 2013 resource model and twin the historic hole 90-203.
The reported significant intercept of 128.3m at 1.05 g/t Au from 121.3m occurs within a broader zone of strongly silica-sericite-chlorite±carbonate altered diorite that assays 200.75m at 0.77 g/t Au from 14m above a 0.3 g/t Au cutoff. The better grade segments (e.g., 40.6m at 1.99 g/t Au from 139.4m) are characterized by intense foliation and brecciation, which reflect numerous sigmoidal shear zones that provide the plumbing for the hydrothermal system.
These results are similar to those intersected in the historic hole, which returned 136.0m at 1.09 g/t Au from 137.0m.
Importantly, we continue to intersect parallel structures that were not previously reported. Visible gold was intersected within a 1.45-meter-wide quartz-pyrite-chalcopyrite vein from 477.75-479.20m, which averages 54.1 g/t Au. This occurs within a biotite-altered diorite that returned 16.0m at 5.31 g/t Au from 477.0m.
Peter Flindell, VP Exploration, commented: “These drilling results confirm the historic drill results and help us to understand the non-linear distribution of high grades that will enable us to model the higher-grade gold resource more accurately later in the year. Our relogging work and surveying of historic drill collars will also allow us to incorporate many of the historic drillholes, which will reduce the number of holes we need to drill in this campaign. Just as we are intersecting new parallel zones of mineralization that will expand the Mineral Resource, we are also identifying mineralization in the historic holes that was previously unsampled, thereby adding assay data to our database.”
Analytical and QA/QC Procedures
All samples were sent to ALS Geochemistry in Thunder Bay for preparation and analysis was performed in the ALS Vancouver analytical facility. ALS is accredited by the Standards Council of Canada (SCC) for the Accreditation of Mineral Analysis Testing Laboratories and CAN-P-4E ISO/IEC 17025. Samples were analyzed for gold via fire assay with an AA finish (“Au-AA23”) and 48 pathfinder elements via ICP-MS after four-acid digestion (“ME-MS61”). Samples that assayed over 10 ppm Au were re-run via fire assay with a gravimetric finish (“Au-GRA21”).
In addition to ALS quality assurance / quality control (“QA/QC”) protocols, Goldshore has implemented a quality control program for all samples collected through the drilling program. The quality control program was designed by a qualified and independent third party, with a focus on the quality of analytical results for gold. Analytical results are received, imported to our secure on-line database and evaluated to meet our established guidelines to ensure that all sample batches pass industry best practice for analytical quality control. Certified reference materials are considered acceptable if values returned are within three standard deviations of the certified value reported by the manufacture of the material. In addition to the certified reference material, certified blank material is included in the sample stream to monitor contamination during sample preparation. Blank material results are assessed based on the returned gold result being less than ten times the quoted lower detection limit of the analytical method. The results of the on-going analytical quality control program are evaluated and reported to Goldshore by Orix Geoscience Inc.
About Goldshore
Goldshore is an emerging junior gold development company, and owns the Moss Lake Gold Project located in Ontario. Wesdome Gold Mines Ltd. is currently a strategic shareholder of Goldshore with an approximate 22% equity position in the Company. Well-financed and supported by an industry-leading management group, board of directors and advisory board, Goldshore is positioned to advance the Moss Lake Gold Project through the next stages of exploration and development.
About the Moss Lake Gold Project
The Moss Lake Gold Project is located approximately 100 km west of the city of Thunder Bay, Ontario. It is accessed via Highway 11 which passes within 1 km of the property boundary to the north. The Moss Lake Gold Project covers 14,292 hectares and consists of 282 unpatented and patented mining claims.
Moss Lake hosts a number of gold and base metal rich deposits including the Moss Lake Deposit, the East Coldstream Deposit (Table 3), the historically producing North Coldstream Mine (Table 4), and the Hamlin Zone, all of which occur over a mineralized trend exceeding 20 km in length. A historical preliminary economic assessment was completed on Moss Lake in 2013 and published by Moss Lake Gold1. A historical mineral resource estimate was completed on the East Coldstream Deposit in 2011 by Foundation Resources Inc2,3. In addition to these zones, the Moss Lake Gold Project also hosts a number of under-explored mineral occurrences which are reported to exist both at surface and in historically drilled holes. The Moss Lake Deposit is a shear-hosted disseminated-style gold deposit which outcrops at surface. It has been drilled over a 2.5 km length and to depths of 300 m with 376 holes completed between 1983 and 2017. The last drilling program conducted in 2016 and 2017 by Wesdome Gold Mines Ltd. (“Wesdome“), which consisted of widely spaced holes along the strike extension of the deposit was successful in expanding the mineralized footprint and hydrothermal system 1.6 km to the northeast. Additionally, the deposit remains largely open to depth. In 2017, Wesdome completed an induced polarization survey which traced the potential extensions of pyrite mineralization associated with the Moss Lake Deposit over a total strike length of 8 km and spanning the entire extent of the survey grids.
The East Coldstream Deposit is a shear-hosted disseminated-style gold deposit which locally outcrops at surface. It has been drilled over a 1.3 km length and to depths of 200 m with 138 holes completed between 1988 and 2017. The deposit remains largely open at depth and may have the potential for expansion along strike. Historic drill hole highlights from the East Coldstream Deposit include 4.86 g/t Au over 27.3 m in C-10-15.
The historically producing North Coldstream Mine is reported to have produced significant amounts of copper, gold and silver4 from mineralization with potential iron-oxide-copper-gold deposit style affinity. The exploration potential immediately surrounding the historic mining area is not currently well understood and historic data compilation is required.
The Hamlin Zone is a significant occurrence of copper and gold mineralization, and also of potential iron-oxide-copper-gold deposit style affinity. Between 2008 and 2011, Glencore tested Hamlin with 24 drill holes which successfully outlined a broad and intermittently mineralized zone over a strike length of 900 m. Historic drill hole highlights from the Hamlin Zone include 0.9 g/t Au and 0.35% Cu over 150.7 m in HAM-11-75.
The Moss Lake, East Coldstream and North Coldstream deposits sit on a mineral trend marked by a regionally significant deformation zone locally referred to as the Wawiag Fault Zone in the area of the Moss Lake Deposit. This deformation zone occurs over a length of approximately 20 km on the Moss Lake Gold Project and there is an area spanning approximately 7 km between the Moss Lake and East Coldstream deposits that is significantly underexplored.
Table 3: Historical Mineral Resources1,2,3
INDICATED
INFERRED
Deposit
Tonnes
Au g/t
Au oz
Tonnes
Au g/t
Au oz
Moss Lake Deposit1 (2013 resource estimate)
Open Pit Potential
39,795,000
1.1
1,377,300
48,904,000
1.0
1,616,300
Underground Potential
–
–
–
1,461,100
2.9
135,400
Moss Lake Total
39,795,000
1.1
1,377,300
50,364,000
1.1
1,751,600
East Coldstream Deposit2 (2011 resource estimate)
East Coldstream Total
3,516,700
0.85
96,400
30,533,000
0.78
763,276
Combined Total
43,311,700
1.08
1,473,700
80,897,000
0.98
2,514,876
Notes:
(1) Source: Poirier, S., Patrick, G.A., Richard, P.L., and Palich, J., 2013. Technical Report and Preliminary Economic Assessment for the Moss Lake Project, 43-101 technical report prepared for Moss Lake Gold Mines Ltd. Moss Lake Deposit resource estimate is based on 0.5 g/t Au cut-off grade for open pit and 2.0 g/t Au cut-off grade for underground resources.
(2) Source: McCracken, T., 2011. Technical Report and Resource Estimate on the Osmani Gold Deposit, Coldstream Property, Northwestern Ontario, 43-101 technical report prepared for Foundation Resources Inc. and Alto Ventures Ltd. East Coldstream Deposit resource estimate is based on a 0.4 g/t Au cut-off grade.
(3) The reader is cautioned that the above referenced “historical mineral resource” estimates are considered historical in nature and as such is based on prior data and reports prepared by previous property owners. A qualified person has not done sufficient work to classify the historical estimates as current resources and Goldshore is not treating the historical estimates as current resources. Significant data compilation, re-drilling, re-sampling and data verification may be required by a qualified person before the historical estimate on the Moss Lake Gold Project can be classified as a current resource. There can be no assurance that any of the historical mineral resources, in whole or in part, will ever become economically viable. In addition, mineral resources are not mineral reserves and do not have demonstrated economic viability. Even if classified as a current resource, there is no certainty as to whether further exploration will result in any inferred mineral resources being upgraded to an indicated or measured mineral resource category.
Table 4: Reported Historical Production from the North Coldstream Deposit4
Deposit
Tonnes
Cu %
Au g/t
Ag
Cu lbs
Au oz
Ag oz
Historical Production
2,700,0000
1.89
0.56
5.59
102,000,000
44,000
440,000
Note:
(4) Source: Schlanka, R., 1969. Copper, Nickel, Lead and Zinc Deposits of Ontario, Mineral Resources Circular No. 12, Ontario Geological Survey, pp. 314-316.
Peter Flindell, MAusIMM, MAIG, Vice President – Exploration of the Company, a qualified person under NI 43-101 has approved the scientific and technical information contained in this news release.
Neither the TSXV nor its Regulation Services Provider (as that term is defined in the policies of the TSXV) accepts responsibility for the adequacy or accuracy of this release.
For More Information – Please Contact:
Brett A. Richards President, Chief Executive Officer and Director Goldshore Resources Inc.
This news release contains statements that constitute “forward-looking statements.” Such forward looking statements involve known and unknown risks, uncertainties and other factors that may cause the Company’s actual results, performance or achievements, or developments to differ materially from the anticipated results, performance or achievements expressed or implied by such forward-looking statements. Forward-looking statements are statements that are not historical facts and are generally, but not always, identified by the words “expects,” “plans,” “anticipates,” “believes,” “intends,” “estimates,” “projects,” “potential” and similar expressions, or that events or conditions “will,” “would,” “may,” “could” or “should” occur.
Forward-looking statements in this news release include, among others, statements relating to expectations regarding the exploration and development of the Moss Lake Gold Project, and other statements that are not historical facts. By their nature, forward-looking statements involve known and unknown risks, uncertainties and other factors which may cause our actual results, performance or achievements, or other future events, to be materially different from any future results, performance or achievements expressed or implied by such forward-looking statements. Such factors and risks include, among others: the Company may require additional financing from time to time in order to continue its operations which may not be available when needed or on acceptable terms and conditions acceptable; compliance with extensive government regulation; domestic and foreign laws and regulations could adversely affect the Company’s business and results of operations; the stock markets have experienced volatility that often has been unrelated to the performance of companies and these fluctuations may adversely affect the price of the Company’s securities, regardless of its operating performance; and the impact of COVID-19.
The forward-looking information contained in this news release represents the expectations of the Company as of the date of this news release and, accordingly, is subject to change after such date. Readers should not place undue importance on forward-looking information and should not rely upon this information as of any other date. The Company undertakes no obligation to update these forward-looking statements in the event that management’s beliefs, estimates or opinions, or other factors, should change.
This news release does not constitute an offer to sell, or a solicitation of an offer to buy, any securities in the United States. The securities have not been and will not be registered under the United States Securities Act of 1933, as amended (the “U.S. Securities Act”) or any state securities laws and may not be offered or sold within the United States or to U.S. Persons unless registered under the U.S. Securities Act and applicable state securities laws or an exemption from such registration is available.


 Source: Bloomberg. Data as of 4/30/2022. Included for illustrative purposes only. Past performance is no guarantee of future results.