Vancouver, British Columbia–(Newsfile Corp. – February 23, 2026) – West Point Gold Corp. (TSXV: WPG) (OTCQB: WPGCF) (FSE: LRA0) (“West Point Gold” or the “Company“) is pleased to announce that it has been recognized as a 2026 Top 50 Company by the TSX Venture Exchange (“TSXV”).
The TSX Venture 50™ is an annual ranking of the top performing companies from the past year on TSXV based on three equally weighted criteria: market capitalization growth, share price appreciation and trading value. The TSX Venture 50™ showcases the top 50 of the over 1,600 TSXV issuers.
“We are honoured to be recognized as a member of the 2026 TSX Venture 50™. This recognition reflects the hard work of the team and West Point Gold, which resulted in strong share price performance in 2025. Following the completion of our recent financing, we are well-funded to continue creating value for shareholders in 2026. We thank our shareholders for their ongoing support, and hope to connect with many of them at upcoming events.”
Over the past year, the Company has advanced exploration and technical programs at its flagship Gold Chain project in Arizona, and acquired the Baxter Spring property, expanding its Nevada portfolio. West Point Gold remains focused on operational discipline and building lasting shareholder value.
Upcoming Events West Point Gold is pleased to be attending the Red Cloud Pre-PDAC event on February 26th – 27th, exhibiting at the Metal Investors Forum (“MIF”) — Toronto, on February 27th – 28th, and will be exhibiting at the Prospector’s and Developers International Convention (“PDAC”) being held March 1st – 4th, 2026 at the Metro Toronto Convention Centre (“MTCC”) in Toronto, Canada.
February 26 – 27 – Red Cloud Pre-PDAC West Point will attend the conference at The OMNI King Edward Hotel, and CEO and President Derek Macpherson is scheduled to present from 4:00-4:20 PM in Vanity Fair on Thursday, February 26th. For more information about the event and registration, please visit the Red Cloud website.
February 27 – 28 MIF Toronto West Point will be exhibiting at the conference held at the Delta Hotel, where CEO and President Derek Macpherson is scheduled to present at 3:10 PM on Saturday, February 28th. For more information about the event and registration, please visit the MIF website.
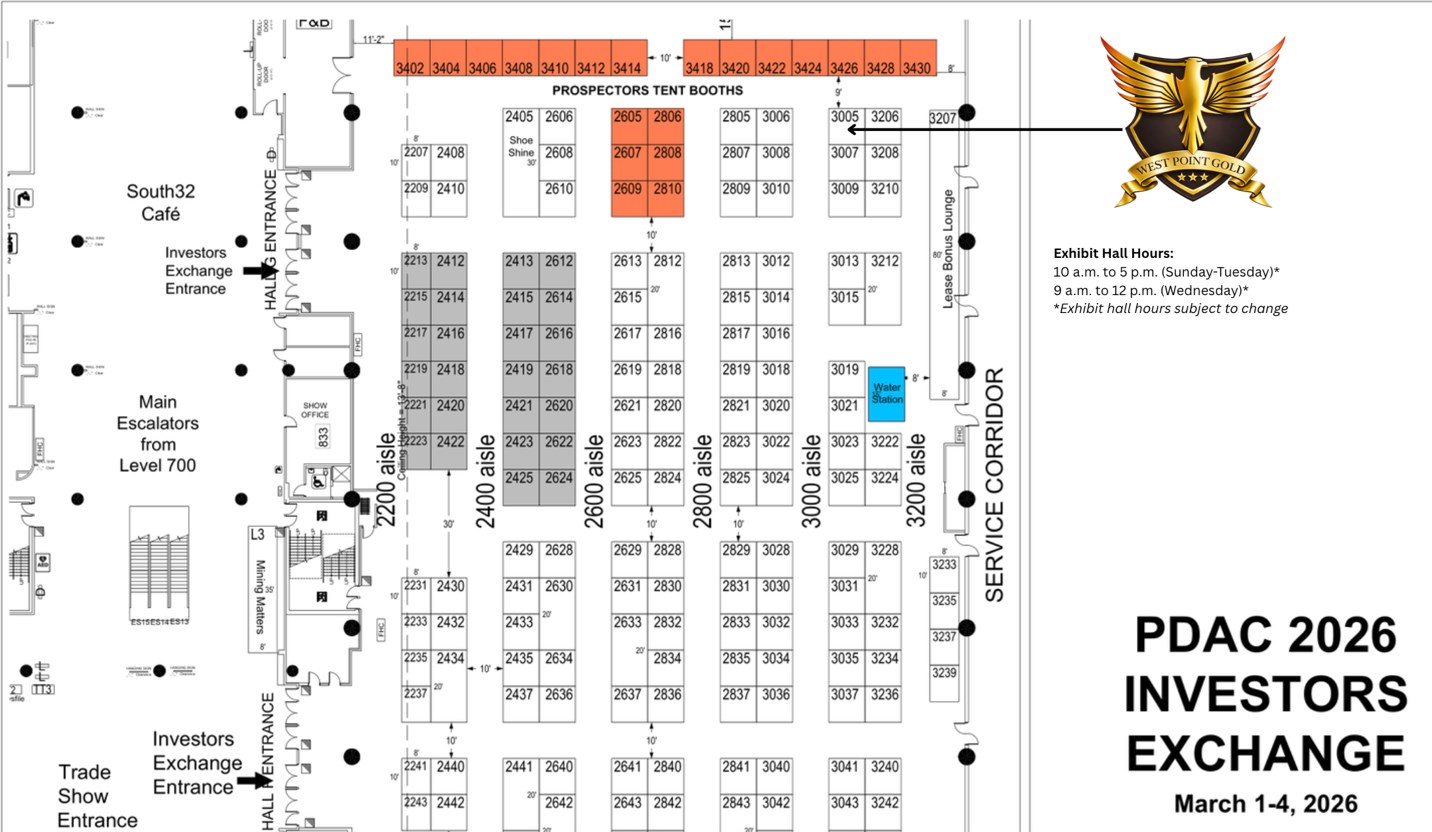
March 1 – 4 PDAC Booth Location West Point Gold will be exhibiting at booth 3005 in the Investors Exchange located in the MTCC South Building, Level 800. For more information about PDAC and registration, please visit the PDAC website.
About West Point Gold Corp. West Point Gold is an exploration and development company focused on unlocking value across four strategically located projects along the prolific Walker Lane Trend in Nevada and Arizona, USA, providing shareholders with exposure to multiple discovery opportunities across one of North America’s most productive gold regions. The Company’s near-term priority is advancing its flagship Gold Chain Project in Arizona.
For further information regarding this press release, please contact:
FORWARD-LOOKING STATEMENTS: Certain statements contained in this press release constitute forward-looking information. These statements relate to future events or future performance and the proposed Offering. Forward-looking statements include estimates and statements that describe the Company’s private placement, future plans, objectives or goals, including words to the effect that the Company or management expects a stated condition or result to occur. The use of any of the words “could”, “intend”, “expect”, “believe”, “will”, “projected”, “estimated” and similar expressions and statements relating to matters that are not historical facts are intended to identify forward-looking information and are based on the Company’s current belief or assumptions as to the outcome and timing of such future events including, among others, assumptions about future prices of gold, silver, and other metal prices, currency exchange rates and interest rates, favourable operating conditions, political stability, obtaining government approvals and financing on time, obtaining renewals for existing licenses and permits and obtaining required licenses and permits, labour stability, stability in market conditions, availability of equipment, availability of drill rigs, and anticipated costs and expenditures. The Company cautions that all forward-looking statements are inherently uncertain, and that actual performance may be affected by a number of material factors, many of which are beyond the Company’s control. Such factors include, among other things: risks and uncertainties relating to the Company’s ability to complete any payments or expenditures required under the Company’s various option agreements for its projects; and other risks and uncertainties relating to the actual results of current exploration activities, the uncertainties related to resources estimates; the uncertainty of estimates and projections in relation to production, costs and expenses; risks relating to grade and continuity of mineral deposits; the uncertainties involved in interpreting drill results and other exploration data; the potential for delays in exploration or development activities; uncertainty related to the geology, grade and continuity of mineral deposits; the possibility that future exploration, development or mining results may vary from those expected; statements about expected results of operations, royalties, cash flows, financial position may not be consistent with the Company’s expectations due to accidents, equipment breakdowns, title and permitting matters, labour disputes or other unanticipated difficulties with or interruptions in operations, fluctuating metal prices, unanticipated costs and expenses, uncertainties relating to the availability and costs of financing needed in the future and regulatory restrictions, including environmental regulatory restrictions. The possibility that future exploration, development or mining results will not be consistent with adjacent properties and the Company’s expectations; operational risks and hazards inherent with the business of mining (including environmental accidents and hazards, industrial accidents, equipment breakdown, unusual or unexpected geological or structural formations, cave-ins, flooding and severe weather); metal price fluctuations; environmental and regulatory requirements; availability of permits, failure to convert estimated mineral resources to reserves; the inability to complete a feasibility study which recommends a production decision; the preliminary nature of metallurgical test results; fluctuating gold prices; possibility of equipment breakdowns and delays, exploration cost overruns, availability of capital and financing, general economic, political risks, market or business conditions, regulatory changes, timeliness of government or regulatory approvals and other risks involved in the mineral exploration and development industry, and those risks set out in the filings on SEDAR+ made by the Company with securities regulators. Although the Company believes that the assumptions and factors used in preparing the forward-looking information in this corporate press release are reasonable, undue reliance should not be placed on such information, which only applies as of the date of this news release, and no assurance can be given that such events will occur in the disclosed time frames or at all. The Company expressly disclaims any intention or obligation to update or revise any forward-looking statements whether as a result of new information, future events or otherwise, other than as required by applicable securities legislation.
Neither the TSX Venture Exchange nor its Regulation Services Provider (as that term is defined in the policies of the TSX Venture Exchange) accepts responsibility for the adequacy or accuracy of this release.
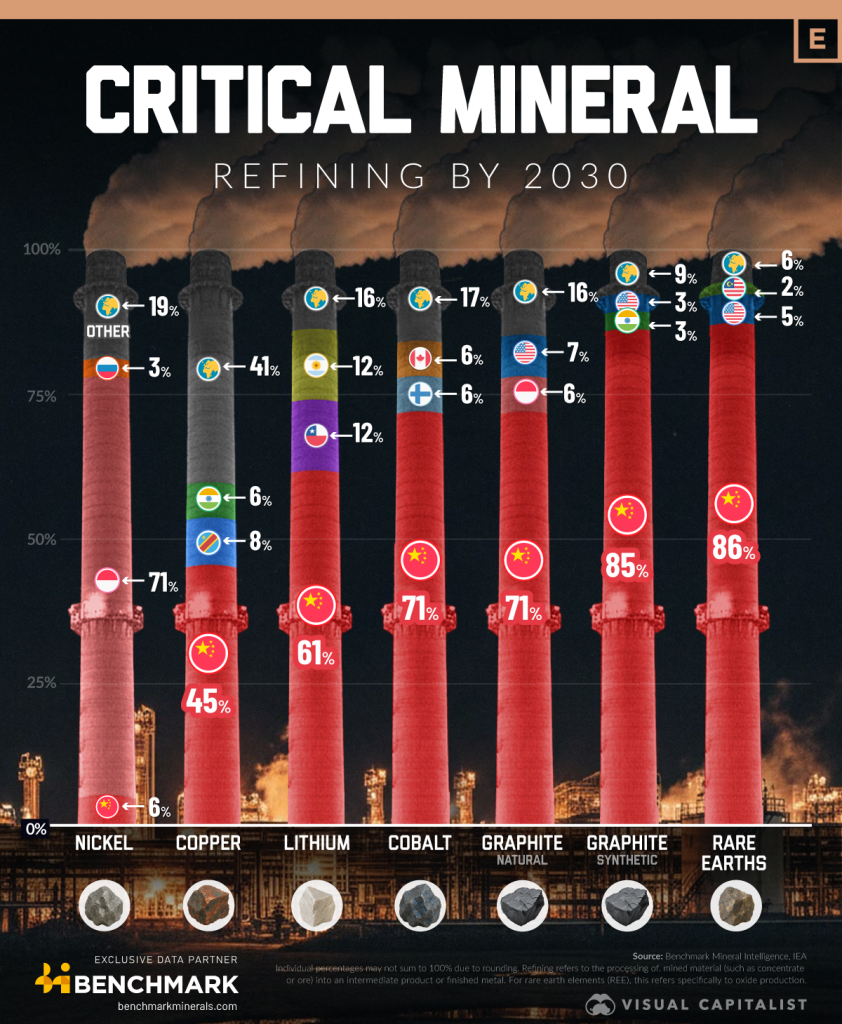
With one major exception, the data shows that one country will dominate future refining shares. China.
China to Dominate the Future of Critical Mineral Refining
By 2030, China will play a dominant role in lithium, rare earth elements (REEs), cobalt, and graphite, controlling nearly 60% of all critical mineral refining. Such concentrated processing capacity offers efficiencies that may lower costs but heightens geopolitical risk for downstream buyers.
It also leaves limited room for late-moving countries looking to gain share without major capital commitments.
Country
🟫 Nickel
🔌 Copper
🔋 Lithium
🧲 REE
⚗️ Cobalt
✏️ Graphite (Synthetic)
🪨 Graphite (Natural)
China
6.24%
44.63%
60.86%
86.11%
71.42%
85.16%
70.50%
Indonesia
71.24%
—
—
—
—
—
6.30%
Russia
3.26%
—
—
—
—
—
—
DRC
—
7.96%
—
—
—
—
—
India
—
6.41%
—
—
—
3.06%
—
Chile
—
—
11.59%
—
—
—
—
Argentina
—
—
11.58%
—
—
—
—
United States
—
—
—
5.14%
—
2.79%
7.22%
Malaysia
—
—
—
2.27%
—
—
—
Finland
—
—
—
—
5.87%
—
0.69%
Canada
—
—
—
—
5.73%
—
4.47%
South Korea
—
—
—
—
—
—
3.56%
Australia
—
—
—
—
—
—
2.01%
Sweden
—
—
—
—
—
—
1.84%
Morocco
—
—
—
—
—
—
1.15%
Saudi Arabia
—
—
—
—
—
—
0.94%
Uganda
—
—
—
—
—
—
0.72%
Tanzania
—
—
—
—
—
—
0.58%
🌍 Other
19.27%
40.99%
15.98%
6.49%
16.97%
8.98%
—
Nickel’s Outlier: Indonesia Leads, China Trails
Nickel is the one mineral where China is not on top. Indonesia will command over 71.24% of refined nickel by leveraging its large ore reserves, expanding low-cost refineries, and enforcing a ban on raw ore exports.
China’s share is just 6.24%, with Russia at 3.26% and the rest of the world spread across “Other” at 19.27%. This shift positions Indonesia as a price-setting force in nickel used for stainless steel or EV batteries.
Copper Is More Fragmented; North America Plays Niche Roles
Copper refining is relatively diversified. China holds 44.63%, but “Other” countries make up 40.99%, indicating broader global refining capacity.
The U.S. appears notably in rare earths (REEs) at 5.14%, while Finland and Canada register meaningful shares in cobalt at 5.87% and 5.73%, respectively.
These footholds can strengthen regional EV supply chains, but they still pale in comparison to China’s scale.
Vancouver, British Columbia–(Newsfile Corp. – February 19, 2026) – West Point Gold Corp. (TSXV: WPG) (OTCQB: WPGCF) (FSE: LRA0) (“West Point Gold” or the “Company”) is pleased to announce the closing of its previously announced “commercially reasonable efforts” private placement for aggregate gross proceeds of approximately C$25 million (the “Offering”) for 22,727,300 common shares (the “Shares”) at an issue price of C$1.10 per Share (the “Issue Price”) with SCP Resource Finance LP, as lead agent, together with ATB Cormark Capital Markets, Red Cloud Securities Inc., Paradigm Capital Inc. and Canaccord Genuity Inc. (collectively, the “Agents”).
As consideration for their services, the Agents received an aggregate cash commission of C$837,470, which is equal to 5% of the gross proceeds of the Offering, other than Shares sold to purchasers on the Company President’s List, which were subject to a reduced cash commission of 2%. Each of SCP Resource Finance LP and Red Cloud Securities Inc. elected to receive 50% of their cash commission in Shares, representing 264,162 Shares at the Issue Price (“Agent Option Shares“). The Agents were also paid an advisory fee of C$34,741. As additional consideration for their services, the Agents were also issued 1,045,456 broker warrants (“Broker Warrants“) equal to 5% of Shares sold, except that no broker warrants were issued for Shares sold to purchasers on the President’s List. Each Broker Warrant issued is exercisable to purchase one Share at the Issue Price until February 19, 2028 (“Broker Warrant Shares“).
The Company intends to use the net proceeds from the Offering for exploration and advancement of the Company’s Gold Chain Project in Arizona, USA, and for general corporate and working capital purposes.
All Shares, including the Agent Option Shares, and Broker Warrants and Broker Warrant Shares issued under the Offering are subject to a statutory hold period in accordance with applicable Canadian securities laws, expiring June 20, 2026. The Offering remains subject to the final acceptance of the TSX Venture Exchange.
Directors of the Company including Andrew Bowering, Anthony Paterson and Conrad Nest participated in the Offering and acquired 659,600 Shares for C$725,560. The participation of these insiders in the Offering constitutes a Related Party Transaction within the meaning of Multilateral Instrument 61-101 Protection of Minority Security Holders in Special Transactions (“MI 61-101“). The board of directors of the Company, with Messrs. Bowering, Paterson and Nest abstaining, determined that the transaction is exempt from the formal valuation and minority shareholder approval requirements based on the exemptions contained in sections 5.5(a) and 5.7(1)(a) of MI 61-101 for the related party transaction, as neither the fair market value of securities issued to the insiders nor the consideration paid by the insiders exceeded 25 percent of the Company’s market capitalization. The Company did not file a material change report in respect of the transaction 21 days in advance of the closing of the Offering because insider participation had not previously been confirmed and the shorter period was necessary in order to permit the Company to close the Offering in a timeframe consistent with usual market practice for transactions of this nature.
About West Point Gold Corp. West Point Gold Corp. (formerly Gold79 Mines Ltd.) is a publicly listed company focused on gold discovery and development at four prolific Walker Lane Trend projects covering Nevada and Arizona, USA. West Point Gold is focused on developing a maiden resource at its Gold Chain project in Arizona, while JV partner Kinross is advancing the Jefferson Canyon project in Nevada.
For further information regarding this press release, please contact: Aaron Paterson, Corporate Communications Manager Phone: +1 (778) 358-6173 Email: info@westpointgold.com
looking statements whether as a result of new information, future events or otherwise, other than as required by applicable securities legislation.
Neither the TSX Venture Exchange nor its Regulation Services Provider (as that term is defined in the policies of the TSX Venture Exchange) accepts responsibility for the adequacy or accuracy of this release.
Not for distribution to United States newswire services or for dissemination in the United States. Not an offer of securities for sale in the United States.
Tokenization Was Supposed to Stop Fraud. It Didn’t. Here’s Why.
For the last decade, tokenization has been the “big fix” everyone was promised.
One legacy card rail has issued more than 10 billion tokens. Another states, of its ~5 billion tokens issued, one in four of its transactions is now tokenized and growing. Analysts project that more than 80% of global ecommerce will be tokenized within a few years.
And tokenization delivered real gains. Breach liability shifted away from merchants. PANs stopped sitting in databases where they didn’t belong.
Defenders will point to lower fraud rates on tokenized transactions – and they’re right. But when absolute fraud dollars keep climbing year after year, “less bad” isn’t good enough.
But here’s the problem: fraud keeps climbing.
U.S. card fraud hit $14.3B last year, up from $13.6B the year before. In the U.S., card-not-present fraud – where tokenization was supposed to help most – now represents 65–70% of all fraud losses. Roughly $10B a year.
During Cyber 5 alone, over 4% of ecommerce transactions were flagged as suspected fraud attempts. And for guest checkout – nearly half of all e-commerce – tokenization doesn’t even apply. The PAN still travels in the clear.
So if token adoption is exploding…why isn’t fraud collapsing?
Because tokens didn’t remove the problem.
They relocated it. A token is still a credential – a value that exists, travels, and can be intercepted or replayed. It still maps back to a PAN – and every system that touches that mapping becomes an attack surface.
Tokens don’t expire in any meaningful way. They sit in merchant systems for months, years – persistent targets waiting to be found.
When attackers find the seams – replay vulnerabilities, wallet provisioning exploits, fallback-to-PAN routing – the fraud vector reopens. Tokenization reduces certain categories of fraud.
But it doesn’t address the root cause: We still move reusable credentials through the system.
Attackers don’t care whether the credential is a PAN, a token, or a session key. If it works tomorrow, it’s worth stealing today.
That’s why even as tokenization expands, the U.S. remains the global outlier – 25% of global card volume, but 42% of global fraud.
You still pay the price: time lost, accounts frozen, funds drained through a system that was never designed for today’s attack surface.
Tokenization wasn’t a breakthrough. It was a bandaid for decades of payment infrastructure debt – a failure of imagination dressed up as innovation. It solved the edges. It never solved the architecture.
And it was built for a world before quantum computing and effective artificial intelligence. That world is ending faster than legacy networks or merchants can keep up.
The real question was never “How do we protect credentials?”
This press release constitutes a “designated news release” for the purposes of the Sprott Physical Copper Trust’s prospectus supplement dated July 8, 2024 to its base shelf prospectus dated July 3, 2024.
TORONTO, Feb. 17, 2026 (GLOBE NEWSWIRE) — Sprott Asset Management LP (“Sprott Asset Management”), a wholly-owned subsidiary of Sprott Inc. (“Sprott”) (NYSE/TSX: SII), on behalf of the Sprott Physical Copper Trust (TSX: COP.UN) (TSX: COP.U) (the “Trust” or “COP”), a closed-end trust created to invest and hold substantially all of its assets in physical copper metal, today announced that, in connection with the previously announced approval by the United States’ Securities and Exchange Commission (the “SEC”) of a Rule 19b-4 application filed by the NYSE Arca to list and trade COP’s trust units (the “Units”) on NYSE Arca, amendments have been made to the Trust’s trust agreement (the “Trust Agreement”).
The amendments to the Trust Agreement (i) provide that, following COP unitholder approval at a meeting of unitholders as required under applicable Canadian securities laws, COP’s current semi-annual redemption feature will become a monthly redemption feature and the current cap on the number of Units that can be redeemed each redemption period (currently capped at 1.5% of the outstanding Units at the end of the applicable notice period) will be removed, and (ii) make certain consequential changes related to the foregoing and the potential listing of the Units on the NYSE Arca. The date of the COP unitholder meeting will be announced in due course, but the Trust’s intention is to closely align the date of the unitholder meeting and the effectiveness of a registration statement to be filed under the U.S. Securities Exchange Act of 1934 in respect of the listing of the Units on the NYSE Arca (the “Registration Statement”).
The summary of the amendments in this press release is qualified in its entirety by the provisions of Amendment No. 1 to the Trust Agreement, a copy of which will be filed under the Trust’s profile on SEDAR+ at www.sedarplus.ca. Additional details regarding the COP unitholder meeting will be provided in meeting materials made available at a later date and will also be filed under the Trust’s profile on SEDAR+ at www.sedarplus.ca.
The listing of the Units on the NYSE Arca remains subject to the filing and effectiveness of the Registration Statement. The Trust cannot provide any assurance that it will be successful in achieving a listing of the Units on the NYSE Arca.
About Sprott Sprott is a global asset manager focused on precious metals and critical materials. At Sprott, we are specialists. We believe our in-depth knowledge, experience and relationships separate us from the generalists. Our investment strategies include Exchange Listed Products, Managed Equities and Private Strategies. Sprott has offices in Toronto, New York, Connecticut and California and Sprott’s common shares are listed on the New York Stock Exchange and the Toronto Stock Exchange under the symbol “SII”. For more information, please visit www.sprott.com. Sprott Asset Management is a wholly-owned subsidiary of Sprott and is the investment manager to the Trust.
About the Trust
Important information about the Trust, including the investment objectives and strategies, applicable management fees, and expenses, is contained in the current annual information form for the Trust and the Trust’s prospectus. Please read these documents carefully before investing. You will usually pay brokerage fees to your dealer if you purchase or sell units of the Trust on a stock exchange. If the units are purchased or sold on a stock exchange, investors may pay more than the current net asset value when buying units or shares of the Trust and may receive less than the current net asset value when selling them. Investment funds are not guaranteed, their values change frequently and past performance may not be repeated.
Forward-Looking Statements This press release contains “forward-looking information” and “forward-looking statements” within the meaning of applicable Canadian and U.S. securities laws (collectively, “forward-looking statements”). Forward-looking statements in this press release include, without limitation, statements regarding the listing of the Units on NYSE Arca, the filing and effectiveness of the Registration Statement, and amendments to COP’s redemption feature. With respect to the forward-looking statements contained in this press release, the Trust has made numerous assumptions regarding, among other things: subsequent U.S. listing of the Units, ability to obtain unitholder approval for amendments to COP’s redemption feature, as well as dynamics in the copper market. While the Trust considers these assumptions to be reasonable, these assumptions are inherently subject to significant business, economic, competitive, market and social uncertainties and contingencies. Additionally, there are known and unknown risk factors and uncertainties that could cause the Trust’s actual results, performance or achievements to be materially different from any future results, performance or achievements expressed or implied by the forward-looking statements contained in this press release. A discussion of certain risks and uncertainties facing the Trust appears in the Trust’s Annual Information Form for the year ended December 31, 2024, and its prospectus supplement dated July 8, 2024 and related short-form base shelf prospectus dated July 3, 2024, as updated by the Trust’s continuous disclosure filings, which are available at www.sedarplus.ca. All forward-looking statements herein are qualified in their entirety by this cautionary statement, and the Trust disclaims any obligation to revise or update any such forward-looking statements or to publicly announce the result of any revisions to any of the forward-looking statements contained herein to reflect future results, events or developments, except as required by law.
Contact: Glen Williams Senior Managing Partner Investor and Institutional Client Relations Direct: 416-943-4394 gwilliams@sprott.com
Elemental Royalty signaled on Tuesday that investors will be able to receive dividends in the form of Tether’s XAUT, establishing a novel use case for tokenized gold on Wall Street.
The move is aimed at providing investors with direct ownership of physical gold, stemming from investments in gold royalties, the Colorado-based firm said in a press release. In total, investors are expected to receive a 12 cent dividend across several quarterly payments.
The company’s investors can still receive distributions in cash, as is traditional. But Elemental CEO David Cole described the company’s support of Tether’s product as innovative.
“The decision to offer investors a dividend in kind, in the form of Tether Gold, further differentiates Elemental as a forward-thinking, growth-oriented investment,” he said.
Elemental’s stock price fell 7.8% on Tuesday to $19.41, according to Yahoo Finance. The firm makes money by acquiring royalties tied to mining projects. Elemental said its approach avoids risks associated with owning and operating a mine, while maintaining the upside.
Tether’s legacy was built on tokens pegged to the U.S. dollar, but the stablecoin issuer has embraced tokenized gold as the precious metal’s price has surged 66% over the past year. Meanwhile, XAUT’s market capitalization has swelled to $2.5 billion from $714 million.
Earlier this month, the token’s total value peaked at $3.5 billion, according to CoinGecko, as the price of gold rose to new highs.
In January, YouTube rival Rumble said that it had adopted XAUT as a medium of exchange on its platform, allowing users to tip the token to creators alongside Bitcoin and Tether’s flagship stablecoin, USDT. To bolster the token’s use in payments, Tether also introduced the term Scudo, which represents 1/1,000th of a troy ounce of gold and its XAUT token.
Those moves were focused on consumers, but Elemental shows how tokenized gold can be used as a tool in real-world corporate finance, according to Tether CEO Paolo Ardoino.
“This marks a major step forward for the gold industry and shows how tokenized assets can unlock new financial models that were previously out of reach,” he said in a press release, describing previous efforts to integrate the token on Wall Street as difficult.
Earlier this month, Ardoino estimated that the company’s gold holdings stood at 140 tons, nestled within a former nuclear bunker in Switzerland. At the time, that sum was worth an estimated $24 billion. Tether partially backs its $183 billion USDT stablecoin with gold.
At a market capitalization of $2.2 billion, Tether’s XAUT faces competition from PAX Gold. The products debuted within months of each other more than six years ago.
Despite their time in the market, Wintermute is among market makers that have only recently moved to support the token. Last week, the company said that it had begun executing over-the-counter trades in XAUT and PAX Gold on behalf of financial institutions.
The firm that handles billions of dollars in daily trading volume noted that there is robust demand for trading tokenized gold round-the-clock amid de-dollarization pressures. Along those lines, the company forecast that tokenized gold could become a $15 billion market by year-end.
MONTREAL, Feb. 18, 2026 (GLOBE NEWSWIRE) — Aya Gold & Silver Inc. (TSX: AYA; OTCQX: AYASF) (“Aya” or the “Corporation”) is pleased to announce high-grade silver drill results from its at-depth drill exploration program at the Zgounder Silver Mine in the Kingdom of Morocco.
Highlights (all intersections are in core lengths)
Intersections in the Open-Pit Area:
Hole ZG-RC-25-853 intercepted 781 grams per tonne (“g/t”) silver (“Ag”) over 9.0 metres (“m”), including 1,295 g/t Ag over 5.0m
Hole ZG-RC-25-855 intercepted 1,454 g/t Ag over 3.0m
Intersections at Depth Near the Western Fault contact:
Hole ZG-SF-25-340 intercepted 336 g/t Ag over 5.5m
Hole ZG-SF-25-350 intercepted 2,198 g/t Ag over 1.0m
Intersections in the Central Area:
Hole ZG-SF-25-347 intercepted 3,581 g/t Ag over 4.5m, including 5,893 g/t Ag over 2.5m
Hole ZG-SF-25-347 intercepted 1,729 g/t Ag over 4.1m, including 4,480 g/t Ag over 1.5m
Hole T28-26-1072 intercepted 6,223 g/t Ag over 3.6m
Hole T28-26-1104 intercepted 4,489 g/t Ag over 6.0m
3,117m or 10.3% of the 2026 exploration program has been drilled year to date.
“Today’s high-grade results once again confirm the strong continuity of silver mineralization both at depth and around the open-pit area,” said Benoit La Salle, President & CEO. “Moreover, the new intersection at depth near the Western Fault contact in hole ZG-SF-25-340 extends mineralization further west, continuing to push the boundary of our current resource model.”
This release contains results from 256 holes, which include 13 surface diamond drill holes (“DDH”), 69 underground DDH, 41 reverse circulation drill hole (“RC”), 101 T28 and 32 YAK holes (T28 and YAK: percussion drilling using an air-compressed hammer). For a full summary of today’s results, refer to Appendix 1.
Table 1 – Best Intercepts at Zgounder in 2025 (core lengths)
Hole ID
From
To
Ag
Length*
Ag x width
(g/t)
(m)
Underground DDH
ZG-SF-25-339
251.5
253.0
1 733
1.5
2 600
ZG-SF-25-340
254.4
259.9
336
5.5
1 848
ZG-SF-25-341
341.0
345.0
1 075
4.0
4 300
Including
342.0
344.0
1 928
2.0
3 856
ZG-SF-25-342
282.5
286.0
652
3.5
2 282
ZG-SF-25-343
284.5
289.0
3 581
4.5
16 116
Including
284.5
287.0
5 893
2.5
14 732
ZG-SF-25-347
40.4
44.5
1 729
4.1
7 089
Including
43.0
44.5
4 480
1.5
6 720
ZG-SF-25-347
65.0
66.5
1 535
1.5
2 302
ZG-SF-25-347
127.0
128.5
1 228
1.5
1 842
ZG-SF-26-348
63.5
65.0
2 025
1.5
3 038
ZG-SF-26-348
129.0
133.5
1 366
4.5
6 149
ZG-SF-26-350
257.5
258.5
2 198
1.0
2 198
DZG-SF-25-776
43.0
48.5
1 138
5.5
6 260
Including
45.0
47.0
2 766
2.0
5 532
DZG-SF-25-777
53.5
58.0
844
4.5
3 798
Including
53.5
55.5
1 597
2.0
3 194
Surface RC
ZG-RC-25-853
103.0
112.0
781
9.0
7 029
Including
106.0
111.0
1 295
5.0
6 474
ZG-RC-25-854
114.0
116.0
895
2.0
1 789
ZG-RC-25-855
85.0
88.0
1 454
3.0
4 362
Underground T28
T28-25-1047
0.0
12.0
155
12.0
1 865
T28-25-1049
2.4
8.4
476
6.0
2 858
T28-25-1059
22.8
26.4
6 223
3.6
22 404
T28-26-1072
9.6
14.4
961
4.8
4 612
Including
9.6
12.0
1 790
2.4
4 296
T28-26-1075
0.0
4.8
2 934
4.8
14 083
Including
0.0
2.4
5 725
2.4
13 740
T28-26-1103
24.0
26.4
988
2.4
2 371
T28-26-1104
19.2
25.2
4 489
6.0
26 933
T28-26-1119
8.4
13.2
285
4.8
1 368
T28-26-1127
19.2
25.2
273
6.0
1 637
T28-26-1130
7.2
12.0
373
4.8
1 790
Underground YAK
YAK-25-408
3.6
4.8
6 060
1.2
7 272
* True widths are undetermined; all values are uncut.
Location of Drill Results at Zgounder
Figure 1: Location of Drill Results at Zgounder
Quality Assurance
For core drilling, all individual samples represent approximately one meter in length of core, which is halved. Half of the core is kept on site for reference, and its counterpart is sent for preparation and assaying to African Laboratory for Mining and Environment (“Afrilab”) in Marrakech, Morocco or to ALS Laboratory at the Zgounder Mine site. All samples are analyzed for silver, copper, iron, lead, and zinc using Aqua regia and finished by atomic absorption spectroscopy (“AAS”). Samples grading above 200 g/t Ag are reanalyzed by fire assay.
For definition drilling using RC, all individual samples represent 1.0m in length and for T28 drilling equipment, all individual samples represent 1.2m in length. Samples are assayed at either the ALS Mine laboratory or at Afrilab. All samples are analyzed for silver, copper, iron, lead, and zinc using Aqua regia and finished by AAS. Samples grading above 200 g/t Ag are reanalyzed by fire assay. Rigorous quality controls (QaQc) are applied at both locations.
David Lalonde, B.Sc. P. Geo, Vice-President Exploration, is Aya Gold & Silver’s Qualified Person and has reviewed this press release for accuracy and compliance with National Instrument 43-101.
About Aya Gold & Silver Inc.
Aya Gold & Silver is a Canadian precious metals mining company anchored in Morocco and active across the full mining value chain. The Corporation has established an exploration track record through a systematic, technology-led, data-driven approach and is focused on expanding its resource base and land package along the Anti-Atlas Fault — one of Africa’s most geologically rich, underexplored and mining-friendly regions.
Aya operates Zgounder, a rare, silver-only mine, producing silver doré from its newly expanded processing facility. Aya’s growth pipeline includes the Boumadine polymetallic project, where feasibility study work is underway. The project hosts a substantial mineral resource, an extensive mineralized footprint, and significant potential for further discovery.
Led by a proven team of mining professionals, Aya is guided by a vision of responsible mining and is committed to delivering sustainable value for shareholders, employees and host communities.
This press release contains certain statements that constitute forward-looking information within the meaning of applicable securities laws (“forward-looking statements”), which reflects management’s expectations regarding Aya’s future growth and business prospects (including the timing and development of new deposits and the success of exploration activities) and other opportunities. Wherever possible, words such as “aim”, “anticipate”, “assume”, “believe”, “estimate”, “expect”, “goal”, “intend”, “objective”, “plan”, “potential”, “strategy”, “target”, and similar expressions or statements that certain actions, events or results “may”, “could”, “would”, “might”, “will”, or are “likely” to be taken, occur or be achieved, have been used to identify such forward-looking information. Specific forward-looking statements in this press release include, but are not limited to, statements and information with respect to the potential to confirm continuity of mineralization and extent mineralization to the west and other assumptions and factors generally associated with the mining industry.
Forward-looking information is based upon certain assumptions and other important factors that, if untrue, could cause the actual results, performance or achievements of the Corporation to be materially different from future results, performance or achievements expressed or implied by such information or statements. There can be no assurance that such information or statements will prove to be accurate. Key assumptions upon which the Corporation’s forward-looking information is based include without limitation, the Corporation’s ability to timely receive any requisite approvals, permits or licences; the Corporation’s ability to import goods and machinery; the Corporation’s ability to engage and retain all necessary personnel in order to operate its business properly and without interruption; the accuracy and reliability of estimates, projections, forecasts, studies and assessments, including the Mineral Reserve and Mineral Resource Estimates (including, but not limited to, ore tonnage and ore grade estimates); the Corporation’s ability to meet or achieve estimates, projections and forecasts; assumptions regarding development and exploration activities; the timing, extent, duration and economic viability of such explorations activities; the price of silver; the price of gold; exchange rates; taxation levels; fuel and energy costs; future economic conditions; the Corporation’s ability to meet current and future obligations; the Corporation’s ability to obtain timely financing on reasonable terms when required; anticipated future estimates of free cash flow; estimate future production; the current and future social, economic and political conditions and environment in which the Corporation operates; and other assumptions and factors generally associated with the mining industry.
Readers are cautioned that the foregoing list is not exhaustive of all factors and assumptions which may have been used. Forward-looking statements are also subject to risks and uncertainties facing the Corporation’s business, any of which could have a material adverse effect on the Corporation’s business, financial condition, results of operations and growth prospects. Some of the risks the Corporation faces and the uncertainties that could cause actual results to differ materially from those expressed in the forward-looking statements include, among others: the inherent risks involved in exploration and development of mineral properties, including (1) there being no significant disruptions affecting the operations of the Corporation whether due to artisanal miners, access to water, extreme weather events and other or related natural disasters, labour disruptions, supply disruptions, power disruptions, damage to equipment or otherwise; (2) permitting, development, operations and production from the Project being consistent with the Corporation’s expectations; (3) political and legal developments in the Kingdom of Morocco being consistent with its current expectations; (4) the exchange rate between the U.S. dollar and the Moroccan Dirham being approximately consistent with current levels; (5) certain price assumptions for gold and silver; (6) prices for diesel, process reagents, fuel oil, electricity and other key supplies being approximately consistent with current levels; (7) production and cost of sales forecasts meeting expectations; (8) the accuracy of the current mineral resource estimates of the Corporation; (9) labour and materials costs increasing on a basis consistent with the Corporation’s current expectations; and (10) asset impairment (or reversal) potential, being consistent with the Corporation’s current expectations.
In addition, readers are directed to carefully review the detailed risk discussion in the Corporation’s Annual Information Form and Management’s Discussion & Analysis for the year ended December 31, 2024, filed on SEDAR+, which discussions are incorporated by reference in this presentation, for a fuller understanding of the risks and uncertainties that affect the Corporation’s business and operations.
Although the Corporation believes its expectations are based upon reasonable assumptions and has attempted to identify important factors that could cause actual actions, events or results to differ materially from those described in forward-looking statements, there may be other factors that cause actions, events or results not to be as anticipated, estimated or intended. There can be no assurance that forward-looking information will prove to be accurate, as actual results and future events could differ materially from those anticipated in such information. As such, these risks are not exhaustive; however, they should be considered carefully. If any of these risks or uncertainties materialize, actual results may vary materially from those anticipated in the forward-looking statements found herein. Due to the risks, uncertainties, and assumptions inherent in forward-looking statements, readers should not place undue reliance on forward-looking statements.
Forward-looking statements contained herein are presented for the purpose of assisting investors in understanding the Corporation’s business plans, financial performance and condition and may not be appropriate for other purposes.
The forward-looking statements contained herein are made only as of the date hereof. The Corporation disclaims any intention or obligation to update or revise any forward-looking statements, whether as a result of new information, future events or otherwise, except to the extent required by applicable law. The Corporation qualifies all of its forward-looking statements by these cautionary statements.
Nothing in this document should be construed as either an offer to sell or a solicitation to buy or sell Aya securities. All references to Aya include its subsidiaries unless the context requires otherwise.
Appendix 1 – Mineral Intercepts from Drilling at Zgounder (core lengths)
Hole ID
From
To
Ag (g/t)
Length (m)*
Ag x width
Surface DDH
ZG-25-167
520.2
521.2
212
1.0
212
ZG-25-170
212.0
212.5
92
0.5
46
ZG-25-170
216.0
216.5
128
0.5
64
ZG-25-170
220.5
221.0
84
0.5
42
ZG-25-172
181.0
182.5
177
1.5
266
ZG-25-172
202.0
203.0
76
1.0
76
ZG-25-173
23.5
29.5
101
6.0
606
ZG-25-173
34.0
35.5
320
1.5
480
ZG-25-178
229.5
230.2
86
0.7
60
ZG-26-180
209.5
211.0
240
1.5
359
Underground DDH
ZG-SF-25-339
251.5
253.0
1 733
1.5
2 600
ZG-SF-25-339
261.0
264.0
164
3.0
492
ZG-SF-25-340
254.4
259.9
336
5.5
1 848
ZG-SF-25-340
262.9
264.9
264
2.0
528
ZG-SF-25-341
286.0
287.0
372
1.0
372
ZG-SF-25-341
341.0
345.0
1 075
4.0
4 300
Including
342.0
344.0
1 928
2.0
3 856
ZG-SF-25-342
260.0
262.0
133
2.0
267
ZG-SF-25-342
282.5
286.0
652
3.5
2 282
ZG-SF-25-342
360.5
362.0
76
1.5
114
ZG-SF-25-342
366.0
370.0
77
4.0
308
ZG-SF-25-342
381.0
382.5
92
1.5
138
ZG-SF-25-342
391.0
392.5
156
1.5
234
ZG-SF-25-343
284.5
289.0
3 581
4.5
16 116
Including
284.5
287.0
5 893
2.5
14 732
ZG-SF-25-344
302.5
303.4
916
0.9
824
ZG-SF-25-344
313.5
315.0
216
1.5
324
ZG-SF-25-344
318.0
319.5
104
1.5
156
ZG-SF-25-346
276.5
279.5
384
3.0
1 152
ZG-SF-25-347
40.4
44.5
1 729
4.1
7 089
Including
43.0
44.5
4 480
1.5
6 720
ZG-SF-25-347
65.0
66.5
1 535
1.5
2 302
ZG-SF-25-347
119.5
121.0
152
1.5
228
ZG-SF-25-347
127.0
128.5
1 228
1.5
1 842
ZG-SF-26-348
63.5
65.0
2 025
1.5
3 038
ZG-SF-26-348
129.0
133.5
1 366
4.5
6 149
ZG-SF-26-349
143.0
144.0
89
1.0
89
ZG-SF-26-349
157.0
158.0
76
1.0
76
ZG-SF-26-349
186.0
188.5
215
2.5
538
ZG-SF-26-350
257.5
258.5
2 198
1.0
2 198
ZG-SF-26-350
308.2
309.2
88
1.0
88
DZG-SF-25-747
85.0
85.6
272
0.6
163
DZG-SF-25-772
12.5
14.0
240
1.5
360
DZG-SF-25-772
51.5
52.0
2 000
0.5
1 000
DZG-SF-25-776
43.0
48.5
1 138
5.5
6 260
Including
45.0
47.0
2 766
2.0
5 532
DZG-SF-25-777
48.0
50.0
163
2.0
326
DZG-SF-25-777
53.5
58.0
844
4.5
3 798
Including
53.5
55.5
1 597
2.0
3 194
DZG-SF-25-778
7.5
11.3
310
3.8
1 178
DZG-SF-25-780
48.0
49.0
175
1.0
175
DZG-SF-25-780
59.0
60.5
82
1.5
123
DZG-SF-25-828
3.7
5.7
92
2.0
184
DZG-SF-25-840
32.0
35.5
143
3.5
499
DZG-SF-25-844
12.0
13.5
76
1.5
114
DZG-SF-26-832
18.9
20.5
146
1.6
234
DZG-SF-26-833
13.0
15.0
112
2.0
224
DZG-SF-26-858
102.0
103.5
155
1.5
232
DZG-SF-26-858
134.5
136.0
96
1.5
144
Surface RC
ZG-RC-25-849
104.0
105.0
503
1.0
503
ZG-RC-25-850
113.0
114.0
87
1.0
87
ZG-RC-25-852
98.0
99.0
95
1.0
95
ZG-RC-25-853
92.0
95.0
332
3.0
995
ZG-RC-25-853
101.0
102.0
124
1.0
124
ZG-RC-25-853
103.0
112.0
781
9.0
7 029
Including
106.0
111.0
1 295
5.0
6 474
ZG-RC-25-853
134.0
135.0
83
1.0
83
ZG-RC-25-853
137.0
138.0
93
1.0
93
ZG-RC-25-854
9.0
10.0
110
1.0
110
ZG-RC-25-854
17.0
18.0
119
1.0
119
ZG-RC-25-854
114.0
116.0
895
2.0
1 789
ZG-RC-25-855
10.0
11.0
167
1.0
167
ZG-RC-25-855
77.0
78.0
86
1.0
86
ZG-RC-25-855
85.0
88.0
1 454
3.0
4 362
ZG-RC-25-855
97.0
100.0
139
3.0
416
ZG-RC-25-855
102.0
103.0
86
1.0
86
ZG-RC-25-857
49.0
51.0
184
2.0
367
ZG-RC-25-857
77.0
78.0
89
1.0
89
ZG-RC-25-857
91.0
92.0
159
1.0
159
ZG-RC-26-753
54.0
55.0
79
1.0
79
ZG-RC-26-806
10.0
11.0
85
1.0
85
ZG-RC-26-841
42.0
43.0
180
1.0
180
ZG-RC-26-841
70.0
71.0
192
1.0
192
ZG-RC-26-841
92.0
93.0
102
1.0
102
ZG-RC-26-920
57.0
58.0
80
1.0
80
Underground T28
T28-25-965
9.6
10.8
556
1.2
667
T28-25-970
9.6
12.0
99
2.4
238
T28-25-970
18.0
19.2
119
1.2
143
T28-25-971
3.6
6.0
390
2.4
935
T28-25-973
6.0
9.6
146
3.6
526
T28-25-977
3.6
6.0
114
2.4
272
T28-25-985
16.8
18.0
201
1.2
241
T28-25-987
22.8
26.4
132
3.6
474
T28-25-991
24.0
26.4
142
2.4
341
T28-25-998
2.4
3.6
93
1.2
112
T28-25-1000
16.8
18.0
188
1.2
226
T28-25-1001
2.4
3.6
94
1.2
113
T28-25-1040
9.6
12.0
192
2.4
461
T28-25-1046
10.8
12.0
82
1.2
98
T28-25-1047
0.0
12.0
155
12.0
1 865
T28-25-1047
14.4
15.6
113
1.2
136
T28-25-1048
0.0
2.4
118
2.4
283
T28-25-1048
7.2
8.4
91
1.2
109
T28-25-1048
9.6
10.8
101
1.2
121
T28-25-1049
2.4
8.4
476
6.0
2 858
T28-25-1049
18.0
19.2
76
1.2
91
T28-25-1050
20.4
22.8
211
2.4
505
T28-25-1055
14.4
15.6
113
1.2
136
T28-25-1057
10.8
12.0
216
1.2
259
T28-25-1057
14.4
18.0
180
3.6
647
T28-25-1059
22.8
26.4
6 223
3.6
22 404
T28-25-1062
24.0
25.2
91
1.2
109
T28-26-1066
3.6
4.8
203
1.2
244
T28-26-1070
7.2
8.4
94
1.2
113
T28-26-1072
9.6
14.4
961
4.8
4 612
Including
9.6
12.0
1 790
2.4
4 296
T28-26-1074
0.0
2.4
108
2.4
259
T28-26-1075
0.0
4.8
2 934
4.8
14 083
Including
0.0
2.4
5 725
2.4
13 740
T28-26-1101
2.4
6.0
105
3.6
379
T28-26-1103
24.0
26.4
988
2.4
2371
T28-26-1104
19.2
25.2
4 489
6.0
26 933
T28-26-1119
8.4
13.2
285
4.8
1 368
T28-26-1127
19.2
25.2
273
6.0
1 637
T28-26-1128
15.6
19.2
128
3.6
461
T28-26-1130
7.2
12.0
373
4.8
1 790
T28-26-1131
10.8
15.6
100
4.8
480
Underground YAK
YAK-25-408
3.6
4.8
6 060
1.2
7 272
YAK-25-408
27.6
28.8
146
1.2
175
YAK-25-414
20.4
21.6
448
1.2
538
YAK-25-414
36.0
37.2
488
1.2
586
YAK-25-415
10.8
12.0
137
1.2
164
YAK-25-415
15.6
18.0
262
2.4
629
YAK-25-415
27.6
28.8
177
1.2
212
YAK-25-416
24.0
25.2
162
1.2
194
YAK-25-417
4.8
7.2
94
2.4
226
YAK-25-418
3.6
4.8
78
1.2
94
YAK-25-419
2.4
3.6
159
1.2
191
YAK-25-420
4.8
6.0
99
1.2
119
YAK-25-436
45.6
46.8
108
1.2
130
YAK-26-426
27.6
28.8
247
1.2
296
YAK-26-433
20.4
21.6
152
1.2
182
YAK-26-440
24.0
25.2
656
1.2
787
* True widths are undetermined; all values are uncut.
Appendix 2 – Drillhole Coordinates of Zgounder Drill Hole with Significant Results
VANCOUVER, British Columbia, Feb. 18, 2026 (GLOBE NEWSWIRE) — Apollo Silver Corp. (“Apollo Silver” or the “Company”) (TSX.V:APGO; OTCQB:APGOF; Frankfurt:6ZF) is pleased to announce that it has been recognized as a 2026 Top 50 Company by the TSX Venture Exchange (“TSXV”).
The TSX Venture 50™ is an annual ranking of the top performing companies from the past year on TSXV based on three equally weighted criteria: market capitalization growth, share price appreciation and trading value. The TSX Venture 50™ showcases the top 50 of the over 1,600 TSXV issuers.
“We are honoured to be recognized as a member of the 2026 TSX Venture 50™,” said Ross McElroy, President and CEO of Apollo Silver. “This recognition reflects the strong performance of our shares over the past year, including 383% share price appreciation, a 484% growth in market capitalization and a 460% increase in total trading value in Canada. We thank our shareholders for their ongoing support.”
Over the past year, Apollo Silver has advanced exploration and technical programs at its flagship Calico Project in California and continued community engagement efforts and social-licence initiatives at its Cinco de Mayo Project in Mexico. With silver increasingly recognized as a critical mineral and growing industrial demand supporting a constructive market environment, Apollo Silver remains focused on disciplined execution and long-term value creation for shareholders.
ABOUT APOLLO SILVER CORP.
Apollo Silver is advancing the second largest undeveloped primary silver project in the US. The Calico Project hosts a large, bulk minable silver deposit with significant barite and zinc credits – recognized as critical minerals essential to the U.S. energy, industrial and medical sectors. The Company also holds an option on the Cinco de Mayo Project in Chihuahua, Mexico, which is host to a major carbonate replacement (CRD) deposit that is both high-grade and large tonnage. Led by an experienced and award-winning management team, Apollo is well positioned to advance the assets and deliver value through exploration and development.
Neither the TSX Venture Exchange nor its Regulation Services Provider (as that term is defined in the policies of the TSX Venture Exchange) accepts responsibility for the adequacy or accuracy of this release.
Cautionary Statement Regarding “Forward-Looking” Information
This news release includes “forward-looking statements” and “forward-looking information” within the meaning of Canadian securities legislation. All statements included in this news release, other than statements of historical fact, are forward-looking statements including, without limitation, statements with respect to the continued advancement and development potential of the Company’s projects, including the Calico Project and the Cinco de Mayo Project and the Company’s future plans, objectives and expectations. Forward-looking statements include predictions, projections and forecasts and are often, but not always, identified by the use of words such as “anticipate”, “believe”, “plan”, “estimate”, “expect”, “potential”, “target”, “budget” and “intend” and statements that an event or result “may”, “will”, “should”, “could” or “might” occur or be achieved and other similar expressions and includes the negatives thereof.
Forward-looking statements are based on the reasonable assumptions, estimates, analysis, and opinions of the management of the Company made in light of its experience and its perception of trends, current conditions and expected developments, as well as other factors that management of the Company believes to be relevant and reasonable in the circumstances at the date that such statements are made. Forward-looking information is based on reasonable assumptions that have been made by the Company as at the date of such information and is subject to known and unknown risks, uncertainties and other factors that may have caused actual results, level of activity, performance or achievements of the Company to be materially different from those expressed or implied by such forward-looking information, including but not limited to: risks associated with mineral exploration and development; metal and mineral prices; availability of capital; accuracy of the Company’s projections and estimates; realization of mineral resource estimates, interest and exchange rates; competition; stock price fluctuations; availability of drilling equipment and access; actual results of current exploration activities; government regulation; political or economic developments; environmental risks; insurance risks; capital expenditures; operating or technical difficulties in connection with development activities; personnel relations; and changes in project parameters as plans continue to be refined. Forward-looking statements are based on assumptions management believes to be reasonable, including but not limited to the price of silver, gold and barite; the demand for silver, gold and barite; the ability to carry on exploration and development activities; the timely receipt of any required approvals; the ability to obtain qualified personnel, equipment and services in a timely and cost-efficient manner; the ability to operate in a safe, efficient and effective matter; and the regulatory framework regarding environmental matters, and such other assumptions and factors as set out herein. Although the Company has attempted to identify important factors that could cause actual results to differ materially from those contained in forward-looking information, there may be other factors that cause results not to be as anticipated, estimated or intended. There can be no assurance that forward-looking statements will prove to be accurate and actual results, and future events could differ materially from those anticipated in such statements. Accordingly, readers should not place undue reliance on forward looking information contained herein, except in accordance with applicable securities laws. The forward-looking information contained herein is presented for the purpose of assisting investors in understanding the Company’s expected financial and operational performance and the Company’s plans and objectives and may not be appropriate for other purposes. The Company does not undertake to update any forward-looking information, except in accordance with applicable securities laws.
February 17, 2026 – Denver, Colorado: Elemental Royalty Corporation (“Elemental” or “the Company”) (TSX-V: ELE, NASDAQ: ELE) is pleased to announce that its Board of Directors has approved an inaugural dividend policy (the “Dividend Policy”). In accordance with the Policy, Elemental expects to declare an annual cash dividend to its shareholders of US$0.12 per Elemental common share, to be paid in quarterly instalments of US$0.03 per share, with the record date for the inaugural dividend to be paid at the end of the first calendar quarter of 2026, and at the end of each calendar quarter following for subsequent dividends.
The Company is also pleased to announce that it anticipates that qualifying registered shareholders will be able to elect to receive their dividend in the form of Tether Gold XAU₮ tokens, of par value to the dividend price, thereby providing Elemental shareholders with direct ownership of physical gold through their investment in gold royalties.
Highlights
Maiden Dividend Policy approved by the Board of Directors
Expected annual cash dividend of US$0.12 per Elemental share, paid quarterly
Anticipated that qualifying registered shareholders will be able to elect that their cash dividends be invested in Tether Gold’s XAU₮ token
The Dividend to shareholders is supported by Elemental’s strong projected revenue and cash flow growth profile in 2026 and beyond
Further information on how shareholders may elect to receive the dividend or dividend in kind, will be provided in due course
David M. Cole, Chief Executive Officer of Elemental Royalty, commented: “The approval of this dividend policy marks an important milestone in Elemental’s strategic trajectory and reflects our confidence in the strength and momentum of the business; we believe this is the right time to introduce a sustainable, long-term, dividend. The decision to offer investors a dividend in kind, in the form of Tether Gold, further differentiates Elemental as a forward-thinking, growth-oriented investment.”
Stefan Wenger, Chief Financial Officer of Elemental Royalty Corporation, commented: “Our inaugural dividend is underpinned by Elemental’s strong balance sheet and future revenue outlook in the near and longer-term: as of December 31, 2025, we had approximately US$53 million of cash and no debt, providing substantial financial flexibility as we continue to invest in growth. We will continue to maintain a disciplined approach to capital allocation, balancing returning capital to shareholders through a progressive dividend which we intend to maintain, or even increase, without compromising on our strategy of accretive growth through the acquisition and generation of precious metals streams and royalties.”
Juan Sartori, Executive Chairman of Elemental Royalty Corporation, commented: “We believe the initiation of this dividend policy is a world first for a royalty company: we anticipate enabling qualifying shareholders to elect to have their cash dividend invested in the purchase of the Tether XAU₮ token, thereby facilitating for shareholders greater exposure to physical gold through Tether Gold’s stablecoin and retaining real long-term value storage via a practical mechanism for gold-denominated investment returns.”
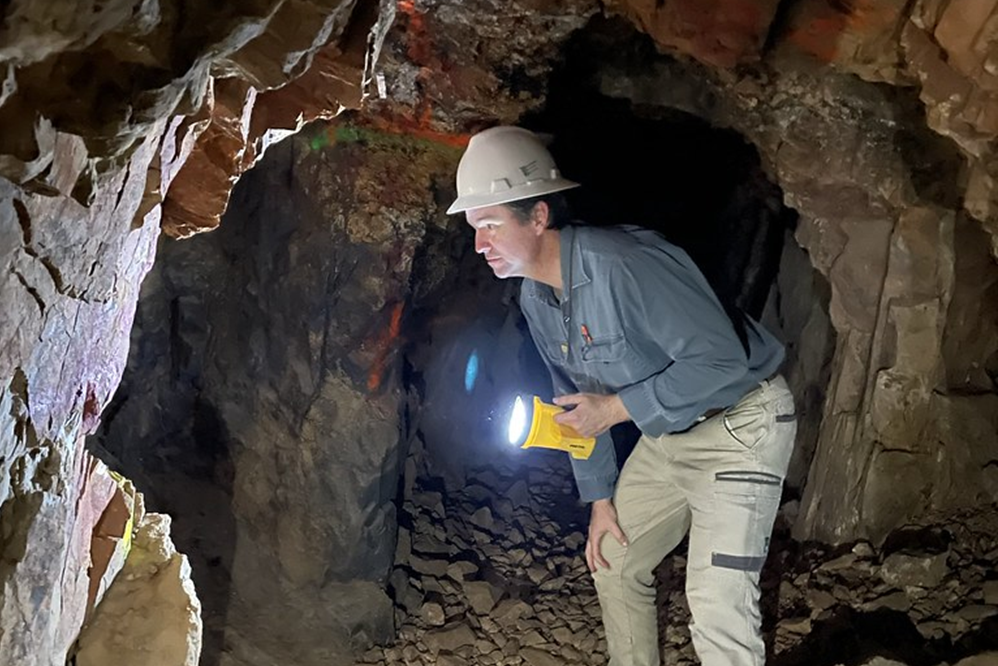
For almost three decades, Justin Tolman has crafted a career defined by a pioneering spirit and a talent for problem solving. His work has been shaped by a willingness to push into the unknown and be comfortable doing uncomfortable things in pursuit of potential opportunity. The search for buried metals has long driven humanity to explore, settle and ultimately tame some of Earth’s inhospitable places. Tolman’s professional journey reflects that same instinct: a belief that rewards are often found beyond the well-worn path.
Tolman is a third-generation miner who grew up in mining towns. He knew he would be a geologist by his teen years when he realized you could combine a love of the outdoors with the challenge of making discoveries in emerging frontiers. But the path to turning rocks into money is not a straight one.
“Economic geology is a lifelong pursuit focused on the art of turning rocks into value.” —Tolman
Tolman started working in the mining industry after high school, working elbow-deep in grease at a coal mine in Australia before and between pursuing studies at James Cook University. Since then, he has taken on roles at multiple mines and projects, gaining exposure to underground and open-cut operations, greenfield and brownfield exploration,1 learning and applying geochemistry, geophysics and geostatistics. A recurring theme was always trying to look at an enterprise from as many angles as possible. From engineers to metalworkers, Tolman sought collaboration with every team member, building a foundation of practical knowledge and a deep understanding of the mining sector.
Tolman examining artisanal workings underground at the site of a high-grade silver and gold development project in Jalisco, Mexico.
This early foundation laid the groundwork for Tolman’s later career, which increasingly involved corporate development and the valuation of mining properties, blending traditional financial analysis and leveraging his MBA from La Trobe in Australia. Over the years, the push for new challenges led Tolman to relocate himself and his family multiple times across three continents. He has held leadership positions at both multinational mining companies and small entrepreneurial explorers, giving him a broad perspective on the mining industry.
Throughout his education and career, Tolman learned that economic geology is far more than an academic pursuit. It is the art and science of turning (often incomplete) geological data into measurable economic outcomes. At its core, economic geology is about evaluating an ore deposit and determining whether it can generate tangible value. For Tolman, the insight that ultimately drives investment decisions is an analytical framework, derived from rigorous geologic study and bolstered by high-quality fieldwork. That distinction—between understanding geology and applying it to capital allocation—is what separates theory from actionable advantage.
Economic geologists live in two worlds simultaneously as they apply a business or finance lens to a sector that often operates on the edges of civilization. A spirit of exploration is what built the mining industry, and it continues to drive it today. Economic geologists are responsible for identifying resources, conducting economic evaluations and assessing risks. With global demand for materials set to double by 2040,2 the role of economic geologists is likely to grow in importance. This journey from discovery to production begins with assessing not only what lies in the ground but also whether it can be developed responsibly and profitably.
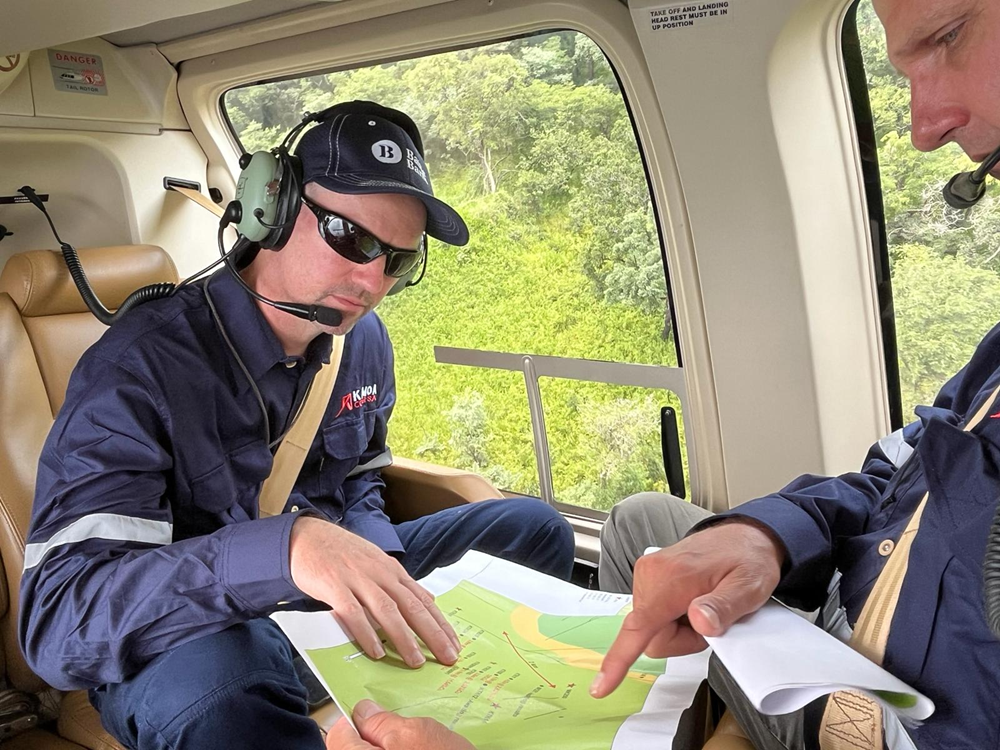
Tolman exploring early-stage, emerging copper discoveries in the Democratic Republic of the Congo.
First on the Scene: Identifying Mining Resources
Most exploration and new mineral discoveries are pioneering activities conducted in remote places worldwide. If a discovery is of sufficient importance, a mine will be developed, with infrastructure around it, providing jobs and resources for a growing community. This is where balance comes into play. Responsible mining companies strive to both unlock natural resources and support areas that are experiencing new growth and development.
“Mineral discoveries contribute more than raw resources. The investment in infrastructure like roads, power, ports and services follows; later, ancillary services can spring up, and over time, new communities take shape, pushing civilization forwards.” — Tolman
Emerging regions present both opportunities and challenges, but when development is approached responsibly, Tolman believes the benefits far outweigh the risks. There are examples of success, particularly this century, of meaningful engagement with First Nations and local stakeholders in resource-rich countries like Canada, Australia and Chile, with well-developed mining industries, setting a high standard. These collaborative models are now being adopted globally, demonstrating how inclusive practices can drive sustainable progress.
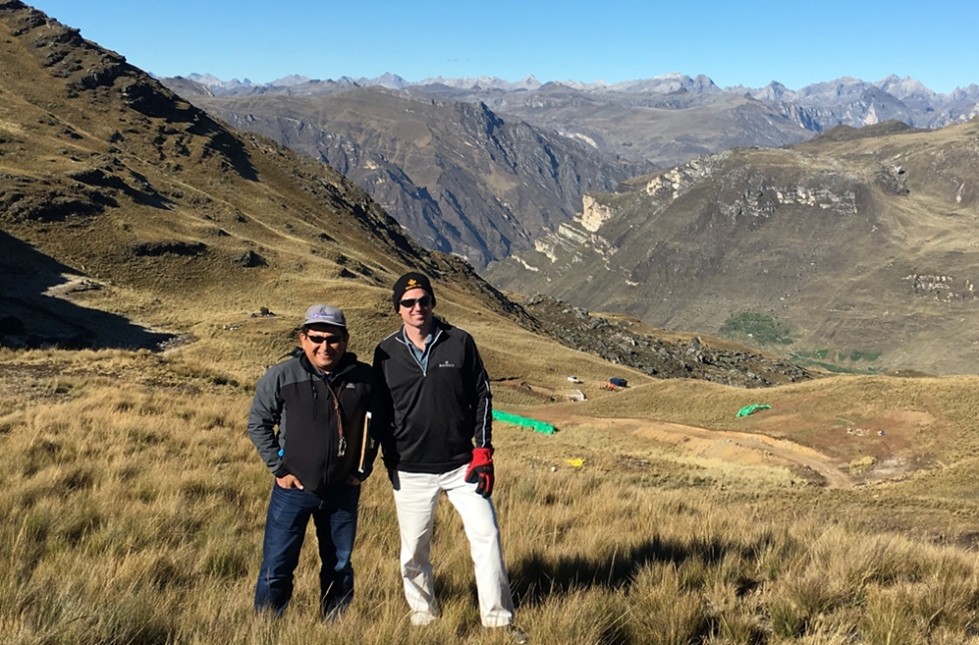
Tolman reviewing a zinc-silver-tin discovery being delineated in the Andes in Central Peru with local geologists.
Geologists often serve as the mining industry’s front line, first venturing into new regions to identify and conceptualize potential targets. Their role extends beyond technical expertise and they often serve as ambassadors for what follows: engaging with local communities, tribal leaders and stakeholders to build trust and clarify intentions. Success depends on cultural sensitivity and effective communication; without it, projects can falter before they begin.
“If you minimize your environmental impact, treat stakeholders with respect and operate with quality governance, that’s simply a formula for good business. It is not something we needed a new acronym for.” —Tolman
While mining can bring transformative benefits, such as living wages and career opportunities in areas where employment is scarce, it is important to acknowledge that resources are finite. The goal is to ensure that, by the time extraction ends, sustainable businesses and transferable skills have been established, creating lasting opportunities beyond the mine’s life. Increasingly, the mining industry is focused on fostering these outcomes through local enterprise development and skill-building initiatives.
Turning Raw Geology into Real-World Value
The work at the mine site and in the community is just the beginning. Once a mining resource has been identified, the project’s viability must be continually assessed through modeling and planning. Mine development and production are not quick processes. On average, it takes 15 to 20 years from discovery to production.3
Once data from drilling, mapping and sampling are collected, 3-D models of the mine are created, and resources are classified. This leads to the planning of the mine and the infrastructure surrounding it. Capital expenditures (CAPEX) and operating expenditures (OPEX) are determined, followed by revenue projection, financial modeling and analysis.
Tolman and crew examining core samples from the Platreef platinum-palladium-nickel mine in South Africa just ahead of first production after years of delineation and development.
Pressure Testing Scenarios
Mining projects rarely unfold as planned. Geology varies, geopolitical conditions shift, permitting timelines slip, costs escalate and commodity prices swing. Because of this, economic geologists pressure-test multiple scenarios before committing capital. Their evaluations funnel into “stage-gates” that determine whether a mining project is viable and investable. Even with this research, fewer than 1% of exploration projects reach production.4
Is there a deposit?
At the ground level, an economic geologist needs to confirm whether mineralization exists in meaningful quantity, quality and continuity. This includes extensive analysis, assessments and evaluation of any uncertainties.
Can it be mined?
If the deposit exists, the ability for it to be mined needs to be appraised. Economic geologists and a variety of other professionals work collaboratively to determine which type of mine could be developed (open pit, underground or hybrid), mitigate geotechnical and metallurgical risks, and identify infrastructure requirements.
Can it make money?
For this step, economic geologists work with engineers and analysts to determine the project’s feasibility, including its sensitivity to commodity prices, estimated position on the cost curve, expected margins and potential complexities.
Can it be permitted and sustained?
Even if the project is deemed viable and profitable, it can still face many hurdles. Permitting timelines, environmental constraints, community engagement risks and jurisdictional stability can all affect a mine’s long-term sustainability.
Where Geology Meets Capital and Meaningful Differentiation
While identifying promising deposits is critical, fieldwork alone is not enough when investing in mining equities. Geological insights must be translated into actionable investment intelligence. Tolman is convinced that blending economic geology with mining equity investing provides clear and meaningful differentiation. By grounding investment decisions in first principles geological analysis,5 independent views can be formed regarding a project’s potential rather than relying on company narratives or sell-side interpretations.
This discipline may allow promising discoveries to be identified earlier than peers, often well before they are appreciated by the broader market, creating potential opportunities for more attractive entry points. Equally important, geological expertise helps surface fatal flaws and material risks that may be overlooked by the average market participant, likely enabling downside exposure to be managed. Additionally, economic geologists’ bird’s-eye view of the industry allows them to interpret growing trends that can drive long-term market positioning.
While most financial professionals feel at home in the boardroom, Justin Tolman is equally comfortable with his boots on the ground. His work in the field spans continents, commodities and a variety of economic conditions. Tolman has been deeply involved in every layer of resource exploration, from identifying mineralization to assessing resources and determining whether they can be economically extracted. So, when it comes to investing, he and the investment team at Sprott bridge macro and micro: connecting top-down commodity fundamentals to bottom-up asset-level realities through a perspective shaped by years of hands-on geological and commercial experience.
At Sprott, Tolman applies his expertise as an economic geologist to translate field data into investment insight. He integrates analysis of macroeconomic forces shaping commodity markets with evaluation of individual mining companies to inform portfolio construction and capital allocation. His work focuses on identifying and supporting new mine development opportunities, with the aim of generating value for clients while contributing to the growth of local economies and communities.
“I have spent my career moving across the world, working in mines, doing exploration, valuing projects and helping make discoveries in multiple continents. I’ve stopped counting, but I have lived, worked and undertaken project reviews in more than 40 countries. This ‘renaissance geologist’ experience has given me deep insight into what it takes to succeed in this industry. This is a valuable tool when evaluating potential mining and metals investments, helping to efficiently and effectively evaluate new companies, teams and projects.” —Tolman
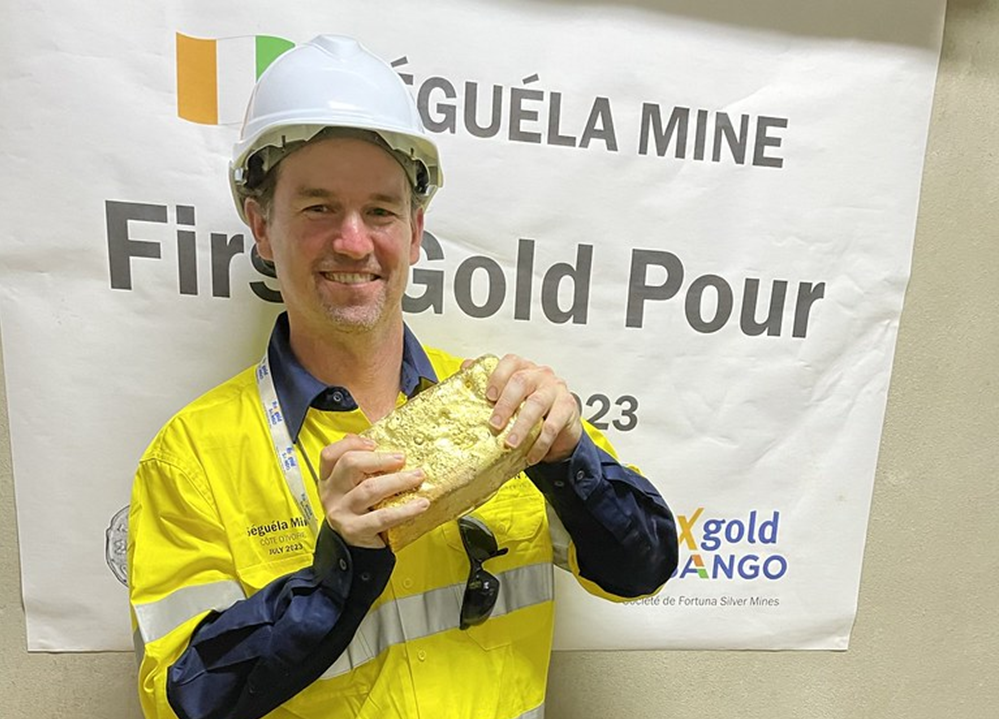
Tolman in the Cote d’Ivoire holding a freshly poured gold bar from a new gold mine.
About Justin Tolman, BSc (Hons), MBA
Managing Partner, Sprott Inc. & Senior Portfolio Manager and Economic Geologist, Sprott Asset Management USA, Inc.
Justin Tolman joined Sprott in 2018 as an economic geologist. He specializes in project and company evaluations. Tolman is a Portfolio Manager for Sprott Gold Equity Fund, Senior Portfolio Manager, Economic Geologist, of Sprott Concentrated M&A Strategy, and Portfolio Manager of Sprott Active Gold & Silver Miners ETF (GBUG) and Sprott Active Metals & Miners ETF (METL). For the two decades prior to joining Sprott, Tolman held a series of increasingly senior roles with global mining and exploration companies, including Newmont, New Gold, Exeter Resources and MIM Holdings, managing programs and leading discovery teams across the globe. Mr. Tolman holds a BSc with 1st Class Honors in Economic Geology from James Cook University (Queensland) and an MBA from La Trobe University (Victoria). He is a fellow of the Society of Economic Geologists and the Australian Institute of Geoscientists, and a registered Professional Geologist with the Association of Professional Geoscientists of Ontario (APGO).

 China
China Indonesia
 Russia
 DRC
DRC India
India Chile
Chile Argentina
 United States
 Malaysia
 Finland
 Canada
 South Korea
 Australia
 Sweden
 Morocco
 Saudi Arabia
 Uganda
 Tanzania