


 Proven Probable
North Vancouver, British Columbia–(Newsfile Corp. – June 9, 2025) – Lion One Metals Limited (TSXV: LIO) (OTCQX: LOMLF) (“Lion One” or the “Company“) is pleased to announce the appointment of Edward (Ned) Collery to the Board of Directors.
Mr. Collery is the founder and President of Pelham Investment Partners LP, a private investment partnership based in New York. Prior to founding Pelham Investment Partners, Mr. Collery worked as a research analyst and partner in the investment management industry, including as a partner at private investment firm SC Fundamental, and an analyst at private New York-based investment firm Arbiter Partners. Mr. Collery has over a decade of investment experience in the natural resource sector and mining space and is also currently a director of the TSX-V listed nickel producer Nickel 28 Capital Corp. Mr. Collery holds a B.A. in Economics from Vanderbilt University with a minor in Financial Economics.
“We are excited to welcome Ned Collery to our Board of Directors, and we are confident his expertise will contribute to the future success of Lion One”, said Lion One Chairman and President Walter Berukoff.
About Lion One Metals Limited
Lion One Metals is an emerging Canadian gold producer headquartered in North Vancouver BC, with new operations established in late 2023 at its 100% owned Tuvatu Alkaline Gold Project in Fiji. The Tuvatu project comprises the high-grade Tuvatu Alkaline Gold Deposit, the Underground Gold Mine, the Pilot Plant, and the Assay Lab. The Company also has an extensive exploration license covering the entire Navilawa Caldera, which is host to multiple mineralized zones and highly prospective exploration targets.
On behalf of the Board of Directors,
Walter Berukoff, Chairman & President
Contact Information
Email: info@liononemetals.com
Phone: 1-855-805-1250 (toll free North America)
Website: www.liononemetals.com
Neither the TSX-V nor its Regulation Service Provider accepts responsibility or the adequacy or accuracy of this release
This press release may contain statements that may be deemed to be “forward-looking statements” within the meaning of applicable Canadian securities legislation. All statements, other than statements of historical fact, included herein are forward-looking information. Generally, forward-looking information may be identified by the use of forward-looking terminology such as “plans”, “expects” or “does not expect”, “proposed”, “is expected”, “budget”, “scheduled”, “estimates”, “forecasts”, “intends”, “anticipates” or “does not anticipate”, or “believes”, or variations of such words and phrases, or by the use of words or phrases which state that certain actions, events or results may, could, would, or might occur or be achieved. This forward-looking information reflects Lion One Metals Limited’s current beliefs and is based on information currently available to Lion One Metals Limited and on assumptions Lion One Metals Limited believes are reasonable. These assumptions include, but are not limited to, the actual results of exploration projects being equivalent to or better than estimated results in technical reports, assessment reports, and other geological reports or prior exploration results. Forward-looking information is subject to known and unknown risks, uncertainties and other factors that may cause the actual results, level of activity, performance, or achievements of Lion One Metals Limited or its subsidiaries to be materially different from those expressed or implied by such forward-looking information. Such risks and other factors may include, but are not limited to: the stage development of Lion One Metals Limited, general business, economic, competitive, political and social uncertainties; the actual results of current research and development or operational activities; competition; uncertainty as to patent applications and intellectual property rights; product liability and lack of insurance; delay or failure to receive board or regulatory approvals; changes in legislation, including environmental legislation, affecting mining, timing and availability of external financing on acceptable terms; not realizing on the potential benefits of technology; conclusions of economic evaluations; and lack of qualified, skilled labor or loss of key individuals. Although Lion One Metals Limited has attempted to identify important factors that could cause actual results to differ materially from those contained in forward-looking information, there may be other factors that cause results not to be as anticipated, estimated, or intended. Accordingly, readers should not place undue reliance on forward-looking information. Lion One Metals Limited does not undertake to update any forward-looking information, except in accordance with applicable securities laws.

To view the source version of this press release, please visit https://www.newsfilecorp.com/release/254954

Silver is getting its shine on, with the price reaching $34 an ounce on Monday – an overall 19% increase so far this year, and rivalling in on the performance of its sister metal, gold, up 29%.
Unlike gold, silver benefits not only from a surge in investments into safer assets during times of uncertainty, but also upturns in economic outlook, given the metal’s use in industrial applications.
The Silver Institute projects demand for silver will remain healthy in the coming years, owing to an anticipated rise in consumption for industrial uses such as photovoltaics, electronics and electric vehicles. In 2025, global demand is expected to reach 1.2 billion oz., over half of which from industrial fabrication (700 million oz.).
The Silver Institute is forecasting mine production to reach a seven-year high in 2025, rising by 2% to 844 million ounces, guided by anticipated output growth from both existing and new operations around the world.
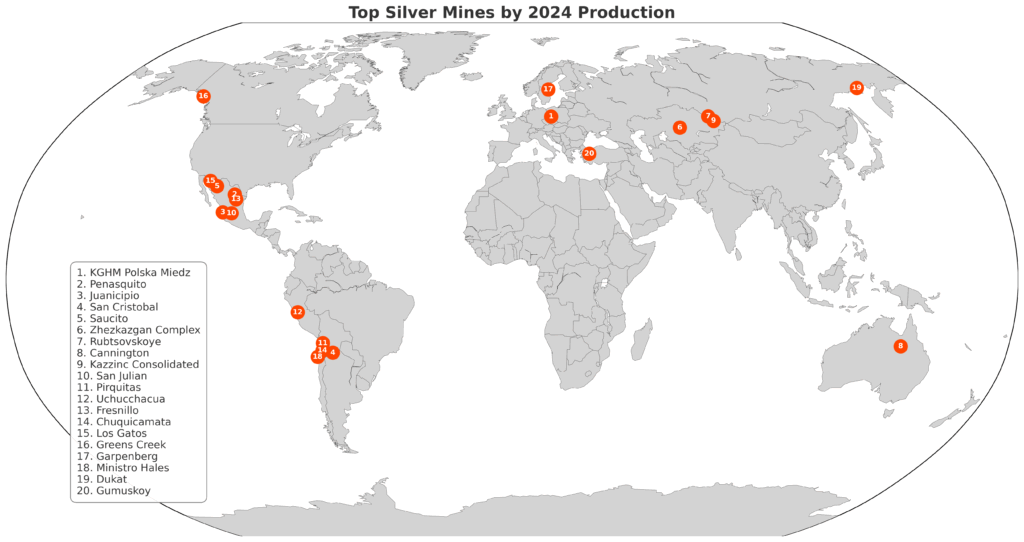
We rank the top 20 silver-producing operations of 2024, based on their actual or estimated output in millions of ounces (Moz):
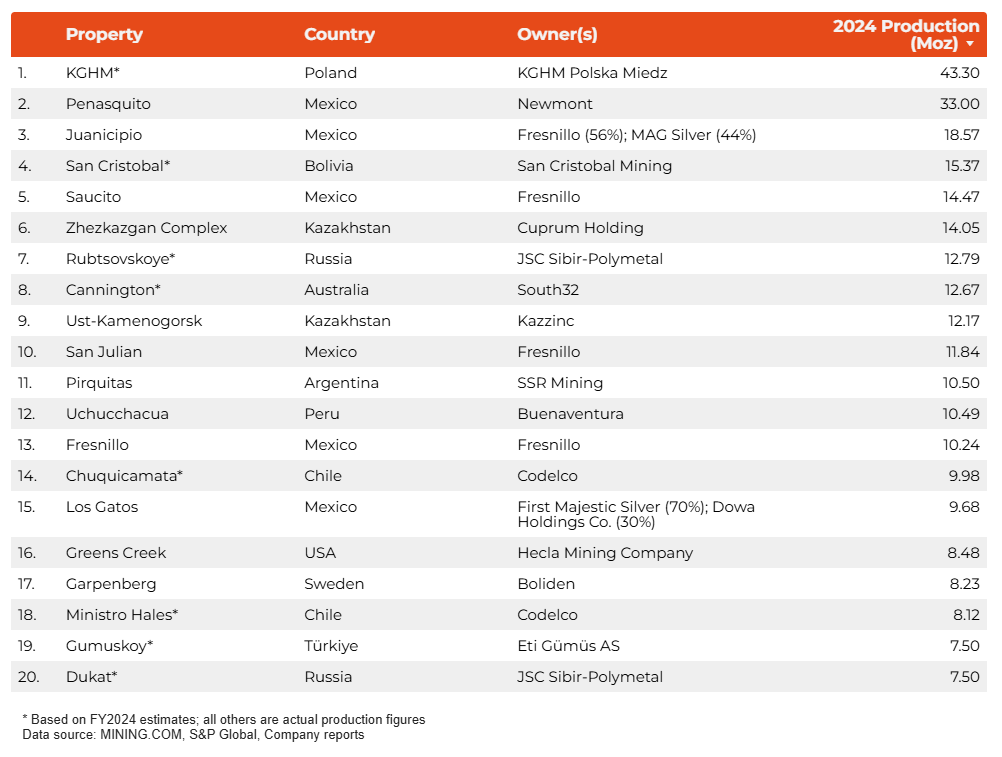
Topping our list are KGHM’s collective operations in Poland, with an estimated 43.3 Moz ounces produced from its Carlota, Lubin, Polkowice-Sieroszowice, Robinson, Rudna and Sierra Gorda mines. KGHM’s silver production is a by-product of its copper operations, which also made our top copper mines ranking.
Newmont’s Penasquito mine in Mexico is number two, with 33 Moz produced in 2024. The company struck a collective bargaining agreement with workers that year, after a series of strike actions in 2023 that saw employees at Peñasquito, Mexico’s largest gold mine, down tools for over four months.
The Juanicipio mine in Mexico, a joint venture between Fresnillo (56%) and Canada’s Mag Silver (44%) is in third place with 18.57 Moz produced in 2024. Fresnillo began developing the project in 2019, but only began operating the mine in late 2022, as pandemic and logistical setbacks delayed the project.
San Cristóbal Mining’s San Cristóbal mine in Bolivia is in fourth place with an estimated 15.36 Moz produced in 2024. Located in Bolivia’s Potosí Department, San Cristóbal is also globally significant zinc and lead producer.
Fresnillo’s Saucito mine in Mexico is number five with 14.47 Moz ounces produced in 2024. Saucito contributed 25.7% to Fresnillo’s total silver production for the year and generated 20.9% of total adjusted revenue.
Cuprum Holding’s Zhezkazgan Complex is the largest silver producing mine in Kazakhstan, churning out 14.05 Moz in 2024.
The Rubtsovskoye mine in Russia, owned by JSC Sibir-Polymetal produced an estimated 12.78 Moz in 2024. Polymetal’s Russian assets were placed under US sanctions in 2023 and the company switched its domicile to Kazakhstan and listed on the Central Asian nation’s Astana International Exchange to try to facilitate a sale. In 2024, it sold its Russian assets to a Siberian gold miner for about $3.7 billion.
South 32’s Cannington in Australia is in eighth place with 12.66 Moz produced. The mine is located in North West Queensland, on an old sheep and cattle station.
Kazzinc Consolidated’s Kazzinc mine in Kazakhstan is number nine, with 12.171 Moz produced. Kazzinc complex is located in the western region of the Shatskaya metaliogenic zone in north Kazakhstan.
Fresnillo’s San Julian mine in Mexico churned out 11.83 Moz in 2024. According to the company, the geological potential identified in the San Julian mine’s region may be sufficient to establish a new mining district in the future.
Pirquitas mine, located in Jujuy Province of Argentina and owned by SSR Mining, ranks 11th with 10.5 Moz produced. Pirquitas combined with the nearby Chinchillas mine in 2015, to comprise the Puna Operations, which includes processing facilities.
Buenaventura’s Uchucchacua mine in Peru’s Oyón province produced 10.49 Moz of silver in 2024. The mine started operations in 1975, and over the years the company has faced land use disputes with the Oyon people of the Andes.
Fresnillo’s eponymous mine in Mexico produced 10.24 Moz in 2024. Fresnillo, the world’s top silver producer, operates seven mines in the country.
Chile’s famed Chuquiquamata, the world’s biggest open-pit copper mine, owned by state-run miner Codelco, also produced an estimated 9.98 Moz of silver in 2024.
The Los Gatos mine in Chihuahua, Mexico, a joint venture between First Majestic Silver (70%) and Dowa Holdings (30%) churned out 9.68 ounces for the year. First Majestic acquired the stake in 2024, when it bought Los Gatos Silver in a $970 million deal.
Hecla Mining’s Greens Creek in southeast Alaska produced 8.48 Moz of silver in 2024. Greens Creek was the first US underground mine to deploy automated loading technology from Sandvik.
The Garpenberg mine in Sweden, wholly owned by Boliden, produced 8.23 Moz. Garpenberg is also the world’s most productive underground zinc mine.
Ministro Hales, run by Chile’s state owned miner Codelco, produced an estimated 8.12 Moz for the year. In 2023, Codelco said it planned to extend the useful life of Ministro Hales with a $2.5 billion investment.
The Gumuskoy mine in Turkiye’s Kütahya Province, owned by Eti Gumus AS, produced an estimated 7.5 Moz in 2024. In 2021, Gumuskoy was the world’s top producing silver mine, according to Global Data.
Rounding out the ranking is the Dukat mine in Russia, owned by JSC-Sibir Polymetal. Dukat’s estimated production for the year was on par with Gumuskoy – with 7.5 Moz.
SOURCE: https://www.mining.com/featured-article/ranked-worlds-20-biggest-silver-producing-mines/
Vancouver, British Columbia–(Newsfile Corp. – June 2, 2025) – EMX Royalty Corporation (NYSE American: EMX) (TSXV: EMX) (the “Company” or “EMX”) is pleased to announce the sale of its Nordic operational platform to First Nordic Metals Corporation (TSXV: FNM) (“FNM”), a current partner of EMX and operator on multiple EMX royalty properties in Sweden and Finland. This strategic divestment will include EMX’s infrastructure, exploration equipment and employees in the Nordic countries. EMX views this transaction as highly synergistic, as it will reduce EMX’s operational and administrative expenses while providing additional operational capacity for FNM to advance its Gold Line interests in Sweden and its Oijärvi gold project in Finland, where EMX holds royalty interests. EMX will also be granted future royalty interests on projects organically generated by FNM for a period of five years.
Strategic Rationale and Long-Term Benefits
This transaction is part of a broader initiative to streamline EMX’s global operations and reduce administrative costs while maintaining upside royalty exposure in partner-funded generative exploration efforts. EMX has been conducting generative exploration in the Nordic Countries for over 15 years and has generated a broad portfolio of royalties in the region, which will be retained by EMX. In addition, EMX will be granted future royalty interests on projects organically generated by FNM for a period of five years. This transaction fits EMX strategic objectives and provides an operational boost to an existing partner and operator.
Commercial Terms
As consideration for the sale, EMX will receive staged payments totaling 3.25 million SEK (approximately US$335,000) over a period of two years. The payments will be made in equal proportions of cash and the equivalent value in shares of FNM.
Additionally, FNM will grant EMX a 1% net smelter return (NSR) royalty on any newly generated projects in Sweden and Finland during the next five years.
Dr. Eric P. Jensen, CPG, a Qualified Person as defined by National Instrument 43-101 and employee of the Company, has reviewed, verified and approved the disclosure of the technical information contained in this news release.
About EMX. EMX is a precious and base metals royalty company. EMX’s investors are provided with discovery, development, and commodity price optionality, while limiting exposure to risks inherent to operating companies. The Company’s common shares are listed on the NYSE American Exchange and TSX Venture Exchange under the symbol “EMX”. Please see www.EMXroyalty.com for more information.
About FNM. First Nordic Metals Corp. is a Canadian-based gold exploration company, with precious metals assets in Sweden and Finland. The Company’s flagship asset is the Barsele gold project in northern Sweden, a joint venture project with Agnico Eagle Mines Limited. Immediately surrounding the Barsele project, First Nordic is 100%-owner of a district-scale license position comprised of two additional target areas (Paubäcken, Storjuktan, also EMX royalty properties), which combined with the Barsele project, total ~100 km of strike coverage of the Gold Line greenstone belt. Additionally, in northern Finland, First Nordic is the 100%-owner of the underexplored Oijärvi greenstone belt, including the Kylmäkangas deposit, the largest known gold occurrence on this belt. EMX also controls various royalty interests over FNM projects in the Oijärvi belt.
For further information contact:
| David M. Cole President and CEO Phone: (303) 973-8585 Dave@EMXroyalty.com | Stefan Wenger Chief Financial Officer Phone: (303) 973-8585 SWenger@EMXroyalty.com | Isabel Belger Investor Relations Phone: +49 178 4909039 IBelger@EMXroyalty.com |
Neither the TSX Venture Exchange nor its Regulation Services Provider (as that term is defined in policies of the TSX Venture Exchange) accepts responsibility for the adequacy or accuracy of this release
Forward-Looking Statements
This news release may contain “forward looking statements” that reflect the Company’s current expectations and projections about its future results. These forward-looking statements may include statements regarding perceived merit of properties, exploration results and budgets, mineral reserves and resource estimates, work programs, capital expenditures, timelines, strategic plans, market prices for precious and base metal, or other statements that are not statements of fact. When used in this news release, words such as “estimate,” “intend,” “expect,” “anticipate,” “will”, “believe”, “potential” and similar expressions are intended to identify forward-looking statements, which, by their very nature, are not guarantees of the Company’s future operational or financial performance, and are subject to risks and uncertainties and other factors that could cause the Company’s actual results, performance, prospects or opportunities to differ materially from those expressed in, or implied by, these forward-looking statements. These risks, uncertainties and factors may include, but are not limited to unavailability of financing, failure to identify commercially viable mineral reserves, fluctuations in the market valuation for commodities, difficulties in obtaining required approvals for the development of a mineral project, increased regulatory compliance costs, expectations of project funding by joint venture partners and other factors.
Readers are cautioned not to place undue reliance on these forward-looking statements, which speak only as of the date of this news release or as of the date otherwise specifically indicated herein. Due to risks and uncertainties, including the risks and uncertainties identified in this news release, and other risk factors and forward-looking statements listed in the Company’s MD&A for the quarter ended March 31, 2025 (the “MD&A”), and the most recently filed Annual Information Form (“AIF”) for the year ended December 31, 2024, actual events may differ materially from current expectations. More information about the Company, including the MD&A, the AIF and financial statements of the Company, is available on SEDAR at www.sedarplus.ca and on the SEC’s EDGAR website at www.sec.gov.

To view the source version of this press release, please visit https://www.newsfilecorp.com/release/254041
Vancouver, British Columbia–(Newsfile Corp. – June 2, 2025) – EMX Royalty Corporation (NYSE American: EMX) (TSXV: EMX) (the “Company” or “EMX“) is pleased to report that all proposed resolutions were approved at the Company’s Annual General Meeting of shareholders held on June 2, 2025, in Vancouver, British Columbia (the “Meeting”). The number of directors was set at 6 and all director nominees, as listed in the Management Information Circular dated April 15, 2025 (the “Information Circular”), were elected as directors of the Company at the Meeting to serve for a one-year term and hold office until the next annual meeting of shareholders. According to the proxy votes received from shareholders, the results were as follows:
| Director | Votes FOR | Votes WITHHELD |
| Dawson C. Brisco | 99.41% | 0.59% |
| David M. Cole | 99.55% | 0.45% |
| Sunny S.C. Lowe | 96.88% | 3.12% |
| Henrik K.B. Lundin | 99.34% | 0.66% |
| Geoff G. Smith | 99.52% | 0.48% |
| Michael D. Winn | 99.51% | 0.49% |
Shareholders voted 99.14% in favour of setting the number of directors at six, 99.10% in favour of appointing Davidson & Company LLP, Chartered Accountants as auditors, and 96.76% in favour of ratifying and approving the Company’s Stock Option Plan.
Voting results for all resolutions noted above are reported in the Report on Voting Results as filed under the Company’s SEDAR+ profile on June 2, 2025.
About EMX. EMX is a precious and base metals royalty company. EMX’s investors are provided with discovery, development, and commodity price optionality, while limiting exposure to risks inherent to operating companies. The Company’s common shares are listed on the NYSE American Exchange and TSX Venture Exchange under the symbol “EMX”. Please see www.EMXroyalty.com for more information.
For further information contact:
| David M. Cole President and CEO Phone: (303) 973-8585 Dave@EMXroyalty.com | Stefan Wenger Chief Financial Officer Phone: (303) 973-8585 SWenger@EMXroyalty.com | Isabel Belger Investor Relations Phone: +49 178 4909039 IBelger@EMXroyalty.com |
Neither the TSX Venture Exchange nor its Regulation Services Provider (as that term is defined in policies of the TSX Venture Exchange) accepts responsibility for the adequacy or accuracy of this release
Today, we take a deep dive into Platinum, exploring its market fundamentals, the potential for a new bull market, and whether now is the time to buy! We’re thrilled to be joined by the legendary Bob Moriarty, founder of 321Gold.com and 321Energy.com, who shares his unique contrarian insights.
Bob, welcome back to the show! With current market fundamentals hinting at a strong potential for a new bull cycle in Platinum Group Metals, specifically Platinum, it’s great to have you.
In this must-watch interview, we cover:
Bob Moriarty’s Fascinating History with Precious Metals: Discover what ignited Bob’s interest in gold and silver back in 1969, and his observations on the Vietnam War’s impact on US currency.

The Power of the “Contrarian” Mindset: Learn how Bob’s contrarian philosophy has shaped his investment approach, especially in resource markets. We’ll discuss his experiences with extreme crowd behavior in gold and silver (1979-80 vs. 1999-2001) and why understanding it is crucial for investors. Plus, hear the cautionary tale of the 100-ounce silver bars bought high/sold low!
Bob shares insights into the recent shift in investor interest in Platinum ETFs, from liquidation to accumulation, and its significance for future prices.
Platinum’s Market Position: Given his contrarian philosophy, Bob offers his take on where platinum stands in its market cycle – is it oversold, undervalued, or fairly priced?
Current Market Dynamics & Future Outlook:
Macro-Financial Conditions: How do issues with bond markets (Japanese and US) and the “Carry-Trade” intersect with Bob’s bullish view on platinum?
Investment Vehicles Beyond Physical: For those looking for exposure to platinum, Bob shares his most compelling resource stocks or investment vehicles in the current environment.
Educating New Investors: Why is education crucial for young investors entering the PGM space, and what advice does Bob offer?
Audience Q&A: Bob answers a critical question from Phil Acton of East Bay Motorsports regarding refined platinum holdings, mining locations, annual output vs. consumption, safe jurisdictions, expected mine life, and where future commercially feasible deposits might be found.
Special Offer! This weekend only, get 1 oz Platinum Maples for $109 over spot and 1 oz Platinum Valcambi’s for $79 over spot! Inventory is low, so act fast! Call us at 855.505.1900 to secure yours.
Key Takeaway: Bob shares his single most important message for investors considering platinum right now.
Find more of Bob Moriarty’s insights at:
321Gold.com
321Energy.com

The price of platinum is currently increasing due to a combination of factors, primarily a significant supply deficit and rebounding demand in key sectors.
Here’s a breakdown of the main causes:
1. Supply Deficit:
2. Rebounding Demand:
In summary, the core reason for the price increase is that demand is outstripping supply, creating a market deficit. This deficit is expected to continue for the foreseeable future, which is attracting more investor attention to the “forgotten precious metal.”
Vancouver, British Columbia–(Newsfile Corp. – May 22, 2025) – Riverside Resources Inc. (TSXV: RRI) (OTCQB: RVSDF) (FSE: 5YY) (“Riverside“) and Blue Jay Gold Corp. (“Blue Jay“) are pleased to announce that they have completed the plan of arrangement (the “Arrangement“) which was previously discussed in Riverside’s press release dated January 28, 2025, with the arrangement to spin out the shares of Blue Jay to the shareholders of Riverside, effective Thursday, May 22, 2025.
Pursuant to the Arrangement, holders of common shares of Riverside on the date hereof have received one new common share of Riverside (each, a “Riverside Share“) and 1/5th of one common share of Blue Jay (each, a “Blue Jay Share“) for each common share of Riverside held. The new Riverside Shares will commence trading on the TSX Venture Exchange (the “TSXV“) at the market opening on Monday, May 26, 2025. The CUSIP numbers for the new Riverside Shares and the Blue Jay Shares are 76927E109 and 095925103, respectively.
“The completion of the Blue Jay spinout marks a significant milestone in Riverside’s ongoing strategy to unlock value through disciplined corporate development and capital deployment,” said John-Mark Staude, President & CEO of Riverside. “We believe that Blue Jay, with its strong portfolio of Canadian gold assets, dedicated management team, and clean capital structure, is well-positioned for exploration and growth. This spinout not only provides Riverside shareholders with direct exposure to a focused new exploration company, but it also reinforces Riverside’s track record of creating value through strategic actions that serve the company and shareholders. This approach was notably demonstrated with the successful spinout of Capitan Silver, which has delivered additional value to our shareholders since its launch. We are proud to have launched Blue Jay and look forward to its success as a stand-alone public company.”
Immediately prior to the Arrangement, on May 22, 2025, Riverside and Blue Jay entered into an amendment (the “Amendment“) to the arrangement agreement dated January 27, 2025 (the “Arrangement Agreement“). Pursuant to the Amendment, Riverside and Blue Jay may waive certain conditions set forth in the Arrangement Agreement. All other terms and conditions of the Arrangement Agreement remain unchanged.
Blue Jay is expected to make an application to list its shares on TSXV. This share reorganization follows a structure similar to Riverside’s previous transaction with Capitan Silver Corp. (“Capitan“). In that prior case, the shares saw positive appreciation, and both Riverside and Capitan advanced their respective business strategies.
Following the Arrangement, Blue Jay will be a reporting issuer in Alberta, British Columbia and Ontario and will meet and comply with all of its timely and continuous disclosure requirements, as required under applicable Canadian securities laws. Blue Jay’s public disclosure documents will be made available and filed on Blue Jay’s profile on SEDAR+ at www.sedarplus.ca.
“Blue Jay is launching with a clear and compelling mandate to build long-term shareholder value through focused gold exploration in Canada, one of the world’s most stable and well-endowed mining jurisdictions,” commented Geordie Mark, CEO of Blue Jay. “Our initial asset base includes high-quality projects with significant discovery potential and our team brings deep technical expertise, capital markets experience, and a commitment to disciplined exploration. With the strong support of Riverside and our broader shareholder base, we are hitting the ground running, well capitalized and ready to execute. I am excited about the opportunities ahead and confident in our ability to deliver results.”
About Riverside Resources Inc.
Riverside is a well-funded exploration company driven by value generation and discovery. The Company has over $4M in cash, no debt and less than 75M shares outstanding with a strong portfolio of gold-silver and copper assets and royalties in North America. Riverside has extensive experience and knowledge operating in Mexico and Canada and leverages its large database to generate a portfolio of prospective mineral properties. In addition to Riverside’s own exploration spending, the Company also strives to diversify risk by securing joint-venture and spin-out partnerships to advance multiple assets simultaneously and create more chances for discovery. Riverside has properties available for option, with information available on the Company’s website at www.rivres.com.
About Blue Jay Gold Corp
Blue Jay Gold Corp. is a Canadian gold exploration company focused on high-grade discovery in Ontario’s prolific Beardmore-Geraldton and Wawa Greenstone Belts, regions known for hosting numerous past-producing and active gold mines. The Company’s flagship asset, the Pichette Project, features extensive banded iron formation (BIF) trends and high-grade historical gold intercepts, offering near-surface discovery potential. With three strategically located projects and a leadership team experienced in geology and capital markets, Blue Jay Gold is advancing a disciplined, modern exploration strategy in one of Canada’s most prospective and mining-friendly jurisdictions.
ON BEHALF OF RIVERSIDE RESOURCES INC.
“John-Mark Staude“
Dr. John-Mark Staude, President & CEO
ON BEHALF OF BLUE JAY GOLD CORP.
“Geordie Mark“
Geordie Mark, President & CEO
For additional information contact:
| John-Mark Staude President, CEO Riverside Resources Inc. info@rivres.com Phone: (778) 327-6671 Fax: (778) 327-6675 Web: www.rivres.com | Eric Negraeff Investor Relations Riverside Resources Inc. Phone: (778) 327-6671 TF: (877) RIV-RES1 Web: www.rivres.com |
Certain statements in this press release may be considered forward-looking information. These statements can be identified by the use of forward-looking terminology (e.g., “expect”,” estimates”, “intends”, “anticipates”, “believes”, “plans”). Forward-looking statements in this press release include, but are not limited to, statements regarding the completion of the Arrangement and regulatory approval to the listing of the Blue Jay Shares.
Such information involves known and unknown risks — including the availability of funds, that the listing of the Blue Jay Shares on the TSXV is subject to the approval of the TSXV which may not be obtained on terms acceptable to Blue Jay or at all, the ability of Blue Jay to raise sufficient capital to pursue its growth strategy and meet the listing requirements of the TSXV and, the results of financing and exploration activities, the interpretation of exploration results and other geological data, or unanticipated costs and expenses and other risks identified by Riverside and Blue Jay in its public securities filings that may cause actual events to differ materially from current expectations. Readers are cautioned not to place undue reliance on these forward-looking statements, which speak only as of the date of this press release.
Neither the TSX Venture Exchange nor its Regulation Services Provider (as that term is defined in the policies of the TSX Venture Exchange) accepts responsibility for the adequacy or accuracy of this release.

To view the source version of this press release, please visit https://www.newsfilecorp.com/release/253009
Vancouver, British Columbia–(Newsfile Corp. – May 22, 2025) – Riverside Resources Inc. (TSXV: RRI) (OTCQB: RVSDF) (FSE: 5YY) (“Riverside” or the “Company”), is pleased to provide an update regarding the option agreement with Questcorp Mining Inc. (“Questcorp“) on Union Project announced on May 6, 2025. Questcorp has issued 6,285,722 common shares, representing 9.9% of Questcorp’s issued and outstanding shares as of May 20, 2025, to Riverside. In addition, Questcorp has completed a cash payment of $25,000 CAD to Riverside. These steps have been undertaken pursuant to the terms and conditions of the option agreement dated May 5, 2025, among Questcorp, Riverside Resources Inc., and Riverside’s wholly owned Mexican subsidiary, RRM Exploración, S.A.P.I. de C.V., in respect of the Union project which Riverside has progressed the exploration and property consolidation over the past few years and now the project is set to move ahead with this partner funding.
Riverside, as operator of Union Project, is advancing the pre-drilling work including organizing the field team, access and sourcing water that would be needed for drilling later this year. The Company’s Mexico-based technical team is currently finalizing contractor selection and mobilization for an initial fieldwork program and then will conduct the pre-drilling, geophysical survey. This will be followed by more detailed work aimed at refining high-priority drill targets identified during previous fieldwork. Union Project lies within the productive Sonora carbonate-replacement belt and hosts multiple historical mine workings, strong surface mineralization, and favorable structural controls, making it highly prospective for gold-silver-lead-zinc and copper discoveries.
“We are encouraged by Questcorp’s progress on the Option of the Union Project and are pleased to be executing the next steps in our agreement,” stated John-Mark Staude, President and CEO of Riverside Resources. “Our field team in Sonora is now lining up access, camp logistics and exploration field work which lays the key groundwork to progress with the geophysical work that will be coming in the near future. The upcoming work will focus on integrating surface mapping, geochemical data, and then us geophysics to sharpen our drill targeting in this promising CRD system.”
For further details on option agreement, please refer to the press release of May 6, 2025 on www.rivres.com and on sedarplus.ca.
Qualified Person & QA/QC:
The scientific and technical data contained in this news release pertaining to the Project was reviewed and approved by Freeman Smith, P.Geo, VP Exploration, a non-independent qualified person to Riverside Resources Inc., who is responsible for ensuring that the information provided in this news release is accurate and who acts as a “qualified person” under National Instrument 43-101 Standards of Disclosure for Mineral Projects.
About Riverside Resources Inc.:
Riverside is a well-funded exploration company driven by value generation and discovery. The Company has over $4M in cash, no debt and less than 75M shares outstanding with a strong portfolio of gold-silver and copper assets and royalties in North America. Riverside has extensive experience and knowledge operating in Mexico and Canada and leverages its large database to generate a portfolio of prospective mineral properties. Riverside has properties available for option, with information available on the Company’s website at www.rivres.com.
ON BEHALF OF RIVERSIDE RESOURCES INC.
“John-Mark Staude”
Dr. John-Mark Staude, President & CEO
For additional information contact:
| John-Mark Staude President, CEO Riverside Resources Inc. info@rivres.com Phone: (778) 327-6671 Fax: (778) 327-6675 Web: www.rivres.com | Eric Negraeff Corporate Communications Riverside Resources Inc. Eric@rivres.com Phone: (778) 327-6671 TF: (877) RIV-RES1 Web: www.rivres.com |
Certain statements in this press release may be considered forward-looking information. These statements can be identified by the use of forward-looking terminology (e.g., “expect”,” estimates”, “intends”, “anticipates”, “believes”, “plans”). Such information involves known and unknown risks — including the risk that the Transaction will not be completed as contemplates, or at all, availability of funds, the results of financing and exploration activities, the interpretation of exploration results and other geological data, or unanticipated costs and expenses and other risks identified by Riverside in its public securities filings that may cause actual events to differ materially from current expectations. Readers are cautioned not to place undue reliance on these forward-looking statements, which speak only as of the date of this press release.
Neither the TSX Venture Exchange nor its Regulation Services Provider (as that term is defined in the policies of the TSX Venture Exchange) accepts responsibility for the adequacy or accuracy of this release.

To view the source version of this press release, please visit https://www.newsfilecorp.com/release/253013
We’re excited to share a transformative moment for Riverside Resources (TSXV: RRI; OTC: RVSDF). On May 22, 2025, Riverside Resources will complete the spinout of its wholly owned Ontario gold subsidiary, Blue Jay Gold Corp. Blue Jay is led by industry veteran Dr. Geordie Mark, PhD, PGeo., with extensive mining and mineral exploration experience and the strong experienced management team. As a shareholder of Riverside, you are entitled to receive 1 share of Blue Jay for every 5 shares of Riverside you own—at no additional cost. To be eligible, make sure you hold Riverside shares before market close on May 21, 2025.
Why does this matter? Because we’ve done this before and it worked well for shareholders. Our last spin-out, Capitan Silver (TSXV: CAPT; OTC: CAPTF), delivered additional value to shareholders and is currently trading more than double the original spinout share price. Blue Jay Gold aims to follow a similar path, with a portfolio of high-quality gold assets in a strong jurisdiction. As it prepares to spin out from Riverside this week, the company is well-positioned to advance its projects and pursue value creation. These are not just transactions. These spinouts are strategic, value-unlocking events that provide shareholders with direct ownership and upside exposure in focused, high-potential companies. At the same time, Riverside retains long-term royalty interests in the spinout entities, while continuing to advance its strong and diversified portfolio of gold, copper, silver, and rare earth element (REE) assets across Mexico and Canada.
Take two minutes to watch more from John-Mark Staude in this short video:
🎥 https://www.youtube.com/watch?v=SfaBLr4GCAA
For more insight into Riverside’s upcoming programs and broader value beyond the Blue Jay spin-out, additional investor videos are available to watch on Riverside’s YouTube channel.
We’re appreciative of our shareholders, proud of our 18-year track record and the strong portfolio we’ve built across North America. The Blue Jay spinout is another example of how Riverside executes its project generator model to deliver real, tangible benefits right to shareholders.
Thank you for your continued support. I continue to buy and hold, and have never sold a share of Riverside,
Dr. John-Mark Staude
President & CEO, Riverside Resources Inc.