VANCOUVER, BC / ACCESSWIRE / May 5, 2022 / Sandy MacDougall, CEO of Noram Lithium Corp. (“Noram” or the “Company“) (TSXV:NRM | OTCQB:NRVTF | Frankfurt:N7R) is pleased to announce the successful completion of CVZ-72 (PH-06) and release of the final assay results. The Company completed core hole CVZ-72 at a depth of 428 feet (130.5 m). Sampling for assay began at 60 ft (18.3 m) and continued to the bottom of the hole, an interval thickness of 368 ft (112.2 m) was intersected, which was the entire assayed portion of the hole. The hole ended in mineralization and the weighted average lithium values present were as follows:
Noram Lithium Corp., Thursday, May 5, 2022, Press release pictureNoram Lithium Corp., Thursday, May 5, 2022, Press release picture
Figure 1. Comparative stratigraphy and assay results for drill holes CVZ-72 as compared to CVZ-53 and CVZ-68, which were drilled as part of the Phases IV and V programs. CVZ-53 and CVZ-68 both had long intercepts of high grade lithium mineralization. The histogram on the sides of the holes are the composited lithium grades in ppm Li. The cross section has a 4X vertical exaggeration.
“CVZ-72 was the second hole completed in Noram’s 12-hole Phase VI drilling program. These assays represent the longest and highest-grade interval of lithium mineralization intersected to date on the Zeus property. This hole also clearly reaffirms the consistently high lithium grades across this blanket-like mineral deposit. If the program continues to produce results such as these, we could reasonably expect our PFS to outshine our PEA. Ending in mineralization at depths such as these suggests even greater potential for the size and extent of this resource” comments Brad Peek, VP of Exploration and geologist on all six phases of Noram’s Clayton Valley exploration drilling.
Noram Lithium Corp., Thursday, May 5, 2022, Press release picture
Table 1 – Sample results from CVZ-72 from 60 ft to depth of 428 ft.https://embed.fireplace.yahoo.com/embed?ctrl=Monalixa&m_id=monalixa&m_mode=document&site=sports&os=android&pageContext=%257B%2522ctopid%2522%253A%25221542500%2522%252C%2522hashtag%2522%253A%25221542500%2522%252C%2522wiki_topics%2522%253A%2522Clayton_Valley_Charter_High_School%253BNor-Am_Cup%253BLithium_carbonate%253BZeus%253BLithium%2522%252C%2522lmsid%2522%253A%2522a077000000LnOyOAAV%2522%252C%2522revsp%2522%253A%2522accesswire.ca%2522%252C%2522lpstaid%2522%253A%252240a280ff-4983-315c-895c-18deb81d6637%2522%252C%2522pageContentType%2522%253A%2522story%2522%257D
The samples were analyzed by the ALS laboratory in Reno, Nevada. QA/QC samples were included in the sample batch and returned values that were within their expected ranges.
The technical information contained in this news release has been reviewed and approved by Brad Peek., M.Sc., CPG, who is a Qualified Person with respect to Noram’s Clayton Valley Lithium Project as defined under National Instrument 43-101.
About Noram Lithium Corp.
Noram Lithium Corp. (TSXV: NRM | OTCQB: NRVTF | Frankfurt: N7R) is a well-financed Canadian based advanced Lithium development stage company with less than 90 million shares issued and a fully funded treasury. Noram is aggressively advancing its Zeus Lithium Project in Nevada from the development-stage level through the completion of a Pre-Feasibility Study in 2022.
The Company’s flagship asset is the Zeus Lithium Project (“Zeus”), located in Clayton Valley, Nevada. The Zeus Project contains a current 43-101 measured and indicated resource estimate* of 363 million tonnes grading 923 ppm lithium, and an inferred resource of 827 million tonnes grading 884 ppm lithium utilizing a 400 ppm Li cut-off. In December 2021, a robust PEA** indicated an After-Tax NPV(8) of US$1.3 Billion and IRR of 31% using US$9,500/tonne Lithium Carbonate Equivalent (LCE). Using the LCE long term forecast of US$14,000/tonne, the PEA indicates an NPV (8%) of approximately US$2.6 Billion and an IRR of 52% at US$14,250/tonne LCE.
Neither the TSX Venture Exchange nor its Regulation Services Provider (as that term is defined in the policies of the TSX Venture Exchange) accepts responsibility for the adequacy or accuracy of this release. This news release may contain forward-looking information which is not comprised of historical facts. Forward-looking information involves risks, uncertainties and other factors that could cause actual events, results, performance, prospects and opportunities to differ materially from those expressed or implied by such forward-looking information. Forward-looking information in this news release includes statements regarding, among other things, the completion transactions completed in the Agreement. Factors that could cause actual results to differ materially from such forward-looking information include, but are not limited to, regulatory approval processes. Although Noram believes that the assumptions used in preparing the forward-looking information in this news release are reasonable, including that all necessary regulatory approvals will be obtained in a timely manner, undue reliance should not be placed on such information, which only applies as of the date of this news release, and no assurance can be given that such events will occur in the disclosed time frames or at all. Noram disclaims any intention or obligation to update or revise any forward-looking information, whether as a result of new information, future events or otherwise, other than as required by applicable securities laws. *Updated Lithium Mineral Resource Estimate, Zeus Project, Clayton Valley, Esmeralda County, Nevada, USA (August 2021) **Preliminary Economic Assessment Zeus Project, ABH Engineering (December 2021).
Joining us for a conversation or legendary Rick Rule of Rule Investment Media and David Cole of EMX Royalty as will discover why mineral royalties are powerful financial instruments.
About EMX Royalty: EMX Royalty Corporation has a long-standing track record of success in exploration discovery, royalty generation, royalty acquisition, and strategic investments. Our diversified, three-pronged business approach provides exposure to multiple upside opportunities while minimizing the impact on EMX’s treasury.
EMX’s business model is designed to efficiently manage the risks inherent to the minerals exploration and mining industry. Key elements and resulting advantages of our unique approach are: We organically generate royalties through low-cost property acquisition and early-stage exploration to build value, and then develop partnerships with quality companies to advance the projects, with EMX retaining a royalty interest and receiving pre-production payments. Our organic royalty growth is supplemented by purchases of royalties from other parties, as well as strategic investments. Cash flow from royalties, advance royalties, and other property payments are supplemented by returns from strategic investments and provide “self-funding” operating capital for our ongoing business initiatives. Using this model, we sustainably grow the royalty portfolio, with minimal dilution to our shareholders. EMX’s royalty and property portfolio spanning five continents and consists of a balanced mix of precious metal, base metal, and other assets.
Joining us for a conversation are two of the most prolific names in the natural resource space, both legends in their own right, as we are joined today with Rick Rule of Rule Investment Media and David Cole of EMX Royalty.
Maurice Jackson:
I must say it’s an absolute delight to be speaking with you both today, as I hold you both in the highest regard personally and professionally, as we plan to discover why mineral royalties are powerful financial instruments. We have a lot of ground to cover today, gentlemen, so let’s get to it.
Maurice Jackson:
Mr. Rule, you have a proven track record of nearly 50 years as a wealth builder for you and your clients through resource stocks. What are you seeing right now that gives you the courage and conviction that resource stocks may present a once in a lifetime opportunity?
Rick Rule:
First of all, you’re always not wise to contradict your host, but I’ve had a couple of these opportunities in my lifetime. So I don’t think it is a once in lifetime opportunity. But I, as you point out, have been lucky enough to see the opportunity before that’s in front of me now. And it was extremely pleasant to participate in. Natural resource bull markets are wonderful financial events if you participate in them early enough.
Rick Rule:
And my own belief, is that right now we are in the latter stage of the beginning of a precious metals bull market. And we’re probably in an earlier stage in a broader natural resource bull market. And the idea to participate in two real bull markets where the outcome is a probability, not a possibility, is extraordinary.
Rick Rule:
It is seldom before in my life have the fundamental factors that are in front of me come together simultaneously that has given me the courage of my convictions with regards to the probabilities of the outcome, is what I’m talking about. And that’s what feels good to me now.
Maurice Jackson:
Given the reasons you just convey to us, investors and speculators alike are seeking prudent ways to preserve their capital, and if possible, sweeten the deal with the delivery of some nice returns. About a decade ago, you introduced me a business model that offers investors both of these virtues, and I’m referring to the concept of mineral royalties. For someone new to the conversation, would you please share what are mineral royalties and why are mineral royalty companies a strategic part of your portfolio?
Rick Rule:
What I’ve learned over time is that having an economic interest in a revenue stream where my gross is my net is a very good thing. What a royalty is, is a part of the revenue stream of a mine or an oil well or something else. But you don’t bear any establishing capital risk, any sustaining capital risk or any operating cost risk.
Rick Rule:
So to the extent, as an example, that you disagree with a management team over some of their expenses, it doesn’t matter. You just get the check. Your gross is your net. A mineral royalty too is a timeless interest pretty much. And that means that most of the surprises that you can have are pleasant surprises.
Rick Rule:
If you are lucky enough to own a royalty on a tier one mineral discovery, my experience has always been that big discoveries yield surprises and small deposits yield surprises too. But big discoveries yield pleasant surprises, and small discoveries yield unpleasant surprises.
Rick Rule:
So a mineral royalty, which is established on a, let’s say, a 1 to 1.5 million ounce gold deposit, which feels attractive over 30 years might end up producing two, two and a half million dollars. The additional exploration expense that goes into establishing the lengthening of your royalty, the operating costs, the sustaining capital costs, the taxes, all that stuff doesn’t matter. Remember on a royalty for the most part, your gross is your net, which is very pleasant.
David Cole:
With regards to mineral royalties, what also comes to mind is the concept of optionality. Mineral royalties are phenomenal financial instruments, particularly in an inflationary environment, for the very reasons that you laid out and that discovery optionality and advancement of engineering techniques, all of which are multiplicative, make royalties fantastic instruments to hold.
Maurice Jackson:
And David, if you would expand on that word optionality, that may be a new term for readers.
David Cole:
Sure. So that’s the chance that things might go super well or super bad. And the couple of guys, Black Scholes got a Nobel prize for defining a formula, how to calculate what optionality is worth and options trade in the marketplace. And with respect to royalties, what we’re talking about is the chance that things can go well.
David Cole:
And as Rick pointed out, the cost that goes into the exploration and discovery work, development work, production work et cetera, et cetera, is born by the counterparty, not by the royalty holders. So we’re exposed to all that upside optionality. And that’s one of the things that makes a portfolio of royalty so powerful.
Maurice:
Mr. Cole, you’re the CEO of the royalty generator and I’m referring to EMX Royalty. Please introduce us to the value proposition that EMX Royalty presents for investors along with your current share price.
David Cole:
Well, I’m more than happy to talk about that. And first of all, it all revolves around this concept the royalties are fantastic instruments, and different royalty companies accumulate royalties in different ways. There’s royalty financings to advance mine projects. There’s purchasing of existing royalties. And then there’s royalty generation.
David Cole:
We love to generate royalties through the prospect generation business model, acquiring prospected mineral rights around the world, adding value by doing good geology and coalescing data, selling that onto an industry, hungry for discovery opportunity. And as Rick said, I’ve never seen an industry more hungry for discovery opportunity than we have today across the periodic table.
David Cole:
And we love doing that. We love selling them on for cash shares and of course, a royalty. We also buy royalties to augment that portfolio, to create that portfolio effect and to further advance the optionality.
Maurice Jackson:
And you do that organically. That’s what I find very intriguing about your business model.
David Cole:
That is our defining factor. That’s our hedgehog, and we’ve sold by example, Maurice, 83 projects in the last four years. We have track record of just selling projects right and left. And when I’m talking about selling projects, what I mean is we stake mining claims, or we acquire mining licenses from governments, add value, and then move them onto a counterparty, junior companies, and major companies.
David Cole:
And in the junior company deals, it’s commonly cash payments and share payments. We’ve done exceedingly well with the share payments over our nearly 20-year history and always a production royalty at the end. With major companies, which we also love to do business with, we’ve done six deals with Rio Tinto, the largest mining company in the world the last four years, as one example. And there, it’s more focused on the inground expenditures, cash payments, and of course the royalty at the back end.
David Cole:
And we’re just delighted to have the capital across our portfolio being expended by our counterparties, but also their expertise employed across that portfolio, which is enhancing this concept of discovery optionality, which is where the big win comes from. Of course, there’s commodity price optionality as well, which is a hot topic in an inflationary environment.
Maurice Jackson:
Now, before we delve into specific projects, multi-pronged question. Mr. Cole, how many projects are in the EMX property bank and how many of those projects are now in the harvest mode of generating royalties?
David Cole:
So when you use the word bank, that’s probably a good word to use. So we have approximately 300 mineral property positions globally, more than a dozen countries. We’ve always taken a broad approach. We’ve cast a broad net to find value, and that’s a very strong base of pyramid.
David Cole:
And then EMX does have half dozen producing assets or assets that are just about to become producing at the top of the pyramid. And we’re at the transitionary point where we’re going from a junior company that’s been building a portfolio of mineral property positions and royalties to one that has strong cash flow. And we’re right at that tipping point this year.
Maurice Jackson:
And we’re going to highlight five of those here in just a minute. Rick, in the resource space, precious metals seemed to dominate the conversation. But I’d like to get your thought on base metals and in particular, the outlook for copper.
Rick Rule:
I think the two easiest things to think about is that the driver for copper is the ascent of humankind to the extent that there are almost eight billion people on earth and more people every day. And to the extent that humankind has a responsibility, I believe, to take the poorest half of humanity and increase their wellbeing, that automatically comes to copper.
Rick Rule:
Many readers may not know that 1.2 billion people on earth have no access to electricity. And another 2 billion people on earth have access to intermittent or unaffordable electricity. We’ve done a great job as humankind the last 30 years in increasing the material a lot of the poorest of the poor. But we have a lot more to do, and an important transition from a subsistence lifestyle to a more fulfilling lifestyle, at least part of the material translation is electricity, and electricity is copper.
Rick Rule:
At the same time that we need to continue to increase access to electricity for the poorest half of humanity, the other half of humanity wants to increase their electrical consumption too electric vehicles, power, gadgets, all those types of things. All requires copper. While this happens, in other words, while demand for copper is inexorably higher and where the rate of increase is probably increasing, we have under-invested as an industry in copper exploration production for 30 or 35 years.
Rick Rule:
The truth is most of the world’s great copper mines are a bit like me. They’re old, they’re past their prime. Bingham Canyon has been producing for 120 years. Chuquicamata has been producing for 105 years. Grasberg has producing for my whole lifetime, which is to say 69 years. You don’t stand at the top of a pit, throw in fertilizer and water and have it grow more copper. That’s not the way it works.
Source: https://wikitravel.org/en/Chuquicamata
Rick Rule:
So five years from now, what you see is that these old behemoths become longer and longer and longer of tooth. While as a consequence of three decades of under investment and exploration production, there’s nothing to take their place. And if there is something to take their place, increasingly, there are political and economic roadblocks put in front of them. There’s a wonderful copper deposit here in the United States called Resolution that the world’s been talking about for 20 years. And it’s probably 10 years away from permitting and production, not in time to make any difference in a supply outlook.
Rick Rule:
So, to the extent that one is able to make a copper discovery, the appetite among the major copper producers to buy these projects, to replace the old behemoths, which are long of tooth. And the incredible interest that governments and consumers have about increasing the material wellbeing of their citizens, which is a fancy way of saying increasing demand for copper, means that an intelligently constructed copper exploration royalty development program, I say intelligently crafted. Part of the problem in the last 30 years has been that not only haven’t we invested enough money, we’ve invested most of the money that we’ve invested stupidly.
Rick Rule:
So we’ve been both unwitting and unscrupulous in the mining business with regards to copper. But the result of that is that successful efforts in the copper business pay absolutely tremendous rewards and will continue to, I think. Most people in the west when they think about copper, they think about Tesla or something like that. And that’s fine. That’s wonderful.
Maurice, I’ll point out if you don’t mind that Dr. Richard Schodde is our consulting and advisor on the mineral economic side out of Australia, MinEx Consulting. He believes that conservatively, the planet will consume as much copper in the forthcoming 20 to 25 years as has been consumed by humanity throughout all the history cumulatively.
David Cole:
And when you think about that with respect to the under-capitalized situation in the copper industry, it’s very, very dynamic situation. It’s very difficult not to be extraordinarily bullish copper. And Rick mentioned that Bingham Canyon Mine, one of the largest open pit mines in the world is where open pit mining was first invented. The globe currently consumes the entire endowment of that deposit annually. So it’s an interesting situation for the copper business.
Maurice Jackson:
Sticking with copper, Mr. Cole, let’s visit the EMX property banking, and get acquainted with some of your royalties beginning in Chile at the Caserones Mine where EMX recently increased its position there. Tell us about the royalty and why the increase.
David Cole:
So well, first of all, as said, we’re very bullish copper, have always believed in having a diversified portfolio and copper has been a key component to that. Scott Close who heads our investor relations team, likes to call Caserones, Casherones. This is a very long live asset. Officially, it’s a 17-year-mine life, but as geologists, we’ve looked at it. We see 25-plus years of production here just from the existing deposit as it is open ended at depth, and copper cutoff grades have a long history of decreasing over time because of these various factors that we’re pointing out.
David Cole:
So this is a very long lived assets. It’s like having a 30-year bond that pays in pounds of copper. And we do see a little bit of upside with respect to production coming from that, but we’re very bullish copper prices. And we did have the opportunity to buy at a fair valuation, a 0.4% royalty on that deposit. And then the opportunity came along for us to augment that as additional family members who owned this royalty wanted to sell and liquidate.
“We have under-invested as an industry in copper exploration production for 30 or 35 years”. ~ Rick Rule
David Cole:
And so we had the chance to increase that, and we did it as that next bite was larger than we could afford by ourselves. We brought in Franco-Nevada as a partner, and we have a huge amount of respect for Franco-Nevada. They’re the leader in the mining royalty space. And if you would’ve asked me who’s the best company to be a strategic investor in EMX, I would’ve said Franco-Nevada.
David Cole:
Very happy to get them across the line and become a shareholder in EMX, part and parcel to us taking that further bite and increasing our exposure to Caserones. And that’s not our only copper exposure in the world. Of course, we have a royalty on the Timok Project, which is one of the largest ongoing copper-gold discoveries on the planet.
Maurice Jackson:
Why would Franco Nevada the biggest, most successful company in the mineral royalty sector want shares in EMX?
“I think there is going to be an increasing demand for electrification for well to do people. But the real opportunity is increasing the material living standards for the bottom half of humanity. We have an obligation to do it. We’ve done a good job of it over the last three decades, it’s going to continue. And the driver is going to be copper”. ~ Rick Rule
David Cole:
And we’re delighted to have them on board. They’ve been giving us accolades for the royalty generation work for many years. We know these folks well from our history. I used to work with some of them at Newmont Mining Corporation, and they would come up to me. David Harquail once said, “Dave, we believe that your royalty generation work is topnotch and hats off to you for doing that.”
David Cole:
And ultimately, it was that that carried him across the line and got them to invest in the company. But ironically, it was associated with a royalty purchase. But Franco Nevada recognized the power and the integration of buying royalties as well as growing them organically to build your portfolio.
Maurice:
All right, I’ve thrown you some softballs here. Here’s a tough one. EMX has recently deployed a substantial amount of capital lately acquiring cash flowing and/or soon to be cash flowing royalties and taking on debt to do so. Does this really make sense in the long-term health of the company? I mean, is this really in the best interest of the shareholders?
David Cole:
Absolutely, absolutely. So, our calculated risk adjusted internal rate of return on the monies that we’ve invested into purchasing these portfolio of royalties vastly exceeds the cost of that capital. And speaking of cost of capital, one of the important goals here is to populate the top of the pyramid, increasing our cash flow, and enabling us to move across that border from a junior company to a mid-tier company with strong cash flows, which will significantly reduce our cost of capital as we able to form a relationship with major senior banks. And we’re in those discussions now.
David Cole:
So this is all part of our strategy to prudently grow our portfolio. And particularly in an inflationary environment, paying a 7% coupon rate to borrow some money to buy things that have double digit internal rates of return is smart business.
Maurice:
Rick, as a shareholder, how significant is it when you see Franco-Nevada paying a premium to own a 3.5% stake in EMX?
Rick Rule:
I like good partners. I’ve been a Franco-Nevada shareholder on and off because of course they disappeared for a while since 1982, and I hold them in very high regard. Dave has done a good job, I think, of attracting other sophisticated shareholders in EMX.
Rick Rule:
But certainly, I’m attracted to EMX as a shareholder. What price they paid is really a matter of their own concern, the fact that they paid a premium. I think if you look at the nature of the royalty transaction, the premium was explained.
“That’s what separates us from the crowd. And that’s why we’re the only junior or mid-tier royalty company that Franco Nevada has ever bought stock in and hold stock in currently“. ~ David Cole
Rick Rule:
But the truth is that in Franco-Nevada, EMX has a partner that should they have an opportunity that is time sensitive and attractive, they have a partner that could stroke a $250 million check or a $350 million check overnight without blinking an eye. And a partner that has the sophistication and the courage to be able to do that, that’s what’s important.
Maurice:
Rick, we just highlighted copper. What is your outlook on the opportunity before us in nickel?
Rick Rule:
Well, nickel, you could also say is also an electric metal. It’s in tighter supply than copper. Most of the marginal nickel production that we’ve seen in the world in the last 30 years is lateritic nickel, which is nickel that occurs in tropical environments, often Indonesia and the Philippines. And the production of lateritic nickel is extremely environmentally degrading and also extremely energy intensive. So you need to break down nickel between lateritic nickel and primary sulfide deposits.
Rick Rule:
Primary nickel sulfide deposits are very rare and extraordinarily valuable. A primary nickel mine, even at today’s nickel, makes an awful lot of money. In the very near term, the nickel price looks inexorably higher because the world’s most important nickel producer is Russia. The political difficulties between Russia and the rest of the world, including the fact that because Russia has been kicked out of the SWIFT banking systems means that even if they sell nickel, they can’t get paid for it in any currency that they can spend.
Rick Rule:
But looking beyond that, the uses of nickel in batteries, in stainless steel, in metallurgical applications, nickel is tied very, very directly like copper to the ascent of humankind. But primary nickel deposits are even rarer than high-quality primary copper deposits.
Maurice Jackson:
David, about two weeks ago, EMX announced that it had made a strategic investment in privately held Premium Nickel Resources, which holds a trio of defunct nickel, copper and cobalt mines in Botswana of all places. Now, this seems to be a big deviation from the EMX business model. What’s going on there?
David Cole:
Well, it’s actually a key part of our business model to make strategic investments. And so it’s quite synergistic with our royalty generation work. We’ve got smart economic challenges around the world, identifying properties to acquire. And occasionally, they come across an opportunity to invest in a company where we cannot, not buy the stock.
David Cole:
And you may recall the investment that we had in Russia of all places, that we liquidated at a substantial profit. That was a strategic investment in an ongoing copper and gold development story. We did exceedingly well on and happy to have our money out of Russia back in 2018 and have not gone back, I’ll point out.
David Cole:
But that’s an example of us making strategic investments. Our track record over a nearly 20-year pathway here has been quite good. We’ve netted out over 50 million USD from our strategic investments. And we’ve had a couple bumps on the chin. We’re comfortable with taking risk and the wins have far outweighed the losses.
David Cole:
This is our next major strategic investment, absolutely delighted for the very reasons that Rick pointed out to have that nickel exposure. And we think that the premium nickel asset in Botswana is going to be in the top five nickel sulfide systems on the planet. We’re very bullish about that opportunity.
Maurice Jackson:
Multimillion dollar question here, can you provide us with an update on the situation with Zijin Mining in Serbia at the giant Timok copper-gold mine?
David Cole:
Everybody wants to know the answer to that. Of course, I can selectively disclose information, but I can say that we are in negotiations with Zijin. They’ve been quite professional and communicative to work with, and I’m confident that we’ll come to a mutual agreement.
Maurice Jackson:
All right. The Balya silver-lead-zinc mine in Turkey, it’s been ramping up for a while now. What’s the latest there?
David Cole:
So the exploration results have been phenomenal. The deposit continues to grow. They’ve decided that they will build a second mill, which we’re delighted that will substantially enhance our cash flow long-term. And they are entering into commercial production now. I expect the first royalty check to come in within the next couple of months, actually. And I do expect production to ramp up from multiple underground headings over the course of the next five years. Five years from now, it’s going to be a substantial annual royalty for us.
Maurice Jackson:
Can you give us an update on the Gediktepe gold oxide and polymetallic mine? And when will this royalty start cash flowing?
David Cole:
That one’s also just a couple months away, Maurice. And so that’s an interesting royalty in that the royalty on the upper oxide zone, which is gold and silver enriched, is 10%. That was part of the sales price when the predecessor to SSR sold that on to the current operator, Lidya, and that 10% kicks in after 10,000 ounces have been poured. And we’re right at 4,000 ounces right now. They are in production, they’re placing ore on the pad. They did have a tough winter season, so that slowed them down a little bit, but they’re only a few weeks behind.
David Cole:
And we’re seeing greater in production as they head into summer. As soon as they cross the 10,000th ounce, which will be just a few months out, probably June or July, then we’ll start to receive royalty payments on that, and that is a 10% royalty. And that’s on the upper oxide zone, which we believe will have about a five-year mine life. And then it goes into the polymetallic sulfide zone, which is dominated by zinc and copper, two commodities we love. And that’s a 2% royalty in perpetuity on that zone.
David Cole:
So that’s another key asset within the portfolio that starts to cash flow in a few months.
Maurice Jackson:
Now that 10% is just remarkable. With all the new royalty cash flow and pending royalties poised to begin paying, what will the cash flow look like for EMX for the remainder of 2022?
David Cole:
Yep. So we will be coming out with guidance in two quarters, and we’re diligently working on that. And our bankers are talking to us about that. And that’s part of our shelf filing that we’re also in the process of, and this is all part of our maturing from a junior company that’s been building a portfolio to a mid-tier company with strong cash flows. And so, as soon as we provide that guidance, Maurice, you’ll be one of the first to know.
Maurice Jackson:
Right, looking forward to it. Leaving the property bank, Rick, I know you have a very stringent, selective criteria for companies that make the grade, if you will, before you will commit your capital. Now, we just heard Mr. Cole referenced that EMX has five attractive royalties and more on the way along with an attractive share price, in my opinion.
Maurice Jackson:
That all sounds compelling, but you taught me years ago that the competitive advantage for a shareholder is found in the board of directors, management, and technical team. Why are the people equally, if not more, important to you as a shareholder than the given project, and specifically the team that comprises EMX royalty?
Rick Rule:
Bad people can screw up good rocks. If the wrong team controls the cash flow, they get it and the shareholders don’t, simple as that. The second thing of course, is that luck favors the trained observer. And you need luck in exploration. Dave has done a great job over 20 years. He’s a geologist himself, but I would say his true talent is hiring and motivating and keeping very good geologists.
Rick Rule:
So, what has always attracted me to EMX has been the technical IQ per dollar of market cap. The fact that although the team has done a decent job of buying royalties, what I think the real secret sauce is the fact that they have generated royalties by generating 300 exploration concepts that other people have bought into. It can take a decade for prospect generation to work for you. But prospect generation, in my own portfolio, has been by far the most capital efficient exploration speculation that I have done. What the EMX team did is they figured out a better payments mechanism.
Rick Rule:
For most of my life, I invested in teams that had great intellectual capital that generated projects, and they ended up getting a carried interest in the project. The problem with that is that they sometimes didn’t have the ability to carry the load as the project went into production. And well, they had a lot of exploration expertise, they maybe didn’t have construction or development expertise.
Rick Rule:
What David did is he really simplified the way they got paid. Rather than get paid in the ability to own on a subsidized basis, a minority interested in operation that they may not know how to operate, he developed a circumstance where they got paid a carried interest by way of a royalty, which is ultimately a safer and probably a more valuable instrument.
Rick Rule:
The same intellectual capital that he has hired and deploys in the exploration business can be used to both source and evaluate either merchant banking opportunities, which is to say those companies that he invests in strategically or royalties. So I think it’s important that the exploration IQ that has been assembled within EMX turns out to be a strategic advantage in moving their asset base forward.
Maurice Jackson:
Now, Rick, we’ve heard you convey the merits of owning mineral royalties, and we’ve heard the virtues that EMX royalty presents to the market. Before we close, what did I forget to ask?
Rick Rule:
Well, I think, the important question to ask any company that’s beginning to mature is how are the capital allocation decisions made. What would be as, an example, the capital cost assumptions around the debt that they took on and what sort of pro forma delta would occur between cost of capital to return on capital employed? How strategically will the decision be made internally as to whether to emphasize the merchant banking business, the royalty generation business, or the royalty acquisition business?
Rick Rule:
And then finally, I think, the royalty acquisition business is extremely competitive. I would ask Dave to describe the competitive advantage that he may feel against the 30-some odd other players in the mineral royalty space.
Maurice Jackson:
All right, Mr. Cole. So, you know what’s up for our next interview.
David Cole:
It boils down to our alpha, which is on the technical side. And we believe that astute business decisions are rooted in solid technical understanding. And we’ve always had a strong technical team here at EMX to drive those business decisions so that we can have that astute allocation of capital.
Maurice Jackson:
Last question for you, Rick, tell us about the Rule Symposium, which will be held this year at the beautiful Boca Raton Resort in Boca Raton, Florida, July 26th through the 29th.
And I thought you’d never ask, Maurice. As both of you know, or all of you, frankly, to have put on natural resource investing conferences, the majority of those, the live ones took place in Vancouver, BC. A couple years ago because of COVID, we had to discontinue that one for a while. And we’d like to bring it back to BC, but the truth is with the COVID circumstance and public health administrations and two countries doing their level best to thwart my franchise, we decided to bring the conference down to the United States because most of the attendees are, in fact, American.
Rick Rule:
We searched around the country for a resort that was of the same quality that we expected, and one that had the facilities that we needed. And we found one in Boca Raton. The Boca Resort has a long and fabled history. It’s just undergone a spectacular renovation. They put hundreds of millions of dollars in it. They’re renting rooms to our attendees for $295 a night. Their rack rate is about a thousand, truly spectacular location.
Rick Rule:
The conference itself has a long and storied history. We’ve always had great speakers. We have Jim Rickards, Danielle DiMartino Booth, Doug Casey, the normal sort of gurus. But what’s always made our conference set apart is really two things. One, we have always had what I call the living legends, which is to say, we’ve always had the speakers, people who have built multi-billion dollar businesses in natural resources from scratch. It isn’t all gurus. There’s a lot of jockeys there and they are great jockeys. We’ll have that this year.
Rick Rule:
In addition to that, every exhibitor at our conference is owned either in Sprott managed accounts or in my own account. That doesn’t mean sadly that every stock I own goes up. What it does mean is that my attendees can rest assure that every exhibitor has been vetted. We know them well enough that we in fact, own them.
Rick Rule:
The important part of a live conference is that you get to see the interaction between the exhibitors and the speakers. I remember four years ago, I guess in Vancouver, following at a discreet different distance, Robert Friedland, one of the best resource entrepreneurs in history. And I watched him walk around the exhibit hall. I watched him speak to exhibitors. I took note of which exhibitors he talked to and which exhibitors made him smile and which exhibitors made him frown. I think the opportunity to follow Robert Friedland on a resource stock shopping trip is worth the price of admission.
Rick Rule:
By the way, with regards to the price of admission, every investment product, every investment education product that Rule Investment Media has ever offered over the last 30 years has come with a complete money back guarantee. If you come to the conference, you pay the tuition, and you don’t think it was worth your money? Email me. I’ll give you your money back.
Maurice:
One important factor that maybe you forgot to highlight there is the intellectual capital that you get from other investors. And the lifelong relationships that I’ve had an opportunity to forge has just been, I can’t put a price tag on that.
Rick Rule:
Oh, that’s a very good point. There’s going to be 500 high net worth investors there. And the idea that all the IQ in the room flows from the dais to the room is stupid. Watching fellow investors, listening to the questions that they ask the exhibitors, listening to the questions and the conversations they have amongst each other, listening to the conversations in the workshop, absolutely invaluable. And as I say, if you aren’t prepared to make money on it, there’s a money back guarantee.
Maurice:
Now I know the next question everyone has is how do I register? We’ve got that taken care of for you CLICK HERE. Check the description box below. Also, just visit www.provenandprobable.com. And the link will be on the right side of our homepage just below the weekly precious metal special through Miles Franklin Precious Metals Investments. Mr. Cole, before we close, what would you like to say to shareholders?
David Cole:
Buy the depths, yeah. As Rick likes to say, you want to use the cycles to your advantage rather than be used by the cycles.
Maurice:
Mr. Cole, for someone that wants to learn more about EMX royalty, please share the website address.
VANCOUVER, BC / ACCESSWIRE / May 4, 2022 / (CSE:ROO) (OTC PNK:JNCCF) (Frankfurt:5VHA) – RooGold Inc. (“RooGold” or the “Issuer“).
RooGold is pleased to report that it has acquired an additional, 100% held Exploration Licence (EL) 9390 in the highly prospective Peel-Manning Suture Zone of the New England Orogen in New South Wales, Australia.
Highlights
EL 9390 covers an area of 229 km2 and is strategically located in between Roo Gold’s Lorne (EL 9232) and Gold Belt (EL 9226) Projects.
The three Projects cover 435 km2 over a 65 km strike length of the Peel-Manning Suture Zone which is well known to host precious and base metal mineral deposits.
The Projects are located within 70 km of each other making for efficient logistics and work planning.
Landowner access negotiations and rock chip sampling to commence as soon as practicable at prospective mineral occurrences.
Carlos Espinosa, Chief Executive Officer and a Director of RooGold comments, “Exploration Licence 9390 is a valuable addition to Roo Gold’s tenure portfolio. EL 9390 is 100% held by Roo Gold and was strategically acquired for both its position over the serpentinite package of rocks along the Peel-Manning Suture zone and its close proximity to our Lorne and Gold Belt Projects, making logisitics and work planning more efficient. We look forward to commencing land access negotiations to facilitate field work as soon as practicable”
The Glenrock Project
The Glenrock Project, EL 9390, is located 15 km southeast of the Lorne Project (EL 9232) and 30 km northwest of Gold Belt Project (EL 9226). It covers over 20 km of the serpentinite belt of the Peel-Manning Suture Zone.
EL 9390 contains diverse geology that are known elsewhere in the region to host a variety of mineralisation styles that contain Au-Cu and base metal metallic mineral deposits. Rock types include serpentinites, flysch sequences, intrusives, volcanics and volcaniclastics, structurally located within in a complex, highly faulted system. This system may host numerous metallic mineralisation styles including lode gold with associated base metals. The tenement also contains mineral occurrences of copper-rich quartz veins containing malachite, bornite and chalcopyrite in serpentinite dykes up to 150 m long and 12 m wide. The tenement is significantly under-explored, has never been drilled and represents a ground-floor opportunity for the discovery of new metallogenic province.
Exploration Licence Application (ELA) 6429 was submitted to the Deparment of Regional NSW covering an area of 229 km2 on 3rd February 2022. On 11 April 2022, Exploration Licence (EL) 9390 was granted to Great Southern Precious Metals Pty Ltd, a 100% subsidiary company of Roo Gold Inc.
Following a historic data review and land access negotiations, Roo Gold will undertake a field reconnaissance trip and rock chip sampling to identify targets for follow up.
RooGold Inc., Wednesday, May 4, 2022, Press release picture
Figure 1: Location map with key geology and mineral occurrences of newly acquired EL 9390, Glenrock Project, in geographical relation to Roo Gold’s strategic tenement holding along the Peel-Manning Suture in the New England Orogen of New South Wales, Australia.
ROOGOLD is a Canadian based junior venture mineral exploration issuer which is uniquely positioned to be a dominant player in New South Wales, Australia, through a growth strategy focused on the consolidation and exploration of high potential, mineralized precious metals properties in this prolific region of Australia. Through its announced acquisitions of Southern Precious Metals Ltd., RooGold Ltd. and Aussie Precious Metals Corp. properties, RooGold commands a portfolio of 14 high-grade potential gold (10) and silver (4) concessions covering 1,537 km2 which have 139 historic mines and prospects.
This press release may contain forward-looking statements within the meaning of applicable securities law. Forward-looking statements are frequently characterized by words such as “plan”,”expect”, “project”, “intend”,”believe”, “anticipate”, “estimate” and other similarwords, or statements that certain eventsor conditions “may” or “will” occur.
Although the Issuer believes that the expectations reflected in applicable forward-looking statements are reasonable, therecan be no assurance that such expectations will prove to be correct. Such forward-looking statements are subjectto risks and uncertainties that may cause actual results, performance or developments to differ materially from those contained in such statements.
NEITHER THE CANADIAN SECURITIES EXCHANGE NOR ITS REGULATION SERVICES PROVIDER ACCEPTS RESPONSIBILITY FOR THE ADEQUACY OR ACCURACY OF THIS RELEASE.
VANCOUVER, BC / ACCESSWIRE / May 4, 2022 / Metallic Minerals (TSX.V:MMG)(OTCQB:MMNGF) (“Metallic Minerals“, or the “Company“) is pleased to announce the creation of a dedicated Community & First Nations Relations team for the Metallic Group of Companies and the appointment of Lindsay Wilson to the role of Manager, Community and Investor Relations. Ms. Wilson will be working alongside Lauren Blackburn, the Company’s Yukon-based Regulatory & Permitting Manager, in further strengthening our relationships with First Nations, local communities and governments.
The Metallic Group is well established in the Yukon with multiple projects under development by member companies. The Group employs dedicated personnel in Whitehorse, who are long-time residents of the Yukon and, as such, have an affinity for and understanding of its people, its history and its robust mineral endowment. Ms. Blackburn has been with Metallic Minerals and the Metallic Group since its founding and has taken a leading role in the Company’s community, permitting and regulatory initiatives. The addition of Ms. Wilson greatly increases our capacity to build meaningful and long-lasting and mutually beneficial partnerships in keeping with our strong commitment to environmental, social, and governance (“ESG”) aspects of the resource sector. The Metallic Group is committed to applying best industry practices to exploration and to make positive contributions in the Territory and the specific communities in which we work.
Lauren Blackburn – Manager, Regulatory and Permitting
Ms. Blackburn has over 15 years of Yukon-based experience in the mineral exploration sector focused on the exploration and development of early to advanced-stage silver, gold, and base metal deposits. Her primary concentration has been in northern Canada where she has garnered a dynamic skill set that includes expertise in the exploration process, permitting, lands management, regulatory lobbying, land-use planning and community engagement. Ms. Blackburn is highly involved in Territorial legislation and policy review, permitting activities and assists in evaluation of potential project acquisitions and strategic development.
Lindsay Wilson – Manager, Community & Investor Relations
A member of the Snuneymuxw First Nation on Vancouver Island, Ms. Wilson is focused on incorporating traditional ways of being into her work within the resource sector and seeking to develop sustainable and credible partnerships within the communities that she works. Ms. Wilson has a comprehensive background in indigenous studies and public relations, alongside practical experience in the mineral resource sector. Having worked previously in the Yukon with the Yukon Mining Alliance, Ms. Wilson is excited about the opportunity to return to work in the Yukon and looking forward to reconnecting with the communities there.
Arctic Indigenous Investment Conference (AIIC)
The Metallic Group Community and First Nations Team will be attending the AIIC on May 4th & 5th in Whitehorse, Yukon.
Connecting globally – through a hybrid (in-person & virtual) experience – AIIC 2022 will highlight and promote indigenous development corporations and businesses in the northern economy, alongside the north’s business community and colleagues across sectors. The goals of AIIC 2022 are to support economic reconciliation and growth, and youth entrepreneurship by forging new and stronger relationships, advancing meaningful partnerships, and connecting people across the arctic. Indigenous development corporations and businesses play a key role across northern Canada. These efforts are supported when we stand together with a collaborative voice for business, northern investment and our citizens, to ensure a diverse and prosperous economy, community and future.
About Metallic Minerals
Metallic Minerals Corp. is an exploration and development stage company, focused on silver, gold and copper in the high-grade Keno Hill and La Plata mining districts of North America. Our objective is to create shareholder value through a systematic, entrepreneurial approach to making exploration discoveries, growing resources and advancing projects toward development. Metallic Minerals has consolidated the second-largest land position in the historic Keno Hill silver district of Canada’s Yukon Territory, directly adjacent to Alexco Resource Corp’s operations, with more than 300 million ounces of high-grade silver in past production and current M&I resources. In addition, the Company recently announced the inaugural resource estimate for the La Plata silver-gold-copper project in southwestern Colorado. All of the districts in which the Company works have seen significant mineral production and have existing infrastructure, including power and road access. Metallic Minerals is led by a team with a track record of discovery and exploration success on several major precious and base metal deposits, as well as having large-scale development, permitting and project financing expertise.
About the Metallic Group of Companies
The Metallic Group is a collaboration of leading precious and base metals exploration and development companies, with a portfolio of large, brownfields assets in established mining districts adjacent to some of the industry’s highest-grade producers of silver and gold, platinum and palladium, and copper. Member companies include Metallic Minerals in the Yukon’s high-grade Keno Hill silver district and La Plata silver-gold-copper district of Colorado, Granite Creek Copper in the Yukon’s Minto copper district, and Group Ten Metals in the Stillwater PGM-nickel-copper district of Montana and Kluane district in the Yukon. The founders and team members of the Metallic Group include highly successful explorationists formerly with some of the industry’s leading explorer/developers and major producers. With this expertise, the companies are undertaking a systematic approach to exploration and development using new models and technologies to facilitate discoveries in these proven, but under-explored, mining districts. Members of the Metallic Group have been recognized as recipients of awards for excellence in environmental stewardship demonstrating commitment to responsible resource development and appropriate ESG practices. The Metallic Group is headquartered in Vancouver, BC, Canada, and its member companies are listed on the Toronto Venture, US OTCQB and Frankfurt stock exchanges.
Neither the TSX Venture Exchange nor its Regulation Services Provider (as that term is defined in the policies of the TSX Venture Exchange) accepts responsibility for the adequacy or accuracy of this release.
VANCOUVER, BC / ACCESSWIRE / May 4, 2022 / Granite Creek Copper Ltd. (TSXV:GCX)(OTCQB:GCXXF) (“Granite Creek” or the “Company“) is pleased to announce the creation of a dedicated Community & First Nations Relations Team for the Metallic Group of Companies and the appointment of Lindsay Wilson to the role of Manager, Community and Investor Relations. Ms. Wilson will be working alongside Lauren Blackburn, the Company’s Yukon-based Regulatory & Permitting Manager, in further strengthening our relationships with First Nations, local communities and governments.
The Metallic Group is well established in the Yukon with multiple projects under development by member companies. The Group employs dedicated personnel in Whitehorse, who are long-time residents of the Yukon and, as such, have an affinity for and understanding of its people, its history and its robust mineral endowment. Ms. Blackburn has been with Metallic Minerals and the Metallic Group since its founding and has taken a leading role in the Company’s community, permitting and regulatory initiatives. The addition of Ms. Wilson greatly increases our capacity to build meaningful and long-lasting and mutually beneficial partnerships in keeping with our strong commitment to environmental, social, and governance (“ESG”) aspects of the resource sector. The Metallic Group is committed to applying best industry practices to exploration and to make positive contributions in the Territory and the specific communities in which we work.
Lauren Blackburn – Manager, Regulatory and Permitting
Ms. Blackburn has over 15 years of Yukon-based experience in the mineral exploration sector focused on the exploration and development of early to advanced-stage silver, gold, and base metal deposits. Her primary concentration has been in northern Canada where she has garnered a dynamic skill set that includes expertise in the exploration process, permitting, lands management, regulatory lobbying, land-use planning and community engagement. Ms. Blackburn is highly involved in Territorial legislation and policy review, permitting activities and assists in evaluation of potential project acquisitions and strategic development.
Lindsay Wilson – Manager, Community & Investor Relations
A member of the Snuneymuxw First Nation on Vancouver Island, Ms. Wilson is focused on incorporating traditional ways of being into her work within the resource sector and seeking to develop sustainable and credible partnerships within the communities that she works. Ms. Wilson has a comprehensive background in indigenous studies and public relations, alongside practical experience in the mineral resource sector. Having worked previously in the Yukon with the Yukon Mining Alliance, Ms. Wilson is excited about the opportunity to return to work in the Yukon and looking forward to reconnecting with the communities there.
Arctic Indigenous Investment Conference (AIIC)
The Metallic Group Community and First Nations Team will be attending the AIIC on May 4th & 5th in Whitehorse, Yukon.
Connecting globally – through a hybrid (in-person & virtual) experience – AIIC 2022 will highlight and promote indigenous development corporations and businesses in the northern economy, alongside the north’s business community and colleagues across sectors. The goals of AIIC 2022 are to support economic reconciliation and growth, and youth entrepreneurship by forging new and stronger relationships, advancing meaningful partnerships, and connecting people across the arctic. Indigenous development corporations and businesses play a key role across northern Canada. These efforts are supported when we stand together with a collaborative voice for business, northern investment and our citizens, to ensure a diverse and prosperous economy, community and future.
About the Metallic Group of Companies
The Metallic Group is a collaboration of leading precious and base metals exploration and development companies, with a portfolio of large, brownfields assets in established mining districts adjacent to some of the industry’s highest-grade producers of silver and gold, platinum and palladium, and copper. Member companies include Granite Creek Copper in the Yukon’s Minto copper district, Metallic Minerals in the Yukon’s high-grade Keno Hill silver district and La Plata silver-gold-copper district of Colorado, and Group Ten Metals in the Stillwater PGM-nickel-copper district of Montana and Kluane district in the Yukon. The founders and team members of the Metallic Group include highly successful explorationists formerly with some of the industry’s leading explorer/developers and major producers. With this expertise, the companies are undertaking a systematic approach to exploration and development using new models and technologies to facilitate discoveries in these proven, but under-explored, mining districts. Members of the Metallic Group have been recognized as recipients of awards for excellence in environmental stewardship demonstrating commitment to responsible resource development and appropriate ESG practices. The Metallic Group is headquartered in Vancouver, BC, Canada, and its member companies are listed on the Toronto Venture, US OTCQB, and Frankfurt stock exchanges.
About Granite Creek Copper
Granite Creek, a member of the Metallic Group of Companies, is a Canadian exploration company focused on the 176 square kilometer Carmacks project in the Minto copper district of Canada’s Yukon Territory. The project is south of the high-grade Minto copper-gold mine, operated by Minto Metals Corp., and features a high-grade copper, gold and silver resource with excellent access to road, power and port infrastructure. More information about Granite Creek Copper can be viewed on the Company’s website at www.gcxcopper.com.
Neither the TSX Venture Exchange nor its Regulation Services Provider (as that term is defined in the policies of the TSX Venture Exchange) accepts responsibility for the adequacy or accuracy of this release.
VANCOUVER, BRITISH COLUMBIA, May 3, 2022 – Millrock Resources Inc. (TSX-V: MRO, OTCQB: MLRKF) (“Millrock” or the “Company”) reports that Felix Gold (ASX: FXG, “Felix Gold” or “Felix”) has commenced drilling on the Treasure Creek gold project, which lies just north of the City of Fairbanks.
Felix indicates that it plans to drill 7,000 meters with a small reverse circulation drill rig. Millrock has assigned its Treasure Creek mineral rights to Felix Gold in return for cash, shares, and production royalties featuring advanced minimum royalty streams. Millrock owns 9,957,157 Felix Gold shares that today have a market value of approximately AUD$1,643,000 (CDN$1,495,000).
Millrock President & CEO Gregory Beischer commented: “The targets to be drilled by Felix Gold have a strong chance of successfully identifying a gold deposit. A new discovery here would propel the value of Millrock’s shareholding in Felix Gold and in return increase the value of Millrock shares. The project is certainly well-situated, about 20 kilometers north and west of Kinross’ Fort Knox gold mine, and 10 kilometers west of Freegold’s new discovery at Golden Summit. Alluvial gold deposits in gravels of Treasure Creek point to a bedrock source on the Felix Gold claims where large, strong soil geochemical anomalies are known from historical work and a major soil sampling program done in 2021. We will look forward to assay results from the current drilling program with great anticipation. Felix Gold has built an excellent exploration team and is well-capitalized. The team has a great chance of making discoveries and revealing the substantial potential for more major gold deposit discoveries in the Fairbanks gold mining camp. In my view, the potential in Fairbanks has been generally under-recognized by the industry. This has allowed Felix, through Millrock, to consolidate a tremendous land position. As a result of the agreement with Felix, Millrock is entitled to production royalties at Treasure Creek and throughout the Fairbanks district.”
Qualified Person The scientific and technical information disclosed within this document has been prepared, reviewed, and approved by Gregory A. Beischer, President, CEO, and a director of Millrock Resources. Mr. Beischer is a qualified person as defined in NI 43-101.
About Millrock Resources Inc. Millrock Resources Inc. is a premier project generator to the mining industry. Millrock identifies, packages, and operates large-scale projects for joint venture, thereby exposing its shareholders to the benefits of mineral discovery without the usual financial risk taken on by most exploration companies. The company is recognized as the premier generative explorer in Alaska, holds royalty interests in British Columbia, Canada, and Sonora State, Mexico, is a significant shareholder of junior explorer ArcWest Exploration Inc., and owns a large shareholding in each of Resolution Minerals Limited and Felix Gold Limited. Funding for drilling at Millrock’s exploration projects is primarily provided by its joint venture partners. Business partners of Millrock have included some of the leading names in the mining industry: EMX Royalty, Coeur Explorations, Centerra Gold, First Quantum, Teck, Kinross, Vale, Inmet, and Altius, as well as junior explorers Resolution, Riverside, PolarX, Felix Gold and Tocvan.
ON BEHALF OF THE BOARD “Gregory Beischer” Gregory Beischer, President & CEO
FOR FURTHER INFORMATION, PLEASE CONTACT: Melanee Henderson, Investor Relations Toll-Free: 877-217-8978 | Local: 604-638-3164 Twitter | Facebook | LinkedIn
Some statements in this news release may contain forward-looking information (within the meaning of Canadian securities legislation) including without limitation the intention to perform further exploration on the Treasure Creek project. These statements address future events and conditions and, as such, involve known and unknown risks, uncertainties and other factors which may cause the actual results, performance or achievements to be materially different from any future results, performance or achievements expressed or implied by the statements.
VANCOUVER, BC / ACCESSWIRE / May 3, 2022 / Granite Creek Copper Ltd. (TSXV:GCX)(OTCQB:GCXXF) (“Granite Creek” or the “Company“) is pleased to announce that it has retained SGS to complete an updated Preliminary Economic Assessment (“PEA”) on the Carmacks project. The PEA will use the 2022 Resource Estimate (Table 1), consisting of 36.2 million tonnes (Mt) in Measured and Indicated categories (M&I), grading 1.07% CuEq (0.81% Cu, 0.26g/t Au, 3.23g/t Ag and 0.011% Mo) for a total of 651 million pounds (Mlbs) of contained M&I copper and an additional 38 Mlbs Cu Inferred as the main input. Building off a 2017 PEA(1), the updated study will encompass the following:
Significant Increase in Contained Copper – The 2022 resource estimate marked a 43% increase in contained copper over the previous estimate referenced(2)
Inclusion of Sulphide Processing – As of the publication of the 2022 resource estimate the Carmacks project consists of roughly 50/50 sulfide and oxide resources by contained metal. The Company sees the inclusion of sulphide resources as a significant potential value driver having a positive impact on the economics of the project; and
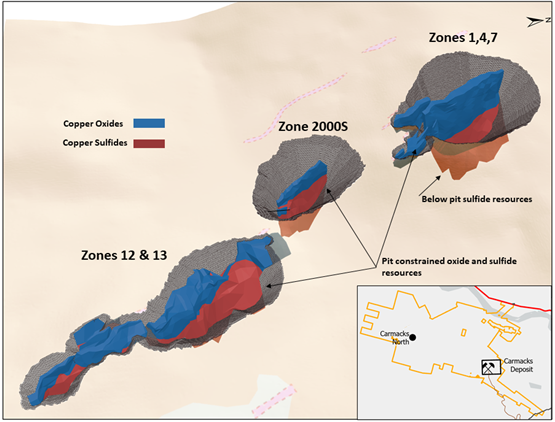
High Proportion of Resources Modeled in Three Conceptual Open Pits – 96% of the 2022 resources are contained within the conceptual pits (Figure 1). With a high percentage of current resources reporting in conceptual pits the cash cost per pound of copper is expected to be significantly lower when compared to a similar sized underground operation.
Timothy Johnson, Granite Creek President & CEO, stated, “The launch of the updated Preliminary Economic Assessment study marks a major milestone in the development of the Carmacks deposit at a time when commodities demand is seeing rapid growth. The Carmacks project is well-positioned by its location, access to infrastructure, and proximity to the operating, high-grade Minto mine just to the north. Both copper and molybdenum have been deemed by the Canadian government to be ‘critical minerals‘ based on their role in the transition to a low-carbon economy which we expect will provide prolonged price strength well into the future. We look forward to continuing to bring positive news as we develop this high-grade copper project.”
Upcoming Events
OTC Markets Mining and Metals Virtual Conference – Tim Johnson, President & CEO, will present live at VirtualInvestorConferences.com on May 5th, 2022 at 10am PT | 1pm ET. To register, click here.
Vancouver Resource Investment Conference – Granite Creek Copper will join fellow members of the Metallic Group of Companies at the 2022 VRIC event at the Vancouver Convention Centre on May 17-18. Visit us in Booth 111.
2022 Technical Report Filing
Granite Creek also announces that further to its news release dated March 15, 2022 it has filed on SEDAR a National Instrument 43-101 technical report (the “Technical Report”) for the Carmacks project, located in the Yukon, Canada.
The report, entitled “Technical Report on the Updated Mineral Resource Estimates for the Carmacks Cu-Au-Ag Project Near Carmacks, Yukon, Canada”, has an effective date of February 25, 2022. The Technical Report was authored Allan Armitage Ph.D., P.Geo of SGS Geological Services(“SGS”) an independent Qualified Person and was prepared in accordance with National Instrument 43-101 Standards of Disclosure for Mineral Projects.
The Technical Report is available under the Company’s profile at www.sedar.com and will also be available on the Company’s website at www.gcxcopper.com.
Table 1 – 2022 Carmacks Copper Project Mineral Resources
Granite Creek Copper Ltd., Tuesday, May 3, 2022, Press release picture
Cu=copper, Au=gold, Mo=molybdenum, Ag=silver, Mt=millions of tonnes, Mlbs=millions of pounds, klbs=thousands of pounds, koz=thousands of ounces. Mineral Resources are reported using the 2014 CIM Definition Standards. Mineral Resources are reported within a conceptual constraining pit shell that includes the following input parameters: Metal prices of $3.60/lb Cu, $1,750/Au, $22/oz Ag, $14/lb Mo and pit slope angles that vary from 35° for overburden to 55°for granodiorite host. Metal prices are in US$. Metallurgical recoveries reflective of prior test work that averages: 85% Cu, 85% Au, 65% Ag in the oxide domain and 90% Cu, 76% Au, 65% Ag in the sulphide domain. Mo recovery is assumed to be 70% in both oxide and sulphide domain. Tonnes are metric tonnes, with Cu and Mo grades as percentages and Au and Ag grades as gram per tonne units. Cu and Mo metal content is reported in lb and Au and Ag content is reported in troy oz. Totals and Metal content may not sum due to rounding and significant digits used in calculations. Cu Eq calculation is based on 100% recovery of all metals using the same metal prices used in the resource calculation: $3.60/lb Cu, $1,750/Au, $22/oz Ag, $14/lb Mo.
Figure 1 – Oblique view of 2022 resources and proposed pits (total strike length of 2,950 m)
Granite Creek Copper Ltd., Tuesday, May 3, 2022, Press release picture
Qualified Persons
The Carmacks project 2022 Resource Estimate was prepared by Allan Armitage, P.Geo., of SGS Geological Services, an independent Qualified Person, in accordance with the guidelines of the Canadian Securities Administrators’ National Instrument 43-101 – Standards of Disclosure for Mineral Projects (“NI 43-101”) with an effective date of February 25, 2022. Armitage conducted a site visit to the property on November 9, 2021.
Ms. Debbie James, P.Geo., a qualified person for the purposes of National Instrument 43-101, has reviewed and approved the technical disclosure not pertaining to the resource estimate contained in this news release. Ms. James is a Senior Geologist with TruePoint Exploration and a Project Manager at Carmacks.
1PEA: “NI 43-101 Preliminary Economic Assessment Technical Report on the Carmacks Project, Yukon, Canada” Effective Date 12 October 2016. Report Date: 25 November 2016. SEDAR Filing Date: 9 February 2017
1News Release: “Copper North Expands Oxide Mineral resources at Carmacks” Published on SEDAR 9 April 2018.
About Granite Creek Copper
Granite Creek, a member of the Metallic Group of Companies, is a Canadian exploration company focused on the 176 square kilometer Carmacks project in the Minto copper district of Canada’s Yukon Territory. The project is on trend with the high-grade Minto copper-gold mine, operated by Minto Metals Corp., to the north, and features excellent access to infrastructure with the nearby paved Yukon Highway 2, along with grid power within 12 km. More information about Granite Creek Copper can be viewed on the Company’s website at www.gcxcopper.com.
This news release includes certain statements that may be deemed “forward-looking statements”. All statements in this release, other than statements of historical facts including, without limitation, statements regarding potential mineralization, historic production, estimation of mineral resources, the realization of mineral resource estimates, interpretation of prior exploration and potential exploration results, the timing and success of exploration activities generally, the timing and results of future resource estimates, permitting time lines, metal prices and currency exchange rates, availability of capital, government regulation of exploration operations, environmental risks, reclamation, title, and future plans and objectives of the company are forward-looking statements that involve various risks and uncertainties. Although Granite Creek Copper believes the expectations expressed in such forward-looking statements are based on reasonable assumptions, such statements are not guarantees of future performance and actual results or developments may differ materially from those in the forward-looking statements. Forward-looking statements are based on a number of material factors and assumptions. Factors that could cause actual results to differ materially from those in forward-looking statements include failure to obtain necessary approvals, unsuccessful exploration results, changes in project parameters as plans continue to be refined, results of future resource estimates, future metal prices, availability of capital and financing on acceptable terms, general economic, market or business conditions, risks associated with regulatory changes, defects in title, availability of personnel, materials and equipment on a timely basis, accidents or equipment breakdowns, uninsured risks, delays in receiving government approvals, unanticipated environmental impacts on operations and costs to remedy same, and other exploration or other risks detailed herein and from time to time in the filings made by the companies with securities regulators. Readers are cautioned that mineral resources that are not mineral reserves do not have demonstrated economic viability. Mineral exploration and development of mines is an inherently risky business. Accordingly, the actual events may differ materially from those projected in the forward-looking statements. For more information on Granite Creek Copper and the risks and challenges of their businesses, investors should review their annual filings that are available at www.sedar.com.
Neither the TSX Venture Exchange nor its Regulation Services Provider (as that term is defined in the policies of the TSX Venture Exchange) accepts responsibility for the adequacy or accuracy of this release.
VANCOUVER, British Columbia, May 03, 2022 (GLOBE NEWSWIRE) — Rover Metals Corp. (TSXV: ROVR) (OTCQB: ROVMF) (FSE:4XO) (“Rover” or the “Company”) is pleased to announce the start of its Phase 1 Exploration Program at its 100% owned Tobin Gold Project, Winnemucca, NV, USA. Rover has engaged a renowned Carlin gold geologist to assist in the planning of the Phase 1 program.
Tobin Gold Project In February 2022, Rover acquired a 100% interest in the Tobin Gold Project (“Tobin”), which is comprised of 68 claims within BLM land, for a total of 1,405 acres (or 569 hectares). Tobin is a Carlin-style gold system set in Mesozoic rocks. The project is located about 40 km from the operating Phoenix Gold Mine, which is owned by Nevada Gold Mines, a joint venture between Newmont and Barrick. Tobin is also located about 60 km from i-80 Gold’s Lone Tree Gold Mine, 50 kms from SSR’s Marigold Mine and is in close proximity to other proven gold deposits owned by i-80 Gold, SSR Mining, and Kinross. See property map below for more details.
The property sits in the historical Mt. Tobin mercury district within an area of widespread silicification and banded chalcedony veins over an area of several square kilometers. Both structural and strata bound jasperoids are present in the adjoining Triassic and Paleozoic carbonate and fine-grained clastic sediments along the range-front structure as well as higher in the range. The prospect area was identified during a BLEG stream sediment sampling program. Follow up rock chip sampling along and above the range front confirmed that there are multiple structures carrying mineralization. Gold values run as high as 2.3 g/t Au, with many samples having gold content between 200 ppb Au and 1000 ppb Au. Pathfinder elements run as high as 200 ppm Sb, 1100 ppm As and 29 ppm Hg. Mineralization at the Tobin Project appears to be localized along two subparallel trends. The first is the range-front fault, and the second is structural zone located several tens of meters above the valley that trends somewhat obliquely to the range-front. To date, the better mineralized rocks were largely collected from this second structure located higher on the mountain front.
Judson Culter, CEO at Rover Metals, states, “The Tobin Gold Project is our first low-cost gold exploration project. We believe that future drill programs will be reverse circulation (“RC”) drill programs. Tobin is located in the mining friendly jurisdiction of Nevada, in the Battle Mountain region, which has seen significant consolidation in the past several years.”
Annual Report Rover has SEDAR filed its Annual 2021 Comparative Financial Statements and Management Discussion and Analysis (“MD&A”) for the years ended December 31, 2021 and December 31, 2020. The 2021 MD&A lays out management’s performance and significant milestones accomplished in 2021.
Technical information in this news release has been approved by David White, P.Geo., Technical Advisor of Rover and a Qualified Person for the purposes of National Instrument 43-101.
About Rover Metals Rover is a precious metals exploration company specialized in North American (Canada and U.S.) precious metal resources, which is currently advancing the gold potential of its existing projects. The Company owns five gold projects. Phase 3 Exploration at its Cabin Gold Project, in the Northwest Territories of Canada (60th parallel), is also currently underway as of the date of this release. Additionally, the Company is awaiting news from the Phase 2 Exploration Program at its Up Town Gold Project, in the Northwest Territories of Canada (60th parallel).
ON BEHALF OF THE BOARD OF DIRECTORS “Judson Culter” Chief Executive Officer and Director
For further information, please contact: Email: info@rovermetals.com Phone: +1 (778) 754-2617
Statement Regarding Forward-Looking Information This news release contains statements that constitute “forward-looking statements.” Such forward-looking statements involve known and unknown risks, uncertainties and other factors that may cause Rover’s actual results, performance or achievements, or developments in the industry to differ materially from the anticipated results, performance or achievements expressed or implied by such forward-looking statements. Forward-looking statements are statements that are not historical facts and are generally, but not always, identified by the words “expects,” “plans,” “anticipates,” “believes,” “intends,” “estimates,” “projects,” “potential” and similar expressions, or that events or conditions “will,” “would,” “may,” “could” or “should” occur. There can be no assurance that such statements prove to be accurate. Actual results and future events could differ materially from those anticipated in such statements, and readers are cautioned not to place undue reliance on these forward-looking statements. Any factor could cause actual results to differ materially from Rover’s expectations. Rover undertakes no obligation to update these forward-looking statements in the event that management’s beliefs, estimates or opinions, or other factors, should change.
THE FORWARD-LOOKING INFORMATION CONTAINED IN THIS NEWS RELEASE REPRESENTS THE EXPECTATIONS OF THE COMPANY AS OF THE DATE OF THIS NEWS RELEASE AND, ACCORDINGLY, IS SUBJECT TO CHANGE AFTER SUCH DATE. READERS SHOULD NOT PLACE UNDUE IMPORTANCE ON FORWARD-LOOKING INFORMATION AND SHOULD NOT RELY UPON THIS INFORMATION AS OF ANY OTHER DATE. WHILE THE COMPANY MAY ELECT TO, IT DOES NOT UNDERTAKE TO UPDATE THIS INFORMATION AT ANY PARTICULAR TIME EXCEPT AS REQUIRED IN ACCORDANCE WITH APPLICABLE LAWS.
NEITHER THE TSX VENTURE EXCHANGE NOR ITS REGULATION PROVIDER (AS THAT TERM IS DEFINED IN THE POLICIES OF THE TSX VENTURE EXCHANGE) ACCEPTS RESPONSIBILITY FOR THE ADEQUACY OF THIS RELEASE.
VANCOUVER, BC / ACCESSWIRE / May 3, 2022 / Group Ten Metals Inc. (TSX.V:PGE; OTCQB: PGEZF; FSE:5D32) (the “Company” or “Group Ten”) today reports wide, high-grade intervals of nickel sulphide with palladium, platinum, rhodium, cobalt, copper and gold in a third tranche of drill results from the 14-hole resource expansion campaign completed at the Company’s flagship Stillwater West PGE-Ni-Cu-Co + Au project in Montana, USA.
Results continue to support the Company’s priority objective of expanding the October 2021 inaugural mineral resource estimates with multiple wide and highly mineralized intervals returned in step-out drilling in the DR-Hybrid deposit area at Chrome Mountain (see Table 1 and Figure 1). Drilling in 2021 focused on resource expansion in three of the five deposit areas delineated by the 2021 estimates. Similar wide and well-mineralized intervals have now been reported from all three deposit areas as announced December 20, 2021, and March 7, 2022. Mineralization remains open to expansion along trend and at depth in all five deposit areas, that are in the 12-kilometer-long resource area within the broader 32-kilometer-long land package in the lower Stillwater Igneous Complex (see Figure 2).
Group Ten Metals Inc. , Tuesday, May 3, 2022, Press release picture
Live Webinar with Q&A
Group Ten President & CEO, Michael Rowley, will be joined by newly appointed Vice-President Exploration, Danie Grobler, for a live webinar on Wednesday, May 4th at 10am PT (1pm ET). To register click here or the thumbnail.
Highlights:
CM2021-05 returned 400.8 meters of continuous battery and precious metal mineralization grading 0.30% Nickel Equivalent (“NiEq”), equal to 0.80 g/t Palladium Equivalent (“PdEq”), with successive contained higher-grade intervals including 96 meters of 0.60% NiEq (1.56 g/t PdEq) and including 13.2 meters of 3.33% NiEq (8.88 g/t PdEq) as 2.31% Ni, 1.51 g/t Pd+Pt+Au+Rh (“4E”), 0.35% Cu and 0.115% Co starting at 37.6 meters. This is one of the widest high-grade intercepts ever recorded in the Stillwater district.
The results from CM2021-05 represent an important new discovery with the same distinctive signature of high-grade nickel sulphide, platinum group metals and gold as encountered in CM2020-04, which returned 8.5 meters of 1.74% NiEq (or 4.65 g/t PdEq) within a broad mineralized package located approximately 125 meters to the west. This zone remains open to further expansion with additional drilling.
CM2021-06 returned 0.26% NiEq (0.71 g/t PdEq) over 345.0 meters, including 75.4 meters of 0.37% NiEq, or 0.99 g/t PdEq, and a second, lower interval with 148.4 meters of 0.30% NiEq, or 0.79 g/t PdEq.
CM2021-04 returned 247.2 meters of 0.21% NiEq (0.57 g/t PdEq) mineralization including two long intervals at higher grades.
Results also continue to highlight the potential for significant co-product rhodium values at Stillwater West, with drill samples in Chrome Mountain holes CM2021-04, -05, and -06 up to 0.36 g/t Rh within the mineralized horizons. At recent values, rhodium trades at more than 16 times the value of platinum and 8 times the value of palladium on a spot price basis at over USD 16,000 per ounce. Sibanye-Stillwater, adjacent to Group Ten’s Stillwater West project, is the primary US producer. Supply constraints for rhodium have supported rising prices since 2017.
Assay results remain pending from five holes in the HGR deposit area at Iron Mountain and portions of holes CZ2021-01 and IM2021-04, in addition to rhodium assay results on a number of mineralized intervals reported to date.
These results, in addition to results released March 7, 2022 and December 20, 2021, demonstrate significant potential to expand the October 2021 mineral resource estimates with multiple long intervals at grades well above the 0.20% NiEq cut-off grade used in that study (see bolded assay values on Table 1). Potential is also shown to expand existing resources at higher cut-off grades, such as 0.35% and 0.50% NiEq (red values and shaded rows, respectively, on Table 1). Moreover, as shown in Figures 1 to 4, these results provide important intercepts in step-out drill holes located up to several hundred meters from the resource estimate block models.
Dr. Danie Grobler, Group Ten’s Vice-President of Exploration, commented “I am excited to extend my experience obtained over the past two decades at the Platreef in the northern Bushveld Complex to Group Ten’s Stillwater West project. We see significant comparability with Platreef-style mineralization in the lower Stillwater Complex and in particular, early evidence of higher-grade Flatreef pegmatoidal-style mineralization targets within the project’s layered magmatic stratigraphy.”
Michael Rowley, President and CEO, commented, “The high-grade intercept in hole CM2021-05 is the latest in a series of exciting discoveries made by our team in the lower Stillwater complex through the development of a new predictive geologic model for this famously metal-rich district. This notable intercept demonstrates the same high tenor nickel sulphide mineralization as a similar interval in CM2020-04, 125 meters away, and is in an area that is completely outside of the current resource block model. It also represents one of the widest high-grade battery and precious metal intercepts to date in the Stillwater district. Further step-outs on this new target, situated between the existing DR and Hybrid deposit areas, are a priority for the coming season. Overall, we continue to see confirmation of a large mineralized system with an impressive endowment of eight of the commodities listed as critical by the US government. We look forward to reporting additional remaining drill results from the 2021 Iron Mountain drilling, exploration plans for 2022, and other news in the near term.”
Table 1 – Highlight Results from the 2021 Expansion Drill Campaign at the DR and Hybrid Deposit Areas
Group Ten Metals Inc. , Tuesday, May 3, 2022, Press release picture
Highlighted significant mineralized intercepts are presented above. Grade-thickness values cover significant mineralized intervals with total palladium and nickel equivalent grade-thickness determined by multiplying the thickness of continuous mineralization (in meters) by the palladium equivalent grade (in grams/tonne) to provide gram-meter values (g-m) or by multiplying the nickel equivalent grade (in percent) to provide percent-meter values as shown. Total nickel and palladium equivalent calculations reflect total gross metal content using long term metal prices (all USD): $7.00/lb nickel (Ni), $3.50/lb copper (Cu), $20.00/lb cobalt (Co), $1,000/oz platinum (Pt), $1,800/oz palladium (Pd), and $1,600/oz gold (Au). Equivalent values have not been adjusted to reflect metallurgical recoveries. Total metal equivalent values include both base and precious metals. Intervals are reported as drilled widths and are believed to be representative of the actual width of mineralization.
Upcoming News and Events
Geological Survey of Nevada Symposium
Dr. Craig Bow will present recent findings in a technical session at the GSN Symposium May 4th in Reno, Nevada.
OTC Markets Metals and Mining Conference Virtual Conference
Michael Rowley will present on Thursday, May 5 at 10:30am PT (1:30PM ET). To register, click here.
Vancouver Resource Investment Conference
Group Ten will join fellow Metallic Group company members in Booth 111 at the 2022 VRIC event.
About Stillwater West
Group Ten is rapidly advancing the Stillwater West PGE-Ni-Cu-Co + Au project towards becoming a world-class source of low-carbon, sulphide-hosted nickel, copper, and cobalt, critical to the electrification movement, as well as key catalytic metals including platinum, palladium and rhodium used in catalytic converters, fuel cells, and the production of green hydrogen. Stillwater West positions Group Ten as the second-largest landholder in the Stillwater Complex, with a 100%-owned position adjoining and adjacent to Sibanye-Stillwater’s PGE mines in south-central Montana, USA1. The Stillwater Complex is recognized as one of the top regions in the world for PGE-Ni-Cu-Co mineralization, alongside the Bushveld Complex and Great Dyke in southern Africa, which are similar layered intrusions. The J-M Reef, and other PGE-enriched sulphide horizons in the Stillwater Complex, share many similarities with the highly prolific Merensky and UG2 Reefs in the Bushveld Complex. Group Ten’s work in the lower Stillwater Complex has demonstrated the presence of large-scale disseminated and high-sulphide battery metals and PGE mineralization, similar to the Platreef in the Bushveld Complex2. Drill campaigns by the Company, complemented by a substantial historic drill database, have delineated five deposits of Platreef-style mineralization across a core 12-kilometer span of the project, all of which are open for expansion into adjacent targets. Multiple earlier-stage Platreef-style and reef-type targets are also being advanced across the remainder of the 32-kilometer length of the project based on strong correlations seen in soil and rock geochemistry, geophysical surveys, geologic mapping, and drilling.
About Group Ten Metals Inc.
Group Ten Metals Inc. is a TSX-V-listed Canadian mineral exploration company focused on the development of high-quality platinum, palladium, nickel, copper, cobalt, and gold exploration assets in top North American mining jurisdictions. The Company’s core asset is the Stillwater West PGE-Ni-Cu-Co + Au project adjacent to Sibanye-Stillwater’s high-grade PGE mines in Montana, USA. Group Ten also holds the high-grade Black Lake-Drayton Gold project adjacent to Treasury Metals’ development-stage Goliath Gold Complex in northwest Ontario, which is currently under an earn-in agreement with an option to joint venture whereby Heritage Mining may earn up to a 90% interest in the project by completing payments and work on the project. The Company also holds the Kluane PGE-Ni-Cu-Co project on trend with Nickel Creek Platinum‘s Wellgreen deposit in Canada‘s Yukon Territory.
About the Metallic Group of Companies
The Metallic Group is a collaboration of leading precious and base metals exploration companies, with a portfolio of large, brownfield assets in established mining districts adjacent to some of the industry’s highest-grade producers of silver and gold, platinum and palladium, and copper. Member companies include Metallic Minerals in the Yukon’s high-grade Keno Hill silver district and La Plata silver-gold-copper district of Colorado, Granite Creek Copper in the Yukon’s Minto copper district, and Group Ten Metals in the Stillwater PGM-nickel-copper district of Montana. The founders and team members of the Metallic Group include highly successful explorationists formerly with some of the industry’s leading explorers/developers and major producers. With this expertise, the companies are undertaking a systematic approach to exploration using new models and technologies to facilitate discoveries in these proven, but under-explored, mining districts. The Metallic Group is headquartered in Vancouver, BC, Canada, and its member companies are listed on the Toronto Venture, US OTC, and Frankfurt stock exchanges.
Note 1: References to adjoining properties are for illustrative purposes only and are not necessarily indicative of the exploration potential, extent or nature of mineralization or potential future results of the Company’s projects.
Note 2: Magmatic Ore Deposits in Layered Intrusions-Descriptive Model for Reef-Type PGE and Contact-Type Cu-Ni-PGE Deposits, Michael Zientek, USGS Open-File Report 2012-1010.
2021 drill core samples were analyzed by ACT Labs in Vancouver, B.C. Sample preparation: crush (< 7 kg) up to 80% passing 2 mm, riffle split (250 g) and pulverize (mild steel) to 95% passing 105 µm included cleaner sand. Gold, platinum, and palladium were analyzed by fire assay (1C-OES) with ICP finish. Selected major and trace elements were analyzed by peroxide fusion with 8-Peroxide ICP-OES finish to insure complete dissolution of resistate minerals. Following industry QA/QC standards, blanks, duplicate samples, and certified standards were also assayed.
Mr. Mike Ostenson, P.Geo., is the qualified person for the purposes of National Instrument 43-101, and he has reviewed and approved the technical disclosure contained in this news release.
Forward-Looking Statements
Forward Looking Statements: This news release includes certain statements that may be deemed “forward-looking statements”. All statements in this release, other than statements of historical facts including, without limitation, statements regarding potential mineralization, historic production, estimation of mineral resources, the realization of mineral resource estimates, interpretation of prior exploration and potential exploration results, the timing and success of exploration activities generally, the timing and results of future resource estimates, permitting time lines, metal prices and currency exchange rates, availability of capital, government regulation of exploration operations, environmental risks, reclamation, title, and future plans and objectives of the company are forward-looking statements that involve various risks and uncertainties. Although Group Ten believes the expectations expressed in such forward-looking statements are based on reasonable assumptions, such statements are not guarantees of future performance and actual results or developments may differ materially from those in the forward-looking statements. Forward-looking statements are based on a number of material factors and assumptions. Factors that could cause actual results to differ materially from those in forward-looking statements include failure to obtain necessary approvals, unsuccessful exploration results, changes in project parameters as plans continue to be refined, results of future resource estimates, future metal prices, availability of capital and financing on acceptable terms, general economic, market or business conditions, risks associated with regulatory changes, defects in title, availability of personnel, materials and equipment on a timely basis, accidents or equipment breakdowns, uninsured risks, delays in receiving government approvals, unanticipated environmental impacts on operations and costs to remedy same, and other exploration or other risks detailed herein and from time to time in the filings made by the companies with securities regulators. Readers are cautioned that mineral resources that are not mineral reserves do not have demonstrated economic viability. Mineral exploration and development of mines is an inherently risky business. Accordingly, the actual events may differ materially from those projected in the forward-looking statements. For more information on Group Ten and the risks and challenges of their businesses, investors should review their annual filings that are available at www.sedar.com.
Neither the TSX Venture Exchange nor its Regulation Services Provider (as that term is defined in the policies of the TSX Venture Exchange) accepts responsibility for the adequacy or accuracy of this release.
Volume: 178,258 Market Cap: 61.19m PE Ratio: 2.70 Year High: $0.98 Year Low: $0.39 Shares Out: 115,458,038 Float: 132,943,270
Institute Hold’gs: 0.40% (as of 03/31/22) Institutions Bought Prev 3 Mo: 0
Goldshore Resources Inc. (GSHR:TSX; GSHRF:OTC; 8X00:FSE). Mr. Richards, it’s a pleasure to be speaking with you today, to have you introduce us to Goldshore Resources, which is focused on creating the next Tier One Asset in Ontario, Canada.
Before we deep dive into company specifics, Mr. Richards, please introduce us to Goldshore Resources, and the exciting opportunity the company presents to the shareholders.
Thanks Maurice. Goldshore Resources was founded in January 2021 with the acquisition of the Moss Lake Project from
See More Live DataWesdome Gold Mines Ltd. (WDO:TSX) for $52M in cash and shares. Subsequent to that, we raised $25M and then received approval from the TSXV, and we were admitted for trading on June 4, 2021. Since that time, we have been focused on a comprehensive exploration approach to the asset —commencing with a VTEM geophysical survey, which will guide (is guiding) a 100,000m drill program. Currently, we are about 20% of the way through the program—and we expect to complete the program in 2022. During this period, we will conduct extensive metallurgical test work, prepare the project from an ESG standpoint for a feasibility study, and prepare the project for the next phase of development drilling. After which (Q1 2023) we will update the resource estimation and prepare a new preliminary economic analysis (“PEA”) – (end of Q1 2023). These are the steps we are taking to create the next Tier One Asset in Ontario, Canada.
Let’s find out more! Mr. Richards, please acquaint us with your flagship Moss Lake Property beginning with your location and some of your neighbors in the region.
We are apx. 120 km west of Thunder Bay, Ontario on the Trans-Canada highway. We have the flagship Moss Lake Gold project as our core focus, but in 2014 and 2015, Wesdome acquired additional lands adjacent to the Moss Lake Gold project that included Coldstream, North Coldstream, and Iris Lake to the northeast; and Hamlin Lake to the south-west. We have a c.4m oz historical resource, estimated by Moss Lake in 2013, and had a historical PEA done in 2013 that input parameters were updated by Wesdome in 2020. The Moss Lake Property has a rich history of gold and silver production dating back to the early 1900s.
Tell us more.
The area has been explored by prospectors for a long time, literally over 100 years. The region of the Shebandowan Greenstone belt is a fairly complex region geologically and structurally, but the Moss Lake Project is in an area contained within intermediate to felsic volcaniclastic rocks of the northeast-trending, fault-bounded central intermediate to felsic metavolcanic belt, is vertical to steeply southeast dipping and possibly overturned. Two northeast-trending regional fault structures cross the property from northeast to southwest. We have a domain boundary area at Moss Lake that is a sheer zone style of deposit hosted with diorite intrusions with high resistors and high chargeability—bordered with domains of high conductors (magnetite and iron), which to the north-east and south-west are very different styles of deposit and host copper-gold-silver, and to the northeast, those elements along with lead-zinc-molybdenum and in North Coldstream, cobalt. The North Coldstream mine actually produced a copper-gold concentrate for many years in the 1940s through the 1960s, before being closed and decommissioned in 1982 due to the low copper price.
I am curious is the infrastructure still intact?
There is no infrastructure still intact at North Coldstream, as it has been decommissioned—but one day, I will look forward to mining the high-grade area of historic tailings that have been decommissioned. But when we speak of infrastructure, there is substantial infrastructure to build a district-scale mining camp at Moss Lake.
Why do I say that? Because our land package is quite extensive and touches on the Trans-Canada highway—Highway 11 (the longest street in the world—Yonge Street). With that access, we have: very inexpensive / high-capacity electric grid power; natural gas; 4 lane highway; both CN and CP Rail lines within 1 km., with a rail spur near our site; access to people / contractors / consultants and a skilled workforce in Thunder Bay, and an international airport within 120 km of our site. These are all literally on our doorstep, which makes building a large-scale mining camp in the area, extremely doable.
Let’s fast forward to 2020 when I understand a robust PEA was completed. Can you walk us through the numbers?
Yes—no problem. The 2013 PEA that was updated by Wesdome in 2020 has a number of caveats to the framework of becoming a Tier One Asset, but what we need to do is increase the size of the resource to closer to 10M oz.
The raw numbers are:
128M tonnes is the mineable resource.
3M oz Au gets pulled in the life of mine (“LOM”) plan [mineable pit shell(s)].
45M Au is the output for a 10-year LOM, o.
245K oz Au production per year for 10 years.
Pre-production CapEx is CA$542M.
Cash costs are apx. CA$926 / oz.
5% discount rate.
You will note the recoveries are quite low at 80% in the Mian Zone and 85% in the QES Zone, and we look to increase these to mid 90%+ recoveries, which will go straight to the net present value (“NPV”) of the project.
Before we go on-site, can you share some of the key economic outputs for Moss Lake Property?
Well, the economic outputs are quite staggering in my view. The post-tax NPV of the project at the base case gold price used ($1,546) was $334M, and when sensitized up to today’s trading range—it is anywhere from $691M to $1.1B—and that is our starting point before we add any ounces to the project.
Companies at our stage of development trade at 0.3X NPV, and that puts us at an estimated share price trading range from $1.53 ($1,800 Au) to $2.59 ($2,200 Au), and today we are trading at $0.50—so it is easy to see why I am excited about this project, and it is very easy to see the value creation that we can deliver on as we take steps to make this a Tier One Asset.
When we look at trading comparables on a like-for-like basis with respect to the style of deposit, jurisdiction, stage of development, etc., we are trading at a fraction of the mean of our peer group on a market cap to per ounce basis, and again, this is our starting point. So also again, you can easily see the room for share price appreciation throughout the remainder of this year and as we head towards a resource estimation update and new PEA.
Let’s get some boots on the ground and visit the Moss Lake Property where the company is currently undergoing a massive 100,000 Meter Drill Program.
Beginning with geophysical airborne analysis what can you share with us? What was the VTEM able to determine?
The VTEM survey ended up being an invaluable part of our analysis of this project. Geotech and TechnoImaging did an amazing job of not only putting this together, but also putting the interpretation together for us to better identify high-probability drill targets in not just Moss Lake, but also in the northeast Coldstream area, and the south-west Hamlin Lake area. We now have 29 brand new targets that are very compelling when you look at layering: historical exploration work; historical drill data; historical production data (at North Coldstream) and then align the VTEM model with our current drilling plans—it is very compelling.
Mr. Richards, I’m going to turn the controls over to you to give us an underground view of the Moss Lake Property, and have you share with us what has Market excited about the opportunity before us.
The 3D model is contained within the VTEM interpretation press release, which describes everything going on over the entire property.
I must admit, there is an awful lot to unpack here, but if you take away nothing else from the VTEM interpretation, I want to leave people with this: This is our Moss Lake deposit that was used for the historical PEA—it contains 3.0M oz Au input, and is modeled in 3-dimensional view.
That same geophysical signature is found in 11 different areas along the strike of Moss Lake, over a distance of 12 km. The existing resource above has a strike length of 2.5km long, the projected resource can be extrapolated over a 12km strike. This area along the 12km strike also has known mineralization from historic drilling (all fairly similar to the Moss Lake resource)—which compounds the certainty of positive drill results when we get to drilling it.
This is incredibly meaningful, and illustrates the tremendous potential Moss Lake has (irrespective of the additional potential of Coldstream and Hamlin Lake) of becoming not only a Tier One Asset but resource growth way beyond this theoretical barrier the major mining companies claim as their starting point; which is 10M oz. Au eq.
Before we leave the Moss Lake Property, multilayered question, what is the next unanswered question for Goldshore Resources, when can we expect a response, what determines success, and what can we expect as far as news flow?
I think the questions I get asked the most are: “just how big can Moss Lake be?”, and “why has no one else explored this project or this region?”, and “what makes Goldshore so special to do this?”
I appreciate there are a lot of armchair cynics looking at (and understanding how) the Shebandowan Greenstone Belt can be a district-scale mining camp like Red Lake, Timmins, or Abitibi. However, many things have changed over the past 10 years to allow for these low-grade / bulk tonnage deposits to shine technically and economically.
Detour Lake (Kirkland Lake—now Agnico Eagle) is a great example of how to take a project like this through stages of development / resource growth / production capacity phases of expansion, to becoming a generational sized / scaled mine. We are trying to follow that path, in as methodical a way as possible, in the essence of creating and maximizing shareholder value.
What has changed?
Primarily the gold price, and the trading range that now binds the gold price between $1,800 and $2,200 / oz for the foreseeable future. This not only allows for the low grade / bulk tonnage deposits to shine, but because they are so geared economically to the gold price—when the gold price runs—the NPV of these styles of projects goes up hundreds of millions of dollars, with every $100 increase in the gold price.
So, our focus has always been treating this as a real project—de-risking the project geologically, metallurgically, environmentally, socially, and trying to put our collective experience of building mines to work, thinking forward about project nuances down the road, and addressing them now.
So just how big can Moss Lake be?
I don’t know—but what I do know is that we can visibly see a path to 10M oz and becoming a Tier One Asset.
Leaving the project site, let’s discuss some important topics germane to the projects . . . Is the Moss Lake Property 100% owned or do they have earn-in options?
Moss Lake property is 100% owned by Moss Lake Project Inc., which is 100% owned by Goldshore Resources. We own 100% of the project and Wesdome is a 22% shareholder in Goldshore Resources.
Are you fully permitted?
We are permitted to conduct the exploration activities for the next period / stage of development, but these are provincial permits required for land disturbances (water usage / trail building / road building, etc.) and other small permits as well.
There will however be a comprehensive permitting exercise down the road when this goes from feasibility study to financing / construction decision.
Is the ultimate goal for Goldshore Resources to build a mine or arbitrage?
The ultimate goal for Goldshore Resources is to build as large an economic resource as possible, and frame that resource into a viable / credible project through the PEA process. Where Goldshore takes it after this stage, is still to be defined—however, myself and Pete Flindell (VP Exploration) have built 3 mines together in our career; and several members of our Board and Advisory Board have also built mines and run single or multi-operation mining companies over their careers. So, we are well-positioned to take this in any direction where we think we will maximize the return for our shareholders.
I have always said that partnering with a mid-tier or major mining company that has the financial / technical / project / operating experience in these types of deposits is going to maximize the value for our shareholders (and provide a liquidity event) and that may well be the case. However, nothing is certain in this world, and we have to prepare the company for all possible outcomes.
We’ve discussed the good, let’s address the bad. What can go wrong and what are your actions plan to mitigate that wrong?
In mining, anything and everything can go wrong—and it usually does. Mining companies are classic for over-promising and under-delivering, and we are taking a conservative approach to deliver on promises and deliver on targets.
There are however a lot of challenges that delay the delivery of these targets (covid / supply chain disruptions / labor shortages etc.) but ultimately, we need to mitigate the risk of not executing in whatever / whichever way we need to do that. We need to execute—and we need to deliver!
I don’t see a large degree of traditional geological / metallurgical / other technical risk in the Moss Lake project, and with its extensive infrastructure availability, it is a large mine “waiting to be built.” However, getting through the necessary steps and stages has proven to be challenging due to the delays as listed above—and these factors continue to be delays in the steps and stages. My job is to keep the market close to all of this and to ensure that we are mitigating the risk(s) as much as possible over these next months of critical development for the Goldshore story.
Switching gears . . . Let’s discuss the people responsible for increasing shareholder value. Mr. Richards, please introduce us to your Board of Directors and Management Team, and what skill sets do they bring to Goldshore Resources?
Yes—the Board and Board Advisory Team is comprised of first-rate people—first and foremost. These individuals bring a breadth of experience in capital markets, corporate governance, and corporate finance, and everyone has played a role in their careers in building large mining enterprises in some cases from small micro-cap starting points; to exponential multiples of first investment.
To highlight one individual and not name them all would be an injustice to the group, as they are all tremendous individuals with complementary and aggregated skill sets. I feel Goldshore might have the strongest Board and Advisory Board of any junior mining company in Canada today.
Who is Brett Richards and what makes him qualified for the task at hand?
Brett Richards—well, after 36 years in the mining and metals space, I have learned that you are never too old to learn new things, and just when you think you have figured it out—you realize there is more to learn. It is why I surround myself with exceptional people who are over-achievers in their own right. I can lead people—but one person cannot make a great company—exceptional teams make exceptional companies.
I have been fortunate enough to work for some great organizations and some of which I have cofounded. Since the 1980s—those companies have included: Co-Steel Inc., Kinross Gold, Katanga Mining, Avocet plc, Roxgold, Midnight Sun Mining, Octéa, African Thunder Platinum, and Richards Enterprises Inc. Most recently, and prior to coming to Goldshore, I worked for private equity clients such as Pala Investments, Gramercy, Genii, BNF, and the Carlyle Group.
I have a background in mechanical engineering, mineral economics, and a master’s in business administration-management engineering. However, the more important stuff is that I am a purveyor, collector, and drinker of fine red wine, and also an avid sports enthusiast.
How about boots on the ground, who do you have on your technical team?
Well, the key to the technical competency of the organization starts with our VP, Exploration—Pete Flindell. Pete and I have worked together on probably 10+ projects over the past 15+ years and he is a world-renowned senior geologist with experience in apx. 50 countries on every habitable continent.
Pete is a collaborative teacher—who loves to build teams; train teams; share ideas and experiences and those who have worked with Pete and under his direction, praise his geological leadership.
We have a team of about 5 senior geologists, 12 junior geologists, 12 geo techs, and about 30 drillers. Again, to mention one would do the rest of the team not mentioned an injustice, as we have built a great team of people on the ground.
Let’s get into some numbers . . . Mr. Richards, please provide the capital structure for Goldshore Resources, current shares outstanding.
Sure—here are the following high-level numbers:
135M shares outstanding.
5M shares out fully diluted.
$20M in the treasury.
Since we are covering numbers, how does Goldshore Resources compare with some of your peers?
As mentioned in the previous valuation discussion, we trade at a significant discount to our peers. As illustrated on the chart below, we are trading at $14/ounce today and the median of our peer group is around $40/ ounce.
How many cash and cash equivalents do you have?
CA$20M.
How much debt do you have?
CA$0.
What is your burn rate?
CA$2M per month (+/-).
What percentage of ownership does management have and who are the major shareholders?
Management holds – 12%.
Wesdome – 22%.
Resources Fund (Europe) – 3%.
Brett Richards – 3%.
Galen McNamara – 3%.
What is the float?
135M shares outstanding.
5M shares out fully diluted.
However, the free float is about $80M shares (as of April 19, 2022).
Are there any redundant assets on the books that we should know about?
No.
Are there any change in control fees, if yes, what is the compensation?
No—however, Wesdome has ROFR rights on a change of control.
Is management charging a consultant fee for any services?
No.
In closing . . . Sir, what keeps you up at night that we don’t know about?
In 2021, it was the pandemic and the impact it has had on the health (personal and mental health) of our employees and contractors—and now with that subsiding, I think the various macro-drivers of gold price (which present global crises and global instability): Russia/Ukraine crisis; hyper-inflation; the US and global economic policies—basically the headline of every newspaper is what keeps most of up at night. The world order feels like it is changing, and with that comes a lot of uncertainty about the future and that of our kids’ and grandkids’ future.
Last question what did I forget to ask? (This is an actual question; the floor is yours)
I think you have covered everything—but one final note to those looking at buying Goldshore Resources: “Why do you want to buy gold? Why do you want to buy gold equity? What moves the needle in gold equities and separates them from other gold equities? The answers to all of these questions are better served by holding Goldshore Resources than holding any other junior gold equity in the capital markets.
Safety, security, a hedge against inflation, a hedge against various global economic uncertainty, size, scale, resource potential, visibility to production . . . Goldshore Resources’ potential and its “Quest to 10M oz of Gold” will deliver the best result to all of those questions.
Proven and Probable LLC receives financial compensation from its sponsors. The compensation is used to fund both sponsor-specific activities and general report activities, website, and general and administrative costs. Sponsor-specific activities may include aggregating content and publishing that content on the Proven and Probable website, creating and maintaining company landing pages, interviewing key management, posting a banner/billboard, and/or issuing press releases. The fees also cover the costs for Proven and Probable to publish sector-specific information on our site, and also to create content by interviewing experts in the sector. Proven and Probable LLC does accept stock options and cash as payment consolidation for sponsorship. Sponsor pages may be considered advertising for the purposes of 18 U.S.C. 1734.
The Information presented in Proven and Probable is provided for educational and informational purposes only, without any express or implied warranty of any kind, including warranties of accuracy, completeness, or fitness for any particular purpose. The Information contained in or provided from or through this forum is not intended to be and does not constitute financial advice, investment advice, trading advice, or any other advice. The Information on this forum and provided from or through this forum is general in nature and is not specific to you the User or anyone else. YOU SHOULD NOT MAKE ANY DECISION, FINANCIAL, INVESTMENTS, TRADING, OR OTHERWISE, BASED ON ANY OF THE INFORMATION PRESENTED ON THIS FORUM WITHOUT UNDERTAKING INDEPENDENT DUE DILIGENCE AND CONSULTATION WITH A PROFESSIONAL BROKER OR COMPETENT FINANCIAL ADVISOR. You understand that you are using any and all Information available on or through this forum AT YOUR OWN RISK.”
All Rights Reserved.
Images provided by the author.
1) Maurice Jackson: I, or members of my immediate household or family, own securities of the following companies mentioned in this article: Goldshore Resources Inc. I personally am, or members of my immediate household or family are, paid by the following companies mentioned in this article: Goldshore Resources Inc.
2) The following companies mentioned in this article are billboard sponsors of Streetwise Reports: None. Click here for important disclosures about sponsor fees.
3) Statements and opinions expressed are the opinions of the author and not of Streetwise Reports or its officers. The author is wholly responsible for the validity of the statements. The author was not paid by Streetwise Reports for this article. Streetwise Reports was not paid by the author to publish or syndicate this article. Streetwise Reports requires contributing authors to disclose any shareholdings in, or economic relationships with, companies that they write about. Streetwise Reports relies upon the authors to accurately provide this information and Streetwise Reports has no means of verifying its accuracy.
4) This article does not constitute investment advice. Each reader is encouraged to consult with his or her individual financial professional and any action a reader takes as a result of information presented here is his or her own responsibility. By opening this page, each reader accepts and agrees to Streetwise Reports’ terms of use and full legal disclaimer. This article is not a solicitation for investment. Streetwise Reports does not render general or specific investment advice and the information on Streetwise Reports should not be considered a recommendation to buy or sell any security. Streetwise Reports does not endorse or recommend the business, products, services or securities of any company mentioned on Streetwise Reports.
5) From time to time, Streetwise Reports LLC and its directors, officers, employees or members of their families, as well as persons interviewed for articles and interviews on the site, may have a long or short position in securities mentioned. Directors, officers, employees or members of their immediate families are prohibited from making purchases and/or sales of those securities in the open market or otherwise from the time of the decision to publish an article until three business days after the publication of the article. The foregoing prohibition does not apply to articles that in substance only restate previously published company releases.