After one of the biggest surges in price for gold, silver and platinum, the DSI still suggests we are a long way from a major top. As of the December 22 close the DSI for gold was 83, 84 for silver and 88 for platinum. At one point during Monday platinum gained over $100 an ounce. I believe that is the biggest one day move in history. As I write on the morning of December 23rd, gold stopped just short of $4500 an ounce, silver actually touched $70 an ounce a few minutes ago and platinum is just short of $2200 an ounce after jumping up as high as $2210. Given that platinum is up nine days in a row, it would be appropriate for the metal to correct.
This has been a dreadful year for getting assays back from the labs. With hundreds of juniors submitting tens of thousands of samples for assay, the labs simply couldn’t keep up. The tide seems to be turning and several companies are releasing barn burning results into what is normally the most boring period in the year.
Hole GC25-84 delivered 24.2 meters of 5.92 g/t gold including 12.2 meters of 10.51g/t gold from 120.4 meters deep. Hole GC25-83 showed 16.8 meters of 8.30 g/t gold including 6.1 meters of 17.61 g/t Au from 158 meters depth. So, hole 84 returned 143 gram/meters while hole 83 reported 139 gram/meters. Anything over 100 gram/meters is a home run especially with gold approaching $4500 an ounce.
West Point announced three holes of an ongoing 15,000-meter drill program at the Northeast Tyro portion of the Gold Chain project. These three holes represent 658 meters of drilling with 3,229 meters completed to date. Assays are pending for an additional 1,594 meters of drilling.
The Tyro vein system measures about 3.4 km with mineralization from surface still open to the northeast, southwest and clearly at depth. Within this portion the Tyro Main Zone has defined about one km of continuous mineralization. WPG has defined a conceptional exploration target of between about 1.4 million ounces up to as high as about 3 million ounces of gold. Management was pleased to report that these assay results surpassed their grade expectations.
In addition to the Gold Chain project, WPG controls the Jefferson Canyon JV with Kinross Gold where Kinross can earn up to 80% of the project. The company also owns the Baxter Spring and Tip Top gold projects also within the Walker Lane deformation belt.
As of mid-December, West Point showed $7.2 million in working cash after raising about $3 million in warrant exercise. Their exploration program is fully funded into 2026.
Expect ongoing assay results into Q1 and Q2 of 2026. A second drill rig will be introduced in January at Gold Chain as WPG continues drilling and exploration at Tyro Main and NE Tyro. The next major milestone will be a maiden 43-101 for Gold Chain.
West Point Gold has advanced in price from $.85 to $1.18 since the release of their latest assays on the 17th for a 39% move higher in a week. With gold continuing to advance I suspect punters will still find WPG an attractive alternative.
West Point Gold is an advertiser therefore of course I am biased. As always, do your own due diligence.
West Point Gold Corp WPG-V $1.18 (Dec 22, 2025) WPGCF-OTCQB 108 million shares West Point Gold website
Vancouver, British Columbia–(Newsfile Corp. – December 17, 2025) – West Point Gold Corp. (TSXV: WPG) (OTCQB: WPGCF) (FSE: LRA0) (“West Point Gold” or the “Company”) is pleased to announce the results for three holes from the high-grade zone at Northeast (NE) Tyro, part of the ongoing 15,000 metre (m) drill program at its flagship Gold Chain Project in Arizona. The Company is reporting assay results for three drill holes (658m), GC25-82 through GC25-84.
Highlights:
Hole GC25-84 returned 24.4 m of 5.92 g/t Au at 120.4 to 144.8 m, including 12.2 m of 10.51 g/t Au at 132.6 m to 144.8 m, 90 m below hole GC25-78 which returned 22.9 m of 1.63 g/t Au.
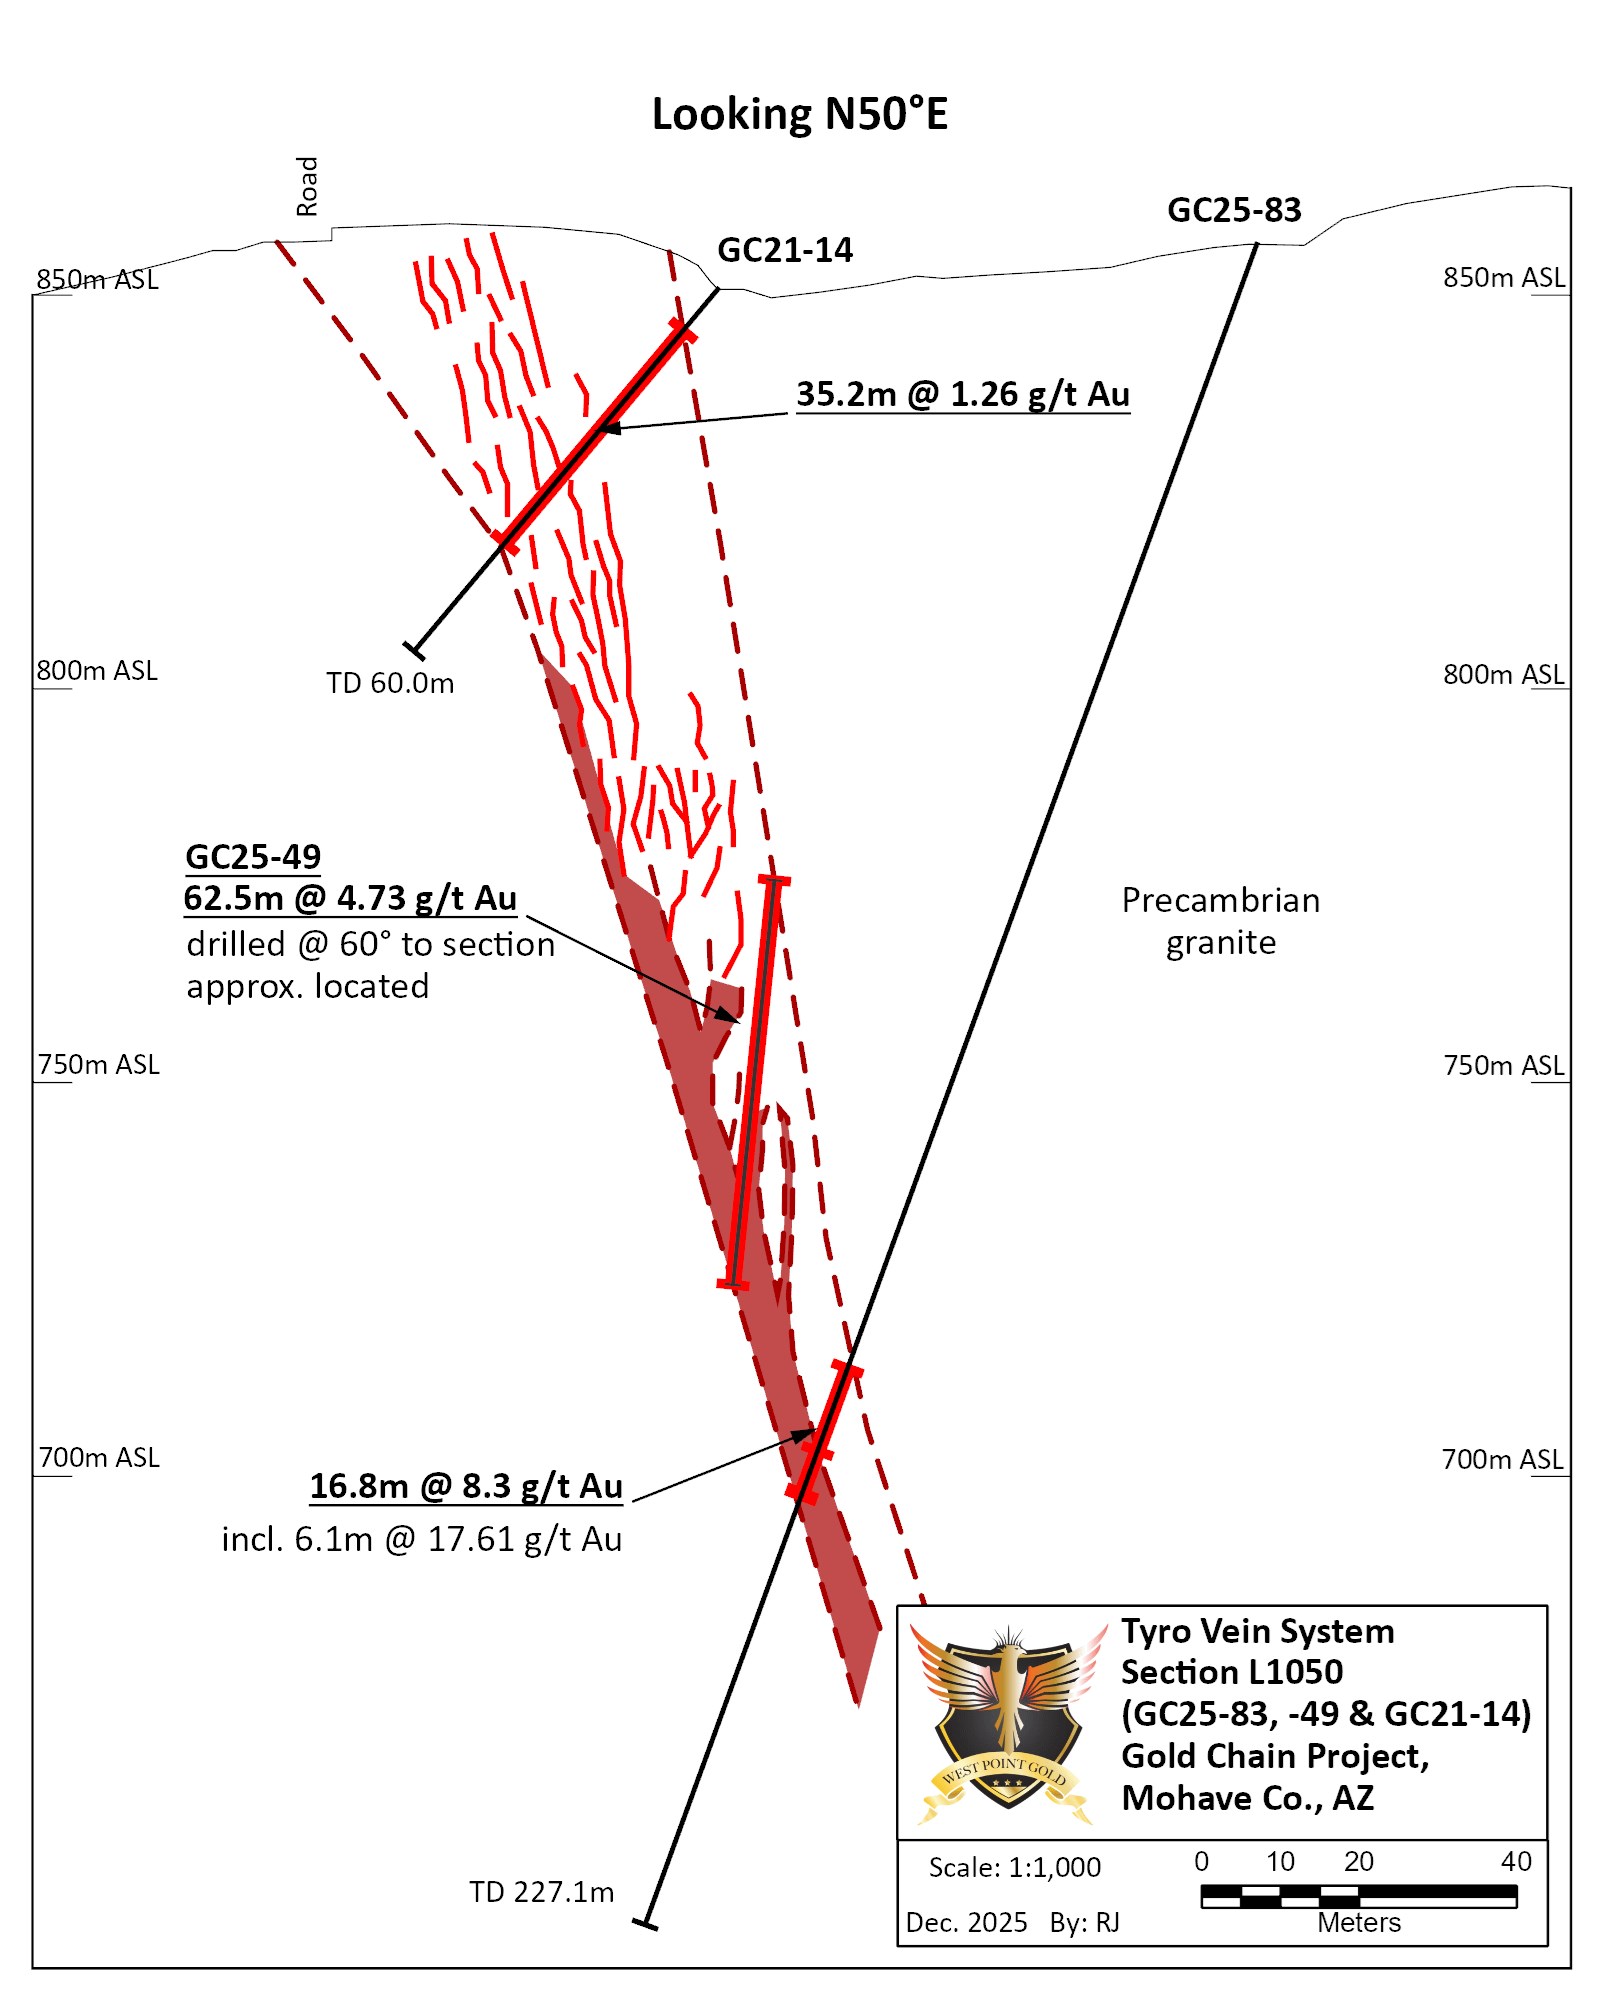
Hole GC25-83 returned 16.8 m of 8.30 g/t Au at 158.5 to 175.3 m, including 6.1 m of 17.61 g/t Au at 167.6 to 173.7 m about 45m below GC25-49 (62.5 m of 4.73 g/t Au).
Drilling continues to explore the deeper portions of the high-grade zone at NE Tyro with four holes (936 m) completed with assays pending.
“Drilling at NE Tyro continues to return better than expected grades. Importantly, grades appear to be improving at depth as the veining coalesces, typical of low-sulphidation epithermal gold systems. These results continue to demonstrate continuity of high grades, expanding the high-grade zone to depth and along strike to the northeast. We expect these results to positively impact the grade profile and the overall scale of our upcoming maiden resource. Drilling continues at NE Tyro,” stated Derek Macpherson, President and CEO.
Table 1: Drill Results
Holes
From (m)
To (m)
Width (m)
Grade (g/t Au)
GC25-82
138.7
234.7
96.0
0.42
GC25-83
158.5
175.3
16.8
8.30
including
167.6
173.7
6.1
17.61
GC25-84
120.4
144.8
24.4
5.92
including
132.6
144.8
12.2
10.51
Note: All widths shown are downhole; true widths are approximately 60-70% of downhole widths.
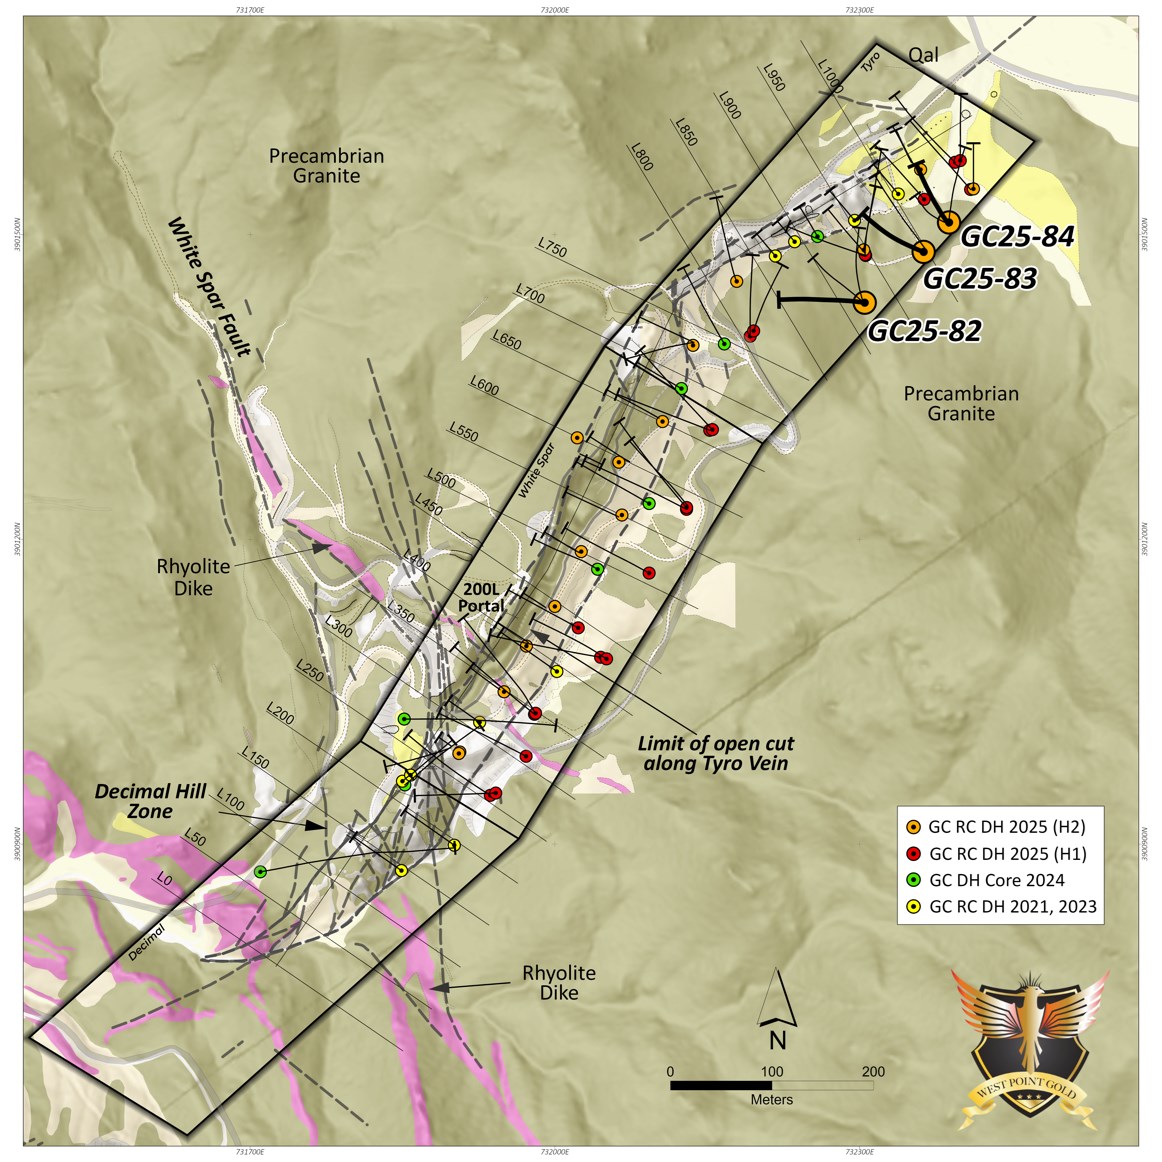
Figure 1: Plan view of the Main Tyro vein showing geology and drilling conducted in 2021, 2023, 2024 and 2025. Note the location of Hole Nos. GC25-82, GC25-83 and GC25-84.
Figure 2. Longitudinal perspective of the Tyro Main and NE Zones Showing Core and RC Drilling to Date. Holes GC25-82 through GC25-84 are highlighted and described below.
Summary These results follow the ongoing 15,000 m drilling program at the Company’s Gold Chain project in Arizona, which is focused on expanding the higher-grade zone at NE Tyro laterally and downward, as identified in Q2 of 2025. The three holes comprising this release, GC25-82 through GC25-84, represent 658 m of 3,229 m drilled to date of the 15,000 m program.
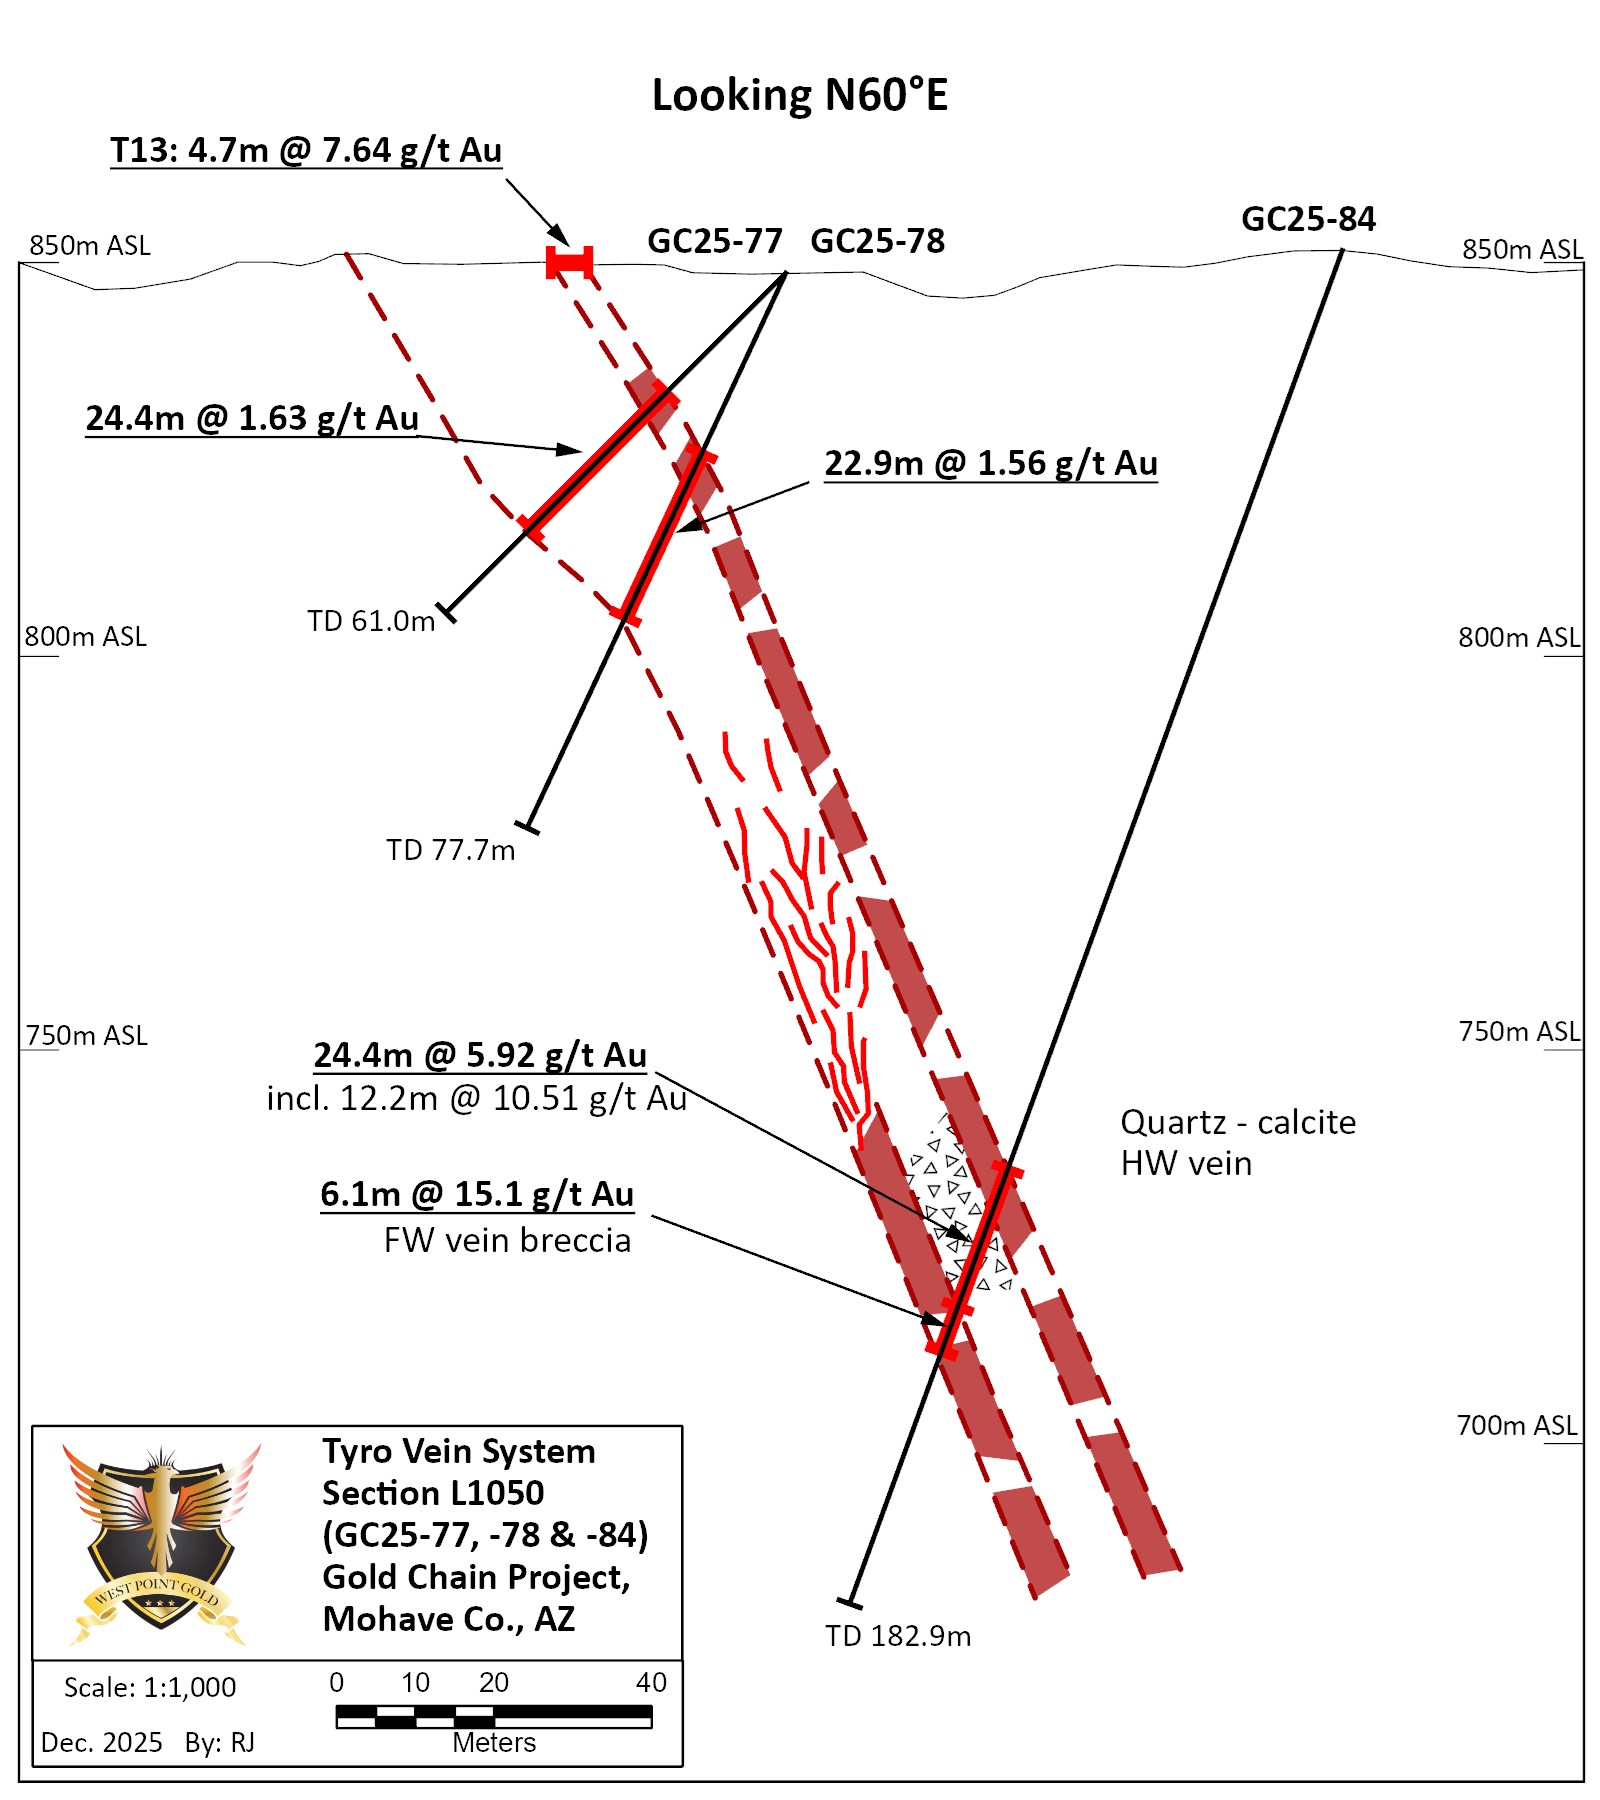
All three holes in this release have extended gold mineralization to depth from 50 to 90 metres. These results, in context with previous drilling, suggest a coalescing of veins and veinlets downward and to the northeast with a marked increase in gold grades, i.e. GC25-78 with 22.9 m of 1.56 g/t Au and GC25-84 with 24.4 m of 5.92 g/t Au, including 12.2 m of 10.51 g/t Au (Figure 4). This coalescing of veins and veinlets is common in many epithermal vein systems. Along with the increased gold grades at depth, close inspection of the drill cuttings reveals an increase in varicolored chalcedony, crustiform banding, adularia and illite(?)-pyrite alteration in the wallrock.
Hole GC25-83 Hole GC25-83 traversed the Tyro NE vein/zone about 30 to 50 m below GC25-49 (62.5 m at 4.73 g/t Au), revealing a more defined vein structure with the strongest vein developed at the footwall contact, likely an important fault. The hole intersected 16.8 m of 8.30 g/t Au at 158.5 to 175.3 m, including 6.1 m of 17.61 g/t Au (Figure 3).
Figure 3: Cross-sectional view of Hole GC25-83 down-dip from Holes GC25-49 and GC21-14
Hole GC25-84 Hole GC25-84 was drilled to test the vein system about 90 m below Hole GC25-78 which traversed 22.9 m of 1. 56 g/t Au (Figure 4). This hole encountered a more discrete, compact mineralized package composed of quartz-calcite-(adularia) vein from 120.4 m to 144.8 m (24.4 m) containing 5.92 g/t Au. Quartz veinlets and breccia give way to vein and breccia toward the footwall contact with 6.1 m at 15.1 g/t Au. Elevated percentages of varicolored chalcedony + adularia appear to correspond to higher gold grades (up to 25.1 g/t Au).
The strengthening or consolidation of the vein at the footwall contact has been observed in other surrounding holes. The results indicate that the mineralized zone has coalesced into a more discrete mineralized package or vein in the relatively short distance of less than 150 metres.
Figure 4: Cross Sectional View of Hole GC25-84 down-dip from Holes GC25-77/-78.
Hole GC25-82 Hole GC25-82 was designed to test the deeper projection of a broad zone of quartz-calcite veinlets observed in Hole GC25-60 (50.3 m @ 1.29 g/t Au) about 65 m deeper into the vein system. A broad zone of veining was encountered from 138.7 m to 234.7 m (96.0 metres) at 0.42 g/t Au (Figure 2). These results, in conjunction with GC25-60, suggest that the Tyro NE zone is horse tailing as it approaches the ‘bend’ where mapping, surface sampling and drilling have identified, but not defined, a ‘stepover’ into the Tyro Main zone. Additional drilling will be needed to better define the extent of this broad, low-grade zone.
Qualified Person Robert Johansing, M.Sc. Econ. Geol., P. Geo., the Company’s Vice President, Exploration, is a qualified person (“QP”) as defined by NI 43-101 and has reviewed and approved the technical content of this press release. Mr. Johansing has also been responsible for overseeing all phases of the drilling program, including logging, labelling, bagging and transport from the project to American Assay Laboratories of Sparks, Nevada. Drillholes have a diameter of about 10cm, and samples have an approximate weight of 5 to 10kg. Samples were then dried, crushed and split, and pulp samples were prepared for analysis. Gold was determined by fire assay with an ICP finish, and over-limit samples were determined by fire assay and gravimetric finish. Silver plus 15 other elements were determined by Aqua Regia ICP-AES (IM-2A16), and over-limit samples were determined by fire assay and gravimetric finish. Both certified standards and blanks were inserted on site along with duplicates, standards and blanks inserted by American Assay. The results summarized above have been carefully reviewed with reference to the QA/QC results. Standard sample chain of custody procedures were employed during drilling and sampling campaigns until delivery to the analytical facility.
About West Point Gold Corp. West Point Gold is an exploration and development company focused on unlocking value across four strategically located projects along the prolific Walker Lane Trend in Nevada and Arizona, USA, providing shareholders with exposure to multiple discovery opportunities across one of North America’s most productive gold regions. The Company’s near-term priority is advancing its flagship Gold Chain Project in Arizona.
For further information regarding this press release, please contact: Aaron Paterson, Corporate Communications Manager Phone: +1 (778) 358-6173 Email: info@westpointgold.com
FORWARD-LOOKING STATEMENTS: Certain statements contained in this press release constitute forward-looking information. These statements relate to future events or future performance. Forward-looking statements include estimates and statements that describe the Company’s future plans, objectives or goals, including words to the effect that the Company or management expects a stated condition or result to occur. The use of any of the words “could”, “intend”, “expect”, “believe”, “will”, “projected”, “estimated” and similar expressions and statements relating to matters that are not historical facts are intended to identify forward-looking information and are based on the Company’s current belief or assumptions as to the outcome and timing of such future events including, among others, assumptions about future prices of gold, silver, and other metal prices, currency exchange rates and interest rates, timing of the Company’s maiden resource estimate, favourable operating conditions, political stability, obtaining government approvals and financing on time, obtaining renewals for existing licenses and permits and obtaining required licenses and permits, labour stability, stability in market conditions, availability of equipment, availability of drill rigs, and anticipated costs and expenditures. The Company cautions that all forward-looking statements are inherently uncertain, and that actual performance may be affected by a number of material factors, many of which are beyond the Company’s control. Such factors include, among other things: risks and uncertainties relating to West Point Gold’s ability to complete any payments or expenditures required under the Company’s various option agreements for its projects; and other risks and uncertainties relating to the actual results of current exploration activities, the uncertainties related to resources estimates; the uncertainty of estimates and projections in relation to production, costs and expenses; risks relating to grade and continuity of mineral deposits; the uncertainties involved in interpreting drill results and other exploration data; the potential for delays in exploration or development activities; uncertainty related to the geology, grade and continuity of mineral deposits; the possibility that future exploration, development or mining results may vary from those expected; statements about expected results of operations, royalties, cash flows, financial position may not be consistent with the Company’s expectations due to accidents, equipment breakdowns, title and permitting matters, labour disputes or other unanticipated difficulties with or interruptions in operations, fluctuating metal prices, unanticipated costs and expenses, uncertainties relating to the availability and costs of financing needed in the future and regulatory restrictions, including environmental regulatory restrictions. The possibility that future exploration, development or mining results will not be consistent with adjacent properties and the Company’s expectations; operational risks and hazards inherent with the business of mining (including environmental accidents and hazards, industrial accidents, equipment breakdown, unusual or unexpected geological or structural formations, cave-ins, flooding and severe weather); metal price fluctuations; environmental and regulatory requirements; availability of permits, failure to convert estimated mineral resources to reserves; the inability to complete a feasibility study which recommends a production decision; the preliminary nature of metallurgical test results; fluctuating gold prices; possibility of equipment breakdowns and delays, exploration cost overruns, availability of capital and financing, general economic, political risks, market or business conditions, regulatory changes, timeliness of government or regulatory approvals and other risks involved in the mineral exploration and development industry, and those risks set out in the filings on SEDAR+ made by the Company with securities regulators. Although the Company believes that the assumptions and factors used in preparing the forward-looking information in this corporate press release are reasonable, undue reliance should not be placed on such information, which only applies as of the date of this news release, and no assurance can be given that such events will occur in the disclosed time frames or at all. The Company expressly disclaims any intention or obligation to update or revise any forward-looking statements whether as a result of new information, future events or otherwise, other than as required by applicable securities legislation.
Neither the TSX Venture Exchange nor its Regulation Services Provider (as that term is defined in the policies of the TSX Venture Exchange) accepts responsibility for the adequacy or accuracy of this release.
Outstanding Apollo Silver Warrants Expire in July 2026
VANCOUVER, British Columbia, Dec. 18, 2025 (GLOBE NEWSWIRE) — Apollo Silver Corp. (“Apollo Silver” or the “Company”) (TSX.V:APGO, OTCQB:APGOF, Frankfurt:6ZF) is pleased to announce that, through its wholly owned subsidiary, Stronghold Silver USA Corp., the Company has completed all payments required under the Option to Purchase Agreement dated December 21, 2020, as amended January 21, 2023 (the “Athena Agreement”), with Athena Minerals Inc. (the “Optionor”). As a result, the Company now owns 100% interest in thirty-six (36) unpatented lode mining claims comprising part of the Langtry Property, which forms part of the Calico Silver Project, in San Bernardino County, California (the “Athena Claims”).
Under the terms of the Athena Agreement, the Company had the right to acquire the Athena Claims for an aggregate purchase price of US$1,000,000, payable on or before December 21, 2025. An initial payment of US$15,000 was paid upon execution of the Athena Agreement in December 2020, followed by annual payments of US$25,000 on each anniversary date. Between 2021 and 2024, the Company made the required annual payments. In accordance with the Athena Agreement, payments made within the twenty-four months preceding option exercise were credited against the purchase price, resulting in a final cash payment of US$950,000 to vest 100% ownership of the Athena Claims.
Pursuant to the Athena Agreement, the Company has granted Athena a 1% net smelter return (“NSR”) royalty on future mineral production from the Athena Claims. The NSR applies only to those claims that do not already carry an existing royalty of 1% or greater, and in all cases the total royalty burden on any claim will not exceed 2%. The acquisition of the Athena Claims consolidates Apollo Silver’s land position at the Calico Silver Project (“Calico Project”) and represents a significant milestone in advancing the Company’s silver and critical minerals strategy in the region (see Figure 1).
About Calico Silver Project
The Calico Project is one of the largest primary undeveloped silver projects in the United States. With silver designated as a U.S. critical mineral and continued strong industrial demand highlighting the importance of secure domestic supply, large scale U.S. silver assets may become increasingly strategic. The Calico Project Mineral Resource Estimate (“MRE”) comprises an Measured and Indicated Resource of 125 Moz Ag in 55 Mt at an average grade of 71 g/t Ag the Measured and Indicated categories and 58 Moz Ag in 25 Mt at a grade of 71 g/t Ag in the Inferred category (see Apollo Silver news releases dated September 4, 2025, and October 16, 2025).
Qualified Person
The scientific and technical data contained in this news release was reviewed and approved by Isabelle Lépine, M.Sc., P.Geo., Apollo’s Director, Mineral Resources. Ms. Lépine is a registered professional geologist in British Columbia and a QP as defined by NI 43-101 and is not independent of the Company.
Figure 1: Athena Claims
Athena Claims
Outstanding Warrants
As of December 18, 2025, the Company had 34,903,440 outstanding share purchase warrants (the “Warrants”), with five (5) Warrants exercisable into one (1) common share of the Company, in accordance with their terms, at an exercise price of $3.95 per share and expiring July 8, 2026. Investors requiring further information regarding the exercise of their Warrants should contact: (i) if the Warrants are held through a brokerage account or other nominee, such broker or nominee; and (ii) if the Warrants are held directly in registered form, the Warrant agent, Endeavor Trust Corporation, by email at admin@endeavortrust.com and following the instructions set forth in the applicable Warrant certificate. Warrant holders should also consult their financial and tax advisors regarding the financial and tax implications applicable to them prior to exercising Warrants.
About Apollo Silver Corp.
Apollo is advancing one of the largest undeveloped primary silver projects in the US. The Calico Project hosts a large, bulk minable silver deposit with significant barite and zinc credits – recognized as critical minerals essential to the US energy and medical sectors. The Company also holds an option on the Cinco de Mayo Project in Chihuahua, Mexico, which is host to a major carbonate replacement (CRD) deposit that is both high-grade and large tonnage. Led by an experienced and award-winning management team, Apollo is well positioned to advance the assets and deliver value through exploration and development.
Neither the TSX Venture Exchange nor its Regulation Services Provider (as that term is defined in the policies of the TSX Venture Exchange) accepts responsibility for the adequacy or accuracy of this release.
Cautionary Statement Regarding “Forward-Looking” Information
This news release includes “forward-looking statements” and “forward-looking information” within the meaning of Canadian securities legislation. All statements included in this news release, other than statements of historical fact, are forward-looking statements including, without limitation, statements with respect to the Company’s strategic objectives, the consolidation and advancement of its land position at the Langtry Property, and the exploration and development potential at the Calico Project. Forward-looking statements include predictions, projections and forecasts and are often, but notalways,identifiedbytheuseofwordssuchas“anticipate”,“believe”,“plan”,“estimate”,“expect”,“potential”,“target”, “budget” and “intend” and statements that an event or result “may”, “will”, “should”, “could” or “might” occur or be achieved and other similar expressions and includes the negatives thereof.
Forward-looking statements are based onthe reasonable assumptions,estimates, analysis, and opinions of the management of the Company made in light of its experience and its perception of trends, current conditions and expected developments, as well as other factors that management of the Company believes to be relevant and reasonable in the circumstances at the date that such statements are made.Forward-looking information is based on reasonable assumptions that have been made by the Company as at the date of such information and is subject to known and unknown risks, uncertainties and other factors that may have caused actual results, level of activity, performance or achievements of the Company to be materially different from those expressed or implied by such forward-looking information, includingbutnot limited to: risks associated with mineral exploration and development; metal and mineral prices; availability of capital; accuracy of the Company’s projections and estimates; realization of mineral resource estimates, interest and exchange rates; competition; stock price fluctuations; availability of drilling equipment and access; actual results of current exploration activities; government regulation; political or economic developments; environmental risks; insurance risks; capital expenditures; operating or technical difficulties in connection with development activities; personnel relations; and changes in Project parametersasplanscontinuetoberefined. Forward-looking statements are based on assumptions management believes to be reasonable, includingbutnotlimitedtothepriceofsilver,goldandbarite;thedemandforsilver,goldandbarite;theability tocarry on exploration and development activities; the timely receipt of any required approvals; the ability to obtain qualified personnel, equipment and services in a timely and cost-efficient manner; the ability to operate in a safe, efficient and effective matter; and the regulatory framework regarding environmental matters, and such other assumptions and factors as set out herein. Although the Company has attempted to identify important factors that could cause actual results to differ materially from those contained in forward-looking information, there may be other factors that cause resultsnottobeasanticipated,estimatedorintended.Therecanbenoassurancethatforward-lookingstatementswill prove to be accurate and actual results, and future events could differ materially from those anticipated in such statements. Accordingly, readers should not place undue reliance on forward looking information contained herein, exceptinaccordancewithapplicablesecuritieslaws.Theforward-lookinginformationcontainedhereinispresentedfor thepurposeofassistinginvestorsinunderstandingtheCompany’sexpectedfinancialandoperationalperformanceand theCompany’splansandobjectivesandmaynotbeappropriateforotherpurposes.TheCompanydoesnotundertake to update any forward-looking information, except in accordance with applicable securities laws.
VANCOUVER, British Columbia, Dec. 15, 2025 (GLOBE NEWSWIRE) — Apollo Silver Corp. (“Apollo” or the “Company”) (TSX.V:APGO, OTCQB:APGOF, Frankfurt:6ZF) is pleased to provide an update on ongoing community engagement activities at its Cinco de Mayo Project (“Cinco de Mayo” or the “Project”) in Chihuahua, Mexico.
Over several months, the Company held productive discussions with elected representatives of the Ejido Benito Juárez (the “Ejido”), Municipio de Buenaventura, and other leaders and community groups in the region. The objective of these discussions was to regain public support for mineral exploration and mine development at Cinco de Mayo, and more specifically, to rescind the property access ban imposed by the Ejido in November 2012 and to establish a long-term access agreement. This agreement is anticipated to provide important economic and community benefits to the Ejido, including annual payments, environmental value, and preferential employment and service opportunities, in exchange for unrestricted access for the Company to explore, develop and potentially mine the resources at Cinco de Mayo.
As part of Apollo’s efforts to introduce a plan of responsible development in cooperation and partnership with the local communities, informational materials are being distributed to members of the Ejido, outlining a plan of long-term collaboration and shared benefits associated with continued exploration and future operations at the Project. This phase of community engagement is expected to continue early into the new year, whereupon the Company remains hopeful for, and looks forward to, a general assembly of the Ejido in early 2026 to vote on rescinding the property access ban and approving a long-term access agreement.
Overview of Key Topics Presented to the Ejido
Long-Term Benefit Framework
The draft framework under discussion includes the following high-level concepts:
A 30-year structure of benefits to the Ejido in return for access to the Project during the exploration, development and mining phases over that time period.
Predictable annual payments made directly to the community to support priorities identified by the Ejido and its members, such payments amounting to approximately US$50 million over the life of the agreement.
An option to extend the term of the agreement for an additional period of time.
Employment, Training, and Local Procurement
The materials emphasize the Company’s commitment to maximizing local participation:
Hiring of Ejidatarios (registered members of the Ejido community), their descendants, and community members, based on skills and aptitude.
Preference for local suppliers of food, fuel, transportation, materials, and lodging.
These initiatives are intended to help build sustainable economic opportunities for the region.
Environmental Protection and Water Stewardship
Environmental responsibility remains central to all Project planning. Commitments communicated to the Ejido include:
Detailed hydrogeological studies to ensure exploration and potential future mining activities have no effect on community wells or natural springs.
Continuous monitoring of water quality and environmental indicators.
Strict adherence to all federal regulations, including requirements set by SEMARNAT, CONAGUA, and PROFEPA.
Implementation of reforestation programs, responsible materials management, and full reclamation of land at the end of the Project’s life cycle.
These commitments apply at every stage of work, from exploration through to eventual operations and closure.
“With a renewed interest in responsible mineral exploration and mine development being promoted at all levels of Mexican government, there is no better time to bring a strong plan of shared economic benefit to the communities around Cinco de Mayo,” stated Ross McElroy, President and CEO. “As one of North America’s better CRD deposits, with a well established history, Cinco de Mayo holds great opportunity for all.”
About Cinco de Mayo
Cinco de Mayo is an approximate 25,000 hectare property located in the north central part of Chihuahua State, Mexico, approximately 190 kilometres northwest of the state capital of Chihuahua City in the Municipio de Buenaventura. The Project is prospective for and hosts carbonate replacement type deposits including the Upper Manto Pb-Zn-Ag (Au) deposit, which consists of two parallel and overlapping manto deposits referred to as the Jose Manto and the Bridge Zone. An independent technical report and Mineral Resource estimate (“MRE”) on the Upper Manto deposit was prepared in 2012 by Rosco Postle and Associates (“RPA”). At a NSR cut-off of US$100/t, Inferred MRE was estimated to total 12.45 million tonnes at 132 grams per tonne silver, 2.86 per cent lead and 6.47 per cent zinc and 0.24 gram per tonne gold (See Apollo’s news release dated March 7, 2025). The total contained metals in the historical resource were 52.7 million ounces of silver, 785 million pounds of lead, 1,777 million pounds of zinc and 96,000 ounces of gold. See cautionary statement below.
A potential new discovery, called the Pegaso Zone was not included in the 2012 Historical MRE. Apollo’s technical team considers this intersection as a high priority target that has potential to be a significant new discovery. The Company’s initial review of historical data suggests that the Pegaso Zone could indicate a larger and higher-grade resource at depth.
Qualified Person
The scientific and technical data contained in this news release was reviewed and approved by Isabelle Lépine, M.Sc., P.Geo., Apollo’s Director, Mineral Resources. Ms. Lépine is a registered professional geologist in British Columbia and a QP as defined by NI 43-101 and is not an independent of the Company
About Apollo Silver Corp.
Apollo is advancing one of the largest undeveloped primary silver projects in the US. The Calico project hosts a large, bulk minable silver deposit with significant barite and zinc credits – recognized as critical minerals essential to the US energy and medical sectors. The Company also holds an option on the Cinco de Mayo Project in Chihuahua, Mexico, which is host to a major carbonate replacement (CRD) deposit that is both high-grade and large tonnage. Led by an experienced and award-winning management team, Apollo is well positioned to advance the assets and deliver value through exploration and development.
Neither the TSX Venture Exchange nor its Regulation Services Provider (as that term is defined in the policies of the TSX Venture Exchange) accepts responsibility for the adequacy or accuracy of this release.
Cautionary Statement Regarding Historical Mineral Resource Estimates
This 2012 historical MRE referenced above is considered historical in nature and the reader is cautioned not to treat this estimate as current Mineral Resources, nor should they be relied upon. They are included here as an indication of the mineralization of the Project. A qualified person has not done sufficient work to classify the historical estimate as a current mineral resource and the Company is not treating the historical estimate as a current mineral resource.
Cautionary Statement Regarding “Forward-Looking” Information
This news release includes “forward-looking statements” and “forward-looking information” within the meaning of Canadian securities legislation. All statements included in this news release, other than statements of historical fact, are forward-looking statements including, without limitation, statements with respect to the rescission of the 2012 access ban; the negotiation terms, value and potential execution of an access agreement with the Ejido; the timing, nature, and results of exploration and development activities at Cinco de Mayo; the exploration potential of the Project, including the potential discovery and significance of the Pegaso Zone; interpretations of historical data; the potential size, grade, continuity, and extent of mineralization, including at depth; potential future mining operations; the expected economic and social benefits to the Ejido and surrounding communities; and the Company’s future plans, strategies, and objectives. Forward-looking statements include predictions, projections and forecasts and are often, but notalways,identifiedbytheuseofwordssuchas“anticipate”,“believe”,“plan”,“estimate”,“expect”,“potential”,“target”, “budget” and “intend” and statements that an event or result “may”, “will”, “should”, “could” or “might” occur or be achieved and other similar expressions and includes the negatives thereof.
Forward-looking statements are based onthe reasonable assumptions,estimates, analysis, and opinions of the management of the Company made in light of its experience and its perception of trends, current conditions and expected developments, as well as other factors that management of the Company believes to be relevant and reasonable in the circumstances at the date that such statements are made.Forward-looking information is based on reasonable assumptions that have been made by the Company as at the date of such information and is subject to known and unknown risks, uncertainties and other factors that may have caused actual results, level of activity, performance or achievements of the Company to be materially different from those expressed or implied by such forward-looking information, includingbutnot limited to: risks associated with mineral exploration and development; metal and mineral prices; availability of capital; accuracy of the Company’s projections and estimates; realization of mineral resource estimates, interest and exchange rates; competition; stock price fluctuations; availability of drilling equipment and access; actual results of current exploration activities; government regulation; political or economic developments; environmental risks; insurance risks; capital expenditures; operating or technical difficulties in connection with development activities; personnel relations; and changes in Project parametersasplanscontinuetoberefined. Forward-looking statements are based on assumptions management believes to be reasonable, includingbutnotlimitedtothepriceofsilver,goldandbarite;thedemandforsilver,goldandbarite;theability tocarry on exploration and development activities; the timely receipt of any required approvals; the ability to obtain qualified personnel, equipment and services in a timely and cost-efficient manner; the ability to operate in a safe, efficient and effective matter; and the regulatory framework regarding environmental matters, and such other assumptions and factors as set out herein. Although the Company has attempted to identify important factors that could cause actual results to differ materially from those contained in forward-looking information, there may be other factors that cause resultsnottobeasanticipated,estimatedorintended.Therecanbenoassurancethatforward-lookingstatementswill prove to be accurate and actual results, and future events could differ materially from those anticipated in such statements. Accordingly, readers should not place undue reliance on forward looking information contained herein, exceptinaccordancewithapplicablesecuritieslaws.Theforward-lookinginformationcontainedhereinispresentedfor thepurposeofassistinginvestorsinunderstandingtheCompany’sexpectedfinancialandoperationalperformanceand theCompany’splansandobjectivesandmaynotbeappropriateforotherpurposes.TheCompanydoesnotundertake to update any forward-looking information, except in accordance with applicable securities laws.
Advancing one of the largest undeveloped primary silver assets in the U.S. in a rising silver and critical minerals market.
Vancouver, British Columbia, December 11, 2025 – Apollo Silver Corp. (“Apollo Silver” or the “Company”) (TSX.V:APGO; OTCQB:APGOF; Frankfurt:6ZF) is pleased to announce details of its 2026 Exploration and Project Development Program (the “2026 Program”) at the Company’s Calico Silver Project (“Calico” or the “Project”) located in San Bernardino County, California. The 2026 Program is designed to advance both the exploration potential and project development initiatives at Calico at a time when the silver market sentiment is strengthening and the metal’s recent designation as a U.S. critical mineral is drawing renewed attention to secure domestic supply. As one of the largest undeveloped primary silver assets in the U.S., Calico is well positioned within this evolving landscape.
The 2026 Program advances prospective exploration and project development at Calico in support of longer-term planning for processing, mine design, and permitting. Project development activities will focus on metallurgical studies, geotechnical work, and the initiation of development-stage permitting, and will include a drilling program designed to provide material for geotechnical analysis and metallurgical testing. Planned exploration activities include exploration drilling, property-scale mapping and sampling, and both airborne and ground geophysical surveys.
Highlights of the 2026 Program:
Project Development Activities
4,500 meter (“m”) HQ large diameter core drill program commencing in Q1 2026 to address current on-going metallurgical studies and geotechnical analysis to support future mine design work.
A metallurgical test work program focused on evaluating processing options and investigating opportunities to improve upon historic silver recoveries.
Early-stage permitting activities, including the initiation of long term, on-going baseline environmental monitoring, ensuring that the regulatory phase progress aligns with technical advancements.
Exploration Activities
1,000 m NQ diameter exploration drilling program at the Waterloo Property (“Waterloo”) to test the Burcham gold potential with the goal of expanding the gold resource.
Ground and airborne geophysical surveys including gravity, Induced Polarization (“IP”), and magnetics to image and characterize subsurface controls of mineralization as well as lithological, structural and alteration features at both a deposit and property scale, to assist in defining and prioritizing future drill targets.
Expanded geological mapping across Waterloo and Mule Property (“Mule”) to advance surficial geological interpretations and promote target generation.
“Our 2026 Program positions Apollo Silver to advance Calico at an opportune moment,” said Ross McElroy, President and CEO of Apollo Silver. “Silver’s addition to the U.S. critical minerals list and the current strength in precious-metal markets highlight the importance of responsibly developing domestic supply. Calico hosts one of the largest undeveloped primary silver deposits in the United States. The exploration program will allow us to evaluate the blue-sky potential of the Project, while the planned metallurgical, geotechnical, and geophysical work will further strengthen our technical understanding and support the next stages of its advancement.”
2026 Project Development Program
The 2026 project development program at Waterloo includes a 4,500 m HQ diameter core drill program aimed at obtaining sufficient material and data for on-going geotechnical and metallurgical analysis, and the initiation of development level permitting activities. The permitting activities will begin in 2026 and will form the foundational start of a long-term permitting process, which is designed to keep the regulatory progress aligned with technical advancement.
A 4,500 m HQ diameter core drilling program is scheduled to begin in mid-Q1 and continue through Q2 2026. Drill core will be used for:
Geotechnical data collection for analysis to support engineering and mine design; and
Metallurgical test work to better characterize the silver recovery and evaluate opportunities for recovery enhancement.
Metallurgical Studies
Metallurgical test work will continue throughout 2026 and will focus on:
Evaluating ore characteristics and processing options; and
Assessing opportunities to improve silver recoveries above historical levels identified, presently estimated at ~65%.
Underground Volume Survey
Calico is host to numerous historic small-scale, high-grade vein hosted mining operations that were active from ~1880 to 1894, some in close proximity to the Waterloo and Langtry deposits. A LiDAR survey of historical underground drifts and tunnels at Waterloo is planned for Q4 2026 to enhance the knowledge of precise location and scale of historic workings with respect to the current day deposits. This information should provide important data to assist with improved resource classification, as well as provide critical information for future mine development.
2026 Exploration Program
The 2026 exploration program at Calico includes core drilling, geological mapping, ground gravity and IP surveys, and airborne magnetics geophysical surveys, all designed to map geological features and interpret controls of mineralization at both a deposit and property scale across the Waterloo and Mule properties. Results will be used to assist in generating future drill targets.
Exploration Drilling
The Company plans to complete 1,000 m of NQ diameter core drilling to test the Burcham gold target located on the east side of Waterloo, in the area of the historical Burcham Mine. The work is scheduled for Q1–Q2 2026 and is designed to evaluate the potential for expansion of the existing gold resource.
Geological Mapping
Geological mapping will continue throughout 2026, and work will include:
Updating surficial geological interpretations at both Waterloo and Mule;
Follow-up ground assessment of anomalies identified from the 2022 IP geophysical survey on Waterloo; and
Ongoing support for exploration targeting and drill planning.
Geophysics
A multi-method geophysical program is planned for Q1, Q2 and Q4 2026. Surveys will include both airborne and ground surveys which will assist to resolve the subsurface interpretations and potentially help define and prioritize targets for future drilling. Activities will include:
Ground Gravity and Subsurface Historical Mine Workings surveys at Waterloo;
IP and airborne magnetic surveys at Waterloo and Mule; and
Integration and interpretation of new and historic geophysical datasets (Gravity, IP, Magnetics).
Laboratory Analysis
Petrographic studies and soil/rock assays will run through Q1 to Q3 2026 which will support geological mapping and aid in drill target refinement.
Qualified Person
The scientific and technical data contained in this news release was reviewed and approved by Isabelle Lépine, M.Sc., P.Geo., Apollo Silver’s Director, Mineral Resources. Ms. Lépine is a registered professional geologist in British Columbia and a QP as defined by NI 43-101 and is not independent of the Company.
About Apollo Silver Corp.
Apollo Silver is advancing one of the largest undeveloped primary silver projects in the US. The Calico project hosts a large, bulk minable silver deposit with significant barite and zinc credits – recognized as critical minerals essential to the US energy and medical sectors. The Company also holds an option on the Cinco de Mayo Project in Chihuahua, Mexico, which is host to a major carbonate replacement (CRD) deposit that is both high-grade and large tonnage. Led by an experienced and award-winning management team, Apollo is well positioned to advance the assets and deliver value through exploration and development.
Neither the TSX Venture Exchange nor its Regulation Services Provider (as that term is defined in the policies of the TSX Venture Exchange) accepts responsibility for the adequacy or accuracy of this release.
Cautionary Statement Regarding “Forward-Looking” Information
This news release includes “forward-looking statements” and “forward-looking information” within the meaning of Canadian securities legislation. All statements included in this news release, other than statements of historical fact, are forward-looking statements including, without limitation, statements regarding the scope, timing, and expected results of the 2026 exploration and project development program; planned drilling, mapping, sampling, geophysical surveys, metallurgical test work, geotechnical studies, and permitting activities; potential improvements to silver recoveries; the potential to expand the gold resource at Waterloo; and the anticipated benefits of the planned work programs. Forward-looking statements include predictions, projections and forecasts and are often, but not always, identified by the use of words such as “anticipate”, “believe”, “plan”, “estimate”, “expect”, “potential”, “target”, “budget” and “intend” and statements that an event or result “may”, “will”, “should”, “could” or “might” occur or be achieved and other similar expressions and includes the negatives thereof.
Forward-looking statements are based on the reasonable assumptions, estimates, analysis, and opinions of the management of the Company made in light of its experience and its perception of trends, current conditions and expected developments, as well as other factors that management of the Company believes to be relevant and reasonable in the circumstances at the date that such statements are made. Forward-looking information is based on reasonable assumptions that have been made by the Company as at the date of such information and is subject to known and unknown risks, uncertainties and other factors that may have caused actual results, level of activity, performance or achievements of the Company to be materially different from those expressed or implied by such forward-looking information, including but not limited to: risks associated with mineral exploration and development; metal and mineral prices; availability of capital; accuracy of the Company’s projections and estimates; realization of mineral resource estimates, interest and exchange rates; competition; stock price fluctuations; availability of drilling equipment and access; actual results of current exploration activities; government regulation; political or economic developments; environmental risks; insurance risks; capital expenditures; operating or technical difficulties in connection with development activities; personnel relations; and changes in Project parameters as plans continue to be refined. Forward-looking statements are based on assumptions management believes to be reasonable, including but not limited to the price of silver, gold and barite; the demand for silver, gold and barite; the ability to carry on exploration and development activities; the timely receipt of any required approvals; the ability to obtain qualified personnel, equipment and services in a timely and cost-efficient manner; the ability to operate in a safe, efficient and effective matter; and the regulatory framework regarding environmental matters, and such other assumptions and factors as set out herein. Although the Company has attempted to identify important factors that could cause actual results to differ materially from those contained in forward-looking information, there may be other factors that cause results not to be as anticipated, estimated or intended. There can be no assurance that forward-looking statements will prove to be accurate and actual results, and future events could differ materially from those anticipated in such statements. Accordingly, readers should not place undue reliance on forward looking information contained herein, except in accordance with applicable securities laws. The forward-looking information contained herein is presented for the purpose of assisting investors in understanding the Company’s expected financial and operational performance and the Company’s plans and objectives and may not be appropriate for other purposes. The Company does not undertake to update any forward-looking information, except in accordance with applicable securities laws.
Central Banks Now Hold More Gold Than U.S. Treasuries
This was originally posted on our Voronoi app. Download the app for free on iOS or Android and discover incredible data-driven charts from a variety of trusted sources.
Key Takeaways
For the first time since 1996, foreign central banks’ gold reserves have overtaken their U.S. Treasury holdings.
Persistent gold buying and rising U.S. debt risks are reshaping reserve composition toward hard assets.
Central banks have crossed a symbolic line: their combined gold reserves now exceed their U.S. Treasury holdings for the first time in nearly three decades.
The crossover underscores a gradual diversification away from dollar-denominated securities and toward hard assets.
This visualization tracks how these shares have evolved from the 1970s to today. The data comes from Crescat Capital macro strategist Tavi Costa.
From Petrodollars to De-Dollarization
After the end of Bretton Woods, soaring real interest rates and the rise of the petrodollar steered reserve managers toward U.S. Treasuries through the 1980s and 1990s.
In the 2000s, the dollar’s depth and liquidity reinforced that preference. Since 2022, however, heavy official gold buying has picked up again — 1,136 tonnes in 2022, a record — with 2023 and 2024 maintaining historically strong accumulation. The trend is even more striking considering that nearly one-fifth of all the gold ever mined is now held by central banks.
Date
Foreign Central Banks’ Gold Holdings As a % International Reserves
Foreign Central Banks’ U.S. Treasuries Holdings As a % International Reserves
1/30/1970
48%
13%
1/29/1971
43%
23%
1/31/1972
36%
32%
1/31/1973
39%
31%
1/31/1974
50%
17%
1/31/1975
50%
15%
1/30/1976
44%
18%
1/31/1977
41%
20%
1/31/1978
41%
23%
1/31/1979
44%
18%
6/30/2025
24%
23%
‹12345…34›
As political uncertainty and geopolitical risks continue to fuel safe-haven demand, this purchasing momentum has also lifted prices: gold surpassed $4,000 an ounce for the first time ever in October 2025.
Why “More Gold than Treasuries” Matters
Crossing above Treasuries signals that reserve managers are prioritizing durability, portability, and neutrality over yield.
According to the IMF, gold’s share of global reserves climbed to about 18% in 2024, up sharply from mid-2010s levels, reflecting a structural reweighting toward tangible assets.
Seen as an alternative to heavily indebted fiat currencies, especially the U.S. dollar, the share of gold in central bank reserves has increased most among emerging market economies. China, Russia, and Türkiye have been the largest official buyers over the past decade.
See visuals like this from many other data creators on our Voronoi app. Download it for free on iOS or Android and discover incredible data-driven charts from a variety of trusted sources.
Key Takeaways
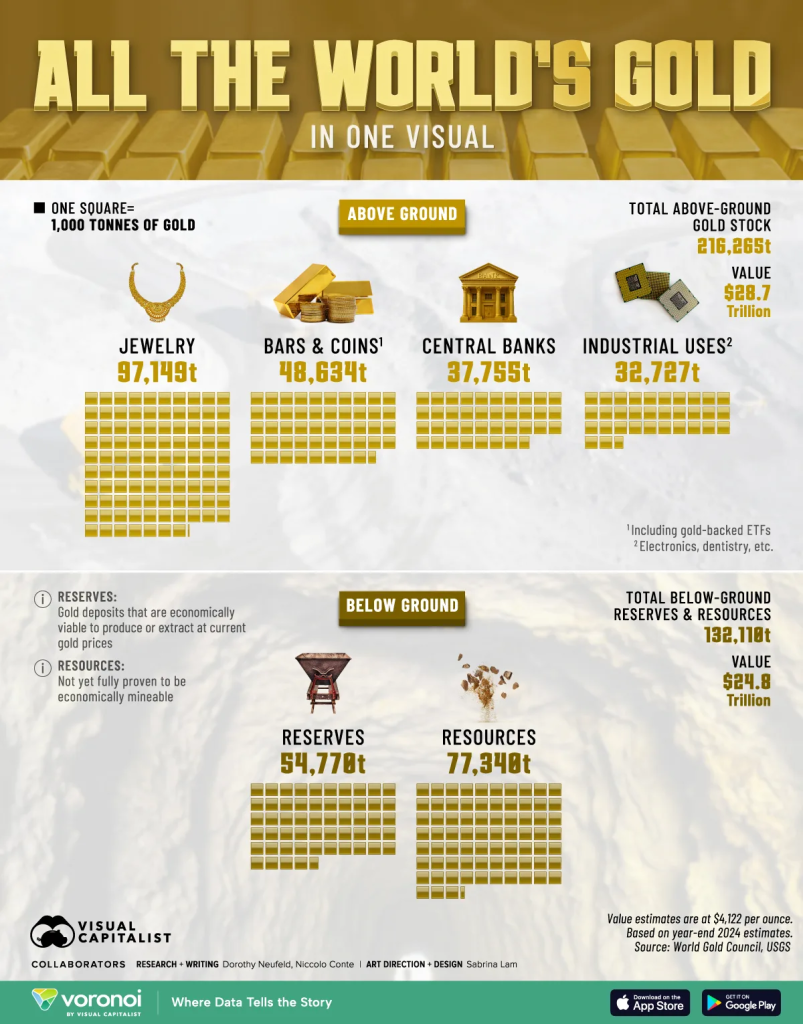
The total above-ground stock of gold stands at 216,265 tonnes, with the largest share found in jewelry.
Below-ground stock is estimated to be 132,110 tonnes as of year-end 2024.
Today, gold prices sit roughly 40% above their previous inflation-adjusted peak seen in 1980.
Despite tumbling 54% from the October 20th high of $4,380, gold remains at historically elevated levels, as investors rely on the metal as a reliable store of value. In total, the world’s above-ground gold stock would fit into a cube approximately 22.3 meters tall (73 feet).
This graphic shows the global supply of gold as of year-end 2024, based on data from the World Gold Council.
How Much Gold is in the World, by Category
Below, we show all the world’s gold, covering both above and below-ground stock:
Category
Tonnes of Gold (t)
Jewelry
97,149
Bars and coins (including gold backed ETFs)
48,634
Central banks
37,755
Industrial uses (electronics, dentistry, etc.)
32,727
Reserves
54,770
Resources
77,340
Jewelry is the largest category of above-ground gold, at 97,149 tonnes.
Last year, India was the largest buyer of gold jewelry globally, with 560 tonnes in purchases. China ranked second, with 510 tonnes. Across the region, gold is deeply intertwined with major life events such as weddings and cultural traditions.
Bars, coins, and gold-backed ETFs make up 48,634 tonnes of gold, exceeding central bank holdings (37,755 tonnes) by a substantial margin. Overall, the U.S., Germany, and Italy held the most gold in their central bank reserves as of year-end 2024.
Meanwhile, industrial uses such as electronics and dentistry make up 32,727 tonnes. Many semiconductor chips, for instance, use gold for coating or bonding wires thanks to its conductivity.