VANCOUVER, British Columbia, June 03, 2025 (GLOBE NEWSWIRE) — Fancamp Exploration Ltd. (“Fancamp” or the “Corporation”) (TSX Venture Exchange: FNC) announces that further to its news release dated May 9, 2025, the Corporation has completed its previously announced settlement (the “Settlement”) with a former director of the Corporation (the “Former Director”) to resolve the Litigation Proceedings (as defined herein) between the parties. The Settlement was completed in accordance with the terms of the settlement agreement entered into between the Corporation and the Former Director (the “Settlement Agreement”), pursuant to which, among other things, the Corporation has issued to the Former Director 1,428,572 common shares of the Corporation (the “Settlement Shares”) at a deemed price of $0.07 per Settlement Share (the “Shares for Debt Transaction”).
The Litigation Proceedings involved a statement of claim filed by the Former Director and his controlled entity (collectively, the “Plaintiffs”) in the Ontario Superior Court of Justice (the “Ontario Proceeding”) relating to liquidated damages and unpaid consulting fees claimed by the Plaintiffs from the Corporation in connection with the termination of the consulting agreement between the Corporation and an entity controlled by the Former Director. Fancamp also commenced a civil claim against the Former Director in the Supreme Court of British Columbia (the “BC Proceeding”, and together with the Ontario Proceeding, the “Litigation Proceedings”).
Pursuant to the terms of the Settlement Agreement, the Plaintiffs have agreed to discontinue the Ontario Proceeding against the Corporation, and the Corporation has agreed to discontinue the BC Proceeding against the Former Director. The Corporation has issued to the Former Director the Settlement Shares as partial consideration for the Settlement.
The issuance of the Settlement Shares pursuant to the Shares for Debt Transaction has received the approval of the TSX Venture Exchange. The Settlement Shares issued to the Former Director pursuant to the Settlement are subject to a statutory hold period expiring four months and one day from the date of issue.
About Fancamp Exploration Ltd. (TSX-V: FNC)
Fancamp is a Canadian mineral exploration company focused on creating value through medium term growth and monetization opportunities with strategic interests in high potential mineral projects, a royalty portfolio, and exploration properties. The Company is focused on an advanced asset play poised for growth and selective monetization with a portfolio of mineral claims across Ontario, Québec and New Brunswick, Canada; including copper, gold, zinc, titanium, chromium, strategic rare-earth metals and others. The Company has future monetization opportunities from its Koper Lake transaction in the highly sought-after Ring of Fire in Northern Ontario. Fancamp holds 96% interests in Magpie Mines Inc., which owns the Magpie property, one of the world’s largest undeveloped hard rock titanium (+V) deposits,per USGS data. Fancamp has investments in an existing iron ore operation in the Quebec-Labrador Trough, a rare earth elements company, NeoTerrex Minerals Inc., a copper–gold exploration company, Platinex Inc., an opportunity to develop an emerging gold-copper exploration play with Lode Gold Resources Inc. in addition to an investment in a near term cash flow generating zinc mine, EDM Resources Inc. in Nova Scotia. Fancamp is developing an energy reduction and titanium waste recycling technology with its advanced titanium extraction strategy. The Company is managed by a focused leadership team with decades of mining, exploration and complementary technology experience.
Further information on the Company can be found at: www.fancamp.ca
Neither TSX Venture Exchange nor its Regulation Services Provider (as that term is defined in policies ofthe TSX Venture Exchange) accepts responsibility for the adequacy or accuracy of this news release.
TULSA, OK / ACCESS Newswire / July 7, 2025 / Jericho Energy Ventures Inc. (TSXV:JEV)(OTCID:JROOF)(FRA:JLM) (“Jericho”, “JEV” or the “Company”) is pleased to announce it has signed a Memorandum of Understanding (MOU), dated July 6, 2025, with M2 Development Solutions (“M2”) to form a strategic partnership. This collaboration will integrate M2’s large, gigawatt-scale sites into Jericho’s growing AI data center portfolio.
This partnership significantly expands Jericho’s U.S. footprint beyond its Oklahoma asset base, incorporating M2’s high-capacity sites in Ohio and Nevada. The initial sites include:
Ohio – 400 Acres with access to Utility Power and on-site Natural Gas feed Power generation assets
Nevada – 3,700 Acres with access to Utility Power, on-site Geothermal power, on-site solar power, and on-site Natural Gas feed Power generation assets
Together, JEV and M2 are well-positioned to meet the rapidly increasing demand for scalable, high-performance infrastructure optimized for advanced artificial intelligence (AI) workloads across the United States.
“Our partnership with M2 is a transformative step in executing our AI data center strategy,” said Brian Williamson, CEO of Jericho Energy Ventures. “Integrating M2’s gigawatt-scale sites accelerates our ability to deliver scalable, energy-efficient infrastructure for modern AI workloads. With the proven leadership of COL (Ret.) Mark Schonberg and Mark Vogel, we are poised to meet the surging AI compute demand across key U.S. markets.”
About M2 Development Solutions, LLC
M2 is co-led by Col. (Ret.) Mark Schonberg and Mark Vogel, bringing extensive expertise to the partnership:
Col. (Ret.) Mark Schonberg is a 30-year U.S. Army veteran and a seasoned infrastructure leader. His deep expertise spans IT services, cybersecurity, and data center development. Throughout his military career, he held senior positions including Cyber Capabilities Development and Integration Director for the U.S. Army and CIO/G6 at Army Cyber Command. He also played a key role in the IT and C4I build-out for the $16 billion Yongsan Relocation Program in South Korea. Since retiring in 2020, Col. Schonberg has continued to lead in the private sector, focusing on data center infrastructure, renewable energy, and smart city solutions.
Mark Vogel is a seasoned real estate development leader with over 40 years of experience delivering transformative commercial, residential, and mixed-use projects, including the $400M Bowie Town Center (375-acre mixed-use, MD) and high-rise student housing near the University of Maryland in College Park. Known for his strategic vision and collaborative approach, he now leads cutting-edge data center developments to meet surging demand for high-performance digital infrastructure across the U.S. Drawing on deep expertise in land planning, community engagement, and infrastructure delivery, Mark drives sustainable, high-impact projects that reshape communities and power the digital economy. His philanthropic work includes founding the “Give a Dam” campaign in Burkina Faso through Africare, two years in the Peace Corps in Liberia, and leading the Greater Oxon Hill CDC to advance housing, health, and economic opportunity in communities in Maryland. He also spent over a decade fundraising for Mission of Love Charities, supporting food security, housing, mental health, and workforce development for vulnerable populations.
About Jericho Energy Ventures
Jericho Energy Ventures (JEV) is uniquely positioned at the nexus of energy and AI infrastructure. Leveraging our long-producing oil and gas joint venture assets and robust Oklahoma infrastructure, we are deploying scalable, on-site power solutions to build cutting-edge build-to-suit AI Data Centers. With direct access to abundant, low-cost natural gas, we deliver efficient, high-performance energy solutions — reducing waste, maximizing output, and unlocking long-term value in the rapidly converging AI and energy markets.
This news release contains certain “forward-looking information” and “forward-looking statements” (collectively, “forward-looking statements“) within the meaning of applicable securities laws. Such forward-looking statements are not representative of historical facts or information or current condition, but instead represent only Jericho’s beliefs regarding future events, plans or objectives, many of which, by their nature, are inherently uncertain and outside of Jericho’s control. Forward-looking statements are frequently characterized by words such as ”plan”, “expect”, “project”, “intend”, “believe”, “anticipate”, “estimate” and other similar words, or statements that certain events or conditions “may”, “will” or “may not” occur. Specifically, this news release contains forward-looking statements, including, but not limited to, statements regarding the successful implementation of the JEV-M2 MOU and the planned rollout of JEV’s AI Data Centers initiative.
Forward-looking statements are subject to a variety of risks and uncertainties and other factors that could cause actual events or results to differ materially from those anticipated in the forward-looking statements, which include, but are not limited to: regulatory changes; changes to the definition of, or interpretation of, foreign private issuer status; the impacts of COVID-19 and other infectious diseases; general economic conditions; industry conditions; current and future commodity prices and price volatility; significant and ongoing stock market volatility; currency and interest rate fluctuation; governmental regulation of the energy industry, including environmental regulation; geological, technical and drilling problems; unanticipated operating events; the availability of capital on acceptable terms; the need to obtain required approvals from regulatory authorities; liabilities and risks inherent in oil and gas exploration, development and production operations; liabilities and risks inherent in early stage hydrogen technology projects and new energy systems; changes in government environmental objectives or plans; and the other factors described in Jericho’s public filings available at www.sedarplus.ca.
The forward-looking statements contained herein are based on certain key expectations and assumptions of Jericho concerning anticipated financial performance, business prospects, strategies, regulatory regimes, the sufficiency of budgeted capital expenditures in carrying out planned activities, the ability to obtain financing on acceptable terms, expansion of consumer adoption of the Company’s (or its subsidiaries’) technologies and products, all of which are subject to change based on market conditions, potential timing delays and other risk factors. Although Jericho believes that these assumptions and the expectations are reasonable based on information currently available to management, such statements are not guarantees of future performance and actual results or developments may differ materially from those in the forward-looking statements. Investors should not place undue reliance on forward-looking statements.
Readers are cautioned that the foregoing lists are not exhaustive. The forward-looking statements contained in this news release are made as of the date of this news release, and Jericho does not undertake to update any forward-looking statements that are contained or referenced herein, except as required by applicable securities laws.
Neither the TSX Venture Exchange nor its Regulation Services Provider (as that term is defined in the policies of the TSX Venture Exchange) accepts responsibility for the adequacy or accuracy of this release.
VANCOUVER, BC, July 7, 2025 /CNW/ – Bravo Mining Corp. (TSXV: BRVO) (OTCQX: BRVMF), (“Bravo” or the “Company“) is pleased to announce results of an independent Preliminary Economic Assessment (“PEA” or the “Study“) on its 100% owned Luanga palladium + platinum + rhodium + gold + nickel deposit (“Luanga deposit” or “Luanga PGM+Au+Ni deposit“), located in the Carajás Mineral Province, Pará State, Brazil.
Highlights of Bravo’s 2025 PEA:
Preliminary Economic Analysis Highlights Luanga’s Potential for High Margins & Initial Low Capex
The PEA investigated two scenarios, a “Base Case” using flotation concentrate sales to a third-party refiner and an “Alternate Case” envisaging a vertically-integrated operation.
Base Case – Concentrate Sales
After-tax Net Present Value (“NPV“) of US$1,249 million, using an 8% discount rate.
After-tax Internal Rate of Return (“IRR“) of 49%.
Payback period post-tax of 2.4 years.
Initial Capex to NPV ratio: 0.40x.
Initial capital expenditures (“CAPEX“) of US$495.8 million and sustaining CAPEX of US$115.0 million.
Average life-of-mine (“LOM”) All in Sustaining Costs (“AISC“) of US$638/Oz PdEq1.
Alternate Case – Vertically Integrated Operation
After-tax NPV8% of US$1,861 million.
After-tax IRR of 49%.
Payback period post-tax of 2.4 years.
Initial Capex to NPV ratio: 0.36x.
Initial CAPEX of US$677.6 million and sustaining CAPEX of US$115.0 million.
Average LOM AISC of $697/oz PdEq1.
Metals price assumptions for both cases: Pd price of US$1,271/oz, Pt price of US$1,500/oz, Rh price of US$6,000/oz, Au price of US$3,251/oz, Ni price of US$8.00/lb.
Multi-Million-Ounce PGM+Au+Ni Resource with 17-year Potential Open-Pit Large-Scale extraction from one of the largest undeveloped shallow PGM deposits globally
PEA based on Measured & Indicated (“M&I“) Resources of 9.8 million ounces (“Moz“) of PdEq1 and Inferred Resources of 4.3 Moz of PdEq1. See “Luanga Project 2025 MRE” below for details by metal.
Average annual production of payable metals: 255,000 ounces (“Oz“) of Palladium (“Pd“), 158,000 Oz of Platinum (“Pt“), 15,000 Oz of Rhodium (“Rh“), 8,500 Oz of Gold (“Au“) and 8,549 tonnes of Nickel (“Ni“) per annum.
Supported by metallurgical tests, achieving the following recoveries:
Fresh rock: Pd of 77%, Pt of 81%, Rh of 52%, Au of 50%, and Ni of 62%
Average 3.7x Strip Ratio over Years 1 to 5 and 7x over LOM.
Strategic Geographical Advantage, Abundant Infrastructure and Granted Preliminary License (“LP”)
Luanga PEA benefits from excellent infrastructure to support project development and operation with access to low-cost hydropower, power lines, sealed roads, rail, water, skilled labour and industry service providers.
100% of the electrical energy consumed at Luanga would come from renewable, hydro-electric sources. This should result in a relatively low carbon footprint from the operations.
The most critical, challenging and time-consuming LP permit already secured by Bravo.
The Project scale and its diverse mix of critical commodities are well aligned with Brazil’s strategy to foster the sustainable supply of strategic minerals in the Country.
Luanga Project shortlisted by the Brazilian National Bank for Economic and Social Development (“BNDES“) and the Federal Agency for Funding Authority for Studies and Projects in Brazil (“FINEP“) as one of the critical metals projects to be considered for potential funding for project development through long-term credit, capital support, and innovation incentives.
“As we approach the third anniversary of our IPO, I’m delighted to mark the occasion with a key milestone: the delivery of a solid PEA for the Luanga Project. The high margin and low CAPEX to NPV ratio in the PEA is a testament to what can be achieved when careful drilling and strategic planning are applied to a richly endowed geological setting that is also exceptionally well-suited for mine development”, said Luis Azevedo, Chairman and CEO. “Further, our team has years of exploration experience coupled with a proven track record of mining permitting, building and operating in the Carajás. This wealth of experience positions us to continue to advance the Luanga Project.”
“Importantly, the preliminary economics outlined in the PEA suggest that Luanga – with its large-scale, long-life and open-pit production profile – should be well positioned to withstand commodity cycles and to capitalize on the improving fundamentals of the PGM markets like those we are now experiencing.
“In addition, Luanga’s scale and suite of commodities, all deemed critical to Brazil, mean that the Project could potentially benefit from the support of Brazil’s Government and associated agencies. We are therefore pleased that Luanga has been shortlisted by the BNDES/FINEP for potential access to funding made available for the in-country development of strategic minerals and sustainable materials. Potential access to such funding has enabled us to explore additional options that could enhance Luanga’s Base Case economics, such as vertical integration of the operations to produce the final products within Brazil.
“The PEA does not include any mineral inventory that exists below the pit generated in this preliminary assessment or take into account the exploration potential below the current MRE, along the 8.1km strike length of the deposit. These opportunities offer additional potential to expand the size and/or increase the life of the Project.
“In my opinion, these factors establish Luanga as one of the most compelling undeveloped PGM projects globally.
“Bravo’s multidisciplinary approach has been successful in demonstrating Luanga’s potential and illustrating how much more value there is yet to be unlocked, including our continued pursuit of copper-gold IOCG targets. All of this has been achieved while maintaining financial discipline and a strong treasury.
“At this milestone, I’d like to acknowledge the dedication of our team and thank our stakeholders and investors for their support over the three years since our IPO. I am looking forward to the next chapters of our journey”.
PEA Overview
Once filed (on SEDAR+), readers are encouraged to read the Company’s PEA Technical Report prepared in accordance with National Instrument 43-101 – Standards of Disclosure for Mineral Projects (“43-101”) in its entirety. The Technical Report contains all qualifications, assumptions and exclusions that relate to the PEA and Mineral Resource Estimate (“MRE”) upon which the PEA is based. The Technical Report is intended to be read as a whole, and sections should not be read or relied upon out of context. Further, the PEA represents a point in time estimate and is only a window into the long-term potential of the asset given the indications of continued mineralization at depth.
The Company retained GE21 Consultoria Mineral Ltda. as Bravo’s independent engineering consultants (with offices located in Belo Horizonte, Minas Gerais, Brazil), to prepare the PEA in accordance with NI 43-101.
The PEA is based on the most recent (2025) MRE for the Luanga Project (see later section: Luanga Project 2025 MRE and press release published on February 18, 2025).
Approximately 67% of mineralized material assumed to be processed in the PEA comes from mineral resources that are currently classified as Measured and Indicated. The PEA is preliminary in nature and includes inferred mineral resources (approximately 33% of total mineral resources) that are considered too speculative geologically to have the economic considerations applied to them that would enable them to be categorized as mineral reserves. It is uncertain but reasonably expected that further exploration would convert Inferred mineral resources to Indicated mineral resources. There is no certainty that the outcome of the PEA will be realized.
1Note on Palladium Equivalent – For grades by individual metals, see Table 11 under Luanga Project 2025 MRE section, where the footnotes also detail the basis of the Palladium Equivalent calculation.
The Luanga Deposit is assumed to be developed as a conventional open pit (“OP“) mining and milling operation, with on-site treatment of the mined mineralized material. The Base Case scenario considers processing through a conventional froth flotation plant with a nameplate processing capacity of 27,700 tonnes per day (“tpd“) or 10 million tonnes per annum (“Mtpa“) at full scale, producing a single saleable concentrate to be transported and sold to a third-party smelter. The Alternate Case (vertically-integrated) scenario considers the same Base Case scenario, but with the addition of onsite downstream processing to produce a highly concentrated metal matte for sale directly to a refinery to produce LME grade final metals, resulting in higher payabilities for the metals produced.
Table 1 presents the financial highlights from the PEA, over the LOM.
Luanga is characterized by consistent geological continuity, near-surface mineralization, and steeply dipping mineralised zones. The shape of the mineralisation makes it highly amenable to open-pit extraction.
The PEA contemplates conventional OP mining using a truck-and-shovel operation. Over the period under study (a preliminary estimate of a 17-year mine life), mineralized material would be sourced from three open cuts, following an initial pre-strip and stockpiling ahead of plant commissioning. The mining sequence would utilize 10-metre-high benches. Drilling, blasting, loading, and hauling are assumed to be performed by contractors.
The contemplated primary loading fleet includes 539-tonne hydraulic shovels with 29 m³ buckets and front-end wheel loaders with 19 m³ capacity buckets, paired with 246-tonne haul trucks. Additional fleet components, including 90-tonne and 45-tonne excavators, are envisaged for waste removal and mining of any narrower zones.
Maximum material movement is projected to peak at 103.6 Mtpa (approximately 284,000 tpd). Over the LOM, a total of 1,308 million tonnes should be extracted, including 165 million tonnes of mineralised material.
Waste rock would be placed in a designated storage facility. Tailings would be directed to a dry-stack storage near the plant, with capacity for LOM tailings impoundment. For the sake of simplicity and focus on value, the current PEA does not contemplate processing the Oxide component of the MRE. Oxide mineralisation will require additional plant design and expenditures and is considered best re-visited at a later date. In the interim and for this study, mineralized oxide material would be stockpiled. See the “Opportunities” section below.
Processing
The PEA assumes a process plant ramping up from 5.0 Mtpa of throughput capacity, or approximately 13,700 tpd, following construction and commissioning, to 10.0 Mtpa (27,400 tpd full capacity) within 24 months.
The contemplated traditional flotation plant is designed to produce a nickel–gold-platinum group metals (Ni-Au-PGM) concentrate containing palladium, platinum, rhodium, gold, and nickel. The flowsheet incorporates a conventional comminution circuit consisting of a semi-autogenous grinding (SAG) mill followed by a ball mill (SAB circuit).
Beneficiation of the mineral products would be undertaken by conventional froth flotation. The circuit is a conventional one, including rougher, scavenger, and cleaner flotation units. Based on average feed grades, the plant would be expected to achieve average metallurgical recoveries (into a flotation concentrate) of 77% for palladium, 81% for platinum, 52% for rhodium, 50% for gold, and 62% for nickel.
The circuit flowsheet would also include concentrate thickening, filtration as well as tailings thickening, filtration and dry stacking. The incorporation of dry stacking and water reclaim facilities demonstrates that Bravo is proposing to use best industry standards in plant design.
The vertically-integrated Alternate Case has also been investigated, whereby the final metal products are produced by Bravo locally rather than the flotation concentrate being exported to third party refineries.
This integrated scenario considers the possible treatment of flotation concentrates through conventional calcination/roasting for sulphur extraction, followed by a well established reductive pyrometallurgical process. Pre-removal of sulphur and sulphuric acid production would ensure compliance to local SO2 emissions standards and provide addition revenue stream through the sale of acid to locally based fertilizer producers, where there is high demand due to a reliance on imported acid to produce fertilizer. As part of the PEA, sulphuric acid generation volumes were calculated based on average expected concentrate quality. A sulphuric acid sales credit of $160/t of acid produced was assumed as part of the vertical integration scenario.
Figure 1: Process Plant Flow Sheet (CNW Group/Bravo Mining Corp.)
Mine Production Plan
The assumed LOM production is summarized in Table 2.
Units
Value
LOM Throughput
Peak Process Plant Throughput
tpd
27,700
Mt/year
10.1
Peak Mining Rate
tpd
283,900
Mt/year
103.6
Mine Production (LOM)
Total Mined
Mt
1,319
Total Waste Mined
Mt
1,153
Total Run-of-Mine (“ROM“) Mined
Mt
165
Strip Ratio
t/t (Waste/ROM)
7.0
Payable Metal (LOM)
Palladium
Thousands of ounces (“kOz“)
4,337
Platinum
kOz
2,689
Rhodium
kOz
254
Gold
kOz
145
Nickel
Tonnes
145,336
Table 2: Production Summary
The production schedule assumes a 17-year LOM, where Figures 2 and 3 illustrate the annual metal production by contained metal.
Figure 2: Annual Precious Metal Production – Contained Metal (CNW Group/Bravo Mining Corp.)
Figure 3: Annual Base Metal Production – Nickel Contained Metal (CNW Group/Bravo Mining Corp.)
Capital Costs
The estimated initial CAPEX for construction and ramp-up, together with expected sustaining capital and closure costs, are presented in Table 3 below. These estimates are to an AACE Class 4 estimate (-30%/+50%). The capital cost estimate includes a 20% contingency factored in each appropriate CAPEX item.
Concentrate Sales Scenario(Base Case)
Vertical Integration Scenario(Alternate Case)
CAPEX
Initial CAPEX
Sustaining
Total CAPEX
Initial CAPEX
Sustaining
Total CAPEX
Mining Preparation
4.1
4.2
8.3
4.1
4.2
8.3
Accesses
1.5
0.0
1.5
1.5
0.0
1.5
Equipment Mob/Demobilization
1.1
13.7
14.8
1.1
13.7
14.8
Pre Stripping
25.0
0.0
25.0
25.0
0.0
25.0
Waste Dump Preparation
5.0
4.8
9.8
5.0
4.8
9.8
Dry Stacking Facility
8.3
0.0
8.3
8.3
0.0
8.3
Ancillary Facilities
17.4
0.0
17.4
17.4
0.0
17.4
Construction site
2.0
0.0
2.0
2.0
0.0
2.0
Transmission Line and Electric Substation
17.3
0.0
17.3
17.3
0.0
17.3
Mine Closure
0.0
17.9
17.9
0.0
17.9
17.9
Concentration Plant
283.2
0.0
283.2
283.2
0.0
283.2
Plant Infrastructure
36.0
74.4
110.4
36.0
74.4
110.4
Pyrometallurgical Plant (Incl. Indirect Costs)
–
–
–
181.9
–
181.9
Indirect (EPCM, Consultants, etc.)
94.8
0.0
94.8
94.8
0.0
94.8
Total
495.8
115.0
610.8
677.6
115.0
792.6
Table 3: CAPEX Estimates
Operating Costs
The Luanga Project operating costs (“OPEX”) are presented in Table 4.
Description
Unit
OPEX
– Mine OPEX
US$/t processed
22.80
– Process OPEX
US$/t processed
12.12
– Freight
US$/t processed
0.94
– OPEX G&A
US$/t processed
5.00
Total OPEX:
US$/t processed
40.86
Table 4: OPEX Estimates
The average life-of-mine US$/t cost of material moved is $2.85. The vertical integrated model assumes an additional US$4.62 per tonne processed operating expenditure, offset materially by increased payabilities and credits from sulphuric acid.
Economic Analysis
The cash flow model was based on the assumed production schedule, associated metal grades, metallurgical recoveries and capital and operating costs outlined in this news release.
Table 5 shows the Luanga Project’s PEA highlights.
The payabilities applied to the Concentrate Sales Base Case economic model were benchmarked from publicly available data from various other mines selling PGM concentrates through a third-party refiner, inclusive of treatment charges. The economic analysis assumes all handling and logistics costs associated with shipping of concentrates to a Southern African smelter. Payabilities used in the PEA Base Case are detailed in Table 6. For the Alternate Case, sales prices are assumed at LME pricing.
Metal
Payability (%)
Pd
85
Pt
85
Rh
84
Au
84
Ni
72
Table 6: Base Case Payabilities by metal
Sensitivity Analysis
Sensitivity analysis considered variations to metal pricing, CAPEX, OPEX, and NPV Discount Rate for both the Base Case (Concentrate Sales) scenario and the Alternate Case (Vertical Integration) scenario.
Figures 4, 5, and Table 7 present the Sensitivity Analyses for the Luanga Project PEA.
Figure 4: Base Case (concentrate sales) Sensitivity Analysis (CNW Group/Bravo Mining Corp.)
Table 7: Base & Alternate Case Scenario Sensitivity Analysis of Discount Rate
The PEA is based on the Company’s MRE with an effective date of February 18, 2025. The effective date of the PEA is July 7, 2025. A NI 43-101 compliant technical report summarizing the results of the PEA will be filed on the Company’s website and under its SEDAR+ profile within 45 days of this news release.
Mine Production Schedule
Tables 8 and 9 below set out the projected LOM annual production schedules.
Year
ROM
Pd
Pt
Rh
Au
Ni
Waste*
Strip
TotalMoved
(Mt)
(g/t)
(g/t)
(g/t)
(g/t)
( %)
(Mt)
(t/t)
(Mt)
0
–
–
–
–
–
–
10.0
–
10.0
1
5.1
1.09
0.63
0.10
0.07
0.14
25.6
5.1
30.7
2
10.0
1.10
0.63
0.09
0.07
0.15
31.1
3.1
41.1
3
10.0
1.28
0.63
0.09
0.07
0.20
33.7
3.4
43.7
4
10.0
1.32
0.64
0.10
0.06
0.18
32.4
3.2
42.4
5
10.1
1.02
0.69
0.11
0.05
0.14
33.4
3.3
43.5
6
10.0
1.00
0.60
0.09
0.05
0.13
93.6
9.3
103.6
7
10.0
1.00
0.60
0.09
0.05
0.13
93.6
9.3
103.6
8
10.0
1.00
0.60
0.09
0.05
0.13
93.6
9.3
103.6
9
10.0
1.00
0.60
0.09
0.05
0.13
93.6
9.3
103.6
10
10.0
1.00
0.60
0.09
0.05
0.13
93.6
9.3
103.6
11
10.0
1.03
0.65
0.10
0.05
0.14
84.0
8.4
94.0
12
10.0
1.03
0.65
0.10
0.05
0.14
84.0
8.4
94.0
13
10.0
1.03
0.65
0.10
0.05
0.14
84.0
8.4
94.0
14
10.0
1.03
0.65
0.10
0.05
0.14
84.0
8.4
94.0
15
10.0
1.03
0.65
0.10
0.05
0.14
84.0
8.4
94.0
16
9.9
1.09
0.59
0.09
0.05
0.14
49.6
5.0
59.5
17
9.9
1.09
0.59
0.09
0.05
0.14
49.6
5.0
59.5
Total
165.3
1.06
0.63
0.09
0.06
0.14
1,153
7.0
1,319
Table 8: Mine Plan – Production Schedule.
Notes:Mining Recovery factor of 95%. Mining Dilution factor of 5%.Mine Plan cutoff grade of 0.87 g/t PdEq was applied.* ‘Waste’ Includes stockpiled oxide and sulphide mineralized material
Year
ROM
Pd
Pt
Rh
Au
Ni
(Mt)
(kOz)
(kOz)
(kOz)
(kOz)
(kt)
0
–
–
–
–
–
–
1
5.1
178
103
17
11
7
2
10.0
352
202
30
24
15
3
10.0
412
204
30
22
20
4
10.0
424
207
32
19
18
5
10.1
332
224
35
16
14
6
10.0
321
194
28
16
13
7
10.0
321
194
28
16
13
8
10.0
321
194
28
16
13
9
10.0
321
194
28
16
13
10
10.0
321
194
28
16
13
11
10.0
331
208
31
17
14
12
10.0
331
208
31
17
14
13
10.0
331
208
31
17
14
14
10.0
331
208
31
17
14
15
10.0
331
208
31
17
14
16
9.9
347
189
28
17
14
17
9.9
347
189
28
17
14
Total
165.3
5,652
3,328
491
293
237
Table 9: Production Schedule by Metal.
Metallurgy Recoveries
Metallurgical recoveries used in the 2025 MRE and, where applicable, the PEA are as follows:
Sulphide (Fresh rock) recovery inputs: Pt 81%, Pd 77%, Rh 51%, Au 48%, Ni 50% (for an ≥80g/t concentrate).
High talc recovery inputs: Pt 55%, Pd 51%, Au 27%, Rh 27%, (for an ≥80g/t concentrate) – less than 1% of the mineralized material contemplated for processing in the PEA.
Oxide recovery inputs: Au 90%, Pd 81%, Rh 54%, Pt 23% (for an ≥80g/t concentrate) – not used in the PEA.
Fresh rock recoveries used in the 2025 MRE calculation are based on results generated from multiple phases of laboratory flotation testwork performed by Bravo (117 flotation tests) and three programs of historical flotation testwork, including two historical pilot plant tests. Results indicate that Luanga mineralization has the metallurgical character to potentially produce saleable PGM + sulphide Ni concentrates at grades in line with grades achieved for PGM operators in established jurisdictions around the world, including concentrate grades of ≥80g/t PGM, 5-10% Ni + Sulphur of 15–20%, at the feed grade range of 2g/t PGM.
Bravo testwork considered geospatially representative samples with feed grades ranging from 0.9 – 7.0 g/t PdEq1. Final concentrate grades produced in the Bravo test work ranged from 37–475 g/t PGM. Metallurgical recovery assumptions are based on target concentrate grade of 80g/t PGM.
Input assumptions for the generation of the MRE constraining pit were derived from a grade-recovery curve based on relevant results generated from the 2022 – 2024 test work programs. Where applicable, specific recoveries have been assigned to geological domains that demonstrate materially different metallurgical character and performance relative to the general mineralization observed across the Luanga deposit.
Mini plant tests were also conducted to generate a wide spectrum of concentrate chemistries for pyrometallurgical evaluation. Metallurgical data generated from the mini plant tests were further incorporated into the MRE assumptions. The sample source for the mini plant were inherited, historical, large diameter diamond cores, drilled into a localized, high talc zone in the SW sector of the Luanga deposit. Recoveries achieved were broadly in line with current assumptions (73% combined PGM+Au) but, due to high talc contamination (0.85% of MRE), target concentrate grade was not achieved under the utilised circuit configuration (35g/t). Recovery assumptions for the high talc zone were domained separately, while recoveries for all other zones are based on an 80g/t concentrate. The resultant reduced metallurgical recovery assumption of 51% (4E PGM) was assigned to the high talc domain for pit selection.
Metal Price Assumptions
Metal prices for the preliminary economic assessment were assumed on a long term, real basis.
Assumed platinum, palladium and nickel long prices are based on the long term, real forecast provided by Investec, through Consensus Economics Inc., as published in June 2025. Investec is a UK and South African based financial institution with extensive experience in the PGM mining sector. No long term, real forecasts are available for rhodium; a review was conducted of peer economic study forecasts, as well as recent market trends and pricing behaviour in order to determine the appropriate pricing for rhodium. The gold price assumption is based on Consensus Economics long term, real forecast as of June 2025. In the PEA economic analysis, the platinum price assumption was reduced from Investec’s forecast of $1,600/oz to $1,500/oz as a conservative adjustment in the light of recent market and price volatility in the platinum market, albeit in a current upward trend.
Metal Price Assumptions are shown in Table 10.
Commodity
Luanga 2025 PEA PriceDeck, US$
Source
Spot price at time ofdetermination, US$
Palladium
1,271
Investec LT Real June 2025
1,172
Platinum
1,500
Investec LT Real June 2025
1,444
Rhodium
6,000
GE21
5,540
Gold
3,251
Consensus Economics LTReal June 2025
3,336
Nickel
17,637
Investec LT Real June 2025
15,100
Table 10: Metal Price Assumptions.
Based on the assumed PEA Production Schedule and the metal price deck in Table 10, the pie chart, Figure 6, shows the value contribution to Revenue by metal produced.
Figure 6: Luanga Project PEA Metal Value Contribution. (CNW Group/Bravo Mining Corp.)
Vertical Integration Optionality
Due to the anticipated production scale and long LOM which the Luanga deposit may support, and with potential support of the National Bank for Economic and Social Development (“BNDES”) and the Brazilian Financial Agency for Studies and Project (“FINEP”) initiatives to provide access to a low cost of capital for in-country development of strategic minerals and sustainable materials, vertical integration has been considered as an Alternate Case for the potential future operation.
Luanga is located distal to major downstream processing centres globally and the Project could potentially benefit from the maximisation of net returns on metal sales and savings in logistics costs if vertical integration were adopted.
Furthermore, according to the ANM (Brazil’s National Mining Agency) and COMEXStat (Brazil’s official foreign trade statistics system), Brazil imported approximately 460,000 ounces of PGMs in 2024 to support its automotive, chemical, and manufacturing industries.
Significant local demand for refined metal therefore exists locally and could potentially be supplied directly in-country.
The vertical integration study has assumed a conventional roasting and reductive pyrometallurgical process to treat flotation concentrates producing individual element precious metals and nickel.
The Company completed an extensive review of options for downstream processing with key factors including technology appropriateness, technology risk, performance, capital and operating costs, and environmental considerations. Based on this review, Bravo has initiated the process of seeking technological and commercial partners for the downstream processing facility.
The PEA is prepared on a 100% equity funding basis and does not assume any funding from BNDES or FINEP.
Project Opportunities
Processing of Stockpile – Approximately 30Mt of sulphide mineralised material is contemplated to be stockpiled that is below the total cut-off grade but above the marginal treatment grade. This material could be supplied to the processing plant at the end of the production schedule which would extend the LOM to approximately 20 years.
Oxide Mineral Resources – Also excluded from the PEA is processing of Oxide mineralized material, where approximately 13Mt has been defined through a combination of surface trenches and drilling. Initial metallurgical testing suggests potential for economic recoveries, and more test work is planned. If incorporated into future studies, additional plant components would be required that are not considered in this PEA.
Metallurgy – There is potential for further improvements to metallurgical recoveries and optimization of processing reagent consumption during more detailed future study phases, which could involve more exhaustive and larger scale pilot plant testwork. Test work is continuing.
Toll Treatment Agreement – The Base Case Concentrate Sales scenario currently contemplates a traditional sales contract. However, certain third-party producers in Southern Africa also operate under toll treatment agreements. This may provide the Company with the opportunity to see further benefit in Net Smelter Return (“NSR”) achieved. In a toll treatment scenario, Bravo would be responsible for the marketing and logistics of final metal products.
Processing and Export Free Trade Zone (ZPE) – The Economic Development Company of Pará (CODEC), in partnership with Bravo, has applied to the Brazilian Federal Government (MDIC) to include Bravo into the Processing and Export Free Trade Zone (ZPE) at the Port of Vila do Conde. If approved, Bravo would be permitted to construct its downstream processing facility within the ZPE, benefitting from the associated import and export, and other fiscal and taxation exemptions. In due course, Bravo may conduct a trade-off study to investigate the optimal location (on-mine vs ZPE) for such a downstream processing facility.
BNDES and FINEP Funding – Bravo Mining’s Luanga Project has been selected by the Brazilian National Bank for Economic and Social Development (‘BNDES’) and the Federal Agency for Funding Authority for Studies and Projects in Brazil (‘FINEP’), as one of the successful companies to receive significant potential funding to progress its Luanga Project and downstream facility. This initial round of funding from BNDES and FINEP aims to deploy BRL $5 billion (US $903 million) across leading strategic mineral projects in Brazil. Having now been formally selected, Bravo has initiated discussions with BNDES and FINEP to explore the potential funding structure, which includes economic grants, debt facilities and equity participation. The program aims to develop sustainable supply chains for critical minerals, including PGMs, within Brazil. The funding encompasses various forms of financial support to invest in a range of projects, including commercial-scale plants, pilot facilities, demonstration projects and necessary research studies, depending on the stage of the projects and technologies involved.
MRE Growth Potential – The Company also believes that there is further potential to add to the 2025 MRE at Luanga, since the mineralization is open at depth along the entire 8.1km of strike of the Luanga Project, and the MRE constraining pit is limited by the depth of existing drilling. Please refer to press release published on February 18, 2025 .
IOCG-Style Discovery – The PEA does not factor in the recent copper-gold discoveries on the Project, outside of the Luanga Deposit, which may provide other opportunities for production.
Project Risks
The PEA incorporates Inferred mineral resources into the assumed production schedule. Additional work would be required to upgrade the confidence level of this material before it could be included in a pre-feasibility study. While it is reasonably expected that such upgrading would be successful, it is not certain that all such Inferred would be upgraded.
The market for PGM-Ni concentrates is relatively limited in scale and participants. Bravo has not entered into any offtake agreements at this time, and market interest in and capacity to handle Luanga’s contemplated concentrate production may not be available on the same terms and conditions as assumed in the PEA.
The PEA assumes that the Luanga Project would be eligible for SUDAM tax benefits (see below), but Bravo has not yet made application for eligibility.
Luanga Project 2025 MRE
The PEA is based upon the Company’s 2025 pit constrained MRE (Table 11), which has an effective date of February 18, 2025. The PEA does not contemplate processing the Oxide component of the MRE, which would require an additional processing plant, configured for oxide material. Mineralized Oxide material would be removed and stockpiled as part of the pre-stripping stage of the open pits, for which material movement costs are assumed in this PEA.
The MRE comprises of 158 Mt grading 2.04 g/t PdEq1 (“Palladium Equivalent”) for a total of 10.4 Moz of PdEq1 in the Measured + Indicated category, and 78 Mt grading 2.01 g/t PdEq1 for 5.0 Moz PdEq1 in the Inferred category. Table 8 shows a breakdown of the MRE by tonnage, grade and metal content for each metal, weathering type, and resource classification category.
1Note on Palladium Equivalent – For grades by individual metals, see Table 11 below, where the footnotes also detail the basis of the Palladium Equivalent calculation.
Mineral resources that are not mineral reserves do not have demonstrated economic viability. There is no certainty that all mineral resources would be converted into mineral reserves. This MRE includes Inferred Mineral Resources which have not had sufficient work to classify them as Indicated mineral resources. It is uncertain but reasonably expected that inferred mineral resources could be upgraded to indicated mineral resources with continued exploration. For further information please refer to the 2025 MRE NI 43-101 Independent Technical Report (SEDAR+) with an effective date of February 18, 2025.
Note that the assumed PEA production schedule is based on a subset of this 2025 MRE and uses a higher cut-off grade (0.87g/t PdEq for the PEA versus 0.5g/t PdEq for the MRE) to provide what Bravo deems to be an optimal return in the PEA economic model, which also excludes consideration of Oxide material at this point in time.
Resource Classification
Weathering
Average Grades and Contained Metal Estimates
Tonnes
PdEq
Pd
Pt
Rh
Au
Ni
Mt
g/t
Oz
g/t
Oz
g/t
Oz
g/t
Oz
g/t
Oz
%
Tonnes
Measured
Oxide
4
1.51
197
0.90
117
0.88
115
0.12
15
0.05
7
—
—
High talc
—
—
—
—
—
—
—
—
—
—
—
—
—
Fresh Rock
32
2.06
2,144
0.97
1,009
0.67
694
0.08
88
0.04
46
0.11
35,282
Total
36
2.00
2,340
0.96
1,126
0.69
809
0.09
104
0.04
53
0.10
35,282
Indicated
Oxide
6
1.51
314
0.97
200
0.73
151
0.11
23
0.04
9
—
—
High talc
2
1.83
146
1.12
89
0.54
43
0.08
6
0.11
9
0.13
3,160
Fresh Rock
113
2.09
7,599
0.99
3,583
0.59
2,133
0.09
318
0.05
193
0.14
156,406
Total
122
2.06
8,058
0.99
3,872
0.59
2,326
0.09
348
0.05
210
0.13
159,566
Measured + Indicated
Oxide
10
1.51
510
0.94
317
0.79
266
0.11
38
0.04
15
—
—
High talc
2
1.83
146
1.12
89
0.54
43
0.08
6
0.11
9
0.13
3,160
Fresh Rock
145
2.08
9,743
0.98
4,592
0.60
2,827
0.09
407
0.05
239
0.13
191,688
Total
158
2.04
10,399
0.98
4,998
0.62
3,135
0.09
451
0.05
262
0.12
194,848
Inferred
Oxide
3
1.57
130
0.88
73
1.04
86
0.13
11
0.05
4
—
—
High talc
0.1
1.76
5
1.08
3
0.53
2
0.07
0
0.10
0
0.14
133
Fresh Rock
75
2.02
4,878
0.97
2,344
0.58
1,389
0.08
191
0.05
123
0.13
97,586
Total
78
2.01
5,013
0.97
2,421
0.59
1,476
0.08
202
0.05
128
0.13
97,719
Table 8: MRE Declaration at a Cut-off of 0.5g/t PdEq*
Table 11: Luanga Project 2025 MRE
Notes to the MRE:
1.
The 2025 MRE was prepared by Bernardo Horta de Cerqueira Viana, Geologist, BSc (Geology), FAIG, CEO of GE21 Consultoria Mineral Ltda. and Porfírio Cabaleiro Rodriguez, Mining Engineer, BSc (Mine Eng), FAIG, CKO of GE21 Consultoria Mineral Ltda., both independent Qualified Person (“QP”) for the purposes of National Instrument 43-101 Standards of Disclosure for Mineral Projects (“NI 43-101”). The effective date of the MRE is 18 February 2025.
2.
Mineral resources are reported using the 2014 CIM Definition Standards and were estimated in accordance with the CIM 2019 Best Practices Guidelines, as required by National Instrument 43-101 Standards of Disclosure for Mineral Projects (“NI 43-101”).
3.
The MRE Estimate is reported/confined within an economic pit shell generated by Dassault Geovia Whittle software, using the following assumptions:
Generated from work completed by Bravo and historical test work:Metallurgical recovery in sulphide material of 77% Pd, 81% Pt, 51% Rh, 48% Au, 50% Ni to a Ni-PGM concentrate.Metallurgical recovery in oxide material of 81% Pd, 23% Pt, 54% Rh, 90% Au to a PGM ash residue (Ni not applicable).Metallurgical recovery in high-talc sulphide material of 51% Pd, 55% Pt, 27% Rh, 27% Au, 50% Ni to a Ni-PGM concentrate.Independent Geotechnical Testwork – Overall pit slopes of 40 degrees in oxide and 50 degrees in Fresh Rock.Densities are based on 27,170 drillhole core and 112 in situ samples density measurements. The Mineral Resources are reported on a dry density basis.External downstream payability has not been included, as the base case MRE assumption considers internal downstream processing, with operating costs for downstream processing included in the calculation of the 0.5g/t PdEq1 cut-off used for the declared MRE.Payable royalties of 2%. (Considering CFEM, for reserves a complete set of royalties must be considered)Metal PricingFor the 2025 MRE, the same pricing regime was used as in the 2023 MRE as there have been no significant changes in prices. This also allows for a direct comparison between the new 2025 MRE and the now defunct 2023 model (a 10-year trailing average – 2014-2023): Pd price of US$1,380/oz, Pt price of US$1,100/oz, Rh price of US$6,200/oz, Au price of US$1,500/oz, Ni price of US$7.10/lb.Palladium Equivalent (“PdEq1“) Calculation:The PdEq equation is: PdEq1 = Pd g/t + F1 + F2 + F3 + F4Where: F1 = (Ptp*PtR)/(Pdp*PdR) Ptt F2 = (Rhp*RhR)/(Pdp*PdR) Rht F3 = (Aup*AuR)/(Pdp*PdR) Aut F4 = (Nip*NiR)/(Pdp*PdR) NitR = Metallurgical RecoveryP = Metal PriceCosts are taken from comparable projects in GE21’s extensive database of mining operations in Brazil, which includes not only operating mines, but recent actual costs from what could potentially be similarly sized operating mines in the Carajás. Costs considered a throughput rate of ca. 10Mtpa.Mining costs: US$2.00/t oxide, US$3.00/t Fresh Rock. Processing costs: US$9.00/t fresh rock, US$7.50/t oxide. US$1.50/t processed, for General & Administration. US$1.00/t processed for grade control. US$0.50/t processed for rehabilitation.Several of these considerations (metallurgical recovery, metal price projections for example) should be regarded as preliminary in nature, and therefore PdEq1 calculations should be regarded as preliminary in nature.
4.
The 2025 MRE supersedes and replaces the Previous Estimate (2023), which should be no longer relied upon.
5.
The QP is not aware of political, environmental, or other risks that could materially affect the potential development of the Mineral Resources other than those typical for mining projects at this stage of development, including those listed in the Technical Report dated October 22nd, 2023, and in the Company’s Annual Information Form dated April 22nd, 2024.
6.
Totals may not sum due to rounding.
Permitting
On March 3, 2025, the Pará State Environmental Agency (Secretaria de Estado de Meio Ambiente e Sustentabilidade – SEMAS) granted the preliminary license (“LP”) to the Luanga Project.
The Brazilian mine permitting process consists of three key stages: the preliminary license (“LP”), which has been granted, followed by the installation license (“LI”) and, finally, the license to operate (“LO”). The LP is the most critical, time-consuming and challenging to secure, as it defines the project’s fundamental parameters and requires both environmental feasibility and social acceptance – both of which were affirmed during the successful public hearing in December 2024. See news release dated March 3, 2025 for additional information.
The granted LP provides for the extraction and processing of metallic minerals, including platinum group metals as well as for nickel, copper and gold. The subsequent LI is applied for as a prerequisite for the commencement of construction activities, while the final license (LO) is granted upon completion of construction and the start of operations.
SUDAM Taxation Benefit
Companies located in the Amazon region may benefit from certain tax incentives. SUDAM is an administratively and financially independent federal government agency that oversees development in the Amazon region. The region includes the state of Pará in which the Project is located. Under the concession program, companies can receive either partial or complete tax exemption on income taxes for Brazilian companies.
The tax exemption applies only to income from facilities operating in the designated region and consists of a reduction of 75% off the regular corporate income tax (25%). For the purposes of the PEA, the financial model factors in a reduction of the corporate income tax rate plus social contribution of 34% (25% + 9%) to the 15.25% (25% * 0.25% + 9%) rate available under the SUDAM regime for the Project. The concession is available for an initial period of 10 years of operation.
The PEA assumes that the Luanga Project would be eligible for SUDAM tax exemption, but this can only be confirmed once an application has been submitted and approved.
About Bravo Mining Corp.
Bravo is a Canadian and Brazil-based mineral exploration and development company focused on advancing its PGM+Au+Ni Luanga Project, as well as our Cu-Au exploration opportunities in the world-class Carajás Mineral Province, Para State, Brazil.
Bravo is one of the most active explorers in Carajás. The team, comprising of local and international geologists and engineers, has a proven track record of PGM, nickel, and copper discoveries in the region and elsewhere. The individuals in the team have successfully taken a past IOCG greenfield project from discovery to development and production in the Carajás.
The Luanga Project is situated on mature freehold farming land and benefits from being located close to operating mines and a mining-experienced workforce, with excellent access and proximity to existing infrastructure, including road, rail, ports, and hydroelectric grid power. Bravo’s current Environmental, Social and Governance activities include planting more than 30,000 high-value trees in and around the project area in the past 30 months, while hiring personnel and contracting services locally.
Technical Disclosure
Technical Disclosure and Qualified Persons
Bernardo Horta de Cerqueira Viana, Geologist, BSc (Geology), FAIG, CEO of GE21 Consultoria Mineral Ltda. and Porfírio Cabaleiro Rodriguez, Mining Engineer, BSc (Mine Eng), FAIG, CKO of GE21 Consultoria Mineral Ltda., both are an Independent QP as defined in NI 43-101 and are responsible for the PEA. Independent peer reviews were carried out internally within the GE21 Group, over the complete PEA process.
Mr. Cabaleiro has reviewed and approved the scientific and technical information related to the PEA contained in this news release.
Technical information in this news release has been reviewed and approved by Simon Mottram, F.AusIMM (Fellow Australia Institute of Mining and Metallurgy), President of Bravo Mining Corp. who serves as the Company’s “qualified person” as defined in NI 43-101. Mr. Mottram has verified the technical data and opinions contained in this news release.
Details of the PEA will be provided in a technical report with an effective date of July 7, 2025, prepared in accordance with NI 43-101, which will be filed under the Company’s SEDAR+ profile within 45 days of this news release.
Neither TSX Venture Exchange nor its Regulation Services Provider (as that term is defined in policies of the TSX Venture Exchange) accepts responsibility for the adequacy or accuracy of this release.
Forward Looking Statements
This news release contains forward-looking information which is not comprised of historical facts. Forward-looking information is characterized by words such as “assume”, “substantial”, “solid”, ”improve”, ”increase”, ”significant “, ”success“, ”potential “, ”opportunity“, “well positioned”, variants of these words and other similar words, phrases, or statements that certain events or conditions “could”, “may”, “should”, “will” or “would” occur. This news release contains forward-looking information pertaining to the Company’s 2025 PEA; the potential for future MRE growth from deeper drilling; the potential to incorporate mineralized material within the pit but stockpiled as below cut-off into future economic studies; the potential to process the oxide mineralized material and the economics thereof; whether or not current or future discoveries of copper-gold mineralization at Luanga will have sufficient economic merit to consider development; potential repeatability and improvements to the economic assumptions and/or to metallurgical recoveries used in the PEA and MRE in future studies; the potential to convert some or all of the MRE to mineral reserves through economic studies and the timing and results of any such studies; the assumption that onsite vertical integration/downstream processing will be technically and economically feasible and that an experienced partner will be identified and terms of a relationship be acceptable to Bravo; the carbon intensity of any future operation; whether of funding from BNDES and FINEP will be made available to Bravo and, if so, on what terms; the ultimate cost of power for any future mine developed; the duration and prices in future commodity cycles; whether more value can be unlocked within the Luanga in the future; changes in the exchange rate between the US$ and Brazilian Real; the results of subsequent stages of permitting, including but not limited to the timing, granting and conditions of the LI and LO referred to herein; the outcomes of future economic studies and the Company’s plans in respect thereof. Forward-looking information involves risks, uncertainties and other factors that could cause actual events, results, and opportunities to differ materially from those expressed or implied by such forward-looking information. Factors that could cause actual results to differ materially from such forward-looking information include, but are not limited to, unexpected results from exploration programs, changes in the state of equity and debt markets, fluctuations in commodity prices, delays in obtaining required regulatory or governmental approvals, environmental risks, limitations on insurance coverage; and other risks and uncertainties involved in the mineral exploration and development industry. Forward-looking information in this news release is based on the opinions and assumptions of management considered reasonable as of the date hereof, including, but not limited to, the assumption that the assay results confirm that the interpreted mineralization contains significant values of nickel, PGMs and Au; that the mineralization remains open at depth, that PGM and/or Ni grades and mineralized thicknesses are improving at depth; that activities will not be adversely disrupted or impeded by regulatory, political, community, economic, environmental and/or healthy and safety risks; that the Luanga Project will not be materially affected by potential supply chain disruptions; and general business and economic conditions will not change in a materially adverse manner. Although the Company believes that the assumptions and factors used in preparing the forward-looking information in this news release are reasonable, undue reliance should not be placed on such information. The Company disclaims any intention or obligation to update or revise any forward-looking information, other than as required by applicable securities laws.
Cautionary Note for U.S. Investors Concerning Mineral Resources and PEA (Scoping Study in SEC S-K 1300)
This news release has been prepared in accordance with the requirements of the securities laws in effect in Canada, which differ from the requirements of United States securities laws. The terms “mineral resource”, “measured mineral resource”, “indicated mineral resource” and “inferred mineral resource” are defined in and required to be disclosed by NI 43-101; however, these terms are not defined terms under the U.S. Securities and Exchange Commission (“SEC”) modernization rules, known as “S-K 1300”, and are normally not permitted to be used in reports and registration statements filed with the SEC. Investors are cautioned not to assume that all or any part of an “measured mineral resource”, “indicated mineral resource” or “inferred mineral resource” will ever be upgraded to a higher category or converted into mineral reserves in accordance with S-K 1300. “Inferred mineral resources” have a great amount of uncertainty as to their existence, and great uncertainty as to their economic and legal feasibility. Under Canadian rules, estimates of inferred mineral resources may not form the basis of feasibility or pre-feasibility studies, except in rare cases. Investors are cautioned not to assume that all or any part of an inferred mineral resource exists or is economically or legally mineable. Disclosure of “contained ounces” in a mineral resource is permitted disclosure under Canadian regulations; however, the SEC normally only permits issuers to report mineralization that does not constitute “reserves” by SEC S-K 1300 standards as in place tonnage and grade without reference to unit measures. Accordingly, information contained in this News Release contain descriptions of the Company’s mineral deposits that may not be comparable to similar information made public by U.S. companies subject to the reporting and disclosure requirements under the United States federal securities laws and the rules and regulations thereunder.
Non IFRS Financial Performance Measures
“All-in Sustaining Cost”, “Total Site Costs”, “Total Operating Costs”, “Net Revenue”, and “Free Cashflow” are not performance measures reported in accordance with International Financial Reporting Standards (“IFRS”). These performance measures are included because these statistics are key performance measures that management uses to monitor performance. Management uses these statistics to assess how the Luanga Project compares against its peer projects and to assess the overall effectiveness and efficiency of the contemplated mining operations. These performance measures do not have a meaning within IFRS and, therefore, amounts presented may not be comparable to similar data presented by other mining companies. These performance measures should not be considered in isolation as a substitute for measures of performance in accordance with IFRS.
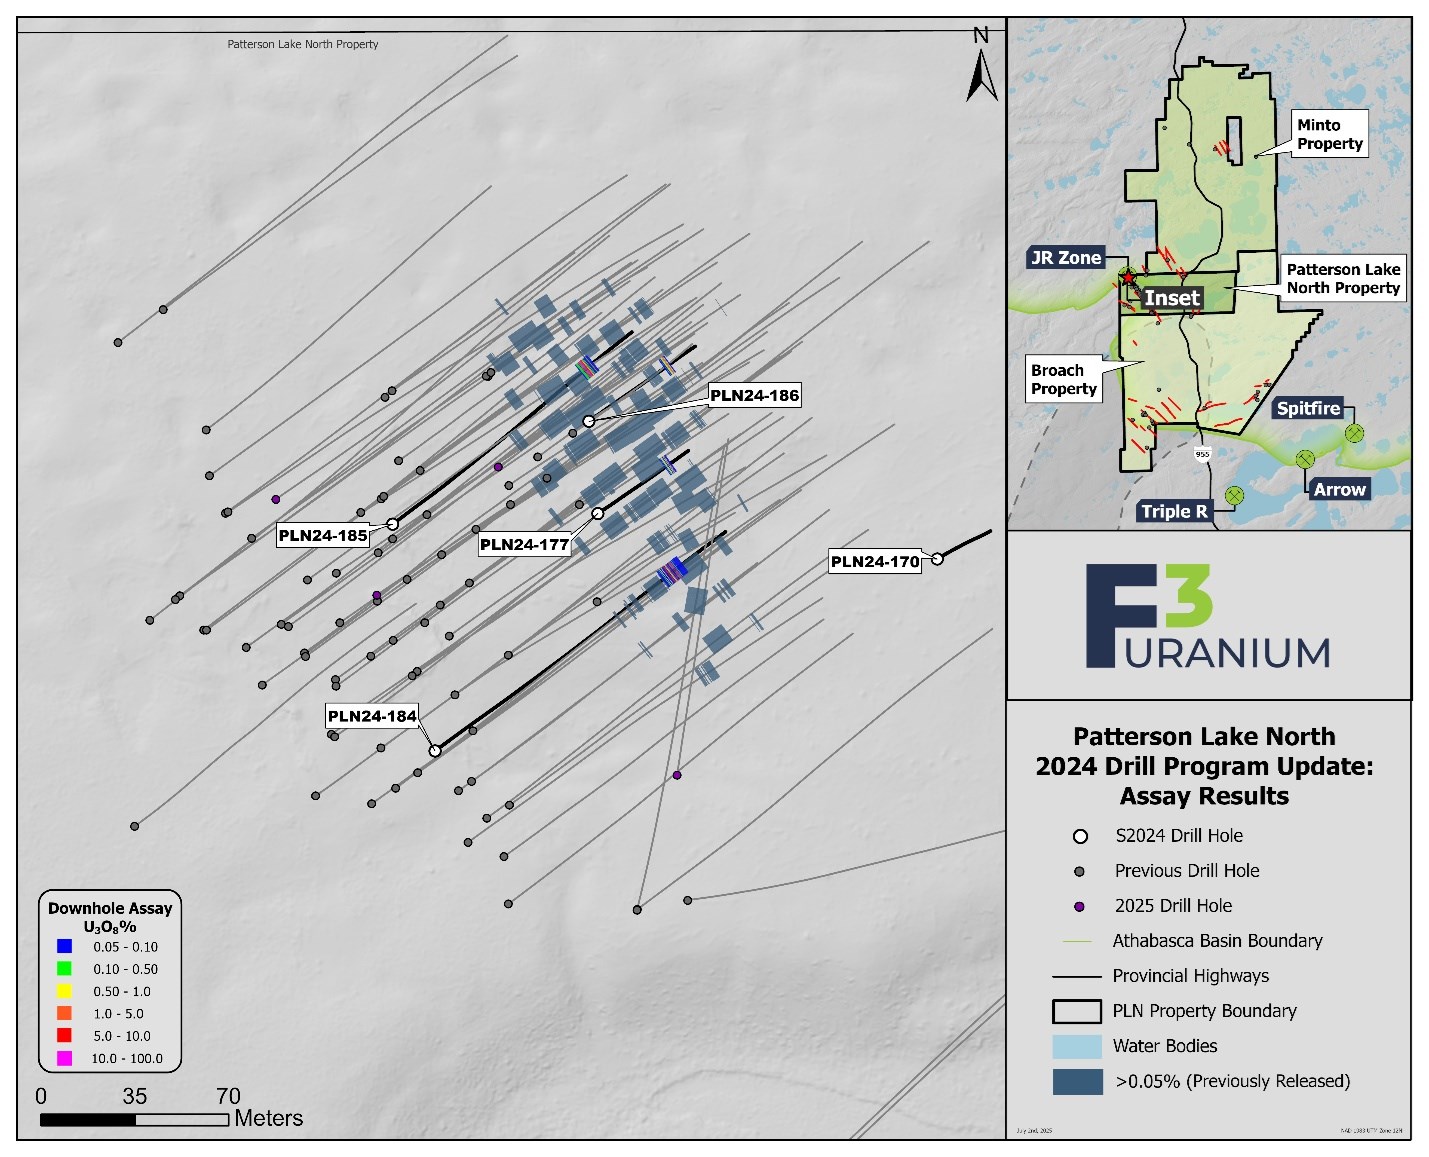
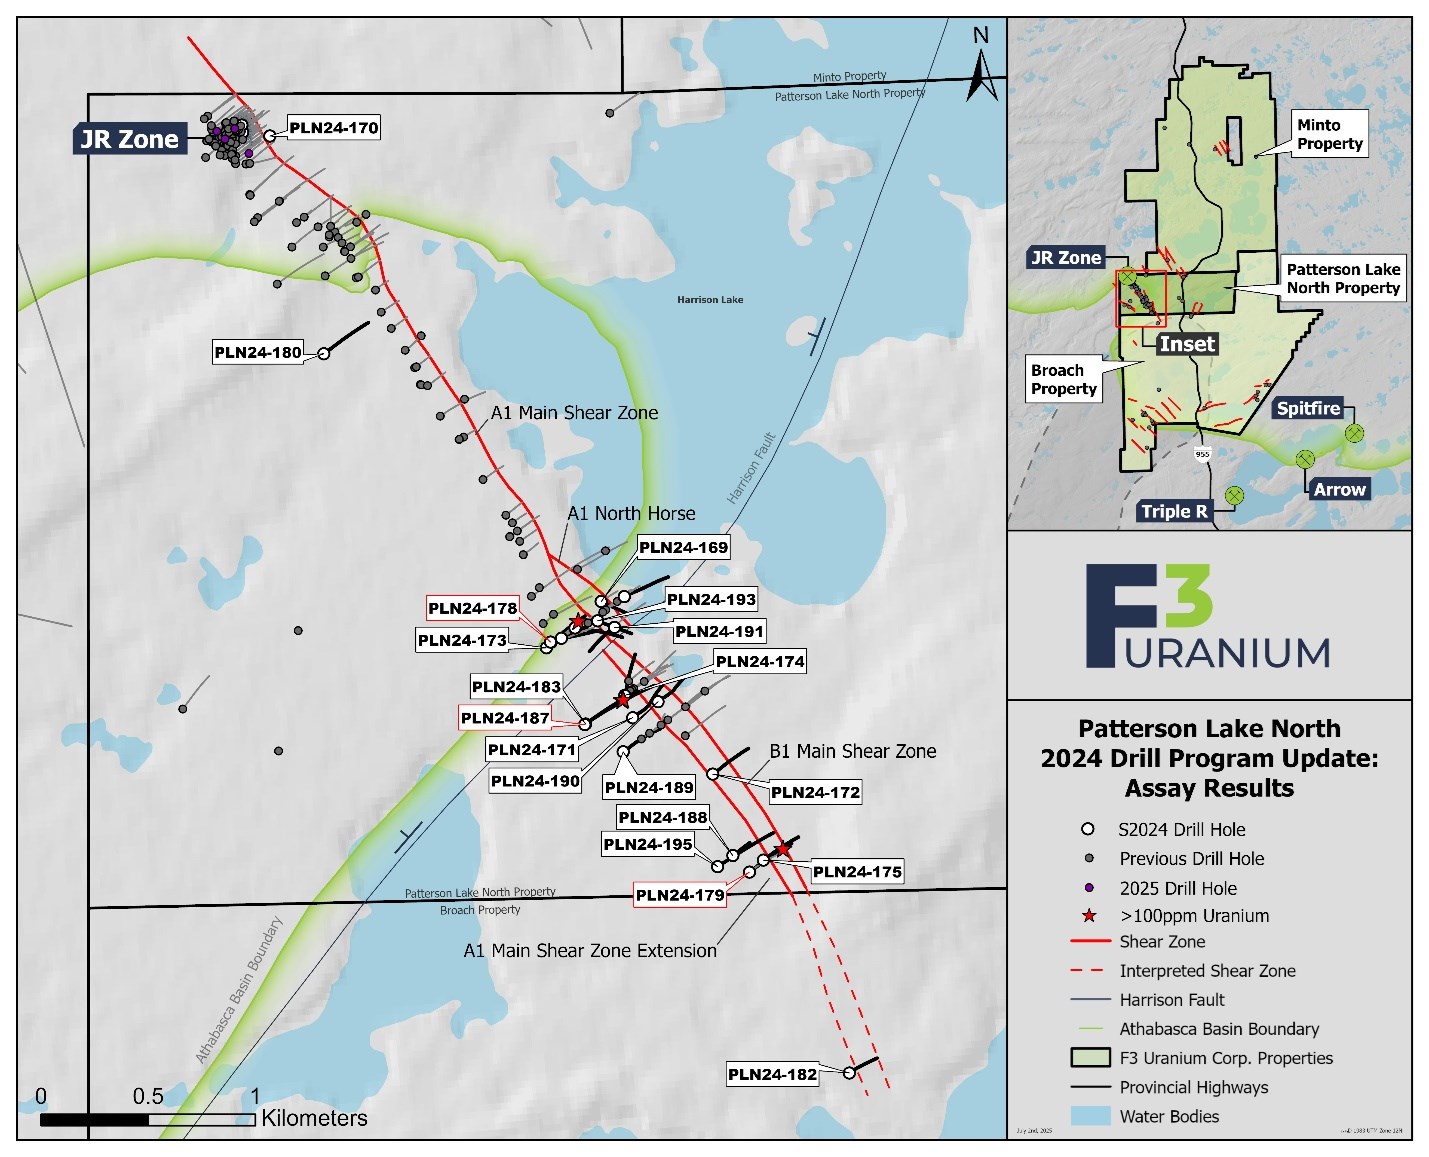
Kelowna, British Columbia–(Newsfile Corp. – July 16, 2025) – F3 Uranium Corp(TSXV: FUU) (OTCQB: FUUFF) (“F3” or “the Company“) is pleased to announce the final assay results of 2024 JR Zone drilling including drillhole PLN24-184 (See NR October 29, 2024) which returned 13.0m of 3.2% U3O8, including a high grade core with 2.5m of 13.7% U3O8. Exploration geochemical results are highlighted by PLN24-187 which targeted and intersected the A1 Extension 3.2km along strike from JR Zone, an interpreted continuation of the A1 Main Shear on the southeast side of the Harrison Fault and which intersected strongly elevated uranium values averaging 70ppm over 8.5m, with a peak of 244ppm at 549.0m.
Elevated uranium values of 111ppm U over 5.5m between 193.5 – 199.0m in PLN14-019 helped prioritize the A1 conductor which hosts the JR Zone. Continued anomalous intersects across the Harrison fault, A1 Extension and B1 areas highlight the complex geologic and structural setting which still hosts numerous high priority untested targets.
F3 is also pleased to announce the engagement of SLR International Corporation (“SLR”) to complete the maiden resource estimate for the Company. SLR brings deep familiarity with basement hosted uranium deposit modeling and resource estimation and is qualified to prepare a NI 43-101 Technical Report on the Patterson Lake North Project, targeted for completion in Q4 2025.
2024 JR Zone Highlights:
PLN24-184 (line 105S):
13.0m @ 3.2% U3O8 (228.5m to 241.5m), including:
2.5 @ 13.7% U3O8 (238.0m to 240.5m), further including:
0.5m @ 26.3% U3O8 (238.5m to 239.0m)
PLN24-185 (line 025S):
11.5m @ 2.7% U3O8 (219.5m to 231.0m), including:
3.5m@ 8.2% U3O8 (222.5m to 226.0m), further including:
1.0m @ 17.7% U3O8 (223.0m to 224.0m)
2024 Exploration Highlights:
PLN24-178 (line 2535S):
2.0m @ 94ppm U (446.5m to 448.5m), including:
0.5m @ 128ppm U (446.5m to 447.0m)
PLN24-179 (line 4245S):
0.5m @ 119ppm U (426.0m to 426.5m)
PLN24-187 (line 3240S):
8.5m @ 70ppm U (545.0m to 553.5m), including:
1.5m @ 198ppm U (549.0m to 550.5m), including:
0.5m @ 244ppm U (549.0m to 549.5m)
Sam Hartmann, Vice President Exploration, commented:
“F3 Uranium is pleased to report the completion of the 2024 assay results for the JR Zone drilling program. These results will be integrated into our dataset to support the maiden mineral resource estimate, targeted for completion in Q4 2025. This milestone represents a significant achievement for F3 Uranium, advancing the JR Zone from discovery to a defined resource. During this time, we will continue drilling at our new discovery – the Tetra Zone just 12km to the south.”
Table 1. Drill Hole Summary and Uranium Assay Results
Samples from the drill core are split into half sections on site. Where possible, samples are standardized at 0.5m down-hole intervals. One-half of the split sample is sent to SRC Geoanalytical Laboratories (an SCC ISO/IEC 17025: 2005 Accredited Facility) in Saskatoon, SK while the other half remains on site for reference. Analysis includes a 63 element suite including boron by ICP-OES, uranium by ICP-MS and gold analysis by ICP-OES and/or AAS.
The Company considers uranium mineralization with assay results of greater than 1.0 weight % U3O8 as “high grade” and results greater than 20.0 weight % U3O8 as “ultra-high grade”.
All depth measurements reported are down-hole and true thicknesses are yet to be determined.
About the Patterson Lake North Project:
The Company’s 42,961-hectare 100% owned Patterson Lake North Project (PLN) is located just within the south-western edge of the Athabasca Basin in proximity to Paladin’s Triple R and NexGen Energy’s Arrow high-grade uranium deposits, an area poised to become the next major area of development for new uranium operations in northern Saskatchewan. The PLN Project consists of the 4,074-hectare Patterson Lake North Property hosting the JR Zone Uranium discovery approximately 23km northwest of Paladin’s Triple R deposit, the 19,864-hectare Minto Property, and the 19,022-hectare Broach Property hosting the Tetra Zone, F3’s newest discovery 13km south of the JR Zone. All three properties comprising the PLN Project are accessed by Provincial Highway 955.
Qualified Person:
The technical information in this news release has been prepared in accordance with the Canadian regulatory requirements set out in National Instrument 43-101 and approved on behalf of the company by Raymond Ashley, P.Geo., President & COO of F3 Uranium Corp, a Qualified Person. Mr. Ashley has reviewed and approved the data disclosed.
About F3 Uranium Corp.:
F3 is a uranium exploration company, focusing on the high-grade JR Zone and new Tetra Zone discovery 12km to the south in the PW area on its Patterson Lake North (PLN) Project in the Western Athabasca Basin. F3 currently has 3 properties in the Athabasca Basin: Patterson Lake North, Minto, and Broach. The western side of the Athabasca Basin, Saskatchewan, is home to some of the world’s largest high grade uranium deposits including Paladin’s Triple R project and NexGen’s Arrow project.
Forward-Looking Statements
This news release contains certain forward-looking statements within the meaning of applicable securities laws. All statements that are not historical facts, including without limitation, statements regarding future estimates, plans, programs, forecasts, projections, objectives, assumptions, expectations or beliefs of future performance, including statements regarding the suitability of the Properties for mining exploration, future payments, issuance of shares and work commitment funds, entry into of a definitive option agreement respecting the Properties, are “forward-looking statements.” These forward-looking statements reflect the expectations or beliefs of management of the Company based on information currently available to it. Forward-looking statements are subject to a number of risks and uncertainties, including those detailed from time to time in filings made by the Company with securities regulatory authorities, which may cause actual outcomes to differ materially from those discussed in the forward-looking statements. These factors should be considered carefully and readers are cautioned not to place undue reliance on such forward-looking statements. The forward-looking statements and information contained in this news release are made as of the date hereof and the Company undertakes no obligation to update publicly or revise any forward-looking statements or information, whether as a result of new information, future events or otherwise, unless so required by applicable securities laws.
The TSX Venture Exchange and the Canadian Securities Exchange have not reviewed, approved or disapproved the contents of this press release, and do not accept responsibility for the adequacy or accuracy of this release.
F3 Uranium Corp. 750-1620 Dickson Avenue Kelowna, BC V1Y9Y2 Contact Information Investor Relations Telephone: 778 484 8030 Email: ir@f3uranium.com
ON BEHALF OF THE BOARD “Dev Randhawa” Dev Randhawa, CEO
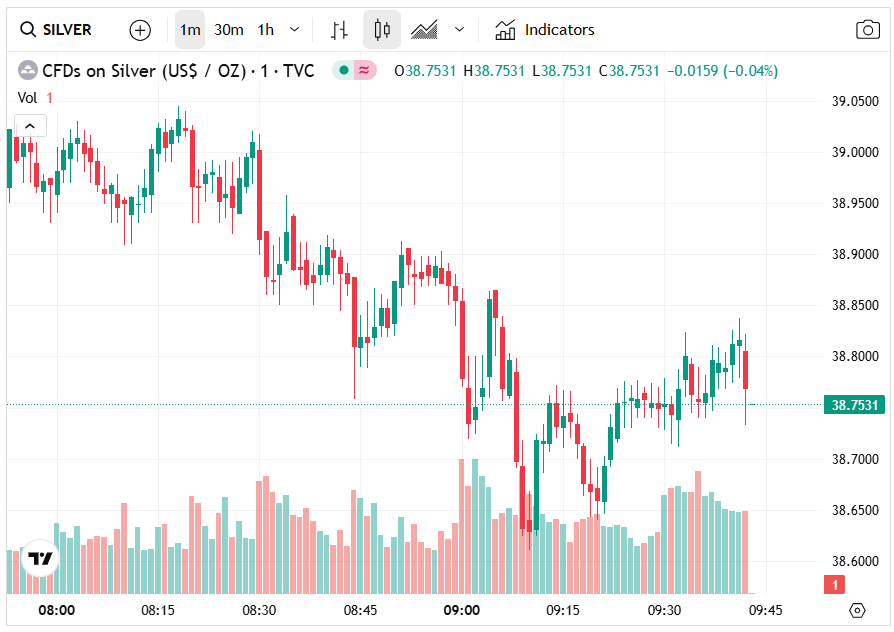
Silver price rose 1.6% to $38.96 per ounce on Monday, its strongest level since September 2011, as investors flocked to safe-haven assets amid escalating US trade tensions.
The spike followed President Donald Trump’s announcement of 30% tariffs on most imports from the European Union and Mexico, boosting demand for non-rate-sensitive commodities. Mexico is also the largest producer of silver and a key supplier to the American market.
Analysts say the rally is driven by speculative flows, with silver moving above key technical resistance levels as traders bet on further gains. ANZ noted that breaching the $35–$37 range could propel silver prices toward $40 per ounce.
Market outlook
Participants are also eyeing US consumer price index and producer price index readings due later this week for signals on Federal Reserve policy, given silver’s tendency to benefit in a lower-rate environment.
In addition, Indian investors, traditionally heavy buyers of gold, have increasingly turned to silver this year as its returns outpaced those of gold.
The rise in appetite for the metal has left the physical market under strain in London, where most silver is held by exchange-traded funds — meaning it isn’t available to lend or buy. Since February, the volume of silver-backed ETFs has expanded by some 2,570 tons, according data compiled by Bloomberg.
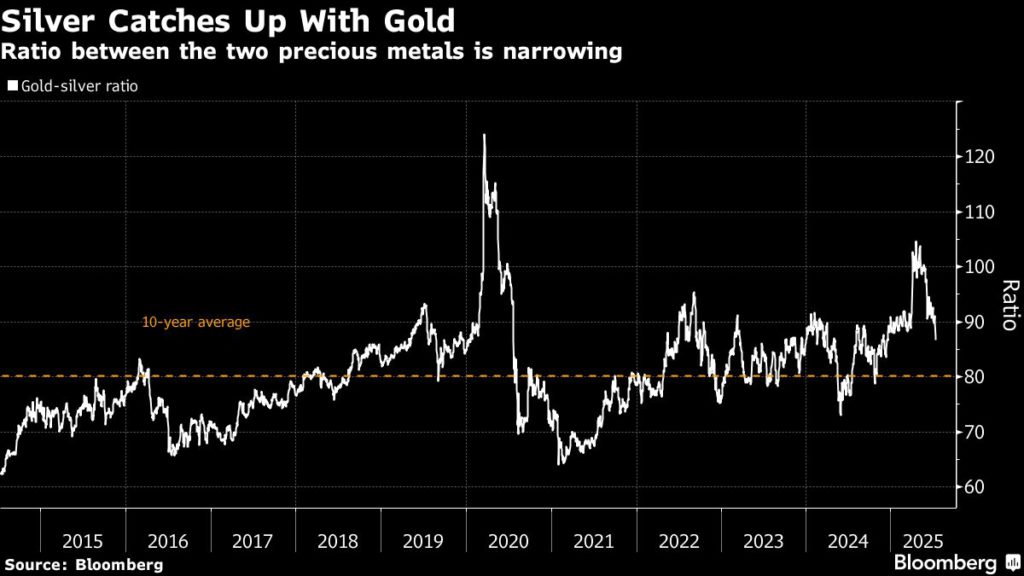
Silver’s outperformance of gold means that the ratio between the two has dropped in recent months, though silver still remains relatively cheap historically. It currently takes about 86 ounces of silver to buy 1 ounce of gold, compared with a 10-year average of 80.
“Silver demand is currently benefiting from the threat of trade wars and bullion being way out of reach for many,” Priyanka Sachdeva, an analyst at Phillip Nova Pte Ltd, told Bloomberg.
“Gold has already seen a tremendous upswing, and it’s currently expensive,” leaving investors more inclined to consider a cheaper alternative, she added.
Silver ETF inflows at record pace
Silver has emerged as one of the most attractive investment assets of 2025, with funds flowing into exchange-traded products (ETP) backed by the metal already surpassing all of last year, says the Silver Institute.
During the first half of 2025, silver-backed ETPs saw net inflows totalling 95 million oz., taking the total global holdings to 1.13 billion oz. — only 7% below the peak level of 1.21 billion oz. in February 2021, according data compiled by the Institute.
The total value of ETP holdings hit a series of all-time highs in June, exceeding $40 billion for the first time. Nearly half of the year’s gains were recorded in that month alone. By month-end, the metal’s price had gone up by a quarter for the year.
The Silver Institute notes that June 2025 was the most significant monthly increase since the Reddit-driven silver squeeze in early 2021, when prices leaped to nearly $30 an ounce.
Production of silver at Novosibirsk precious metals plant · Reuters
By Rajendra Jadhav
MUMBAI (Reuters) -Indian investors, traditionally obsessed with stockpiling gold, are increasingly turning to silver, which was trading near a 14-year high on Monday, as its returns this year outpaced those of gold.
Imports fill most of the demand in the world’s largest consumer of silver, where domestic prices touched a record high of 114,875 rupees ($1,336) a kg as a production shortfall spurred investors’ hopes for a further rally.
“Gold’s done pretty well for me over the last couple of years,” said Umesh Agarwal, a regular buyer of gold coins, who recently made his first purchase of a one-kilogram bar of silver.
“Now I’m hoping silver follows the same path and gives similar returns.”
Domestic prices of silver have risen 21% in the past three months, outstripping a rise of 5% in gold, as opposed to the scenario of the past year, when gold prices surged 34%, compared to a rise of 23% in silver.
The appetite for silver is driven both by investment and industry needs in areas such as solar energy and electric vehicles, outpacing production, said Chirag Thakkar, chief executive of Amrapali Group Gujarat, a leading silver importer.
“Usually, investors cash in when prices hit record highs, offloading coins and bars or pulling out of exchange-traded funds (ETFs),” he added.
“However, this time, even at record highs, people are investing, rather than selling.”
Silver ETFs attracted inflows of a record 20.04 billion rupees in June, up from 8.53 billion in May, data from the Association of Mutual Funds in India showed.
In the June quarter, silver ETFs attracted inflows of 39.25 billion rupees, far outpacing the 23.67 billion flowing into gold ETFs.
Such ETFs offer investors a convenient way to gain exposure to silver, which is heavy and costly to store and transport, said Vikram Dhawan, head of commodities and fund manager at Nippon India Mutual Fund, which manages metal ETFs.
Volatility in equity markets following U.S. President Donald Trump‘s tariffs has also pushed investors to diversify, said a Mumbai-based bullion dealer with a silver importing bank.
Traditionally the choice of budget-conscious rural consumers, silver is increasingly attracting urban buyers as an investment, the dealer added.
Indian retail investment demand rose 7% in the first half of 2025 on the year, fuelled by expectations of a price rally, the Silver Institute said this month.
Silver imports jumped 431% in May on the year to 544.1 tons, while gold imports fell 25% to 30.5 tons, trade ministry data showed.
($1=85.9780 Indian rupees)
(Reporting by Rajendra Jadhav; Additional reporting by Bharath Rajeswaran; Editing by Mayank Bhardwaj and Clarence Fernandez)
We’re pleased to share that EMX has sold its Moroccan portfolio and entered into a strategic exploration alliance with Avesoro Holdings. This partnership allows EMX to retain long-term upside through royalties, while Avesoro fully funds the advancement of projects in one of North Africa’s most prospective mineral regions.
EMX Sells its Moroccan Portfolio and Forms Exploration Alliance with Avesoro
Vancouver, British Columbia, July 8, 2025 (NYSE American: EMX; TSX Venture: EMX) – EMX Royalty Corporation (“EMX”) is pleased to announce the execution of an exploration alliance agreement (the “Agreement”) in the country of Morocco with Avesoro Morocco LTD (“Avesoro”), a wholly owned subsidiary of Avesoro Holdings LTD, a privately owned, West Africa-focused mid-tier gold producer. The Effective date of the Agreement is March 19, 2025, and key conditions precedent for closing have now been completed. Avesoro Holdings, through its subsidiaries, operates gold mines in the country of Liberia and is looking to expand its operations elsewhere in the region. As such, Avesoro brings high levels of operational and exploration experience in western Africa to the alliance. In Morocco, EMX and Avesoro will work together to advance a portfolio of exploration projects that EMX has assembled and to cooperatively explore for new opportunities.
Avesoro will fully fund the alliance activities, which will include the advancement of certain projects in the EMX Moroccan portfolio, as well as new projects identified by the alliance for acquisition. Under the Agreement, Avesoro will acquire EMX’s operating entity in Morocco (“EMX Corp Morocco”, a wholly owned subsidiary of EMX) that currently domiciles EMX’s exploration projects and its Moroccan exploration staff. Projects slated for advancement under the alliance will be initially designated as Alliance Exploration Projects (“AEP’s”). These will be funded from an annual budget agreed upon by Avesoro and EMX. Once a project reaches an appropriate stage of advancement, it can be converted to a Designated Project (“DP”) and advanced from an independent pool of funding provided by Avesoro.
The initial term of the alliance will be two years but can be extended by mutual agreement. At the end of the alliance term, any AEP’s that have not become DP’s will revert to EMX.
Strategic rationale. The sale of EMX’s Moroccan business unit is the latest example of efficient execution of our Royalty Generation business. The exploration alliance with Avesoro will perpetuate EMX’s upside royalty exposure across a large portfolio of exploration assets in a highly prospective region, while reducing ongoing operational expenses.
Commercial Terms Overview. (all terms in USD)
Alliance stage:
Avesoro has made an execution payment to EMX of $650,000.
Avesoro will provide an initial pool of capital of at least $1.5 million/year to advance the alliance projects and to make new acquisitions within the country of Morocco. The initial term of the alliance will be two years.
Avesoro has agreed to provide the necessary funding to keep the projects in good standing during the term of the alliance.
At any time, Avesoro can elect to deem any of the projects a Designated Project (DP).
Any project that has not been converted to a DP by the end of the alliance term will be returned to EMX.
Designated project stage:
Avesoro will retain a 100% ownership in each of the DPs, with EMX retaining a 2% NSR royalty that is uncapped and cannot be repurchased or reduced.
Each DP will have a minimum $2,500,000 work commitment for the first five years and each DP will be funded from an independent pool of capital.
Commencing on the first anniversary of the nomination of the first DP, EMX will receive a $50,000 advance royalty payment, escalating by 15% per year until the advance royalty payment reaches $100,000.
EMX will also receive additional advance royalty payments for each subsequent project for which a positive feasibility study is delivered. These will begin at $50,000, escalating by 15% per year until the project reaches production or the advance royalty payment reaches $100,000.
EMX will also receive milestone payments of $500,000 for each project for which a feasibility study is delivered, and $1,000,000 for each project that reaches production.
Overview of EMX’s Moroccan Portfolio. EMX has been active in Morocco since 2021, conducting reconnaissance exploration programs that have resulted in the acquisition of 18 exploration projects in Morocco, comprising 860 square kilometers (see Figure 1). These include a combination of gold, copper and other base metal projects that are strategically located in several of Morocco’s key mineral belts, with three projects in the highly underexplored Moroccan Sahara region, 14 projects in the well-endowed Anti-Atlas belt, home to several of Morocco’s most significant mineral deposits, and one project in the High-Atlas belt.
Morocco is emerging as an attractive jurisdiction for mineral exploration and mineral resource development, benefiting from a stable regulatory framework, well-developed infrastructure, and highly prospective geological settings. The country hosts significant precious and base metal mines yet remains underexplored compared to other mining regions.
In advance of signing the Alliance, EMX and Avesoro have agreed upon extensive follow-up programs to continue to advance the projects. Nine of the existing EMX projects will be designated as AEP’s at the onset of alliance activities.
Dr. Eric P. Jensen, CPG, a Qualified Person as defined by National Instrument 43-101 and employee of the Company, has reviewed, verified and approved the disclosure of the technical information contained in this news release.
About EMX. EMX is a precious and base metals royalty company. EMX’s investors are provided with discovery, development, and commodity price optionality, while limiting exposure to risks inherent to operating companies. The Company’s common shares are listed on the NYSE American Exchange and TSX Venture Exchange under the symbol “EMX”. Please see www.EMXroyalty.com for more information.
About Avesoro. Avesoro Resources Inc. is a leading West Africa-focused, privately owned mid-tier gold producer. Deeply committed to sustainable and responsible mining practices, Avesoro strives to create a diverse and inclusive workforce that adheres to strict environmental, social, and governance standards. Avesoro is recognized for its exceptional technical expertise and broad commercial and financial capabilities that span exploration, engineering, construction, and mine operations. Please see www.avesoro.com for more information.
Neither the TSX Venture Exchange nor its Regulation Services Provider (as that term is defined in policies of the TSX Venture Exchange) accepts responsibility for the adequacy or accuracy of this release
Forward-Looking Statements
This news release may contain “forward looking statements” that reflect the Company’s current expectations and projections about its future results. These forward-looking statements may include statements regarding perceived merit of properties, exploration results and budgets, mineral reserves and resource estimates, work programs, capital expenditures, timelines, strategic plans, market prices for precious and base metal, or other statements that are not statements of fact. When used in this news release, words such as “estimate,” “intend,” “expect,” “anticipate,” “will”, “believe”, “potential” and similar expressions are intended to identify forward-looking statements, which, by their very nature, are not guarantees of the Company’s future operational or financial performance, and are subject to risks and uncertainties and other factors that could cause the Company’s actual results, performance, prospects or opportunities to differ materially from those expressed in, or implied by, these forward-looking statements. These risks, uncertainties and factors may include, but are not limited to unavailability of financing, failure to identify commercially viable mineral reserves, fluctuations in the market valuation for commodities, difficulties in obtaining required approvals for the development of a mineral project, increased regulatory compliance costs, expectations of project funding by joint venture partners and other factors.
Readers are cautioned not to place undue reliance on these forward-looking statements, which speak only as of the date of this
news release or as of the date otherwise specifically indicated herein. Due to risks and uncertainties, including the risks and uncertainties identified in this news release, and other risk factors and forward-looking statements listed in the Company’s MD&A for the quarter ended March 31, 2025 (the “MD&A”), and the most recently filed Annual Information Form (“AIF”) for the year ended December 31, 2024, actual events may differ materially from current expectations. More information about the Company, including the MD&A, the AIF and financial statements of the Company, is available on SEDAR at www.sedarplus.ca and on the SEC’s EDGAR website at www.sec.gov.
Figure 1: location map for EMX exploration projects in Morocco
VANCOUVER, BRITISH COLUMBIA / ACCESS Newswire / July 7, 2025 / Empress Royalty Corp. (TSXV:EMPR)(OTCQX:EMPYF) (“Empress Royalty” or the “Company“) is pleased to announce it executed a binding term sheet (the “Term Sheet“) on July 4, 2025 with Milford Mining Company Utah, LLC (“Milford Mining“) to purchase a 5% royalty (the “Royalty“) on the gross gold and silver ounces produced and sold from the Milford Copper Mine (the “Mine“), located in Milford near Beaver County, Utah, USA for US$3,000,000.
Milford Mining advises that it intends to use the proceeds from the sale of the Royalty to increase the production capacity of the Mine to meet the growing global demand for copper.Since acquiring the Mine in 2023, Milford Mining has focused on revitalizing processing infrastructure and implementing sustainable mining practices to enhance operational efficiency at the Mine. The planned expansion aims to scale operations, exploring new targets across the mineralized district, and enhance infrastructure to support future growth.
“This transaction represents a significant milestone for Empress – our first US royalty and a highly strategic addition to our portfolio of precious metal royalties and streams,” stated Alexandra Woodyer Sherron, CEO & President of Empress Royalty. “The Milford Copper Mine offers near-term production, a scalable restart plan, and valuable gold and silver by-products that align with our core investment thesis. We structured the royalty to reflect our disciplined approach to capital allocation, and we expect to fund the investment using our existing cash and precious metal holdings. We are excited to support Milford Mining and look forward to closing the transaction in the near future.”
The closing and funding of the Royalty are subject to the execution of a definitive agreement (the “Definitive Agreement“) between the Company and Milford. Certain key terms that have been agreed include:
The Royalty is a 5% royalty on the gross gold and silver ounces produced and sold from the Mine.
The purchase price for the Royalty is US$3,000,000 payable to Milford Mining at closing.
The Royalty will terminate when the payments made to Empress total US$12,000,000.
If certain minimum monthly gold and silver sales are not achieved by Milford Mining, Empress will receive a payment to top it up to the amount of the Royalty payments it would have received had these minimum sales levels been met.
Funding is subject to customary conditions precedent, including the finalization and execution of documentation and the provision of customary legal opinions.
ABOUT EMPRESS ROYALTY CORP.
Empress is a global royalty and streaming creation company providing investors with a diversified portfolio of gold and silver investments. Empress has built a portfolio of precious metal investments and is actively investing in mining companies with development and production stage projects who require additional non-dilutive capital. The Company has strategic partnerships with Endeavour Financial and Terra Capital which allow Empress to not only access global investment opportunities but also bring unique mining finance expertise, deal structuring and access to capital markets. Empress is looking forward to continuously creating value for its shareholders through the proven royalty and streaming models.
Neither the TSX Venture Exchange nor its Regulation Services Provider (as that term is defined in the policies of the TSX Venture Exchange) accepts responsibility for the adequacy or accuracy of this press release.
The information contained herein includes “forward-looking statements” and “forward looking information” as defined under applicable Canadian securities laws (“forward-looking statements”). Forward-looking statements and information can generally be identified by the use of terms such as “may”, “will”, “should”, “expect”, “intend”, “estimate”, “continue”, “believe”, “plans”, “anticipate” or similar terms.
Forward-looking information and statements include, but are not limited to, statements with respect to the activities, events or developments that Empress Royalty Corp. (“Empress” or the “Company”) expects or anticipates will or may occur in the future, including those regarding future growth and ability to create new streams or royalties, the development and focus of the Company, its acquisition strategy, the plans and expectations of the operators of the projects underlying its interests, including the proposed advancement and expansion of such projects; the results of exploration, development and production activities of the operators of such projects; and the Company’s expectations regarding future revenues.
Forward-looking information and statements are based on the then current expectations, beliefs, assumptions, estimates and forecasts about Empress’s business and the industry and markets in which it operates. Forward-looking information and statements are made based upon numerous assumptions and although the assumptions made by the Company in providing forward-looking information and statements are considered reasonable by management at the time, there can be no assurance that such assumptions will prove to be accurate. Forward-looking information and statements also involve known and unknown risks and uncertainties and other factors, which may cause actual results, performances and achievements of Empress to differ materially from any projections of results, performances and achievements of Empress including, without limitation, any inability of the operators of the properties underlying the Company’s royalty and stream interests to execute proposed plans for such properties or to achieve planned development and production estimates and goals, risks related to the operators of the projects in which the Company holds interests, including the successful continuation of operations at such projects by those operators, risks related to exploration, development, permitting, infrastructure, operating or technical difficulties on any such projects, risks related to international operations, government relations and environmental regulation, uncertainty relating to the availability and costs of financing needed in the future and the Company’s ability to carry out its growth plans and other related risks and uncertainties. For a discussion of important factors which could cause actual results to differ from forward-looking statements, refer to the annual information form of Empress for the year ended December 31, 2024 and its other publicly filed documents under its profile at www.sedarplus.ca. Although the Company has attempted to identify important factors that could cause actual results to differ materially from those contained in the forward-looking information and statements, there may be other factors that cause results not to be as anticipated, estimated, or intended. There can be no assurance that forward-looking information and statements will prove to be accurate, as actual results and future events could differ materially from those anticipated, estimated or intended. Accordingly, readers should not place undue reliance on forward-looking information and statements. The Company undertakes no obligation to update or reissue forward-looking information as a result of new information or events except as required by applicable securities laws. Disclosure relating to properties in which Empress holds royalty or stream interests is based on information publicly disclosed by the owners or operators of such properties. The Company generally has limited or no access to the properties underlying its interests and is largely dependent on the disclosure of the operators of its interests and other publicly available information. The Company generally has limited or no ability to verify such information. Although the Company does not have any knowledge that such information may not be accurate, there can be no assurance that such third-party information is complete or accurate. In addition, certain information publicly reported by operators may relate to a larger property than the area covered by the Company’s interest, which often may only apply to a portion of the overall project area or applicable mineral resources or reserves.
July 7, 2025 – Vancouver, BC: Riverside Resources Inc.(“Riverside” or the “Company”) (TSX-V: RRI) (OTCQB: RVSDF) (FSE: 5YY), is pleased to provide shareholders with an update on exploration progress at the Union Gold-Silver Project in Sonora, Mexico. The project is under option to Questcorp Mining Inc. (“Questcorp”) who recently announced the commencement of their Phase 1 field program (see Questcorp release dated June 24, 2025).
As part of the advancing exploration program, Riverside and Questcorp are lining up for the first-ever drill program at Union, which will follow up on new geophysical and geochemical surveys that have confirmed and refined high-priority mineral exploration Carbonate Replacement Deposit (CRD) targets for gold and base metals. The initial program will comprise over 1,500 metres of diamond drilling with possibly approximately 7 holes ranging from 150-350m per hole designed to test at least three historic mine areas including the Union, North Union, and Famosa zones. Historical records suggest these zones previously produced an estimated 50,000 ounces gold equivalent, primarily from shallow, inclined shafts exploiting mantos and chimney structures of gold-richCRD-style systems summarized in the published National Instrument 43-101 technical report filed by Questcorp on Sedar+ May 7, 2025.
“With drill targets now defined by first ever ground and airborne detailed geophysics, further supported by surface sampling, the Union Project is now entering an exciting new phase of exploration,” said John-Mark Staude, President & CEO of Riverside Resources. “This will be the first-ever drill program on a historically productive but underexplored system at Union and we believe there’s real potential for a meaningful discovery. We’re pleased to be working with the Questcorp team as both technical collaborators and significant shareholders, with our stake in Questcorp increasing potentially to 19.9% over time. It’s a strong alignment, and we’re excited to help unlock the value we believe this district holds.”
Riverside has completed an initial Induced Polarization (IP) geophysics orientation line over the Union Mine, along with a second line over the Union North Mine. These surveys provide valuable conductivity and resistivity data, which can support a more extensive IP program following the upcoming drill campaign. The IP is successfully imaging key resistivity and chargeability features at depth to guide drill collar placement for some of the initial drill holes. The IP profiles correlate with mapped mineralized zones and former workings, helping refine the orientation and location of the planned drill pads. An airborne drone magnetic survey was completed over the property to provide structural context, follow up potential intrusive feeders and give information about pediments and potential faults beneath the post-mineral young cover units. Figure 1: Cross section IP with interpreted structures and ltargets from Union new Induced Polarity geophysics survey.Ongoing surface geochemistry and mapping continues to strengthen the targeting pipeline, particularly across exposed gold-rich manto zones and along the margins of shallow post-mineral gravel cover. These efforts are focused on delineating the transition zones from covered to exposed mineralization and establishing structural controls that may influence ore continuity at depth.
Mexico Portfolio Update: Riverside Resources has received formal notice from Fortuna Mining, via its Mexican subsidiary Monumental Minerals, that it has completed Phase 2 exploration work at the Cecilia Project in Sonora, Mexico and will not be proceeding with the option agreement. As a result, Fortuna has not earned any interest in the project. Per the termination terms, Fortuna will cover applicable project-related costs, including taxes and other expenses, for the next six months. Riverside now regains full control of the Cecilia Project and is free to advance the drill-ready targets developed to date or market the opportunity to new potential partners. Over the past year, exploration activities, including drilling, identified gold mineralization in multiple holes and defined several high-priority targets. Most recently, Riverside completed an additional C$300,000 in target advancement work through the existing agreement, which has further refined drill targets now ready for follow-up.
Riverside maintains a strong portfolio of partner-funded projects across Mexico and Canada and is pleased to see continued momentum from its partners, including Questcorp, to unlock the potential of quality, earlier-stage assets like Union.
Upcoming Rick Rule Investor Conference Attendance Riverside will be a sponsor at the Rule Symposium 2025, taking place from July 7 to July 11 in Boca Raton, Florida. The Company welcomes investors and stakeholders to visit us at Booth #30 or connect with us online to meet the team and hear more about ongoing initiatives, including the Union Project, the recent Blue Jay Gold spinout and other portfolio developments. We welcome any inquiries to info@rivres.com.
Qualified Person & QA/QC: The scientific and technical data contained in this news release pertaining to the Union Project was reviewed and approved by Freeman Smith, P.Geo, a non-independent qualified person to Riverside Resources, who is responsible for ensuring that the information provided in this news release is accurate and who acts as a “qualified person” under National Instrument 43-101 Standards of Disclosure for Mineral Projects.
About Riverside Resources Inc.: Riverside is a well-funded exploration company driven by value generation and discovery. The Company has a strong balance sheet, no debt, and fewer than 75 million shares outstanding, supported by a robust portfolio of gold-silver and copper assets and royalties across North America. Riverside has extensive experience and knowledge operating in Mexico and Canada and leverages its large database to generate a portfolio of prospective mineral properties. Riverside has properties available for option, with information available on the Company’s website at www.rivres.com. ON BEHALF OF RIVERSIDE RESOURCES INC.
“John-Mark Staude”
Dr. John-Mark Staude, President & CEO
For additional information contact:John-Mark Staude President, CEO Riverside Resources Inc.info@rivres.comPhone: (778) 327-6671 Fax: (778) 327-6675 Web: www.rivres.comEric Negraeff Investor Relations Riverside Resources Inc. Phone: (778) 327-6671 TF: (877) RIV-RES1 Web: www.rivres.comCertain statements in this press release may be considered forward-looking information. These statements can be identified by the use of forward-looking terminology (e.g., “expect”,” estimates”, “intends”, “anticipates”, “believes”, “plans”). Such information involves known and unknown risks — including the risk that the Transaction will not be completed as contemplates, or at all, availability of funds, the results of financing and exploration activities, the interpretation of exploration results and other geological data, or unanticipated costs and expenses and other risks identified by Riverside in its public securities filings that may cause actual events to differ materially from current expectations. Readers are cautioned not to place undue reliance on these forward-looking statements, which speak only as of the date of this press release.Neither the TSX Venture Exchange nor its Regulation Services Provider (as that term is defined in the policies of the TSX Venture Exchange) accepts responsibility for the adequacy or accuracy of this release.The Communications Team Riverside Resources Inc. info@rivres.com Phone: (778) 327-6671 x 312 Toll Free: 1-877-RIV-RES1 (748-7371) Web: www.rivres.com