Rocket-free reusable Mach 4+ launches and 90-minute relaunchs open path to affordable, repeatable and scalable hypersonic and suborbital missions
What changes the conversation is this: we took a reusable launch system beyond Mach 4 twice before lunch. We’re building a system designed to launch again and again.”
— Mark Russell, CEO General Hypersonics
SPOKANE, WA, UNITED STATES, June 5, 2026 /EINPresswire.com/ — HyperSciences, Inc., doing business as General Hypersonics, successfully conducted two launches exceeding Mach 4 from the same reusable launch system, with the second launch occurring approximately 90 minutes after the first. The achievement sets another ram-accelerated mass-to-velocity milestone and advances the company’s goal of making high-cadence hypersonic and suborbital launch operations affordable and repeatable. The flights were conducted under the company’s U.S. Department of Defense Phase II Small Business Innovation Research (SBIR) contract, awarded in 2025.
Mach 4 (about 3,100 mph) is more than four times the speed of sound, while hypersonic flight is generally defined as Mach 5 and above. At Mach 4, a vehicle could theoretically travel across the continental United States in less than an hour, illustrating the significance of sustained high-speed flight.
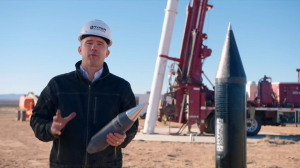
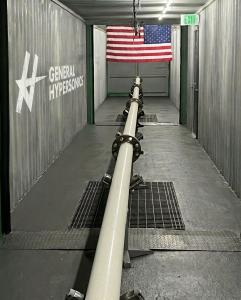
General Hypersonics Ram Accelerator at HyperLab
The demonstration highlights a fundamentally different approach to flight testing: the ability to rapidly reset, reload and relaunch the same reusable system multiple times per day. As government and commercial organizations seek more affordable access to high-speed testing and more responsive paths to space, higher launch cadence has the potential to accelerate technology development, expand testing capacity and reduce costs.
While many high-speed and hypersonic test programs rely on complex launch infrastructure, including carrier aircrafts and rocket boosters, and specialized ranges and extensive mission planning, General Hypersonics completed both launches from the same reusable platform in approximately 90 minutes. Both launches were conducted using manual loading procedures, with automated loading systems currently under development to further improve turnaround times and increase launch cadence.
“What changes the conversation is this: we took a reusable launch system beyond Mach 4 twice before lunch,” said Mark Russell, founder and chief executive officer of General Hypersonics. “Most launch systems are designed around a single mission. We’re building a system designed to launch again and again. That’s what ultimately enables more affordable testing, faster technology development and a practical path toward responsive access to space.”
Funded through private investment and government contracts and grants, the company’s ram accelerator technology accelerates payloads through a reusable launch tube powered by clean combustible gases — eliminating the need for a first-stage rocket booster and toxic propellants. Designed to reload quickly, launch frequently and operate from fixed or mobile sites on land or at sea, the platform is being developed and tested at HyperLab, General Hypersonics’ reusable open-air launch facility.
Today’s record builds on a series of firsts: the company’s ongoing DoD contract with earlier Mach 3 flight milestones, onboard electronics carried successfully through the tube, and clean payload separation. It also follows the company’s selection earlier this year as a prime awardee on the Missile Defense Agency’s SHIELD IDIQ contract vehicle, and a NASA Phase I vertical launch that proved the system’s scalability toward space. The company is actively engaging government, commercial and research customers seeking affordable access to repeatable high-speed flight-testing environments.
With Mach 4 repeatability now demonstrated, General Hypersonics is turning its focus to increasing automation, expanding flight operations and moving beyond high-speed testing into routine suborbital flight operations.
“Our goal isn’t simply to go faster,” Russell said. “It’s to make high-speed flight and access to space more routine. The next step is demonstrating that we can move from repeatable Mach 4 launches to repeatable suborbital operations. What’s ahead is our 10-in-10 campaign — 10 launches to suborbital space in 10 days. If we can achieve that, it changes what’s possible for hypersonic testing, scientific missions, and responsive access to space.”
For investor and partnership inquiries, contact investors@generalhypersonics.com.
EIN Presswire provides this news content “as is” without warranty of any kind. We do not accept any responsibility or liability for the accuracy, content, images, videos, licenses, completeness, legality, or reliability of the information contained in this article. If you have any complaints or copyright issues related to this article, kindly contact the author above.
South Jordan, Utah and Vancouver, British Columbia–(Newsfile Corp. – June 4, 2026) – Sage Potash Corp. (TSXV: SAGE) (OTCQB: SGPTF) (“Sage Potash” or the “Company”) announces revised terms to the Plant and Equipment Purchase with International Process Plants and Equipment Corp. (“IPP”) which had a previous effective date of July 1, 2025 as disclosed in the Company’s quarterly financial statement (see September 30, 2025 financial statements filed on Sedar+) and originally announced September 8, 2024 (the “June 4th Purchase Agreement”).
The plant and equipment consist of refurbished and used equipment that IPP stores in the Netherlands and the United States. It consists of three evaporators that together could form a triple effect evaporator system, three crystallizers and various ancillary equipment including pumps, centrifuges and tanks. When installed in a unified manner, the equipment makes up a plant that could process brines with a design capacity of up to 300,000 tonnes per year of potash output.
TERMS
The June 4th Purchase Agreement confirms the purchase price of € 11 million (the “Purchase Price”) and includes the following core terms:
The Company will make a current payment of € 1,280,000 (note: the Company has previously made deposits of € 838,000);
Of the current payment, the parties will apply € 987,000 to the principal balance of the Purchase Price and € 293,000 to storage fees and interest. The balance of the Purchase Price after this current payment will therefore be € 9,173,000;
Payment of current and future storage fees of € 11,900 per month;
Recognition of € 555,000 in accrued but unpaid interest and payment of some or all of this amount between now and October 2026 from any cash inflows from financing activities including any proceeds of warrant or option exercises (the “Interim Paydown”);
From the Company’s next financing, if conducted before April 2027, payment of € 555,000 less the Interim Paydown and allocation of 20% of the financing proceeds towards the balance of the Purchase Price; and
The Company must pay the balance of the Purchase Price by April 30, 2027, with an outside date of July 15, 2027.
In a separate agreement that is subject to TSX-V approval, Sage Potash and IPP have agreed that up until the balance of the Purchase Price is paid, IPP will have the right to convert up to 50% of the then balance of the Purchase Price into common shares at C$0.25/share, subject to a maximum share issuance to IPP of 15% of the Company’s then issued and outstanding common shares.
OVERALL STRATEGY
Management and the Board’s primary objective remains the successful completion of the Company’s Summer 2026 drill program at the Sage Plain Potash Project, aimed at expanding the resource footprint and increasing overall resource confidence levels. Upon completion of the program, the Company intends to engage independent consultants to prepare an updated resource estimate incorporating the newly acquired drilling data.
With an updated resource in hand, Sage Potash plans to advance into various engineering and technical studies leading toward a Pre-Feasibility Study (“PFS”), and ultimately a Feasibility Study (“FS”). Management is evaluating development scenarios significantly larger than the initial 150,000 to 300,000 tonne-per-year operation contemplated in the Company’s September 2025 Preliminary Economic Assessment (“PEA”).
Importantly, the September 2025 PEA already contemplated the use of the processing plant equipment that is the subject of the Company’s June 4th Purchase Agreement.
Management believes securing this equipment under the June 4th Purchase Agreement provides Sage Potash with significant strategic optionality as the Company advances toward potential production. While certain equipment components could support a unified pilot-scale or initial production operation, they could also be integrated into a substantially larger-scale development scenario. This flexibility is expected to enhance project scalability while potentially accelerating the timeline between feasibility studies, construction, and the commencement of production.
RATIONALE OF THE PURCHASE TERMS
The equipment and plant purchase terms scale the Company’s capital requirement in sync with the timing of developing a larger resource and moving the project through PFS and FS stages. Further, IPP initiated the discussion to have an avenue to become a meaningful shareholder in the Company in relation to the plant and equipment purchase. This engenders not only tremendous alignment but also shows strong belief in the Sage Plain Project and management’s advancement plan. We thank IPP for their patience and diligence in working with us to revise the June 4th Purchase Agreement for mutual benefit.
About Sage Potash Corp.
Sage Potash Corp. (TSXV: SAGE) (OTCQB: SGPTF) is dedicated to the development of its flagship Sage Plain Potash Project, located in the Paradox Basin, Utah. With a large and high-grade resource base, the Company is advancing toward its goal of establishing a secure and sustainable domestic potash production platform in the United States. Sage Potash is committed to food security, environmental stewardship, and creating value for shareholders and stakeholders alike.
On Behalf of the Board of Directors, J. Patricio Varas, CEO and Director 1 (236) 521-1521 Website: www.sagepotash.com
For media inquiries, please contact: Marcus van der Made, Investor Relations IR@sagepotash.com
Neither the TSX Venture Exchange nor its Regulation Services Provider (as that term is defined in the policies of the TSX Venture Exchange) accepts responsibility for the adequacy or accuracy of this release.
This news release contains “forward-looking information” and “forward-looking statements” within the meaning of applicable securities legislation. The forward-looking statements herein are made as of the date of this news release only, and the Company does not assume any obligation to update or revise them to reflect new information, estimates or opinions, future events or results or otherwise, except as required by applicable law. Often, but not always, forward-looking statements can be identified by the use of words such as “plans”, “expects”, “is expected”, “budgets”, “scheduled”, “estimates”, “forecasts”, “predicts”, “projects”, “intends”, “targets”, “aims”, “anticipates” or “believes” or variations (including negative variations) of such words and phrases or may be identified by statements to the effect that certain actions “may”, “could”, “should”, “would”, “might” or “will” be taken, occur or be achieved. Forward-looking information in this news release includes, but is not limited to, statements with respect to future events or future performance of Sage Potash, including making certain future payments, conducting updated resource calculations, engineering studies, feasibility studies, pilot production and commercial production. Forward-looking statements and information are subject to various known and unknown risks and uncertainties, many of which are beyond the ability of the Company to control or predict, that may cause the Company’s actual results, performance or achievements to be materially different from those expressed or implied thereby, and are developed based on assumptions about such risks, uncertainties and other factors set out herein, including, but not limited to, the risk factors set out under the heading “Risk Factors and Uncertainties” in the Company’s Management’s Discussion & Analysis available for review under the Company’s profile at www.sedarplus.ca. Such forward-looking information represents management’s best judgement based on information currently available. No forward-looking statement can be guaranteed and actual future results may vary materially. Accordingly, readers are advised not to place undue reliance on forward-looking statements or information.
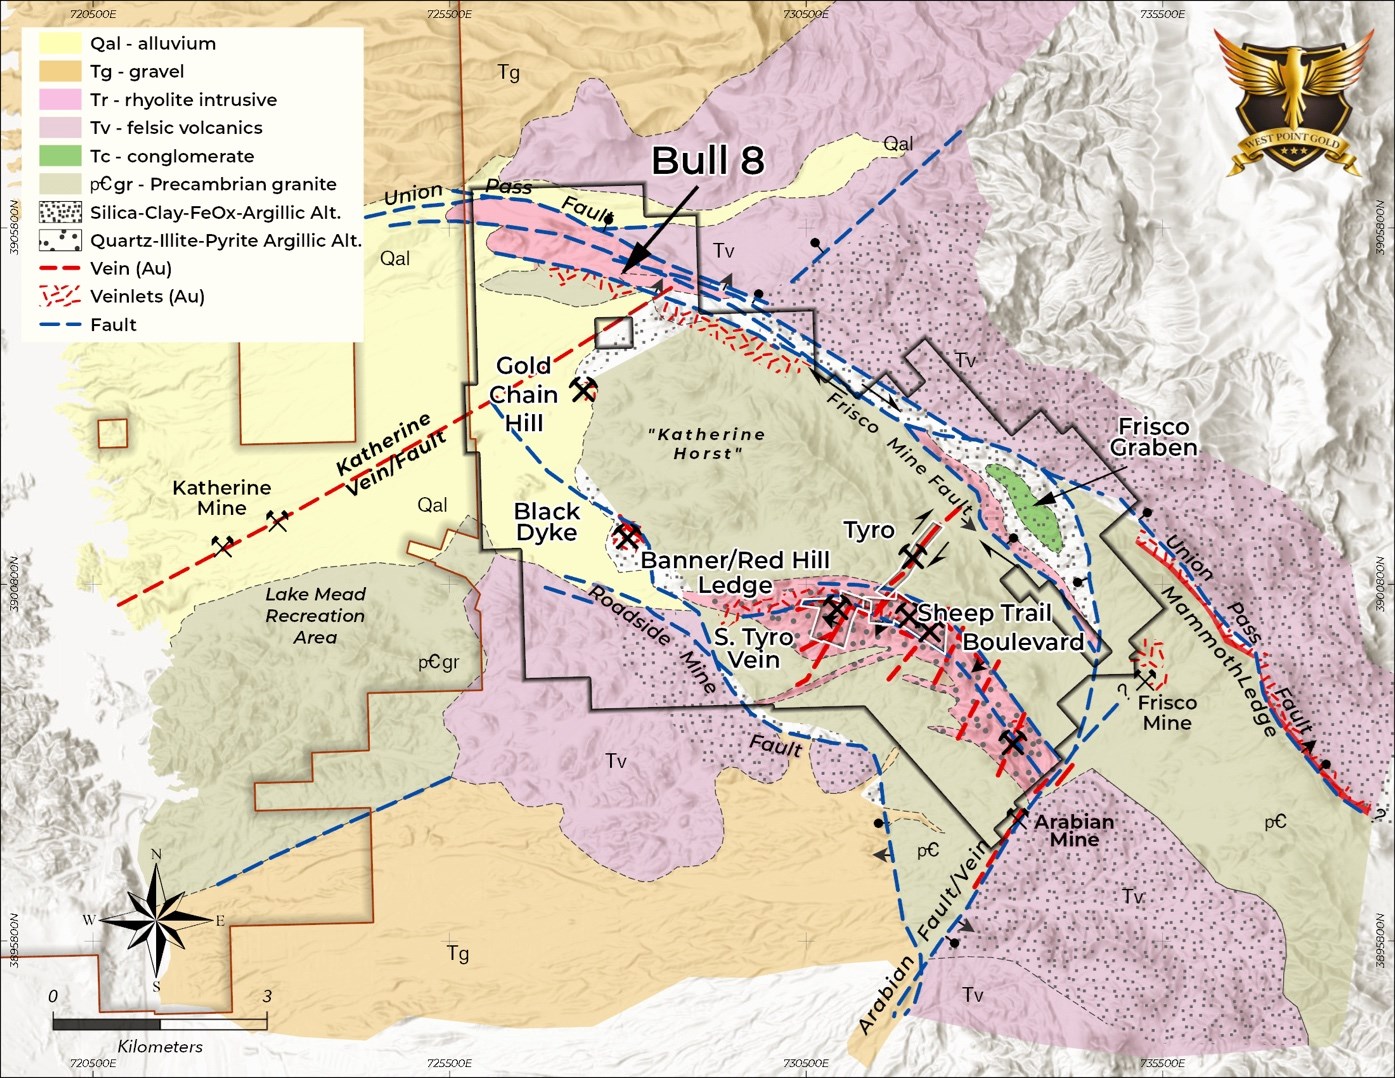
Vancouver, British Columbia–(Newsfile Corp. – June 4, 2026) – West Point Gold Corp. (TSXV: WPG) (OTCQX: WPGCF) (FSE: LRA0) (“West Point Gold” or the “Company”) is pleased to announce results from its property-wide target testing program. The initial drilling campaign into the Union Pass Fault Corridor at the Bull 8 target returned significant gold values highlighted by a 21.4 metre (“m”) broad interval of gold (“Au”) mineralization at 1.01 grams per tonne (“g/t”). The Bull 8 target is approximately 6 kilometres (“km”) northwest (“NW’) of the Tyro zone, outside of where the company is working on its upcoming maiden mineral resource estimate (“MRE”).
The Union Pass Fault is a major regional structural feature, with several associated faults mapped and sampled along its 12km strike length on the property. Initial drilling into the Union Pass Fault Corridor was targeted at Bull 8, which has several historical prospect pits and trenches. West Point Gold completed surface mapping and sampling in the area, which revealed a broad northwest-trending zone of highly prospective mineralization; rock types hosted within gold-bearing structures that have returned gold values greater than 2 g/t Au. Bull 8 is on the northwest portion of the Union Pass Fault Corridor, shown to be a controlling structure of the Frisco Graben.
To date, 20,116m of the ongoing drill program at the Gold Chain project has been completed. Results are pending from the Black Dyke, Tyro Main, and NE Tyro zones representing 35 holes (7,697m).
Highlights:
Hole GC26-136 returned 21.4m (18m true width) at 1.01g/t Au from 71.6m to 93.0m within a broadly mineralized envelope.
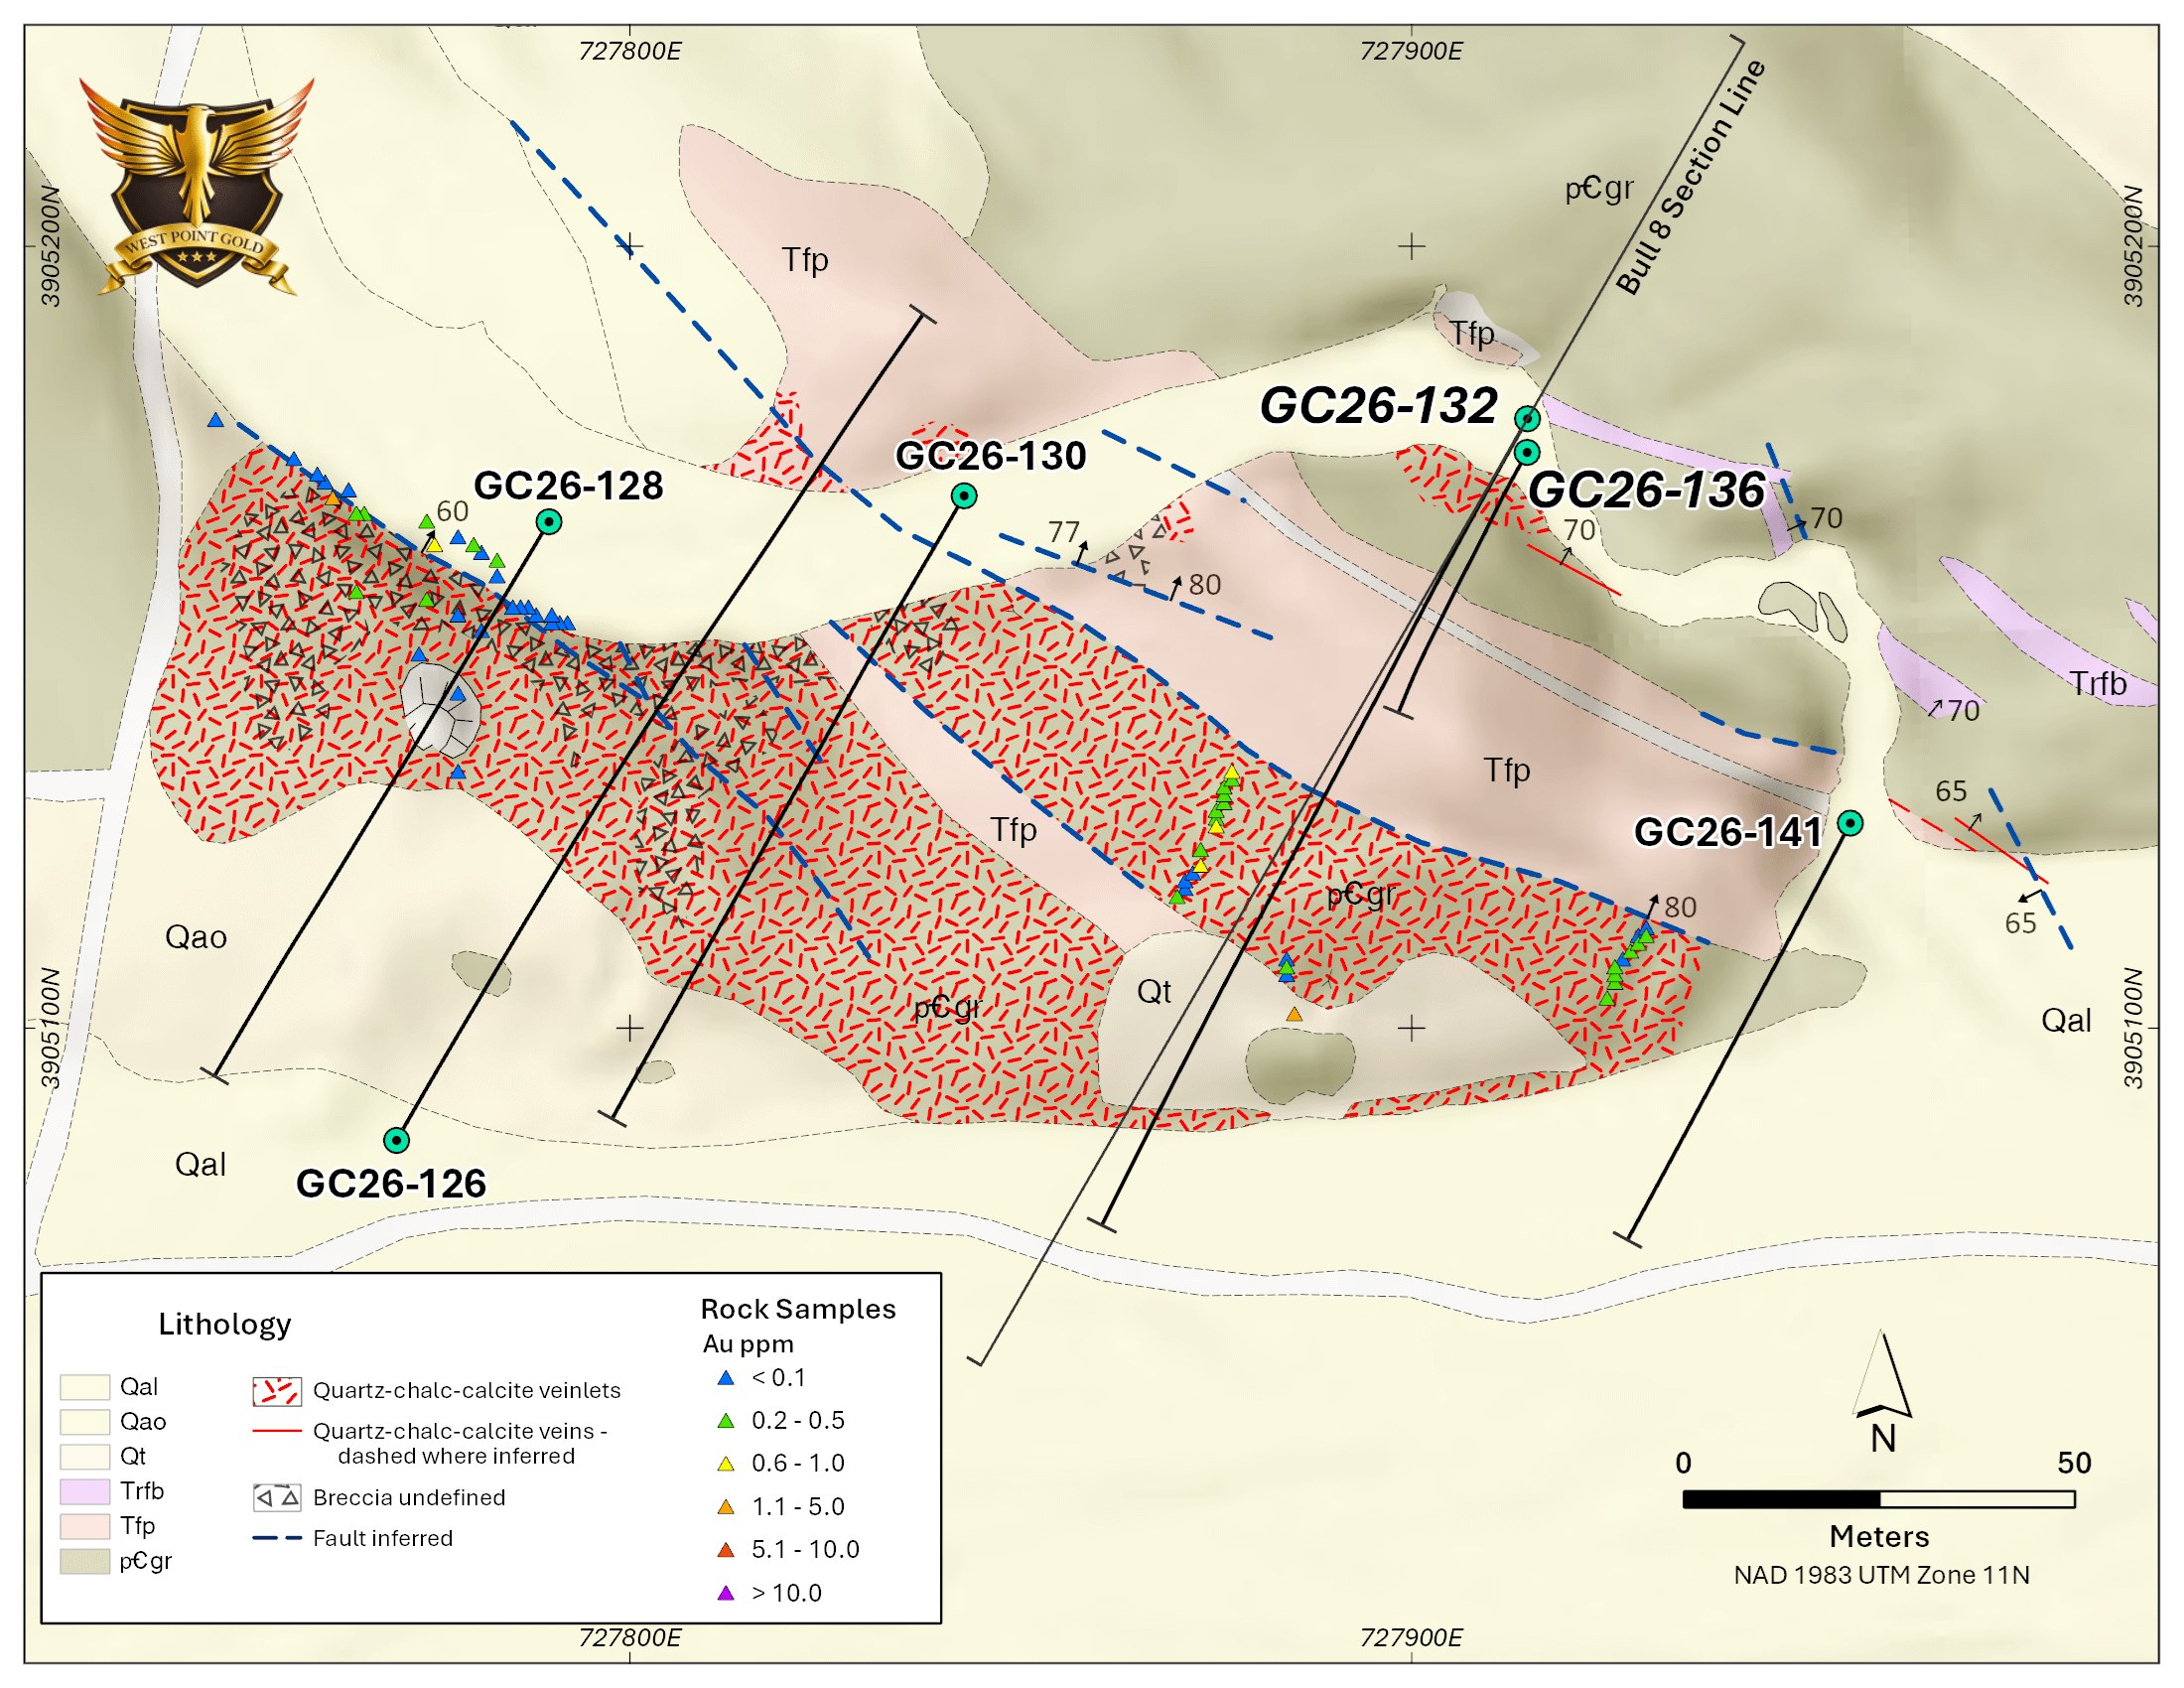
Hole GC26-130 returned 12.2m of 0.41g/t Au from 6.1m to 18.3m (Figure 2), identifying an extensive near surface lower grade zone.
The structural corridor that hosts the Bull 8 prospect also is one of the controlling features of the Frisco Graben. Extensive quartz veining, hydrothermal alteration and anomalous gold values can be observed over the entire 12kms.
All holes drilled across the Bull 8 prospect intersected gold mineralization.
“The significance of the results in GC26-136 has less to do with the significant gold values intersected and more to do with the structural setting. The Union Pass Fault Corridor, and the associated Frisco Mine fault are major regional structural features with approximately 12km of demonstrated strike length on Gold Chain. Exploration success at Bull 8 supports the Company’s view that these major features, which also control the Frisco Graben, appear to have played an important role in the mineralizing events at Gold Chain. We believe these results de-risk other targets along the Union Pass Fault Corridor, including the Frisco Graben,” stated Derek Macpherson, President and CEO.
Table 1: Drill Results
Holes
From (m)
To (m)
Width (m)
Grade (g/t Au)
GC26-126
118.9
182.9
64.0
0.12
GC26-128
No Significant Values
GC26-130
6.1
18.3
12.2
0.41
GC26-132
57.9
65.5
7.6
0.35
including
89.9
99.0
9.1
0.22
GC26-136
71.6
93.0
21.4
1.01
GC26-141
36.6
39.6
3.1
0.25
Note: All widths shown are downhole. True widths are estimated to be 80 to 90% of apparent widths except in GC26-126 which is about 25%.
Figure 1: Plan view of the Gold Chain project showing geology, historical mines and/or current prospects. Note the location of the Bull 8 prospect.
Figure 2. Geologic map of the Bull 8 prospect showing the NW-trending mineralized zone following the intensely broken and sheared Union Pass Fault Corridor. Also shown are the reported drill holes, Au-in-rock values and historical pits and trenches.
West Point Gold has recently completed an initial drilling campaign composed of 6 holes totalling 855.7m (Table 2) at Bull 8. The identification of broadly veined intervals at a dike/Precambrian contact within a regional shear zone hosting low-level gold values (100 to 500 ppb Au) suggests follow-up drilling is warranted. This structural corridor, which hosts widespread, high-level veining with anomalous gold values over several kilometres, hosts numerous additional targets. Hole GC26-136, the deepest hole drilled in this campaign, identified 21.4m at 1.01 g/t Au, supporting the Company’s belief that surface features are a manifestation of concealed gold mineralization.
The exploration conducted to date at the Bull 8 prospect, along with more regional geologic, geochemical, and geophysical studies, reveals that a regional northwest structural corridor is the dominant geologic feature. The Bull 8 prospect is a small hill surrounded (Figure 2) on 3 sides by Quaternary alluvium. This hill is traversed by several fault-bounded dikes emplaced into widely sheared, brecciated and altered Precambrian granite, which has been tested by several historical pits, adits and trenches; surface gold values are up to 2.09 g/t Au. The dikes and confining structures dip steeply to the north-northeast and are consistent with attitudes seen along the Union Pass Fault
Corridor (including the Frisco Mine Fault) across the Gold Chain project (about 12km). Throughout the entire strike length documented by West Point Gold, the hanging wall (HW) is strongly altered to silica + clay + hematite (steam-heated environment), whereas the footwall (FW) (generally Precambrian granite) is propylitized. Quartz veinlets and cemented breccias are also widespread and commonly anomalous in gold.
Exposures of the mineralized zone at Bull 8 reveal strongly sheared and brecciated Precambrian granite hosting both quartz vein fragments and quartz-chalcedony veinlets and silicification. The sheared and brecciated rocks contained abundant iron oxides, which were observed in all of the drill holes. The highly variable appearance of the mineralized zone, including quartz styles, textures and colours, suggests prolonged tectonism and mineralization, including widespread evidence of post-mineral movements. Distinct, continuous veins are not apparent.
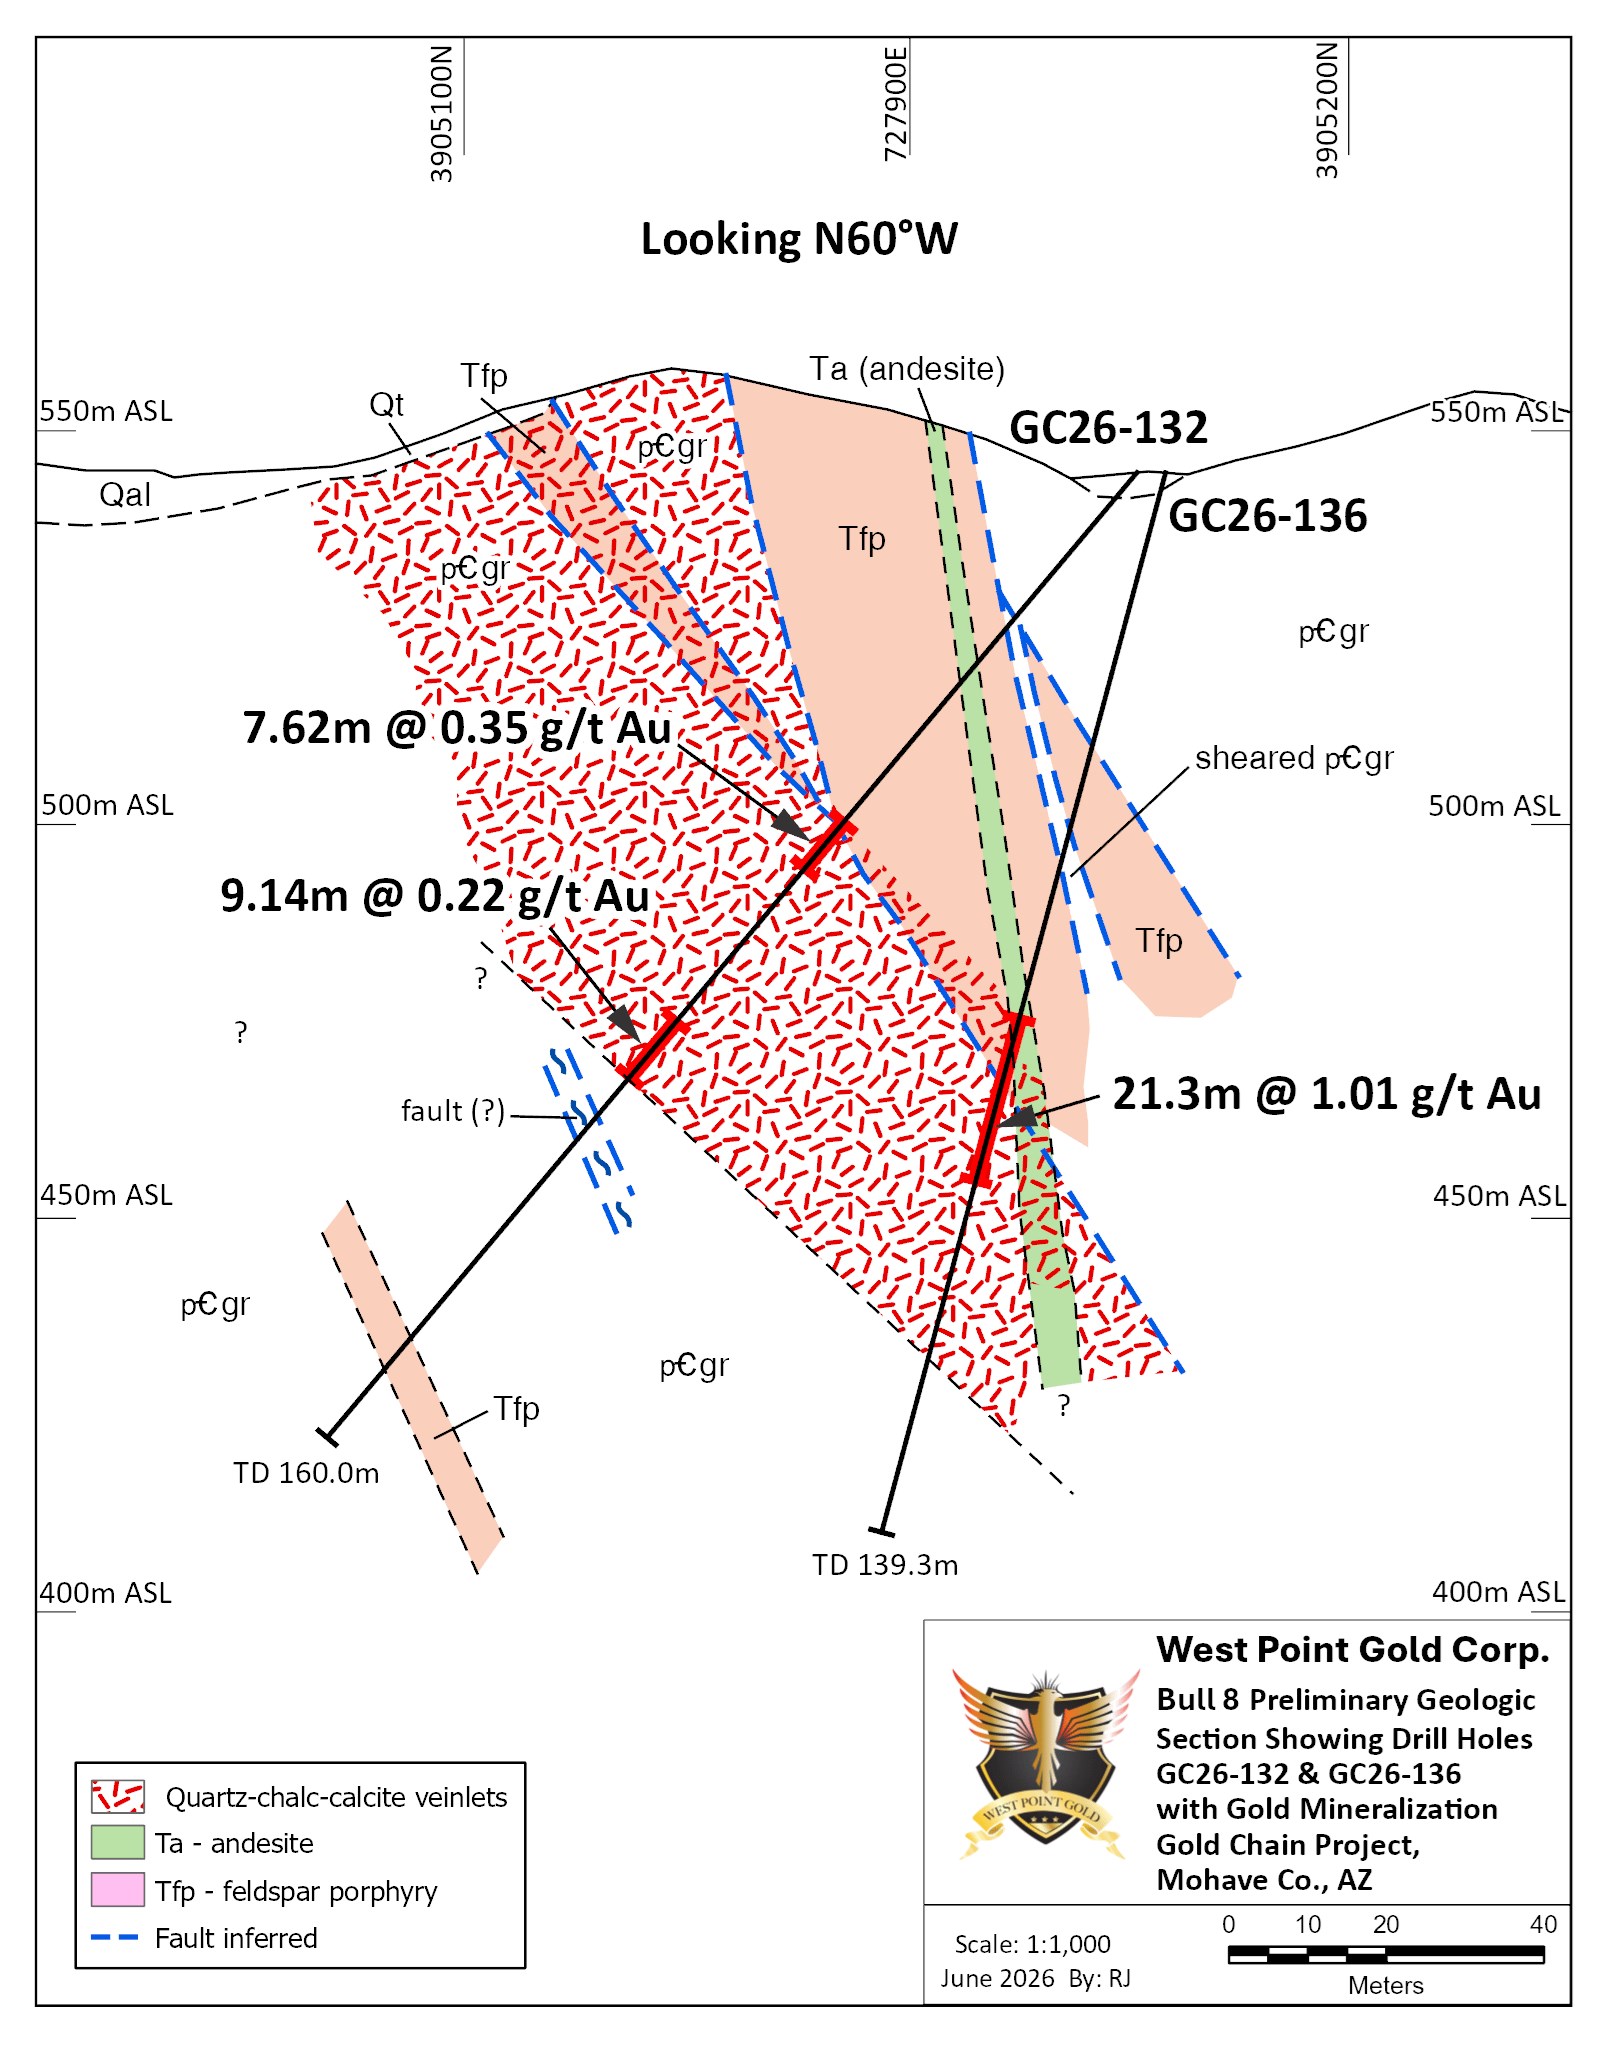
Figure 3. Geologic section drawn along Holes GC26-132 and GC26-136 showing felspar porphyry and andesite dikes emplaced into a shear zone. Gold mineralization is concentrated along the footwall contact of the dike complex.
Figure 3 provides a geologic sketch of the two deeper holes, GC26-132 and -136. The section reveals a close correlation between quartz veining, along with gold, and the footwall contact of a feldspar porphyry dike complex and the Precambrian granite. This contact, along with other dike contacts, are faults. Surface exposures of the dike do not reveal shearing, brecciation, or fracturing as seen in the surrounding Precambrian granite, suggesting that the dikes were emplaced into the structural corridor after much of the tectonism. Similar features have been observed several kilometres to the southeast, i.e. Frisco Graben and Tyro Vein, suggesting a prolonged structural history.
Importantly, Hole GC26-136 encountered gold grades up to 5.96 g/t Au and 21.4m at 1.01 g/t Au from 70.6 to 93.0m. Approximately 50m above (Figure 3), Hole GC26-132 encountered a broad zone of moderate to strong quartz veinlets with 7.62m at 0.35 g/t Au at the HW contact and 9.14m at 0.22 g/t Au along the FW; strongly anomalous gold values exist between the two intervals. Most importantly, veining appears to coalesce with depth, along with an increase in gold values. This scenario is similar to the uppermost NE Tyro vein where strongly altered, weakly mineralized rock sits immediately above broad widths and high gold grades.
Table 2: Drill hole locations and descriptions
Hole No.
Azimuth (degrees)
Inclination (degrees)
Easting
Northing
Length (m)
GC26-126
30
-50
727,770
3,905,087
181.4
GC26-128
210
-50
727,790
3,905,165
125.0
GC26-130
210
-50
727,843
3,905,168
138.7
GC26-132
210
-50
727,915
3,905,178
160.0
GC26-136
210
-75
727,915
3,905,174
139.3
GC26-141
210
-60
727,956
3,905,126
111.3
New Era Publishing Inc. marketing engagement
West Point Gold has engaged New Era Publishing Inc. (“New Era”), also doing business as Katusa Research, an arm’s-length service provider, to provide the Company certain investor relations and marketing services, in accordance with the policies of the TSX Venture Exchange and applicable securities laws. Based in Vancouver, BC, New Era specializes in media and investor relations services, within the natural resource sector. Under a consulting agreement dated May 27, 2026, New Era will provide media relations, investor communication and market awareness services to the Company for a three-month term for a one-time fee of $250,000 (U.S.), payable at the commencement of services. The Company will not issue any securities to New Era as compensation for its services. As of the date hereof, to the Company’s knowledge, New Era (including its directors and officers) does not own any securities of the Company. The marketing agreement with New Era is subject to TSX Venture Exchange approval.
Qualified Person Robert Johansing, M.Sc. Econ. Geol., P. Geo., the Company’s Vice President, Exploration, is a qualified person (“QP”) as defined by NI 43-101 and has reviewed and approved the technical content of this press release. Mr. Johansing has also been responsible for overseeing all phases of the drilling program, including logging, labelling, bagging and transport from the project to American Assay Laboratories of Sparks, Nevada. Drillholes have a diameter of about 10cm, and samples have an approximate weight of 5 to 10kg. Samples were then dried, crushed and split, and pulp samples were prepared for analysis. Gold was determined by fire assay with an ICP finish, and over-limit samples were determined by fire assay and gravimetric finish. Silver plus 15 other elements were determined by Aqua Regia ICP-AES (IM-2A16), and over-limit samples were determined by fire assay and gravimetric finish. Both certified standards and blanks were inserted on site along with duplicates, standards and blanks inserted by American Assay. The results summarized above have been carefully reviewed with reference to the QA/QC results. Standard sample chain of custody procedures were employed during drilling and sampling campaigns until delivery to the analytical facility.
About West Point Gold Corp. West Point Gold is an exploration and development company focused on unlocking value across four strategically located projects along the prolific Walker Lane Trend in Nevada and Arizona, USA, providing shareholders with exposure to multiple discovery opportunities across one of North America’s most productive gold regions. The Company’s near-term priority is advancing its flagship Gold Chain Project in Arizona.
For further information regarding this press release, please contact: Aaron Paterson, Corporate Communications Manager Phone: +1 (778) 358-6173 Email: info@westpointgold.com
FORWARD-LOOKING STATEMENTS: Certain statements contained in this press release constitute forward-looking information. These statements relate to future events or future performance. Forward-looking statements include estimates and statements that describe the Company’s future plans, objectives or goals, including words to the effect that the Company or management expects a stated condition or result to occur. The use of any of the words “could”, “intend”, “expect”, “believe”, “will”, “projected”, “estimated” and similar expressions and statements relating to matters that are not historical facts are intended to identify forward-looking information and are based on the Company’s current belief or assumptions as to the outcome and timing of such future events including, among others, assumptions about future prices of gold, silver, and other metal prices, currency exchange rates and interest rates, timing of the Company’s maiden resource estimate, favourable operating conditions, political stability, obtaining government approvals and financing on time, obtaining renewals for existing licenses and permits and obtaining required licenses and permits, labour stability, stability in market conditions, availability of equipment, availability of drill rigs, and anticipated costs and expenditures. The Company cautions that all forward-looking statements are inherently uncertain, and that actual performance may be affected by a number of material factors, many of which are beyond the Company’s control. Such factors include, among other things: risks and uncertainties relating to West Point Gold’s ability to complete any payments or expenditures required under the Company’s various option agreements for its projects; and other risks and uncertainties relating to the actual results of current exploration activities, the uncertainties related to resources estimates; the uncertainty of estimates and projections in relation to production, costs and expenses; risks relating to grade and continuity of mineral deposits; the uncertainties involved in interpreting drill results and other exploration data; the potential for delays in exploration or development activities; uncertainty related to the geology, grade and continuity of mineral deposits; the possibility that future exploration, development or mining results may vary from those expected; statements about expected results of operations, royalties, cash flows, financial position may not be consistent with the Company’s expectations due to accidents, equipment breakdowns, title and permitting matters, labour disputes or other unanticipated difficulties with or interruptions in operations, fluctuating metal prices, unanticipated costs and expenses, uncertainties relating to the availability and costs of financing needed in the future and regulatory restrictions, including environmental regulatory restrictions. The possibility that future exploration, development or mining results will not be consistent with adjacent properties and the Company’s expectations; operational risks and hazards inherent with the business of mining (including environmental accidents and hazards, industrial accidents, equipment breakdown, unusual or unexpected geological or structural formations, cave-ins, flooding and severe weather); metal price fluctuations; environmental and regulatory requirements; availability of permits, failure to convert estimated mineral resources to reserves; the inability to complete a feasibility study which recommends a production decision; the preliminary nature of metallurgical test results; fluctuating gold prices; possibility of equipment breakdowns and delays, exploration cost overruns, availability of capital and financing, general economic, political risks, market or business conditions, regulatory changes, timeliness of government or regulatory approvals and other risks involved in the mineral exploration and development industry, and those risks set out in the filings on SEDAR+ made by the Company with securities regulators. Although the Company believes that the assumptions and factors used in preparing the forward-looking information in this corporate press release are reasonable, undue reliance should not be placed on such information, which only applies as of the date of this news release, and no assurance can be given that such events will occur in the disclosed time frames or at all. The Company expressly disclaims any intention or obligation to update or revise any forward-looking statements whether as a result of new information, future events or otherwise, other than as required by applicable securities legislation.
Neither the TSX Venture Exchange nor its Regulation Services Provider (as that term is defined in the policies of the TSX Venture Exchange) accepts responsibility for the adequacy or accuracy of this release.
Vancouver, British Columbia–(Newsfile Corp. – June 2, 2026) – Questcorp Mining Inc. (CSE: QQQ) (OTCQB: QQCMF) (FSE: D910) (the “Company” or “Questcorp”) is pleased to provide an update on ongoing exploration activities at the La Union Gold-Silver Project in Sonora, Mexico, where the Company and its technical partner, Riverside Resources, have completed an expanded induced polarization (“IP”) geophysical survey designed to further refine drill targets ahead of the Company’s fully funded Phase 2 drill program.
Five IP lines were strategically positioned across key high-priority target areas identified through recent geological mapping, geochemical sampling, historical drilling, underground mine investigations, and the Company’s successful 2026 exploration campaign. The program represents the final stage of target refinement before drilling commences.
The successful IP continues a series of encouraging exploration results reported during the spring 2026 field program, including high-grade gold, silver, lead and zinc mineralization from the Union Mine, Union Norte, Javalí and Creston target areas. These results, combined with the recently completed district-wide structural reinterpretation and expanded aeromagnetic survey, continue to strengthen management’s confidence in the scale and discovery potential of the La Union Project.
Questcorp President and CEO Saf Dhillon added:
“The completion of this IP survey marks an important milestone as we move into what we believe will be the most exciting phase in the evolution of the La Union Project. Over the past several months, our team has systematically expanded the project’s opportunity set through new discoveries, high-grade sampling results, structural reinterpretation and now targeted geophysics. What is particularly exciting is that every layer of work continues to point toward a larger mineralized system than originally recognized.
With permits secured, funding in place, contractors engaged and drill targets being refined in real time, we are now on the threshold of our Phase 2 drill program. We believe the upcoming drilling campaign has the potential to be transformational for Questcorp as we begin testing multiple high-priority targets across this rapidly emerging district-scale gold and polymetallic system.”
John-Mark Staude, President and CEO of Riverside Resources, commented:
“We are pleased to continue advancing the La Union Project alongside Saf, Tim and the entire Questcorp team. The combination of high-grade surface results, expanding target areas and the geophysical responses we are seeing from the current IP survey provides a compelling framework for the next phase of drilling. The project continues to demonstrate the characteristics of a large mineralized system with significant exploration upside.”
IP coverage across the Union Mine area successfully highlighted conductive zones coincident with previous drilling and known mineralization while also identifying potential extensions beyond historically tested areas. Equally important, the northern portion of the property has now been surveyed for the first time, generating several new geophysical targets that will be evaluated as part of the upcoming drill campaign.
The IP survey enhanced the Company’s understanding of the structural and geological controls associated with both carbonate replacement (“CRD”) style mineralization and the emerging sediment-hosted gold targets identified across the broader project area. Conductive responses along all five survey lines are providing additional vectors for drill targeting and further supporting the district-scale exploration potential at La Union.
Qualified Person
The technical content of this news release has been reviewed and approved by R. Tim Henneberry, P. Geo (BC), a Director of the Company and a Qualified Person under National Instrument 43-101 – Standards of Disclosure for Mineral Projects.
About Questcorp Mining Inc.
Questcorp is engaged in the business of the acquisition and exploration of mineral properties in North America, with the objective of locating and developing economic precious and base metal properties of merit. The Company holds an option to acquire an undivided 100-per-cent interest in and to mineral claims totalling 1,168.09 hectares comprising the North Island Copper property, on Vancouver Island, B.C., subject to a royalty obligation. The Company also holds an option to acquire an undivided 100-per-cent interest in and to mineral claims totalling 2,520.2 hectares comprising the La Union project located in Sonora, Mexico, subject to a royalty obligation.
This news release includes certain “forward-looking statements” under applicable Canadian securities legislation. Forward-looking statements include, but are not limited to, statements with respect to the intended use of proceeds from the Offering; and closing of subsequent tranches of the Offering. Forward-looking statements are necessarily based upon a number of estimates and assumptions that, while considered reasonable, are subject to known and unknown risks, uncertainties, and other factors which may cause the actual results and future events to differ materially from those expressed or implied by such forward-looking statements. Such factors include, but are not limited to general business, economic, competitive, political and social uncertainties, uncertain capital markets; and delay or failure to receive board or regulatory approvals. There can be no assurance that such forward-looking statements will prove to be accurate, as actual results and future events could differ materially from those anticipated in such statements. Accordingly, readers should not place undue reliance on forward-looking statements. The Company disclaims any intention or obligation to update or revise any forward-looking statements, whether as a result of new information, future events or otherwise, except as required by law.
Neither the Canadian Securities Exchange nor its Regulation Services Provider (as that term is defined in the policies of the Canadian Securities Exchange) accepts responsibility for the adequacy or accuracy of this release.
New Mobile Wallet Combines Digital Dollar Management, Streamlined Identity Verification and an Integrated App Marketplace Designed to Expand Access to Global Payments
DALLAS, TX / ACCESS Newswire / June 2, 2026 / AIAI Holdings Corporation (NASDAQ:AIAI) (“Ai2” or the “Company”), an AI-enabled diversified holding company utilizing Transformational AI to enhance portfolio performance, along with its subsidiary portfolio company Constellation Network, a blockchain and data infrastructure company, today announced the public launch of Arca Wallet, a self-custodial mobile dollar wallet that enables anyone, anywhere, to hold, send, and manage digital dollars directly from their smartphone. Arca Wallet is available for download on the App Store and Google Play.
Arca Wallet is designed to address a large and evolving global payments market by combining self-custody, digital dollar transfers, streamlined identity verification, and an integrated application marketplace in a single mobile experience. The product reflects Ai2‘s broader strategy of supporting portfolio companies that apply advanced technology to clear commercial use cases with the potential to create scalable, transaction-driven revenue opportunities.
“At the heart of Constellation’s design genius is the application of Transformational AI to create products adaptable to a multitude of use cases. Arca Wallet exemplifies the technology we are building at AIAI – products that create real, measurable value for people,” said Todd Furniss, CEO and co-founder of AIAI Holdings Corporation. “Giving users with a smartphone the ability to hold and send currency without a bank account is exactly the kind of product we want in this portfolio. Just as importantly, Arca’s identity verification and marketplace architecture create a foundation that can extend into a much broader range of uses and a much broader range of partner-enabled applications over time, expanding the wallet from a payments tool into a digital Swiss army knife.”
“We built Arca around one principle: Your wallet and everything in it belongs to you,” said Ben Jorgensen, CEO of Constellation Network. “That means you hold your own keys, no institution can touch your funds, and you pay a fraction of what conventional services charge to send money internationally. Arca provides banking features without having a bank. The marketplace takes that further and extends that utility by allowing users to complete identity verification once and then access a growing network of uses and approved partner applications from the same wallet. We built it for the world as it actually exists today.”
Arca Wallet is built on a self-custodial model, meaning users retain direct and exclusive control over their digital assets at all times. No institution, including Arca itself, holds, manages or has the technical ability to restrict access to user funds. Users authenticate through email or social login and complete setup in approximately 30 seconds, without a bank account, minimum balance or prior knowledge of digital asset infrastructure. The wallet supports USDC (USD Coin) and USDT (Tether), U.S. dollar-denominated digital currencies issued and redeemable 1:1 for U.S. dollars by regulated third parties. Arca’s underlying technology covers network transaction costs on behalf of users, so senders pay only Arca’s disclosed flat fee.
Beyond core dollar management, Arca Wallet includes an integrated in-app marketplace through which users gain access to a curated network of approved third-party partners and applications. Identity verification is completed once; users then interact with the full ecosystem of Arca-supported services without repeated onboarding. Over time, as partner integrations are developed, Arca’s verification architecture is designed to support broader use cases where trusted user information may be required, such as secure identity verification for travel or access programs, healthcare registration, insurance enrollment and policy updates, government benefits registration, employee onboarding, mortgage and loan applications, tax-related filing processes, and other digital forms or app-based registration workflows.
The marketplace is designed to expand the utility of the wallet over time and creates a diversified, transaction-driven revenue stream for the Company through fees assessed on partner-enabled commerce.
Cross-border payments represented approximately $179 trillion in global transaction flows in 2024, according to the McKinsey Global Payments Map. A significant portion of lower-value cross-border activity continues to rely on legacy financial infrastructure, creating demand for faster, more accessible, and more cost-efficient alternatives. Arca addresses this opportunity by enabling international transfers that settle in seconds, compared to the one-to-five business days typical of conventional wire transfers, at a flat 0.5% fee versus a global average remittance cost of approximately 6.36%, according to the World Bank’s Remittance Prices Worldwide data. Account creation requires no bank account, no minimum balance, and no paperwork, making the product accessible to populations historically excluded from digital financial services.
Arca users may also opt into SimpleFi, a dollar savings product that allows users to put their dollars to work with no lock-up period and no minimum balance. Returns through SimpleFi are variable and not guaranteed. SimpleFi is not a savings account and is not FDIC insured. Past performance does not guarantee future results. Arca does not provide investment, financial or tax advice.
Arca is not a bank. Digital dollars held in Arca are not bank deposits, are not FDIC insured, and are not guaranteed by any government entity. Availability of Arca Wallet, SimpleFi, and marketplace services may be subject to jurisdictional restrictions, eligibility requirements, and applicable law.
Apple and App Store are trademarks of Apple Inc. Google Play is a trademark of Google LLC. Neither Apple Inc. nor Google LLC sponsors or endorses Arca Wallet.
About Constellation Network
Constellation Network is a technology company developing products at the intersection of AI and blockchain. Its technology, including a native Layer 1 blockchain protocol, supports trusted data, verifiable provenance, and auditable flows for customers across retail intelligence, U.S. defense applications, AI security, and consumer applications. Constellation became part of the AIAI Holdings portfolio in May 2026 and continues to operate the Constellation Network protocol and ecosystem alongside the development of new commercial products including Constellation Gate AI. More information is available at https://constellationnetwork.io.
This press release contains “forward-looking statements” or “forward-looking information” within the meaning of the Private Securities Litigation Reform Act of 1995, including statements regarding the plans, intentions, beliefs, and current expectations of the Company with respect to future business activities and plans of the Company. All statements contained in this press release that do not relate to matters of historical fact should be considered forward-looking statements, including without limitation statements regarding our expectations, intentions, beliefs, plans, objectives, goals, strategies, future events or performance, and underlying assumptions. Forward-looking statements are often identified by the use of words such as “may,” “will,” “expect,” “believe,” “anticipate,” “intend,” “would,” “could,” “should”, “estimate,” “plan,” “predict,” “project,” “estimate”, or “continue,” or similar expressions, including the negative of these terms or other comparable terminology.
Forward-looking statements are based on the Company’s current expectations regarding its strategy, plans, intentions, performance, or future occurrences or results, the information on which such expectations were based may change. These forward-looking statements rely on a number of assumptions concerning future events and are subject to a number of known and unknown risks, uncertainties, and other factors, many of which are outside of the Company’s control, that could cause actual results, performance, or achievements to materially differ from any future results, performance, or achievements expressed or implied by the forward-looking statements. Such risks, uncertainties and other factors include, but are not limited to our lack of operating history, our ability to attract new investments, our failure to manage growth effectively, our acquisition activities may pose risks that could harm our business, and our licensed AI may not perform up to the expected standards, as well as general business and economic conditions, competitive pressures, regulatory changes, technological developments, and other factors identified in the Company’s most recent filings with the U.S. Securities and Exchange Commission, including our Registration Statement on Form S-1, which are available for review at www.sec.gov. Furthermore, the Company operates in a competitive environment where new and unanticipated risks may arise. Accordingly, investors should not place any reliance on forward-looking statements as a prediction of actual results.
The forward-looking statements in this press release are based on information available to us as of the date hereof, and we disclaim any intention to, and, except as may be required by law, undertake no obligation to, update or revise forward-looking statements to reflect events or circumstances that subsequently occur or of which the Company hereafter become aware. These forward-looking statements should not be relied upon as representing our views as of any date subsequent to the date of this press release.
Investor Relations
Matthew Selinger, Senior Partner Integrous Communications Email: mselinger@integcom.us Phone: 415-572-8152
Visit and follow AIAI Holdings Corporation online:
Technical report identifies Gate AI as one of the top performing AI security gateways across 16 public prompt injection evaluations, ranking first on half of the evaluated datasets.
DALLAS, TX / ACCESS Newswire / May 28, 2026 / AIAI Holdings Corporation (NASDAQ:AIAI) (“Ai2” or the “Company”), an AI-enabled diversified holding company utilizing Transformational AI to enhance portfolio performance, today announced that one of its portfolio companies, Constellation Network, its blockchain and data infrastructure company, will launch its AI security gateway product, Constellation Gate AI, in June 2026. Ahead of the launch, Constellation has published a technical report in which it concludes Gate AI is one of the top performing solutions on evaluated public benchmark datasets, ranking first on 8 benchmarks and placing in the top three on 4 more.
“Constellation’s infrastructure is built around trusted data, and Gate AI is a strong example of that capability in action,” said Todd Furniss, CEO and Co-founder of AIAI Holdings Corporation. “The benchmark results described in the technical report position Gate AI among the strongest performing. We believe this validates the strength of Constellation’s technology and provides AIAI with a differentiated blockchain security platform that can support the next generation of AI driven systems, while also creating opportunities to integrate trusted data validation capabilities across AIAI’s portfolio companies.”
“We are excited to launch Gate AI for several reasons. The performance results we’ve highlighted demonstrate the platform’s capabilities, and we believe that this starts a major trend of converging AI with blockchain technologies. We also see significant unmet demand across the market, from enterprises to smaller organizations, for solutions like this. With that in mind we built it to be something teams can deploy in minutes and rely on every day, while providing an accessible gateway that can support users at any scale.”
“Every team building with AI today is faster and more efficient than they were a year ago. However, developers are just one prompt injection away erasing their gains through a security incident.” said Ben Jorgensen, CEO of Constellation Network. “Gate AI plugs into any existing AI workflow without code changes, blocks those attacks before they reach the model, and produces a tamper-evident audit trail of every request and response. We built it to be something teams can set up in minutes and rely on every day.”
Constellation Gate AI is a security and audit gateway for AI applications. It plugs into any existing AI workflow without code changes and provides prompt-injection defense, a tamper-evident audit trail of every model call, and unified cost and usage visibility across major commercial model APIs and open-weight models.
Prompt injection is the class of attack in which malicious instructions hidden inside emails, documents, websites, or other content retrieved by an AI agent cause that agent to take actions its operator did not intend. As AI agents increasingly execute real work on behalf of users and organizations, the security layer for those agents has to sit in line with every model call.
A technical report authored by Ryle Goehausen, Head of Protocol at Constellation Network, published alongside today’s announcement evaluates Gate AI’s prompt-injection detection cascade against 16 public benchmark datasets. The report describes the testing and evaluation methodology in full. Two design choices apply across every dataset: a single global operating point and no per-dataset threshold tuning.
Results Highlights:
F1 of 97.4% at a 1% false-positive rate gating constraint across the full 16-dataset corpus.
Ranked first on half of the 16 evaluated datasets, placing second on 3 and third on 1 when compared against published competitor scores.
Median end-to-end response time of 53 milliseconds, 95th-percentile 571 milliseconds, mean 104 milliseconds.
The cleanest head-to-head comparison with the largest commercial competitor sits on two stringent benchmarks of legitimate, non-attack user prompts, where the meaningful metric is how often a detector mistakenly blocks legitimate traffic. On the Wildguard-benign dataset, Gate AI’s false-positive rate was 1.03%, against the enterprise competitor’s published 17.4%. On Notinject, Gate AI’s rate was 2.06%, against the enterprise competitor’s published 12.4%.
Constellation Gate AI will be available in two configurations at launch:
Bring Your Own Keys. Customers connect their existing model provider accounts and route traffic through Gate AI for audit and cost visibility. A free tier is planned, with a paid tier that adds prompt-injection defense and audit anchoring.
Pay As You Go. Customers prepay a balance and consume major commercial and open-weight models through Gate AI without managing upstream provider relationships directly. Security and audit features are included.
Early access registration is intended to provide qualified developers and teams with access to the gateway ahead of general availability, along with documentation, integration guides for popular AI development tools, and onboarding for the planned audit-anchoring feature, which is designed to write tamper-evident receipts of model interactions to the Constellation Network protocol.
About AIAI Holdings Corporation
AIAI Holdings Corporation (Ai2) (NASDAQ:AIAI) is an AI-enabled diversified holding company that acquires and grows companies across multiple industries. We expect to drive revenue and earnings growth throughout our portfolio by applying exclusively licensed Transformational AI to enhance operational efficiency and financial performance.
Ai2 is building a next-generation model for technology-enabled business operations, which is expected to create sustainable value for shareholders through the strategic integration of artificial intelligence across diverse industries.
About Constellation Network
Constellation Network is a technology company developing products at the intersection of AI and blockchain. Its technology, including a native Layer 1 blockchain protocol, supports trusted data, verifiable provenance, and auditable flows for customers across retail intelligence, U.S. defense applications, AI security, and consumer applications. Constellation became part of the AIAI Holdings portfolio in May 2026 and continues to operate the Constellation Network protocol and ecosystem alongside the development of new commercial products including Constellation Gate AI. More information is available at https://constellationnetwork.io.
This press release contains “forward-looking statements” or “forward-looking information” within the meaning of the Private Securities Litigation Reform Act of 1995, including statements regarding the plans, intentions, beliefs, and current expectations of the Company with respect to future business activities and plans of the Company. All statements contained in this press release that do not relate to matters of historical fact should be considered forward-looking statements, including without limitation statements regarding our expectations, intentions, beliefs, plans, objectives, goals, strategies, future events or performance, and underlying assumptions. Forward-looking statements are often identified by the use of words such as “may,” “will,” “expect,” “believe,” “anticipate,” “intend,” “would,” “could,” “should”, “estimate,” “plan,” “predict,” “project,” “estimate”, or “continue,” or similar expressions, including the negative of these terms or other comparable terminology.
Forward-looking statements are based on the Company’s current expectations regarding its strategy, plans, intentions, performance, or future occurrences or results, the information on which such expectations were based may change. These forward-looking statements rely on a number of assumptions concerning future events and are subject to a number of known and unknown risks, uncertainties, and other factors, many of which are outside of the Company’s control, that could cause actual results, performance, or achievements to materially differ from any future results, performance, or achievements expressed or implied by the forward-looking statements. Such risks, uncertainties and other factors include, but are not limited to our lack of operating history, our ability to attract new investments, our failure to manage growth effectively, our acquisition activities may pose risks that could harm our business, and our licensed AI may not perform up to the expected standards, as well as general business and economic conditions, competitive pressures, regulatory changes, technological developments, and other factors identified in the Company’s most recent filings with the U.S. Securities and Exchange Commission, including our Registration Statement on Form S-1, which are available for review at www.sec.gov. Furthermore, the Company operates in a competitive environment where new and unanticipated risks may arise. Accordingly, investors should not place any reliance on forward-looking statements as a prediction of actual results.
The forward-looking statements in this press release are based on information available to us as of the date hereof, and we disclaim any intention to, and, except as may be required by law, undertake no obligation to, update or revise forward-looking statements to reflect events or circumstances that subsequently occur or of which the Company hereafter become aware. These forward-looking statements should not be relied upon as representing our views as of any date subsequent to the date of this press release.
Investor Relations
Matthew Selinger, Senior Partner Integrous Communications Email: mselinger@integcom.us Phone: 415-572-8152
Visit and follow AIAI Holdings Corporation online:
Denver, Colorado–(Newsfile Corp. – May 27, 2026) – Elemental Royalty Corporation (TSX: ELE) (NASDAQ: ELE) (“Elemental” or “the Company“) is pleased to announce its wholly owned subsidiary Bronco Creek Exploration Inc. (“BCE“) has entered into an Exploration and Option agreement (the “Agreement“) with Robinson Holdings (USA) Ltd. (“RHUSA“), a subsidiary of KGHM Polska Miedź S.A. (“KGHM“) on four of its porphyry copper projects-Royston, Big E, Tango, and Whiskey-in Mineral and Nye Counties, Nevada. KGHM is a major copper and silver producer with operating mines in Europe and the Americas. The Agreement provides Elemental with execution payments, option payments, and work commitments on the Projects during the six-year earn-in period and grants RHUSA the opportunity to earn 100% interest in the Projects. For any Project in which RHUSA elects to earn-in, Elemental retains a 2% Net Smelter Return (“NSR“) royalty interest as well as Annual Advance Royalty (“AAR“) and certain milestone payments.
Highlights
Exploration and Option agreement executed with RHUSA on four Projects to explore for copper porphyries in west-central Nevada
The Agreement includes execution payments totalling US$315,000 and option payments up to US$600,000 per Project to Elemental over a six-year earn-in period
During the earn-in period, RHUSA will fund up to US$5,000,000 in exploration expenditures per Project
Upon exercise of a Project’s option, Elemental will be granted a 2% NSR royalty, as well as escalating AAR payments, starting at US$50,000 and other milestone payments as the Project advances
The four Projects were generated by BCE as part of its ongoing Western U.S. generative efforts focused on porphyry copper and related systems. Projects are situated within a mining-friendly region which boasts excellent infrastructure and access, and each project presents a unique opportunity to advance an underexplored porphyry copper-(gold-molybdenum) system in Nevada.
David M. Cole, Chief Executive Officer of Elemental, commented: “We are excited to collaborate with KGHM to advance each of these prospective properties in Nevada. The Elemental team continues to identify and generate exploration opportunities at low-cost, and a porphyry discovery on any one of these projects would represent significant value to all parties. This transaction reflects our ability to attract high-calibre partners and operators in Tier 1 jurisdictions, and it continues to build momentum in our growth trajectory.”
Commercial Terms Overview Under the terms of the Agreement, RHUSA will acquire a 100% interest in each of the Royston, Big E, Tango, and Whiskey Projects by satisfying the following terms on a per-Project basis over a six-year option period. Upon execution, RHUSA will pay US$50,000 in cash, make a payment equal to the previous year’s holding costs, and will make option payments totalling up to US$600,000 during the six-year term of the option agreement. To exercise the option on a Project, RHUSA must spend US$5,000,000 in exploration expenditures on that individual property.
Upon option exercise by RHUSA, Elemental will retain a 2% NSR royalty on each Project. RHUSA will also make AAR payments of US$50,000 per Project, which will increase by US$10,000 per year, until a total of US$1,750,000 has been paid or Commercial Production commences. In addition, RHUSA will make Project milestone payments consisting of: US$500,000 upon declaration of a resource, US$750,000 upon completion of a Preliminary Economic Assessment and US$1,000,000 upon completion of a Feasibility Study.
Overview of the Projects Royston: Located 30 km northwest of Tonopah, Nevada, the Royston Project hosts a copper-(gold-molybdenum) porphyry system. The upper levels of the porphyry system are partially exposed, however, extensional faulting accompanied by significant westward tilting and the eruption of post-mineral volcanics have buried more prospective portions of the system to the east. A five-hole reconnaissance reverse-circulation (RC) drill program, completed by a previous partner, confirmed the presence of strongly altered quartz-sericite-pyrite zones with anomalous base and precious metals under thin post-mineral volcanic cover. Geophysical surveys have defined robust chargeability anomalies that correlate with abundant sulfide mineralization in concealed host rocks. Two of the RC drillholes encountered strong alteration and increasing mineralization and were cased for re-entry on a follow-up drill program utilizing core tails.
Big E: Adjacent to Royston, the Big E Project comprises a similarly tilted and dismembered porphyry copper-(gold-molybdenum) target. Outcropping porphyry dikes with strong sericite-pyrite alteration at surface project under post-mineral volcanic and alluvial cover to the east. A previous partner completed a widely spaced three-hole reconnaissance RC program, which intersected similar porphyry dikes and associated quartz-sericite-pyrite alteration interpreted to represent the edge of the porphyry copper system. The paleo-down dip projection of the altered porphyry dikes remains untested, and the next stage of exploration will test these structural blocks that may represent the better mineralized core of the system.
Tango: The Tango Project represents a pooled land package between BCE’s claims and Great Western Mining Corporation PLC (AIM: GWMO) claims and targets a porphyry copper-molybdenum system located 100 kilometers west of Tonopah, Nevada (see Great Western news release dated August 12, 2024). Financial benefits from the Agreement that pertain to the Tango Project will be split 70% / 30% between BCE and Great Western respectively. Locally abundant quartz-copper oxide veining and associated widespread sericite pyrite alteration outcrops over an approximate 2-by-2-kilometer area. The outcropping system footprint is bounded by post-mineral volcanic and alluvial cover to north and east. Historical drilling by Conoco and Humble Oil in the 1960’s and 70’s failed to sufficiently test the system, largely due to shallow hole depths and a poor understanding of the alteration vectors. An IP survey completed by GWM in 2021 detected chargeability anomalies which highlight high priority targets within untested zones of the system. The host rock stratigraphy includes Ordovician carbonate units representing additional potential for skarn/replacement mineralization as well as the primary porphyry copper target.
Whiskey: Situated approximately 5km southwest of Tango, Whiskey is a porphyry copper-molybdenum target interpreted as a possible shallower-level analogue to Tango. The Whiskey Project exhibits ASTER anomalies, correlative with silicification and clay-sericite-pyrite alteration observed at surface, which are bounded by post-mineral volcanic cover. Dikes are present at surface and are reported in historical drill logs. In 1980, a historical drill program exploring for gold reported an intercept of 2 volume percent chalcopyrite from 88.4-97.5 m depth, but copper was not assayed in the drillhole. Similarly, historical surface sampling also did not assay for Cu, but results include anomalous Mo, Ag, As, and Hg values. The historical results suggest that modern systematic exploration will reveal additional upside at the Project, particularly since surface mineralization is interpreted to project beneath the post-mineral volcanic cover.
Elemental is looking forward to partner with KGHM and will provide technical and operational support during the option period.
NASDAQ: ELE | TSX: ELE | ISIN: CA28620K1066 | CUSIP: 28620K
About Elemental Royalty Corporation Elemental Royalty is a new mid-tier, gold-focused streaming and royalty company with a globally diversified portfolio of 18 producing assets and more than 200 royalties, anchored by cornerstone assets and operated by world-class mining partners. Formed through the merger of Elemental Altus and EMX, the Company combines Elemental Altus’s track record of accretive royalty acquisitions with EMX’s strengths in royalty generation and disciplined growth. This complementary strategy delivers both immediate cash flow and long-term value creation, supported by a best-in-class asset base, diversified production, and sector-leading management expertise.
Elemental Royalty trades on NASDAQ and on the Toronto Stock Exchange under the ticker Symbol “ELE”.
Qualified Person Michael P. Sheehan, CPG, a Qualified Person as defined by National Instrument 43-101 and employee of the Company, has reviewed, verified and approved the disclosure of the technical information contained in this news release.
Cautionary note regarding forward-looking statements and financial outlook This news release contains certain “forward-looking statements” and certain “forward-looking information” as defined under applicable United States and Canadian securities laws. Forward-looking statements and information can generally be identified by the use of forward-looking terminology such as “may”, “will”, “should”, “expect”, “intend”, “estimate”, “anticipate”, “believe”, “continue”, “plans” or similar terminology (including negative and grammatical variations thereof).
Forward-looking statements and information include, but are not limited to, statements regarding future royalties and future consideration payments or issuances of shares, or other statements that are not statements of fact. Forward-looking statements and information are based on forecasts of future results, estimates of amounts not yet determinable and assumptions that, while believed by management to be reasonable, are inherently subject to significant business, economic and competitive uncertainties and contingencies.
Forward-looking statements and information are subject to various known and unknown risks and uncertainties, many of which are beyond the ability of Elemental to control or predict, that may cause Elemental’s actual results, performance or achievements to be materially different from those expressed or implied thereby, and are developed based on assumptions about such risks, uncertainties and other factors set out herein, including but not limited to: the impact of general business and economic conditions, the absence of control over the mining operations from which Elemental will receive royalties, risks related to international operations, government relations and environmental regulation, the inherent risks involved in the exploration and development of mineral properties; the uncertainties involved in interpreting exploration data; the potential for delays in exploration or development activities; the geology, grade and continuity of mineral deposits; the possibility that future exploration, development or mining results will not be consistent with Elemental’s expectations; accidents, equipment breakdowns, title matters, labour disputes or other unanticipated difficulties or interruptions in operations; fluctuating metal prices; unanticipated costs and expenses; uncertainties relating to the availability and costs of financing needed in the future; the inherent uncertainty of production and cost estimates and the potential for unexpected costs and expenses, commodity price fluctuations; currency fluctuations; regulatory restrictions, including environmental regulatory restrictions; liability, competition, loss of key employees and other related risks and uncertainties. For a discussion of important factors which could cause actual results to differ from forward-looking statements, refer to the annual information form of Elemental for the year ended December 31, 2025. Elemental undertakes no obligation to update forward-looking statements and information except as required by applicable law. Such forward-looking statements and information represent management’s best judgment based on information currently available. No forward-looking statement or information can be guaranteed, and actual future results may vary materially. Accordingly, readers are advised not to place undue reliance on forward-looking statements or information.
Neither the Nasdaq Stock Market LLC, or the TSX, or its Regulation Service Provider (as that term is defined in the policies of the TSX) accepts responsibility for the adequacy or accuracy of this press release.
Vancouver, British Columbia–(Newsfile Corp. – May 26, 2026) – West Point Gold Corp. (TSXV: WPG) (OTCQX: WPGCF) (FSE: LRA0) (“West Point Gold” or the “Company”) is pleased to announce that its common shares are now trading on the OTCQX Best Market under the ticker symbol “WPGCF“. West Point Gold upgraded to OTCQX from the OTCQB Venture Market. West Point Gold’s common shares will continue to trade on the Toronto Venture Exchange under the symbol “WPG” and on the Frankfurt Stock Exchange under the symbol “LRA0″.
The OTCQX Best Market is the highest market tier within OTC Markets, and trading on OTCQX will enhance the Company’s visibility and accessibility to US investors. To qualify for OTCQX, companies must meet high financial standards, follow best-practice corporate governance, and demonstrate compliance with applicable securities laws.
US investors can find current financial disclosure and Real-Time Level 2 quotes for the Company on www.otcmarkets.com.
“Graduating to the OTCQX Best Market represents an important milestone for West Point Gold as we continue to broaden our visibility with U.S. investors. With an active exploration program underway at our flagship Gold Chain Project in Arizona and a broader portfolio of discovery-focused assets across the Walker Lane Trend, this upgrade supports our objective of improving market access, liquidity and awareness as we advance the Company,” stated Derek Macpherson, President and CEO.
About West Point Gold Corp.
West Point Gold is an exploration and development company focused on unlocking value across four strategically located projects along the prolific Walker Lane Trend in Nevada and Arizona, USA, providing shareholders with exposure to multiple discovery opportunities across one of North America’s most productive gold regions. The Company’s near-term priority is advancing its flagship Gold Chain Project in Arizona.
For further information regarding this press release, please contact: Aaron Paterson, Corporate Communications Manager Phone: +1 (778) 358-6173 Email: info@westpointgold.com
Certain statements contained in this press release constitute forward-looking information. These statements relate to future events or future performance. Forward-looking statements include estimates and statements that describe the Company’s future plans, objectives or goals, including words to the effect that the Company or management expects a stated condition or result to occur. The use of any of the words “could”, “intend”, “expect”, “believe”, “will”, “projected”, “estimated” and similar expressions and statements relating to matters that are not historical facts are intended to identify forward-looking information and are based on the Company’s current belief or assumptions as to the outcome and timing of such future events including, among others, assumptions about future prices of gold, silver, and other metal prices, currency exchange rates and interest rates, timing of the Company’s maiden resource estimate, favourable operating conditions, political stability, obtaining government approvals and financing on time, obtaining renewals for existing licenses and permits and obtaining required licenses and permits, labour stability, stability in market conditions, availability of equipment, availability of drill rigs, and anticipated costs and expenditures. The Company cautions that all forward-looking statements are inherently uncertain, and that actual performance may be affected by a number of material factors, many of which are beyond the Company’s control. Such factors include, among other things: risks and uncertainties relating to West Point Gold’s ability to complete any payments or expenditures required under the Company’s various option agreements for its projects; and other risks and uncertainties relating to the actual results of current exploration activities, the uncertainties related to resources estimates; the uncertainty of estimates and projections in relation to production, costs and expenses; risks relating to grade and continuity of mineral deposits; the uncertainties involved in interpreting drill results and other exploration data; the potential for delays in exploration or development activities; uncertainty related to the geology, grade and continuity of mineral deposits; the possibility that future exploration, development or mining results may vary from those expected; statements about expected results of operations, royalties, cash flows, financial position may not be consistent with the Company’s expectations due to accidents, equipment breakdowns, title and permitting matters, labour disputes or other unanticipated difficulties with or interruptions in operations, fluctuating metal prices, unanticipated costs and expenses, uncertainties relating to the availability and costs of financing needed in the future and regulatory restrictions, including environmental regulatory restrictions. The possibility that future exploration, development or mining results will not be consistent with adjacent properties and the Company’s expectations; operational risks and hazards inherent with the business of mining (including environmental accidents and hazards, industrial accidents, equipment breakdown, unusual or unexpected geological or structural formations, cave-ins, flooding and severe weather); metal price fluctuations; environmental and regulatory requirements; availability of permits, failure to convert estimated mineral resources to reserves; the inability to complete a feasibility study which recommends a production decision; the preliminary nature of metallurgical test results; fluctuating gold prices; possibility of equipment breakdowns and delays, exploration cost overruns, availability of capital and financing, general economic, political risks, market or business conditions, regulatory changes, timeliness of government or regulatory approvals and other risks involved in the mineral exploration and development industry, and those risks set out in the filings on SEDAR made by the Company with securities regulators. Although the Company believes that the assumptions and factors used in preparing the forward-looking information in this corporate press release are reasonable, undue reliance should not be placed on such information, which only applies as of the date of this news release, and no assurance can be given that such events will occur in the disclosed time frames or at all. The Company expressly disclaims any intention or obligation to update or revise any forward-looking statements whether as a result of new information, future events or otherwise, other than as required by applicable securities legislation.
Neither the TSX Venture Exchange nor its Regulation Services Provider (as that term is defined in the policies of the TSX Venture Exchange) accepts responsibility for the adequacy or accuracy of this release.
Goldman Sachs has reaffirmed its positive stance on gold, keeping its year-end forecast of $5,400 per troy ounce after increasing its estimates for central bank demand and predicting that official-sector purchases will continue accelerating throughout the remainder of 2026.
The investment bank revised its internal tracking model for central bank gold demand after concluding that it had consistently understated buying activity since August 2025. Under the updated methodology, the 12-month moving average estimate rose to 50 tonnes per month as of March, compared with 29 tonnes under the earlier calculation.
According to the revised model, central banks are estimated to have purchased 66 tonnes of gold in January, a sharp increase from the previous estimate of 12 tonnes.
Goldman said the adjustment follows a widening discrepancy between declining gold inventories in London vaults and official U.K. trade figures. While bullion outflows from London storage facilities had continued to climb, British export data appeared to capture only part of those movements, indicating that some sovereign gold transactions were no longer being reflected in official statistics.
“We therefore adjust our nowcast by adding the discrepancy between London vault outflows and UK net exports as unrecorded sovereign gold flows,” Goldman strategists Lina Thomas and Daan Struyven said in a note.
Looking further ahead, Goldman expects central bank buying to average around 60 tonnes per month through 2026. The bank pointed to findings from its own central bank survey that showed “strong underlying interest in gold,” adding that recent geopolitical tensions “are likely to reinforce diversification over time — both for central banks and private investors.”
However, the strategists warned that near-term volatility remains possible. “Gold’s high liquidity makes it a natural source of cash if private investors face liquidity needs,” they wrote, noting the risk of a broader selloff if equity markets weaken due to higher interest rates or softer economic growth linked to geopolitical uncertainty.
Goldman’s demand-tracking model is based largely on U.K. customs and trade data because London’s over-the-counter bullion market handles the majority of sovereign gold transactions globally. Since the U.K. has very limited domestic gold production, bullion traded in the country must be imported before either being stored in London vaults or re-exported, making trade flows a useful indicator of where gold holdings are ultimately moving.
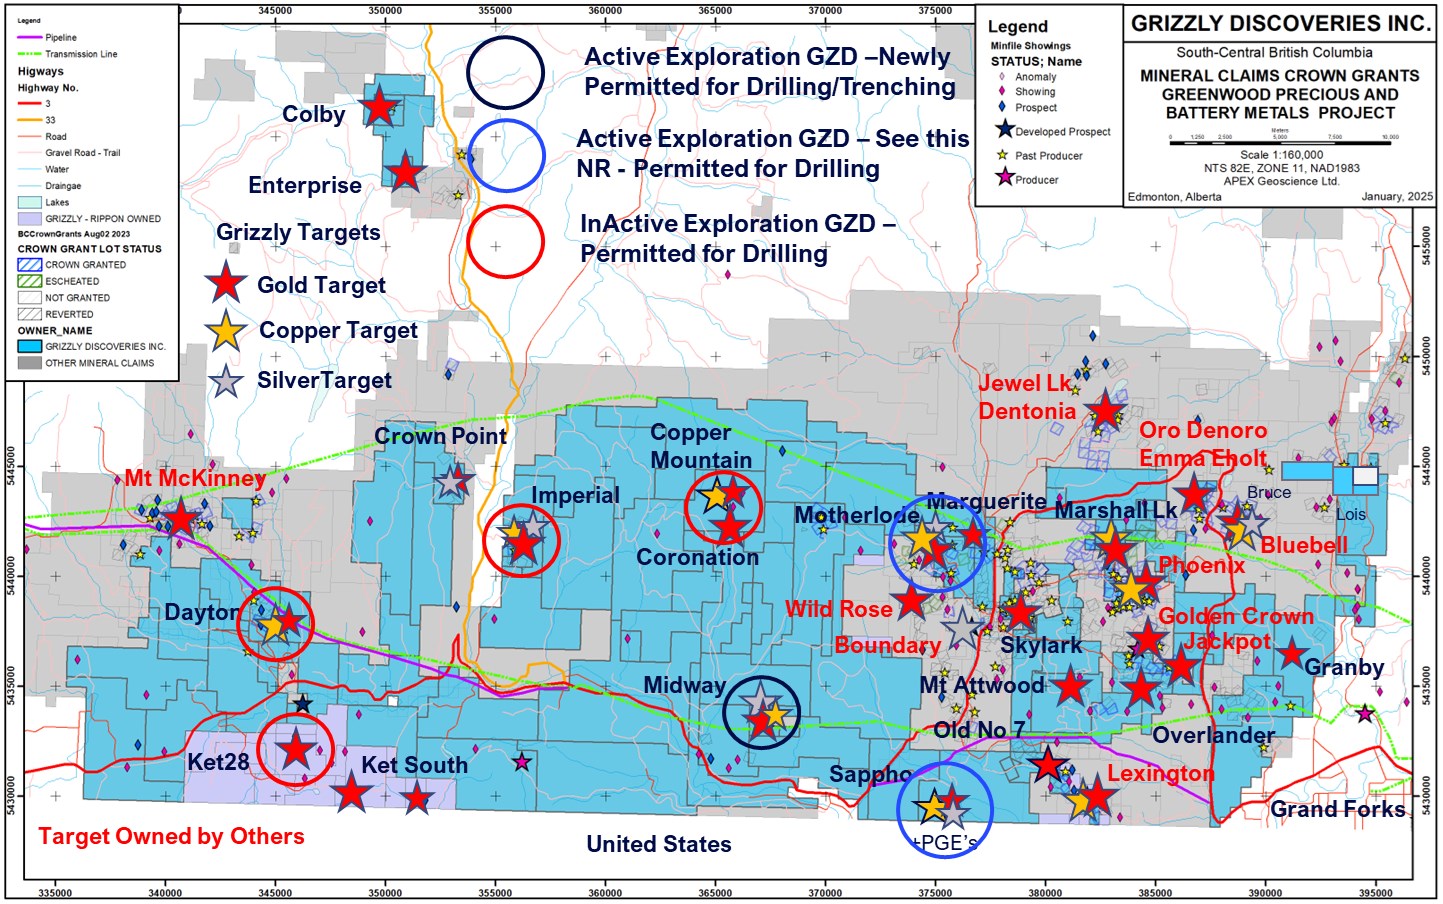
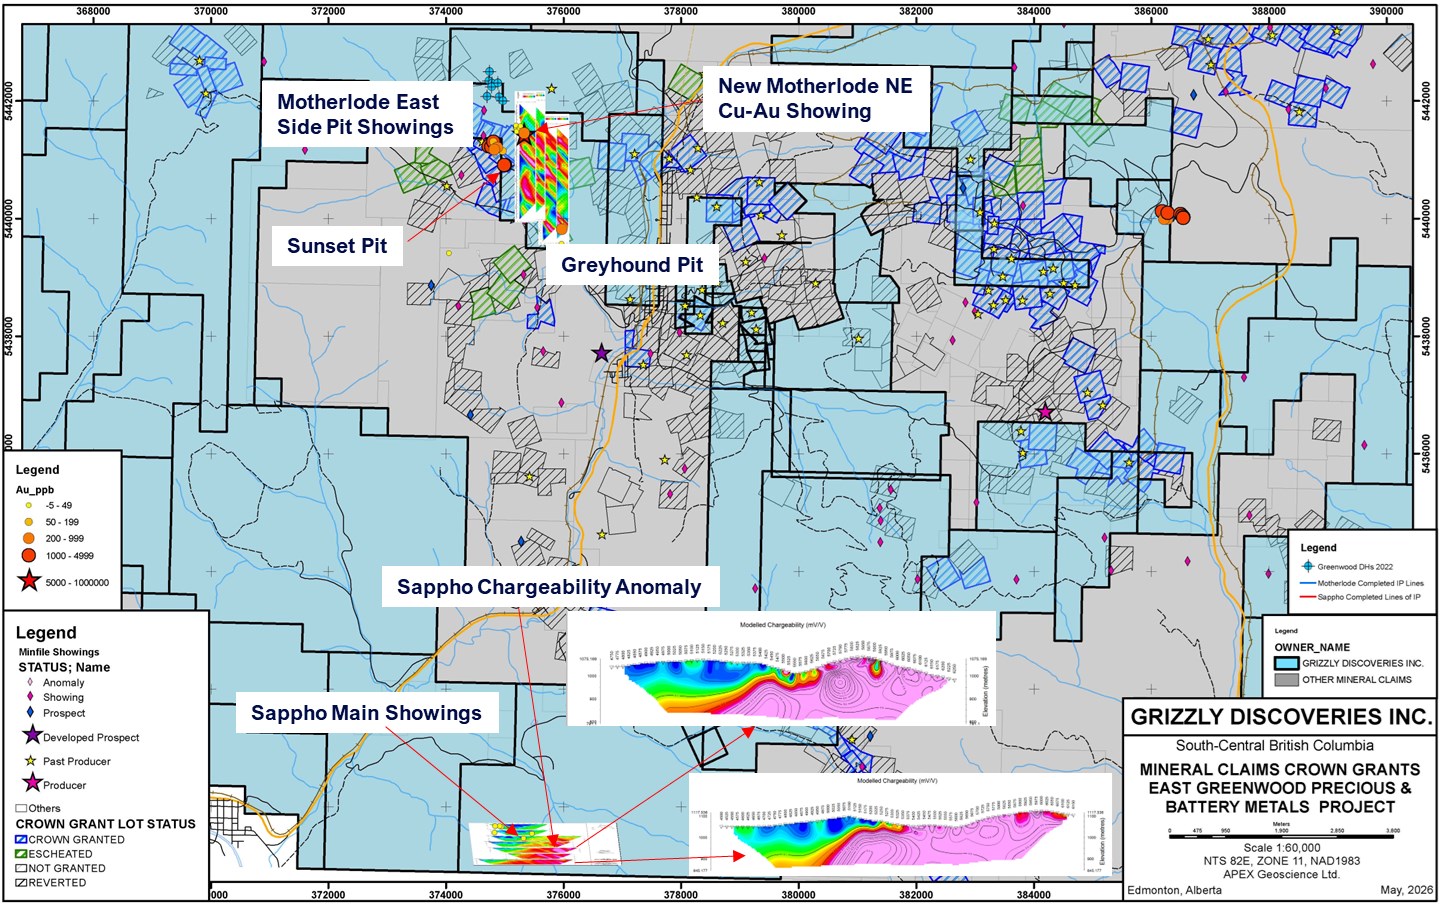
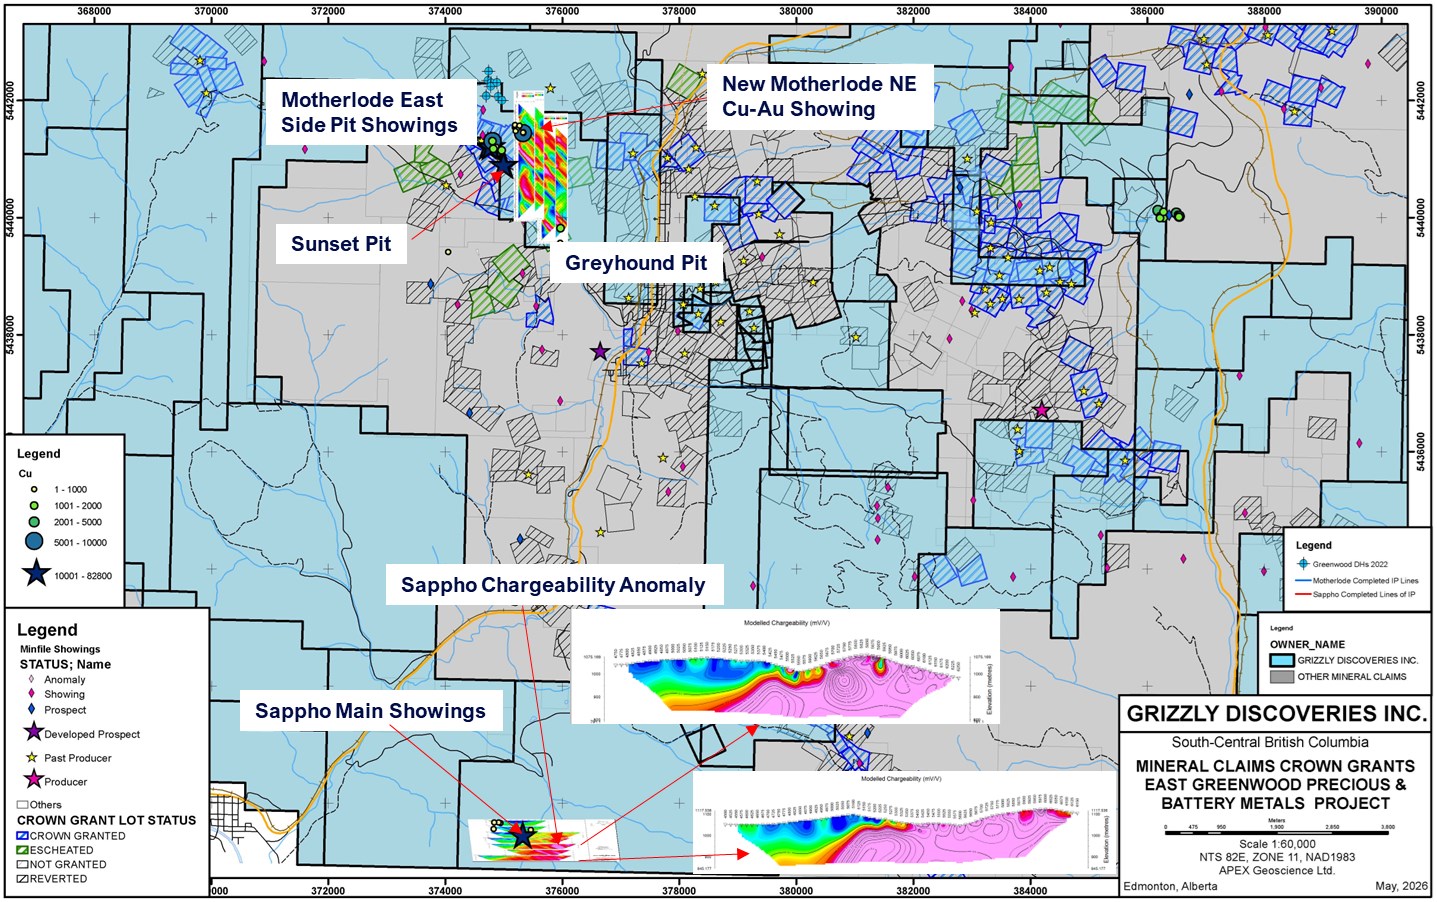
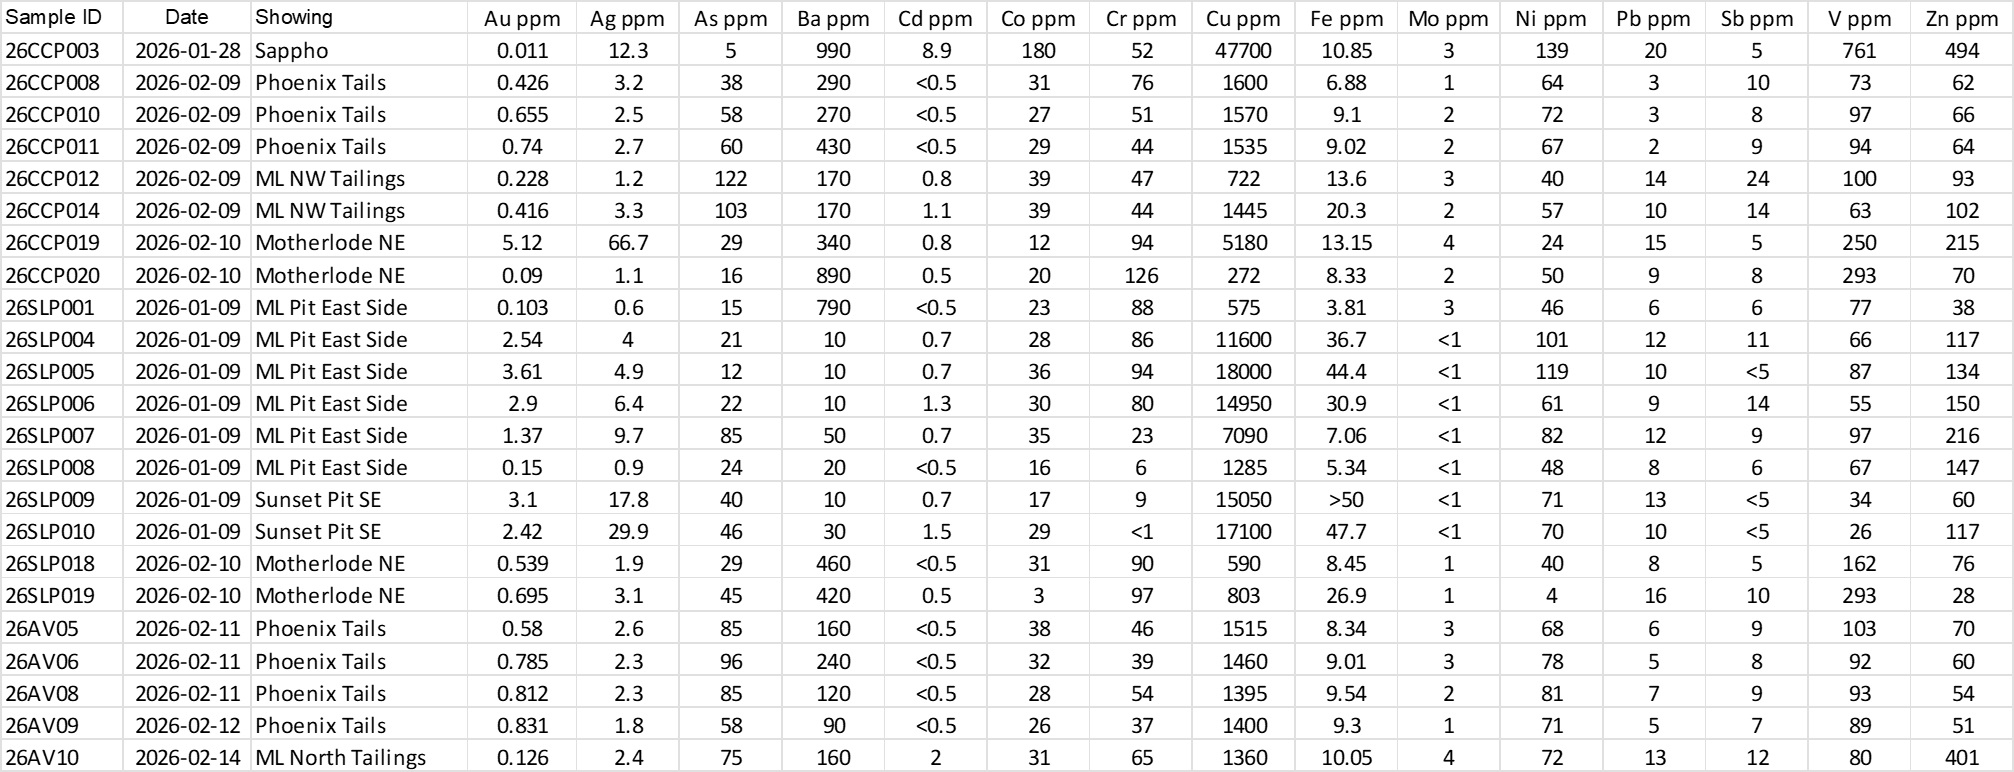
Edmonton, Alberta–(Newsfile Corp. – May 25, 2026) – Grizzly Discoveries Inc. (TSXV: GZD) (FSE: G6H) (OTCQB: GZDIF) (“Grizzly” or the “Company”) is pleased to announce that it has recently received results from the Phase 2 Induced Polarization (IP) Survey at the Sappho Target area by Peter Walcott & Associates and the Company has commenced a Phase 1 IP survey at the Greyhound – Motherlode area near the town of Greenwood. In addition, the Company has received the results of early 2026 sampling at the Greenwood, BC Precious and Critical Minerals Project from APEX Geoscience Ltd. (APEX). The collection of a total of 63 rock grab and sand (tailings) samples has resulted in the discovery of one new metal occurrence at the Motherlode Northeast (NE) area, along with a number of excellent copper (Cu) – gold (Au) results from some old workings outside of but along the east side of the Motherlode Pit, the Sunset Pit area, the Greyhound Pit area and at the Sappho Prospect. The targets are all part of the Greenwood, BC Precious and Critical Minerals Project (Figure 1).
The focus of the 2026 program will be additional Induced Polarization (IP) surveys at the Sappho and Motherlode areas, along with trenching and drilling at Midway, targeting the historical Midway Mine. The initial drill program at the Sappho Skarn Target area has been completed with a total of 1,485 m in 7 holes. The core is being logged and sampled and results will be provided as they are received. Additional Phase 2 drilling is also planned for the Sappho area to test the recently discovered and new IP chargeability anomaly to the southeast of the main skarn area. Additional prospecting, mapping and reconnaissance sampling will be conducted across the entire project area throughout 2026.
IP and Sampling 2026 Highlights
Phase 2 Sappho IP results extend the IP Chargeability Anomaly up to 500 m south and 1 km east and is open in both directions (Figures 2 and 3).
The core of the IP Chargeability Anomaly ranges from 30 mV/V up to 85 mV/V in intensity, and in many instances is coincident with a strong resistivity anomaly or in some cases a weak conductivity anomaly (Figures 2 and 3).
A total of 63 rock grab samples were collected in January – February from the Motherlode-Greyhound area, the Motherlode and Phoenix historical tailings areas, from the Sappho skarn target area and the Rock Creek area (Figures 2 and 3).
A new showing, Motherlode Northeast, has been discovered approximately 780 m northeast of the Motherlode pit and recent grab samples have returned up to 5.12 grams per tonne (g/t) Au, 66.7 g/t silver (Ag) and 0.528% Cu (Figures 2 and 3; Table 1).
A number of samples with anomalous Cu and Au were collected from a series of workings along the east side of the Motherlode pit, that have been uncovered with recent logging of the Motherlode area, including four rock grab samples returning a range of 0.709% Cu up to 1.8% Cu and 1.37 g/t Au up to 3.61 g/t Au (Figures 2 and 3; Table 1).
Two rock grab samples collected from a rubble pile previously unsampled at the southeast corner of the Sunset Pit have returned 1.505% Cu and 1.71% Cu along with 2.42 g/t Au and 3.1 g/t Au, and 17.8 and 29.9 g/t Ag (Figures 2 and 3; Table 1).
Grab samples from fine sand and silt at the Motherlode Tailings area and one of the Phoenix Tailings areas has returned up to 0.145% Cu and 0.416 g/t Au from the Motherlode Tailings material and up to 0.16% Cu and 0.831 g/t Au from the Phoenix Tailings material (Figures 2 and 3; Table 1).
A rock grab sample collected from the Sappho Skarn Target returned 4.77% Cu, 0.018% cobalt (Co) and 12.3 g/t Ag (Figures 2 and 3; Table 1).
Brian Testo, President and CEO of Grizzly Discoveries, stated, “The results from the geophysical programs at our Sappho target, Midway and Motherlode area, continue to define the most prospective areas and the potential for new precious metals and critical mineral discoveries. The IP survey has outlined an extensive porphyry type anomaly at Sappho and we are excited to receive drilling results from the Sappho Target. We look forward to additional trenching and drilling at Midway along with additional exploration for significant precious metals and critical minerals prospects across our entire 170,000+ acre land holdings in the Greenwood District!“
Figure 1: Land position and targets discussed in this News Release, Greenwood Project.
Plans for Summer and Fall 2026 Exploration at Greenwood
Trenching, rock and soil sampling along with drilling at the Midway Target area is being planned for summer and fall 2026. The IP surveys are continuing at Motherlode and there are extension lines being planned for Sappho to try and close out the large chargeability anomaly that has been identified in the 2026 surveys to date (Figures 2 and 3). The amount of drilling will depend upon the financing efforts and weather.
Additional results, including the results of the recently completed Phase 1 Sappho Skarn Target drilling will be forthcoming over the next coming months as work progresses and will be presented in additional news releases.
Quality Assurance and Control
Rock, soil samples and core are being analyzed at ALS Global Laboratories (Geochemistry Division) in Vancouver, Canada (an ISO/IEC 17025:2017 accredited facility). Gold was assayed using a fire assay with atomic emission spectrometry and gravimetric finish when required (+10 g/t Au). Rock grab and rock chip samples from outcrop/bedrock are selective by nature and may not be representative of the mineralization hosted on the project.
The sampling program was undertaken by Company personnel under the direction of Michael B. Dufresne, M.Sc., P.Geol., P.Geo.. A secure chain of custody is maintained in transporting and storing of all samples.
The technical content of this news release and the Company’s technical disclosure has been reviewed and approved by Michael B. Dufresne, M. Sc., P. Geol., P.Geo., who is a non-independent Consultant and Qualified Person as defined by National Instrument 43-101 Standards of Disclosure for Mineral Projects.
ABOUT GRIZZLY DISCOVERIES INC.
Grizzly is a diversified Canadian mineral exploration company with its primary listing on the TSX Venture Exchange focused on developing its approximately 72,700 ha (approximately 180,000 acres) of precious and critical minerals properties in southeastern British Columbia. Grizzly is run by a highly experienced junior resource sector management team, who have a track record of advancing exploration projects from early exploration stage through to feasibility stage.
On behalf of the Board,
GRIZZLY DISCOVERIES INC. Brian Testo, CEO, President
Neither the TSX Venture Exchange nor its Regulation Services Provider (as that term is defined in the policies of the TSX Venture Exchange) accepts responsibility for the adequacy or accuracy of this release.
Caution concerning forward-looking information
This press release contains “forward-looking information” and “forward-looking statements” within the meaning of applicable securities laws. This information and statements address future activities, events, plans, developments and projections. All statements, other than statements of historical fact, constitute forward-looking statements or forward-looking information. Such forward-looking information and statements are frequently identified by words such as “may,” “will,” “should,” “anticipate,” “plan,” “expect,” “believe,” “estimate,” “intend” and similar terminology, and reflect assumptions, estimates, opinions and analysis made by management of Grizzly in light of its experience, current conditions, expectations of future developments and other factors which it believes to be reasonable and relevant. Forward-looking information and statements involve known and unknown risks and uncertainties that may cause Grizzly’s actual results, performance and achievements to differ materially from those expressed or implied by the forward-looking information and statements and accordingly, undue reliance should not be placed thereon.
Risks and uncertainties that may cause actual results to vary include but are not limited to the availability of financing; fluctuations in commodity prices; changes to and compliance with applicable laws and regulations, including environmental laws and obtaining requisite permits; political, economic and other risks; as well as other risks and uncertainties which are more fully described in our annual and quarterly Management’s Discussion and Analysis and in other filings made by us with Canadian securities regulatory authorities and available at www.sedarplus.ca. Grizzly disclaims any obligation to update or revise any forward-looking information or statements except as may be required by law.