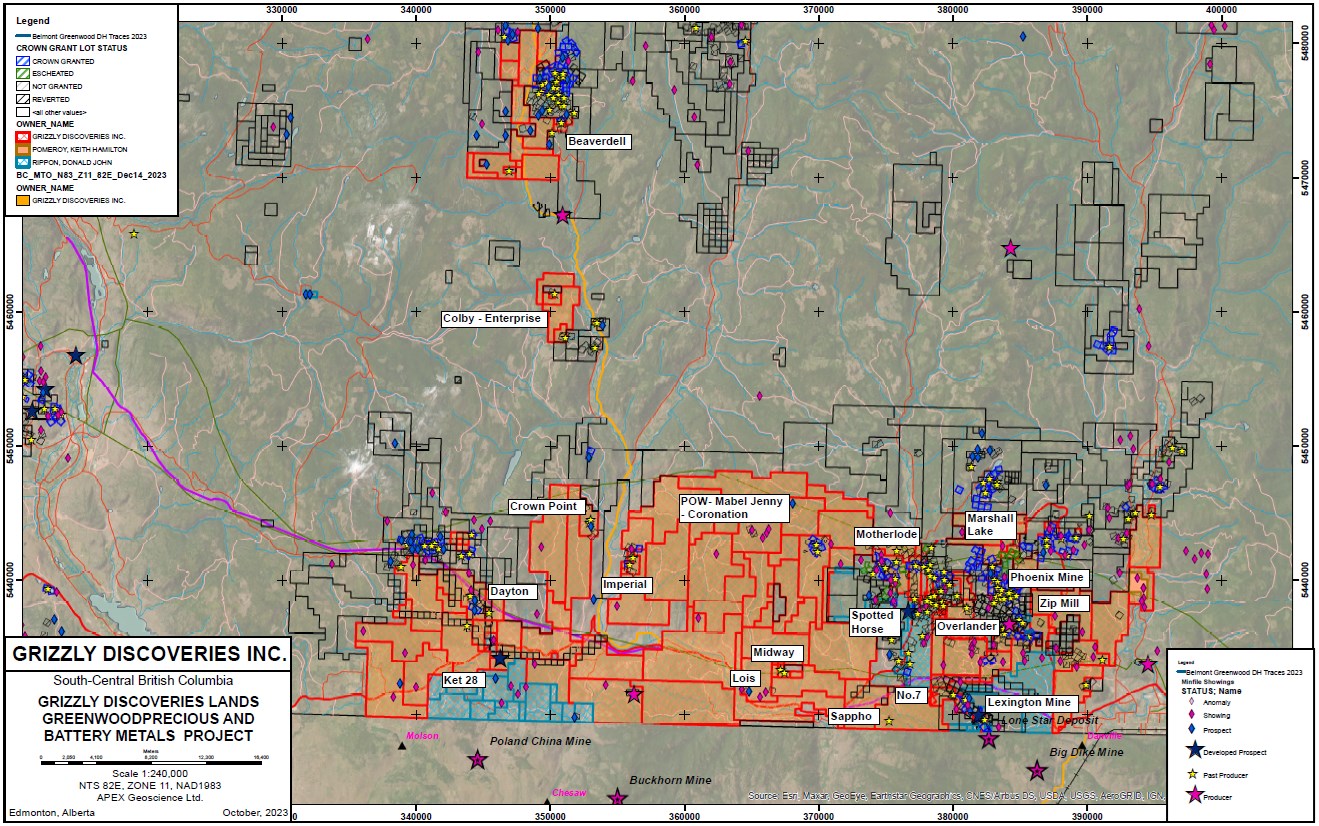
Edmonton, Alberta–(Newsfile Corp. – November 19, 2025) – Grizzly Discoveries Inc. (TSXV: GZD) (FSE: G6H) (OTCQB: GZDIF) (“Grizzly” or the “Company”) is pleased to announce that it has recently mobilized a crew from APEX Geoscience Ltd. (APEX) to conduct fieldwork at a number of targets prior to conducting trenching and drilling subject to financing. The targets are part of the Greenwood, BC Precious and Battery Metals Project (Figure 1).
In addition, the Company announces agreements with two arm’s length creditors to settle outstanding cash debt with common shares of the Company, including completing the Midway Mine Option and paying interest on the promissory note issued May 15, 2025. In aggregate, the Company intends to issue 541,667 common shares of Grizzly in settlement of an aggregate $16,250 in outstanding debt.
Midway Highlights
- Drilling and trenching permit applications have recently been approved for the Midway, Sappho, Copper Mountain and Imperial target areas.
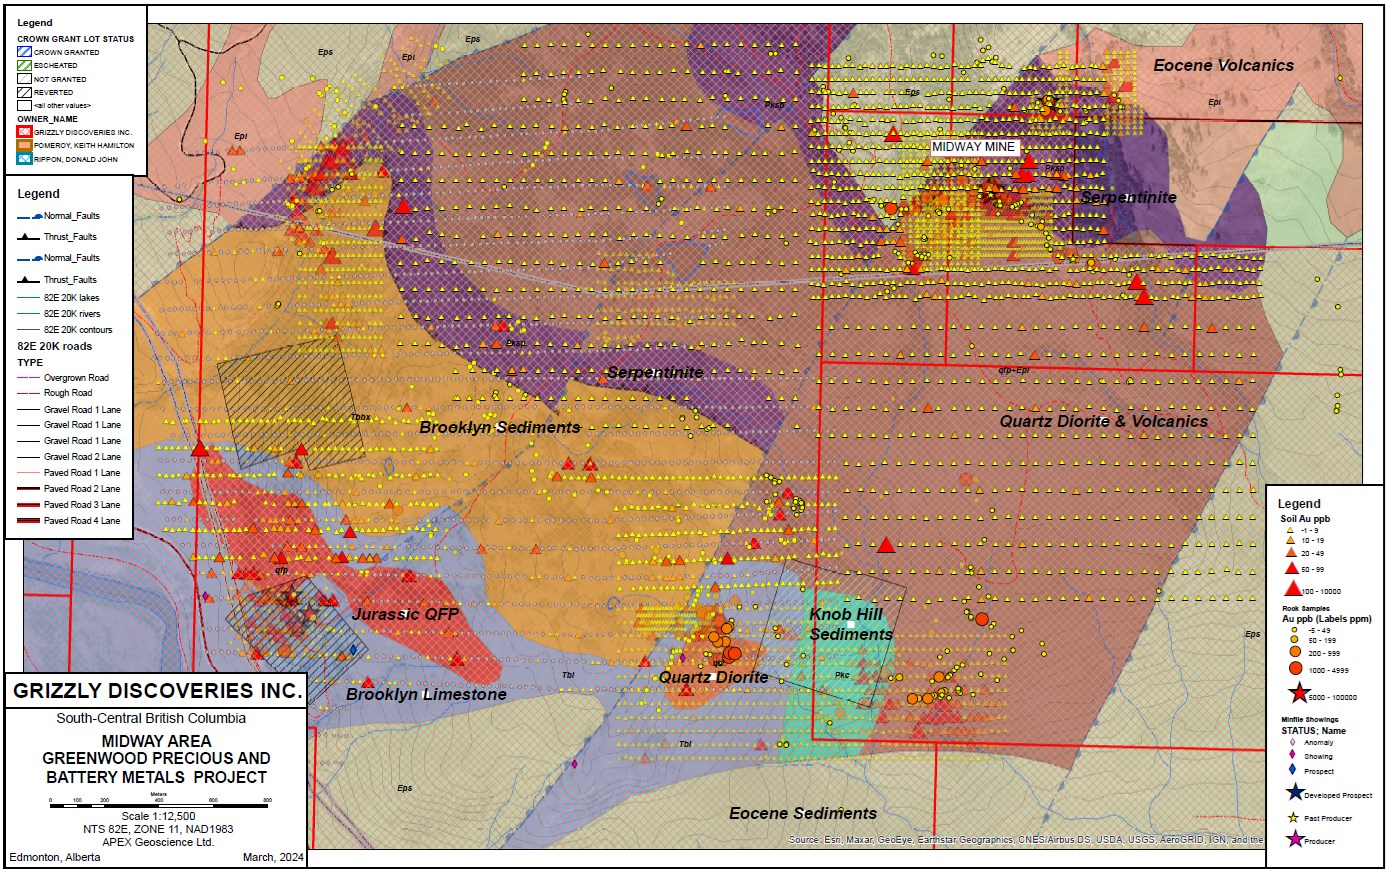
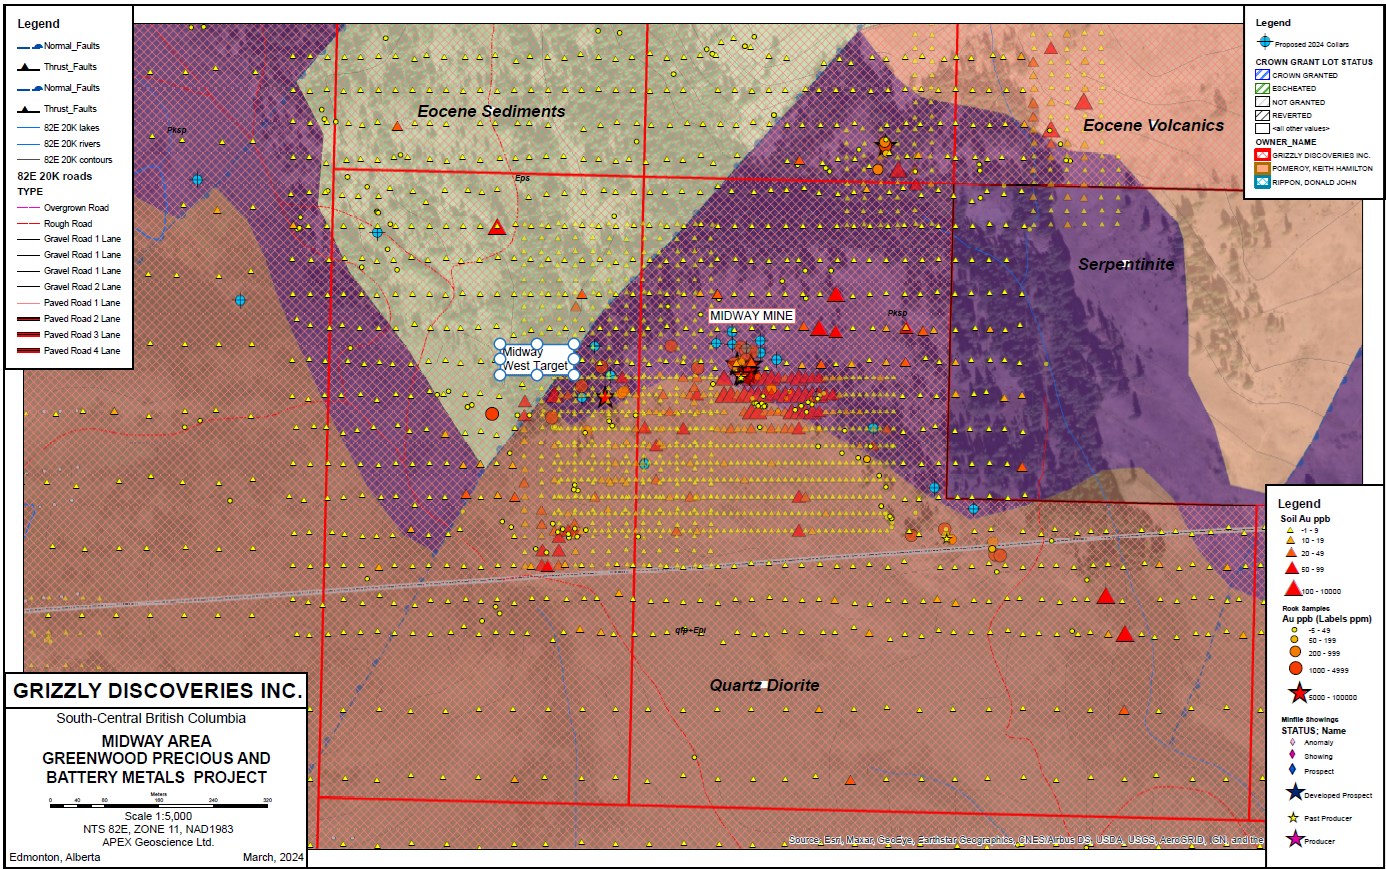
- The Midway area is being targeted for copper-gold skarn and epithermal gold-silver (Figure 2).
- At Midway, selective rock grab and composite rock grab samples from outcrop collected from the Midway Mine-Picturestone area, with 4 of 7 rock grab samples from outcropping mineralization in the Midway Mine historical pit yielding a range of 12.05 g/t (or 0.351 ounces per ton [oz/t]) Au up to 70.8 g/t (2.065 oz/t) Au (See Company news release dated October17, 2022).
- Three (3) of the 7 selective rock grab samples from the Midway Mine pits yielded from 1,360 g/t Ag (39.7 oz/t Ag) up to 2,140 g/T Ag (62.4 oz/t Ag) (see the Company news release dated October 17, 2022).
- All highly anomalous samples are from outcrop and characterized by the presence of abundant pyrite, arsenopyrite with visible galena and sphalerite in a siliceous chalcedonic host. The mineralization is hosted in polymetallic veins that display the presence of Pb, Zn, Cu, arsenic (As) and antimony (Sb) and are likely epithermal in nature.
- A selective rock grab sample from outcrop 200 m west of the main Midway Mine yielded 15.85 g/t Au (0.462 oz/t Au) and 1,530 g/T Ag (44.6 oz/t Ag), illustrating that there is potential for additional high-grade mineralization in the area (Figure 3).
Brian Testo, President and CEO of Grizzly Discoveries, stated, “We are excited and are looking forward to pursuing a number of high grade gold – silver – copper – lead -zinc showings and historical mines with drilling in the fall of 2025 or early in 2026 along with additional exploration for significant battery metal prospects in our current 170,000+ acre land holdings in the Greenwood District. We have barely scratched the surface in terms of exploration!“
Figure 1: Land position and targets of interest for future exploration, Greenwood Project.
To view an enhanced version of this graphic, please visit:
https://images.newsfilecorp.com/files/4488/275142_7f84f9a9f4ee6b25_002full.jpg
Figure 2. Midway geology and showings with gold in soils and rocks.
To view an enhanced version of this graphic, please visit:
https://images.newsfilecorp.com/files/4488/275142_7f84f9a9f4ee6b25_003full.jpg
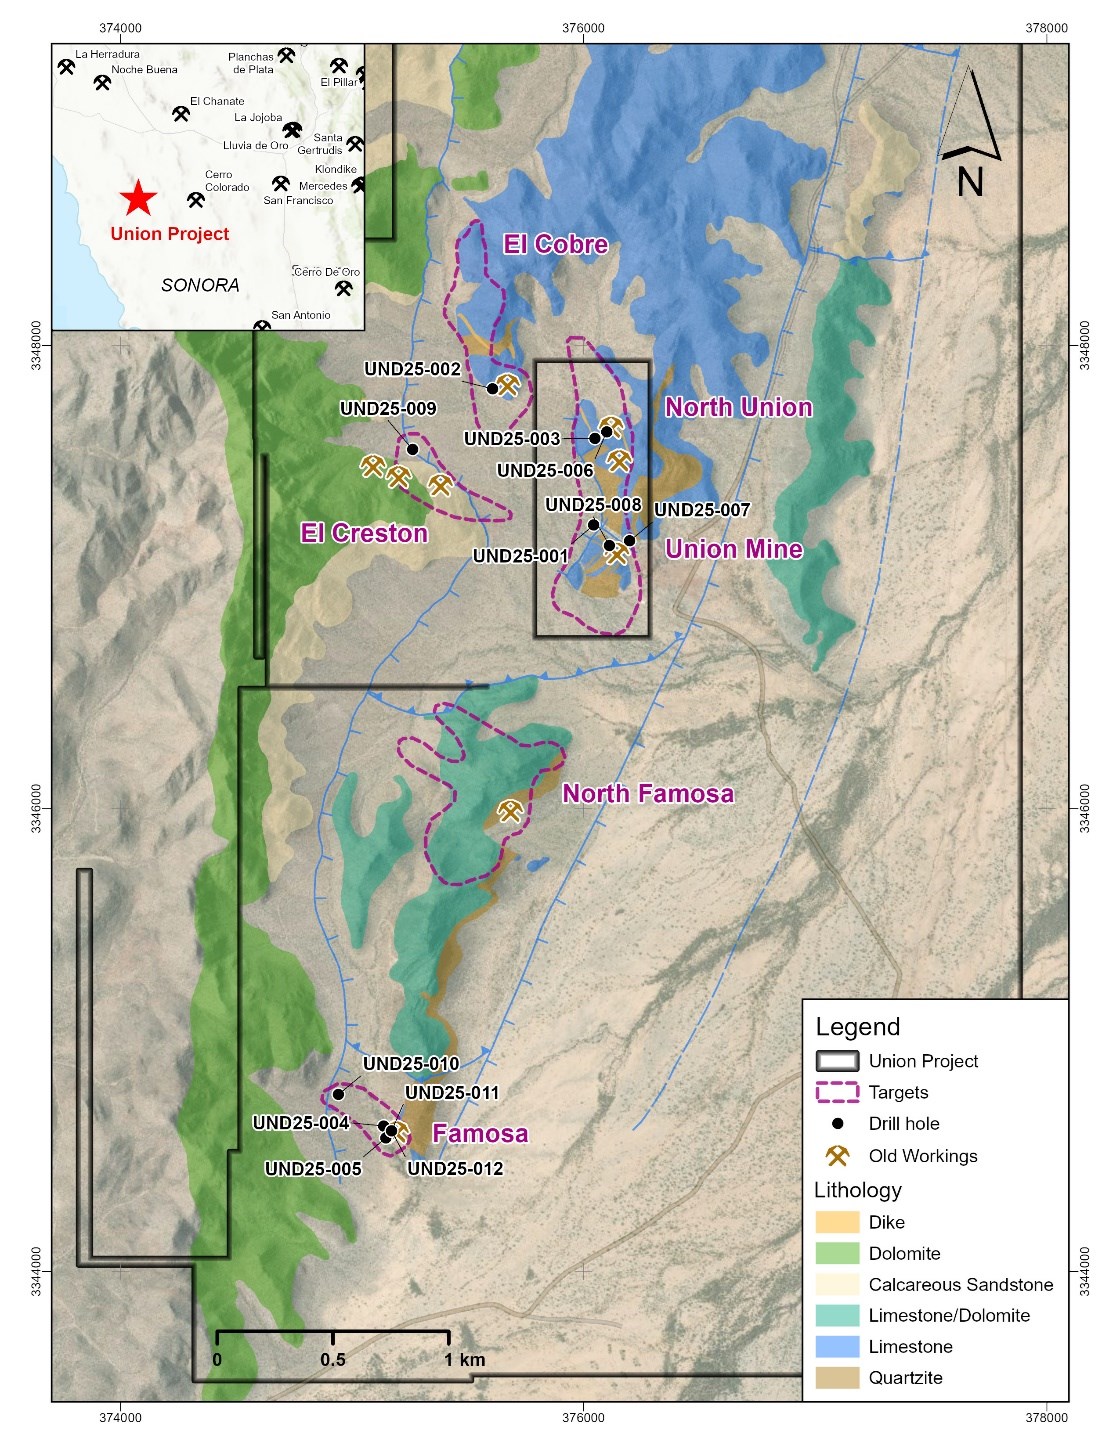
Figure 3. Midway Mine area proposed drilling with showings and gold in soils and rocks.
To view an enhanced version of this graphic, please visit:
https://images.newsfilecorp.com/files/4488/275142_7f84f9a9f4ee6b25_004full.jpg
Plans for Fall 2025 Exploration at Greenwood:
Trenching, rock and soil sampling along with drilling at the Midway Target area is being planned for fall 2025 and early 2026. The amount of drilling will depend upon the financing efforts and weather.
Additional results should be forthcoming over the next coming months as work progresses and will be presented in additional news releases.
Midway Mine Option Payment Settlement
On October 11, 2022, the Company entered into an option agreement with an arm’s length individual (the “Optionor”) to purchase the mineral rights to 317 hectares in seven mineral claims in the Greenwood, BC area (the “Midway Mine Claims”). Completion of the Midway Mine Option pursuant to the 2022 option agreement requires the payment of $10,000 and the issuance of 100,000 common shares of the Company on the third anniversary of regulatory acceptance of the Midway Mine Option.
The Optionor has agreed to accept additional common shares of the Company in lieu of the cash payment of $10,000 at a deemed price of $0.03 per common share (the “Cash Option Payment Shares”), for a total payment of 433,334 common shares to complete the third anniversary payment under the Midway Mine Option Agreement, and thereby complete the option. Pursuant to the third anniversary payment, the Company will have a 100% interest in the Midway Mine Claims, subject to a 1% NSR royalty in favour of the Optionor, and the Optionor retaining the rights to quarriable industrial rocks.
Interest on Note Payable
On May 15, 2025, the Company, among other things, issued a promissory note (the “Note”) to an arm’s length corporation in partial settlement of outstanding debt to a creditor of the Company. The Note has a principal amount of $250,000 and bears simple interest of 5% p.a., payable every six months from the date of issue, and matures on May 15, 2027. Under the terms of the Debt Settlement Agreement, the Company may, at its option, pay the interest payments in Common Shares of the Company.
The Company has proposed to settle the semi-annual interest payment due November 2025 in common shares, at a deemed price of $0.03 per Common Share, for a total of 208,333 common shares of the Company (the “Note Interest Shares”) representing the interest payment of $6,250.
The issuance of the Cash Option Payment Shares and the Note Interest Shares are subject to acceptance by the TSX Venture Exchange and, upon issuance, will be subject to restrictions on trading until four months and one day from issuance.
Quality Assurance and Control
Rock and soil samples are being analyzed at ALS Global Laboratories (Geochemistry Division) in Vancouver, Canada (an ISO/IEC 17025:2017 accredited facility). Gold was assayed using a fire assay with atomic emission spectrometry and gravimetric finish when required (+10 g/t Au). Rock grab and rock chip samples from outcrop/bedrock are selective by nature and may not be representative of the mineralization hosted on the project.
The sampling program was undertaken by Company personnel under the direction of Michael B. Dufresne, M.Sc., P.Geol., P.Geo.. A secure chain of custody is maintained in transporting and storing of all samples.
The technical content of this news release and the Company’s technical disclosure has been reviewed and approved by Michael B. Dufresne, M. Sc., P. Geol., P.Geo., who is a non-independent Consultant and Qualified Person as defined by National Instrument 43-101 Standards of Disclosure for Mineral Projects.
ABOUT GRIZZLY DISCOVERIES INC.
Grizzly is a diversified Canadian mineral exploration company with its primary listing on the TSX Venture Exchange focused on developing its approximately 72,700 ha (approximately 180,000 acres) of precious and base metals properties in southeastern British Columbia. Grizzly is run by a highly experienced junior resource sector management team, who have a track record of advancing exploration projects from early exploration stage through to feasibility stage.
On behalf of the Board,
GRIZZLY DISCOVERIES INC.
Brian Testo, CEO, President
Suite 363-9768 170 Street NW
Edmonton, Alberta T5T 5L4
For further information, please visit our website at www.grizzlydiscoveries.com or contact:
Nancy Massicotte
Corporate Development
Tel: 604-507-3377
Email: nancy@grizzlydiscoveries.com
Neither the TSX Venture Exchange nor its Regulation Services Provider (as that term is defined in the policies of the TSX Venture Exchange) accepts responsibility for the adequacy or accuracy of this release.
Caution concerning forward-looking information
This press release contains “forward-looking information” and “forward-looking statements” within the meaning of applicable securities laws. This information and statements address future activities, events, plans, developments and projections. All statements, other than statements of historical fact, constitute forward-looking statements or forward-looking information. Such forward-looking information and statements are frequently identified by words such as “may,” “will,” “should,” “anticipate,” “plan,” “expect,” “believe,” “estimate,” “intend” and similar terminology, and reflect assumptions, estimates, opinions and analysis made by management of Grizzly in light of its experience, current conditions, expectations of future developments and other factors which it believes to be reasonable and relevant. Forward-looking information and statements involve known and unknown risks and uncertainties that may cause Grizzly’s actual results, performance and achievements to differ materially from those expressed or implied by the forward-looking information and statements and accordingly, undue reliance should not be placed thereon.
Risks and uncertainties that may cause actual results to vary include but are not limited to the availability of financing; fluctuations in commodity prices; changes to and compliance with applicable laws and regulations, including environmental laws and obtaining requisite permits; political, economic and other risks; as well as other risks and uncertainties which are more fully described in our annual and quarterly Management’s Discussion and Analysis and in other filings made by us with Canadian securities regulatory authorities and available at www.sedarplus.ca Grizzly disclaims any obligation to update or revise any forward-looking information or statements except as may be required by law.
To view the source version of this press release, please visit https://www.newsfilecorp.com/release/275142