Vancouver, British Columbia–(Newsfile Corp. – April 5, 2023) – Goldshore Resources Inc. (TSXV: GSHR) (OTCQB: GSHRF) (FSE: 8X00) (“Goldshore” or the “Company“), is pleased to announce that, further to its news release dated March 23, 2023 and due to strong investor demand, it is increasing the size of its previously announced brokered private placement offering (the “Offering“) to up to $6,000,000 aggregate gross proceeds of securities of the Company (the “Offered Securities“). The Offering is being conducted by Research Capital Corporation and Eventus Capital Corp., as co-lead agents and joint bookrunners (the “Lead Agents“), on their own behalf and on behalf of a syndicate of agents, including Laurentian Bank Securities Inc., Canaccord Genuity Corp., and Haywood Securities Inc. (together with the Lead Agents, the “Agents“). The Offering consists of the following Offered Securities:
units of the Company (each, a “Unit“) at a price of $0.17 per Unit, comprised of one common share of the Company (each, a “Common Share“) and one-half common share purchase warrant (each whole warrant, a “Warrant“); and
flow-through units of the Company (each, a “FT Unit“) at a price of $0.195 per FT Unit, comprised of one Common Share that will qualify as “flow-through shares” within the meaning of subsection 66(15) of the Income Tax Act (Canada) (the “Tax Act“) and one-half of one Warrant.
Each Warrant shall entitle the holder thereof to acquire one Common Share at an exercise price of $0.25, for a period of 24 months following the Closing Date (as defined below).
The Company has granted the Agents an option (the “Agents’ Option“), which allows the Agents to offer up to an additional 15% of the Offering, on the same terms as the Offered Securities. The Agents’ Option may be exercised in whole or in part at any time prior to the Closing Date of the Offering.
The Company intends to use the net proceeds raised from the sale of Units for working capital and future exploration work on its Moss Lake gold deposit in Northwest Ontario, Canada.
The gross proceeds from the issuance of the FT Units will be used for “Canadian Exploration Expenses” within the meaning of the Tax Act (the “Qualifying Expenditures“), which will be renounced with an effective date no later than December 31, 2023 to the purchasers of the FT Units in an aggregate amount not less than the gross proceeds raised from the issue of FT Units. If the Qualifying Expenditures are reduced by the Canada Revenue Agency, the Company will indemnify each subscriber of FT Units for any additional taxes payable by such subscriber as a result of the Company’s failure to renounce the Qualifying Expenditures.
The Offering is scheduled to close on or about the week of April 12, 2023 (the “Closing Date“), or on such date as agreed upon between the Company and the Lead Agents, and is subject to the receipt of all necessary regulatory and other approvals, including, but not limited to, the approval of the TSX Venture Exchange. The Offered Securities will be subject to a hold period of four months and one day from the Closing Date in accordance with applicable securities laws.
The Company has agreed to pay to the Agents a cash commission equal to 6% of the gross proceeds of the Offering, subject to a reduction for certain orders on a “president’s list”. In addition, the Company has agreed to issue to the Agents compensation warrants of the Company exercisable for a period of 24 months, to acquire in aggregate that number of common shares of the Company which is equal to 6% of the number of Offered Securities sold under the Offering, subject to a reduction for certain orders on a “president’s list”.
This news release does not constitute an offer to sell or a solicitation of an offer to buy any of the securities in the United States. The securities have not been and will not be registered under the United States Securities Act of 1933, as amended (the “U.S. Securities Act“) or any state securities laws and may not be offered or sold within the United States or to U.S. Persons unless registered under the U.S. Securities Act and applicable state securities laws or an exemption from such registration is available.
Securities for Debt Transaction
The Company also announces that it has entered into an agreement to settle certain outstanding accounts payable in the aggregate amount of $513,157.18 (the “Debt“) owing to a creditor (the “Creditor“) through the issuance of 3,018,572 units (the “Debt Settlement Units“) at a deemed price of $0.17 per Unit (the “Securities for Debt Transaction“). The Debt Settlement Units will have the same terms as the Units issued pursuant to the Offering.
No new control person or insider of the Company will be created pursuant to the Securities for Debt Transaction. This is an arm’s length transaction.
The Company is proposing to issue the Debt Settlement Units to preserve cash to fund future operations. The Company’s board of directors believes that the Securities for Debt Transaction is necessary to provide the Company with a clean balance sheet to attract new capital and provide adequate hard dollar working capital into the second half of 2023.
The issuance of securities pursuant to the Securities for Debt Transaction is subject to the approval of the TSX Venture Exchange. All securities issued will be subject to a four month hold period which will expire on the date that is four months and one day from the date of issue.
Neither the TSXV nor its Regulation Services Provider (as that term is defined in the policies of the TSXV) accepts responsibility for the adequacy or accuracy of this release.
About Goldshore
Goldshore is an emerging junior gold development company, and owns the Moss Lake Gold Project located in Ontario. Wesdome Gold Mines Ltd. is currently a large shareholder of Goldshore with an approximate 22% equity position in the Company. Supported by an industry-leading management group, board of directors and advisory board, Goldshore is positioned to advance the Moss Lake Gold Project through the next stages of exploration and development.
For More Information – Please Contact:
Brett A. Richards President, Chief Executive Officer and Director Goldshore Resources Inc.
This news release contains statements that constitute “forward-looking statements.” Such forward looking statements involve known and unknown risks, uncertainties and other factors that may cause the Company’s actual results, performance or achievements, or developments to differ materially from the anticipated results, performance or achievements expressed or implied by such forward-looking statements. Forward looking statements are statements that are not historical facts and are generally, but not always, identified by the words “expects,” “plans,” “anticipates,” “believes,” “intends,” “estimates,” “projects,” “potential” and similar expressions, or that events or conditions “will,” “would,” “may,” “could” or “should” occur. These forward‐looking statements or information relate to, among other things: receipt of all approvals related to the Offering; the intended use of proceeds from the Offering; the expected Closing Date of the Offering; the incurrence of Qualifying Expenditures; and exploration and development activities at the Company’s properties.
Forward-looking statements in this news release include, among others, statements relating to expectations regarding the expected closing date of the Offering, and other statements that are not historical facts. By their nature, forward-looking statements involve known and unknown risks, uncertainties and other factors which may cause our actual results, performance or achievements, or other future events, to be materially different from any future results, performance or achievements expressed or implied by such forward-looking statements. Such factors and risks include, among others: the Company may require additional financing from time to time in order to continue its operations which may not be available when needed or on acceptable terms and conditions acceptable; compliance with extensive government regulation; domestic and foreign laws and regulations could adversely affect the Company’s business and results of operations; the stock markets have experienced volatility that often has been unrelated to the performance of companies and these fluctuations may adversely affect the price of the Company’s securities, regardless of its operating performance; and the impact of COVID-19.
The forward-looking information contained in this news release represents the expectations of the Company as of the date of this news release and, accordingly, is subject to change after such date. Readers should not place undue importance on forward-looking information and should not rely upon this information as of any other date. The Company undertakes no obligation to update these forward-looking statements in the event that management’s beliefs, estimates or opinions, or other factors, should change.
NOT FOR DISTRIBUTION TO U.S. NEWS WIRE SERVICES OR DISSEMINATION IN THE U.S.
Vancouver, British Columbia–(Newsfile Corp. – April 5, 2023) – Silver Hammer Mining Corp. (CSE: HAMR) (OTCQB: HAMRF) (FSE: 7BW0) (the “Company” or “Silver Hammer“) is pleased to announce that it has filed a National Instrument 43-101 compliant technical report (“Technical Report“) titled: Independent NI 43-101 Technical Report for the Silver Strand Gold-Silver Project (the “Project“), Kootenai County, Idaho, USA, on SEDAR.
“As we continue to evaluate our Silver Strand Project in Idaho, updating the 43-101 Technical Report is a positive step to fully understanding the exploration opportunity at the property. The recent completion of the geophysics compilation will help us target further priority exploration zones along the 5.8-kilometre-long Project,” commented President & CEO, Peter A. Ball.“We are currently completing our Plan of Operations, to be submitted to the United States Forest Service, which will highlight our exploration strategy for the coming seasons at the Project.”
The Technical Report was prepared in accordance with the Canadian Securities Administrators NI 43-101- Standards of Disclosure for Mineral Projects; and is available for review under the Company’s profile on SEDAR at www.sedar.com and the Company’s website at www.silverhammermining.com.
Annual General Meeting
The Company is also pleased to report results from its annual general meeting of the shareholders (“the AGM“) which took place on March 29, 2023, where all proposed resolutions were unanimously supported and all current board members of the Company re-elected, including Peter. A Ball (CEO), Alnesh Mohan (CFO), and independent directors, Lawrence Roulston, Ron Burk, and Joness Lang.
Qualified Person
Technical aspects of this press release have been reviewed and approved under the supervision of Philip Mulholland (CPG). Mr. Mulholland is a Qualified Person (QP) under National Instrument 43-101 Standards of Disclosure for Mineral Projects.
About Silver Hammer Mining Corp.
Silver Hammer Mining Corp. is a junior resource exploration company advancing its flagship past-producing Silver Strand Mine in the Coeur d’Alene Mining District in Idaho, as well both the Eliza Silver Project and the Silverton Silver Mine in one of the world’s most prolific mining jurisdictions in Nevada. Silver Hammer’s primary focus is defining and developing silver deposits near past-producing mines that have not been adequately explored. The Company’s portfolio also provides exposure to copper and gold discoveries.
On Behalf of the Board of Silver Hammer Mining Corp.
This news release contains “forward-looking statements” within the meaning of Canadian securities legislation. Such forward-looking statements concern, without limitation, the Company’s strategic plans, timing and expectations for the Company’s exploration and drilling programs, estimates of mineralization from drilling, geological information projected from sampling results and the potential quantities and grades of the target zones. Such forward-looking statements or information are based on a number of assumptions, which may prove to be incorrect. Assumptions have been made regarding, among other things: conditions in general economic and financial markets; accuracy of assay results; geological interpretations from drilling results, timing and amount of capital expenditures; performance of available laboratory and other related services; future operating costs; and the historical basis for current estimates of potential quantities and grades of target zones. The actual results could differ materially from those anticipated in these forward-looking statements as a result of risk factors, including the timing and content of work programs; results of exploration activities and development of mineral properties; the interpretation and uncertainties of drilling results and other geological data; receipt, maintenance and security of permits and mineral property titles; environmental and other regulatory risks; project costs overruns or unanticipated costs and expenses; availability of funds; failure to delineate potential quantities and grades of the target zones based on historical data, and general market and industry conditions. Forward-looking statements are based on the expectations and opinions of the Company’s management on the date the statements are made. The assumptions used in the preparation of such statements, although considered reasonable at the time of preparation, may prove to be imprecise and, as such, readers are cautioned not to place undue reliance on these forward-looking statements, which speak only as of the date the statements were made. The Company undertakes no obligation to update or revise any forward-looking statements included in this news release if these beliefs, estimates and opinions or other circumstances should change, except as otherwise required by applicable law.
The CSE does not accept responsibility for the adequacy or accuracy of this release. The Canadian Securities Exchange has neither approved nor disapproved the contents of this press release.
Vancouver, British Columbia–(Newsfile Corp. – April 3, 2023) – Silver Hammer Mining Corp. (CSE: HAMR) (OTCQB: HAMRF) (FSE: 7BW0) (the “Company” or “Silver Hammer“) is pleased to announce that it has recently completed a property-wide geophysical compilation at its Silver Strand Project in Idaho. Results were very positive and highlighted multiple new priority targets for the Company’s 2023 exploration program.
“Silver Hammer is excited to discover 15 new priority exploration target zones from our recently completed geophysical compilation using data from 2004 to 2022,”commented President & CEO, Peter A. Ball.“Most of the new targets within the property are located in the Revett Formation, which hosts our Silver Strand Mine. The same silver belt is within the renowned Coeur d’Alene mining district in Idaho that has produced over 1.2 billion ounces of silver and is host to some of the world’s largest silver mines. We are currently finalizing our submission of a Plan of Operations to the United States Forest Service, and with the new target zones, we anticipate an active year of exploration at our Silver Strand project.”
Geophysical Compilation Summary
Fifteen moderate to priority exploration target zones were identified from the geophysical surveys. The highest ranked targets are associated with chargeability anomalies and moderate to low conductivity. Most of the targets are located within the Revett Formation, which hosts the Silver Strand Mine.
The targets primarily identified from the Direct Current Induced Polarization (“DCIP“) results are considered moderate to high priority for follow-up, because these areas most closely resemble the responses identified around the Silver Strand Mine. These targets will be scheduled for ground follow-up to investigate the geological sources of the responses, and further geological interpretation of the geophysical surveys may identify further structural information in the data.
Technical Overview
Geophysical Compilation Overview
In 2004, DCIP and Very Low Frequency (“VLF“) surveys were conducted by Lou O’Connor and Minex Exploration for New Jersey Mining Company at the Silver Strand property.
In 2021, an Unmanned Aerial Vehicle (“UAV“) magnetic survey was completed by MWH Geo-Surveys International Inc.
In 2022, Big Sky Geophysics completed a DCIP survey.
The geophysical compilation and interpretation study was completed by Condor North Consulting ULC. The study was focused on investigating the resistivity and chargeability models along with the magnetic data to determine geophysical responses to help highlight areas of interest on the project area. The 2004 DCIP and VLF survey consisted of 4 line-kilometres (“km”) of surveying over five lines. The DCIP survey used 50 metre (“m”) dipoles in a dipole-dipole electrode configuration. VLF readings were taken along the same lines at 12.5 m intervals using three stations, Jim Creek, Lualualei and Cutler. The 2022 DCIP survey consisted of 4.5 line-km of surveying over 3 lines. A 100 m dipole spacing was used with a dipole-dipole electrode configuration.
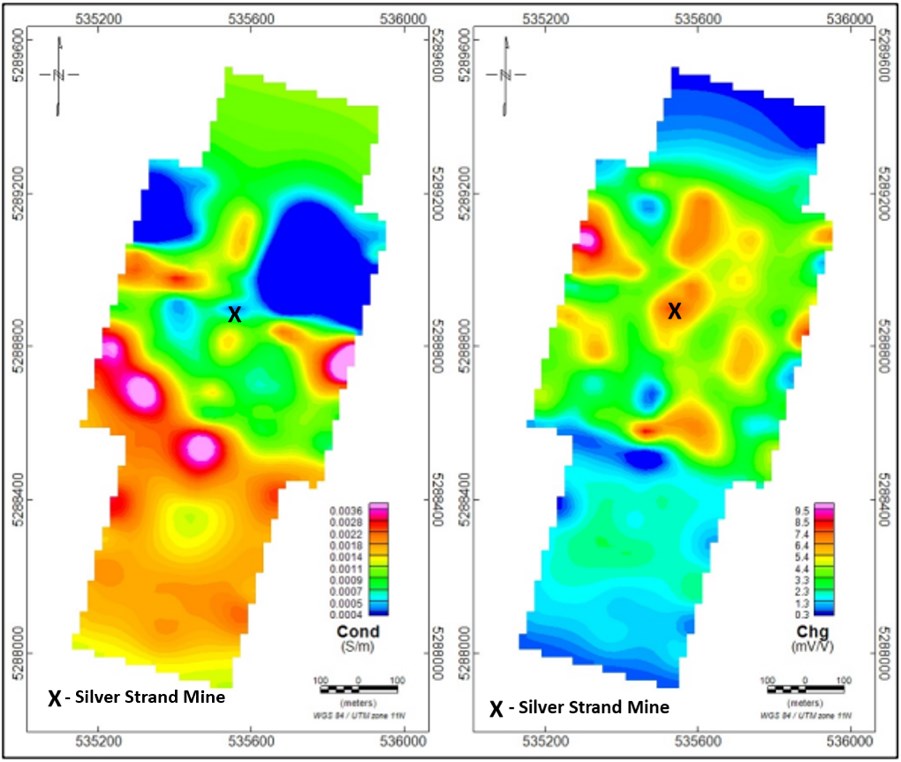
Figure 1: The combined 2004 and 2022 3D (DCIP) conductivity (left) and chargeability (right) inversion results for a draped depth surface 50 m below topography.
“The geophysical results compared to the known geological model appear to highlight key features of the Silver Strand deposit, and have generated some exciting new previously unknown targets,”commented Phil Mulholland, Chief Geologist.“After working on the Silver Strand Project for two years, the geophysical study clearly indicates the potential of the property and provides additional information to execute an aggressive property-wide exploration program.”
The conductivity results in Figure 1 show that the southern half of the survey area is more conductive than the northern half. The strongest conductivity feature runs along the south edge of the 2004 survey area. Several chargeability anomalies are present within the central portion of the surveys, including the Silver Strand Mine.
UAV Magnetic Survey
The UAV magnetic survey was completed from August 3rd to 19th, 2021. A total of 521 line-km was collected with a line spacing of 25 m (MWH, 2021).
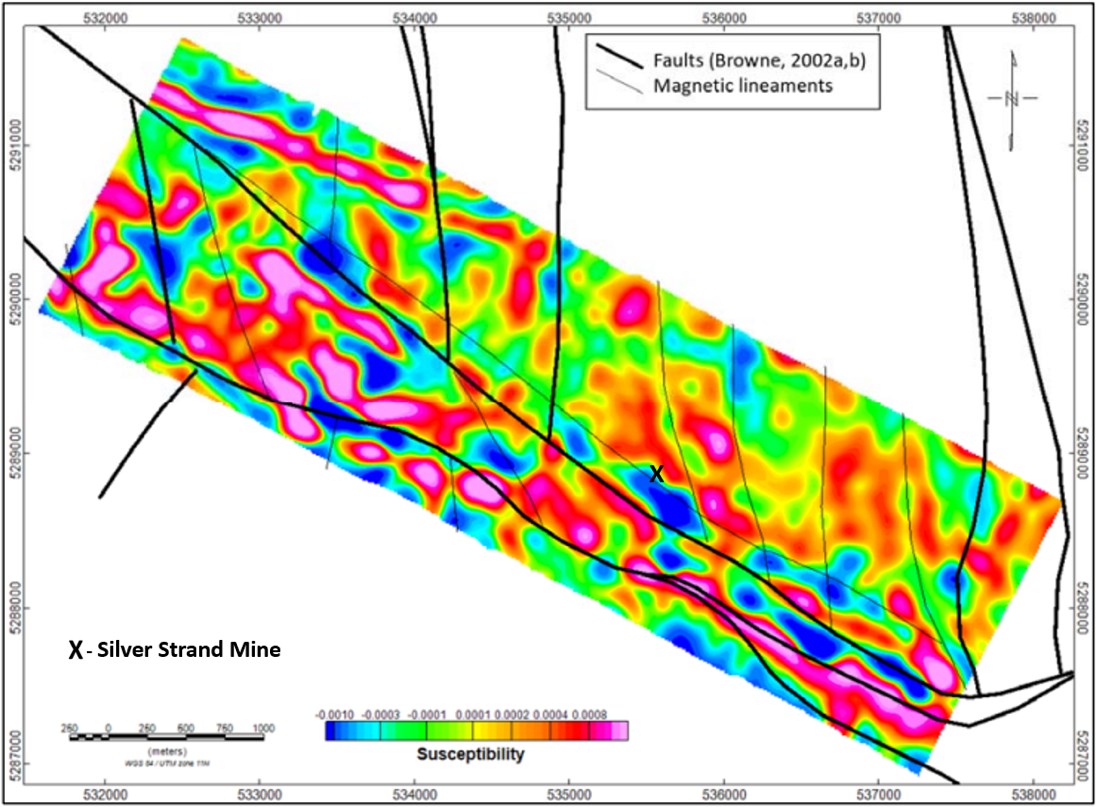
The measured magnetic data reveals a small variation in magnitude throughout the survey area. This small range indicates there is a low variation in the magnetic susceptibilities of the underlying rocks. The magnetic data shows several west-northwest trending narrow magnetic highs, predominately along the southwest half of the grid. These highs may indicate the presence of mafic dikes, which is of interest due to the proximity of these dikes to mineralization found in the Silver Strand Mine. These magnetic lineaments are displayed along with faults from geologic maps in Figure 2.
Figure 2: Interpreted magnetic lineaments with faults, (Idaho Geological Survey, Browne 2002) on draped depth slice from the 3D susceptibility model at a depth of 50 m below surface.
The 2004 VLF data identified several conductors, which corresponded with conductive areas in the DCIP conductivity model. The VLF conductors appear to correlate with magnetic highs to the northeast of the mine area, while the southern conductive trend shows a more variable magnetic response. The two VLF anomalies to the southwest of the mine area are associated with a broad magnetic low.
Target Zones Study
The purpose of this study was to compare DCIP, VLF and UAV magnetic data of a known mineral occurrence located at the Silver Strand Mine. Target zones would have similar geophysical characteristics and may include areas of anomalous conductivity, chargeability and/or susceptibility.
The 50 m draped depth slices from these two products are shown in Figure 3 with the mapped mafic dikes at the mine site shown in black. From these images a chargeability anomaly and low conductivity are located along the western half of the dike location and extending further to the northwest. The conductivity low may be related to silicification observed at the mine site, while the chargeability anomaly is likely caused by disseminated sulphides that are also present at the mine site. These observations indicate that other chargeability anomalies in the survey area, especially where they are coincident with conductivity lows, are of interest for further investigation.
The target zones are based on the DCIP results along with the magnetic trends. The geophysical responses observed in the area of the Silver Strand Mine were used to prioritize the targets.
Figure 3: Target Zones are shown from 3D conductivity (left), chargeability (centre) and susceptibility (right) models 50 m below the surface. Mafic dikes are shown from the mine site by black polygon.
Technical aspects of this press release have been reviewed and approved under the supervision of Philip Mulholland, P.Geo. Mr. Mulholland is a Qualified Person (QP) under National Instrument 43-101 Standards of Disclosure for Mineral Projects.
About Silver Hammer Mining Corp.
Silver Hammer Mining Corp. is a junior resource exploration company advancing its flagship past-producing Silver Strand Mine in the Coeur d’Alene Mining District in Idaho, as well both the Eliza Silver Project and the Silverton Silver Mine in one of the world’s most prolific mining jurisdictions in Nevada. Silver Hammer’s primary focus is defining and developing silver deposits near past-producing mines that have not been adequately explored. The Company’s portfolio also provides exposure to copper and gold discoveries.
On Behalf of the Board of Silver Hammer Mining Corp.
This news release contains “forward-looking statements” within the meaning of Canadian securities legislation. Such forward-looking statements concern, without limitation, the Company’s strategic plans, timing and expectations for the Company’s exploration and drilling programs, estimates of mineralization from drilling, geological information projected from sampling results and the potential quantities and grades of the target zones. Such forward-looking statements or information are based on a number of assumptions, which may prove to be incorrect. Assumptions have been made regarding, among other things: conditions in general economic and financial markets; accuracy of assay results; geological interpretations from drilling results, timing and amount of capital expenditures; performance of available laboratory and other related services; future operating costs; and the historical basis for current estimates of potential quantities and grades of target zones. The actual results could differ materially from those anticipated in these forward-looking statements as a result of risk factors, including the timing and content of work programs; results of exploration activities and development of mineral properties; the interpretation and uncertainties of drilling results and other geological data; receipt, maintenance and security of permits and mineral property titles; environmental and other regulatory risks; project costs overruns or unanticipated costs and expenses; availability of funds; failure to delineate potential quantities and grades of the target zones based on historical data, and general market and industry conditions. Forward-looking statements are based on the expectations and opinions of the Company’s management on the date the statements are made. The assumptions used in the preparation of such statements, although considered reasonable at the time of preparation, may prove to be imprecise and, as such, readers are cautioned not to place undue reliance on these forward-looking statements, which speak only as of the date the statements were made. The Company undertakes no obligation to update or revise any forward-looking statements included in this news release if these beliefs, estimates and opinions or other circumstances should change, except as otherwise required by applicable law.
The CSE does not accept responsibility for the adequacy or accuracy of this release. The Canadian Securities Exchange has neither approved nor disapproved the contents of this press release.
North Vancouver, British Columbia–(Newsfile Corp. – April 3, 2023) – Lion One Metals Limited (TSXV: LIO) (OTCQX: LOMLF) (ASX: LLO) (“Lion One” or the “Company”) announces a significant milestone at Tuvatu. Initial mining of near-surface, high-grade gold bearing mineralization has commenced from a recently discovered mineralized lode. To date, strike driving along the new lode totals 14 cuts for an estimated 475 tonnes, much of which has already been added to the Company’s mining inventory stockpile. The high-grade inventory stockpile will constitute the initial feed for the Company’s custom-designed-for-purpose processing facility, currently under construction.
Figure 1. Photo of the first cut on the lode, strike drive from the new development decline.
The new lode was discovered in late 2022, 75 meters into the new development decline, and was subsequently defined by underground mapping, chip-channel sampling, and diamond drilling.
Development along the strike has since been extended by 13m, by way of 7 separate cuts, each cut representing approximately 30 tonnes of material. Vertical development of 9m as a 1.5 x 1.5m rise has been completed, as well as an additional 7 cuts, for a total of approximately 475 tonnes of gold mineralized material, to date. Tuvatu has implemented airleg mining, which allows for flexibility and optionality to deliver low-cost tonnage at minimum mining widths of 1.8m and a rate of advancement of 4m/day.
Several recent drillholes have intersected multiple high grade intercepts. Systematic face sampling provides detailed information that compare favourably with previous drill results.
The material extracted from this drive represents the first modern extraction from the Tuvatu deposit, and as such represents a significant milestone for the company.
Table 1. Composited results from drillholes intersecting the lode. Coordinates are in Fiji map grid.
Hole ID
From (m)
To (m)
Interval (m)
Au g/t
Easting
Northing
Elevation
Azimuth
Dip
TUDDH-617
56.1
58.2
2.1
1.76
1876512.6
3920929.1
236.3
097
-60
including
57.9
58.2
0.3
6.30
59.7
63.3
3.6
2.93
including
59.7
60.0
0.3
17.01
TUDDH-619
65.0
65.3
0.3
3.48
1876257.7
3920801.2
203.2
266
-60
TUDDH-621
159.3
160.5
1.2
27.99
1876257.7
3920799.9
203.0
297
-60
TUDDH-624
79.1
81.2
2.1
20.16
1876257.5
3920800.1
203.1
262
-65
including
79.1
80.3
1.2
33.04
including
79.7
80.0
0.3
106.99
TUDDH-542
79.8
81.5
1.7
1.65
1876170.4
3920845.3
166.6
139
-7
including
79.8
80.1
0.3
5.77
TUDDH-359
93.24
95.68
2.44
4.21
1876222.0
3920742.0
207.6
359
-65
including
93.24
93.65
0.41
10.85
TUDDH-355
31.63
32.0
0.37
8.96
1876223.0
3920779.0
203.5
359
-63
TUDDH-086
241.25
243.3
2.05
9.14
1876335.0
3920736.0
226.5
279
-60
including
241.25
241.95
0.7
18.7
Table 2. Selected chip-channel results from sampling in the development decline, face samples along successive cuts of the strike drive along lode, and samples from the rise lode. Coordinates are in Fiji map grid.
Channel ID
From
To
Interval
Au
Coordinates
Elevation
Final depth
Azimuth
Dip
m
m
m
g/t
Easting
Northing
m
m
deg.
deg.
MD-CH-001
0.0
2.5
2.5
9.94
1876219.1
3920779.2
157.6
2.5
-13
-13
1.0
1.5
0.5
32.57
MD-CH-002
0.0
1.0
1.0
29.02
1876219.2
3920779.0
158.6
1.5
-13
-13
0.5
1.0
0.5
55.12
MD-CH-003
1.0
3.0
2.0
8.91
1876227.3
3920778.8
156.0
3
-13
-13
2.5
3.0
0.5
22.48
MD-CH-004
1.5
3.0
1.5
11.93
1876228.0
3920778.1
155.5
3
-14
-14
1.5
2.0
0.5
26.09
MD-CH-005
1.0
2.5
1.5
15.17
1876220.6
3920784.2
157.5
4
-14
-14
1.5
2.0
0.5
41.94
MD-CH-006
1.5
3.0
1.5
10.88
1876220.4
3920784.9
158.7
4
-11
-11
1.5
2.0
0.5
31.17
MD-CH-011
0.0
2.5
2.5
10.46
1876232.2
3920768.5
155.3
2.5
-13
-13
1.5
2.0
0.5
44.30
1155URA1STHOD.02
0.0
1.4
1.4
14.70
1876220.2
3920774.4
157.0
2.05
0
0
0.9
1.4
0.5
29.20
1155URA1STHOD.03
0.0
2.4
2.4
7.57
1876219.8
3920772.6
156.9
2.4
0
0
1.0
1.45
0.45
32.89
1155URA1STHOD.04
0.7
1.6
0.9
15.86
1876219.5
3920771.0
157.2
2
0
0
1.3
1.6
0.3
39.60
1155URA1STHOD.05
0.6
1.3
0.7
3.23
1876218.8
3920769.5
157.2
2.6
0
0
1155URA1STHOD.06
0.0
2.2
2.2
3.69
1876217.6
3920768.0
157.4
3
0
0
1155URA1STHOD.07
0.0
2.7
2.7
6.89
1876216.5
3920766.4
157.9
2.7
0
0
0.5
1.0
0.5
24.88
1155URA1NTHOD.05
0.0
1.6
1.6
2.18
1876223.9
3920790.8
158.0
2
0
0
1.2
1.6
0.4
8.07
1155URA1NTHOD.08
0.5
2.0
1.5
3.95
1876226.4
3920796.8
157.4
2.1
0
0
1.2
1.6
0.4
14.42
Rise STH side
1.2
2.0
10.35
1876214.8
3920767.3
159.9
7
60.7
60.7
3.0
4.0
9.48
4.0
5.0
20.19
Rise NTH side
0.0
1.2
12.84
1876215.4
3920769.8
159.8
7
54.6
54.6
3.0
4.0
12.85
5.0
6.0
13.93
Figure 2A. Photo of lode cut No. 2 face of the South strike drive from the development decline; Figure 2 B. Photo of lode cut No. 7 face of the North strike drive.
Figure 3 shows a rendering of the development along the new lode to date. Figure 3 also provides an update to the total development achieved to date along the main decline, toward the important additional lode on which much of the detailed grade control drilling has been focused. It is expected that the decline will reach this additional high-grade lode, likely within the next month.
Figure 3. Plan view rendering of the current as-built model of the underground development completed to date. The entrance to the decline is at the top left. The location of the new lode (green) and additional lodes (blue and orange) are shown. The open gray shape indicates planned development to expose the lodes. North is toward the top of the image. Coordinates are in Fiji map grid.
The well-defined structure consists of a quartz vein array with minor to trace pyrite, chalcopyrite, sphalerite and bornite, as well as coarse native gold (Figures 4a, b), typically in association with roscoelite. Late carbonate veinlets crosscut the structure. The vein is hosted by monzonite, with well developed symmetric bleached alteration. The highly visible alteration envelope has rendered advancement on this mineralized structure very straight-forward by way of visual identification alone.
Figure 4. Photos of coarse visible gold in samples collected from the lode. A) 158.7m elevation, width of photo is ~25cm across; B) 159.5m elevation, width of photo is ~30cm across.
The Tuvatu Alkaline Gold Project is located on the island of Viti Levu in Fiji. The January 2018 mineral resource for Tuvatu as disclosed in the technical report “Technical Report and Preliminary Economic Assessment for the Tuvatu Gold Project, Republic of Fiji”, dated September 25, 2020, and prepared by Mining Associates Pty Ltd of Brisbane Qld, comprises 1,007,000 tonnes indicated at 8.50 g/t Au (274,600 oz. Au) and 1,325,000 tonnes inferred at 9.0 g/t Au (384,000 oz. Au) at a cut-off grade of 3.0 g/t Au. The technical report is available on the Lion One website at www.liononemetals.com and on the SEDAR website at www.sedar.com.
Qualified Person
In accordance with National Instrument 43-101 – Standards of Disclosure for Mineral Projects (“NI 43- 101”), Sergio Cattalani, P.Geo, Senior Vice President Exploration, is the Qualified Person for the Company and has reviewed and is responsible for the technical and scientific content of this news release.
QAQC Procedures
Lion One adheres to rigorous QAQC procedures above and beyond basic regulatory guidelines in conducting its sampling, drilling, testing, and analyses. The Company utilizes its own fleet of diamond drill rigs, using PQ, HQ and NQ sized drill core rods. Drill core is logged and split by Lion One personnel on site. Samples are delivered to and analyzed at the Company’s geochemical and metallurgical laboratory in Fiji. Duplicates of all samples with grades above 0.5 g/t Au are both re-assayed at Lion One’s lab and delivered to ALS Global Laboratories in Australia (ALS) for check assay determinations. All samples for all high-grade intercepts are sent to ALS for check assays. All samples are pulverized to 85% passing through 75 microns. Gold analysis is carried out using fire assay with an AA finish. Samples that have returned grades greater than 10.00 g/t Au are then re-analyzed by gravimetric method. For samples that return greater than 0.50 g/t Au, repeat fire assay runs are carried out and repeated until a result is obtained that is within 10% of the original fire assay run. Lion One’s laboratory can also assay for a range of 71 other elements through Inductively Coupled Plasma Optical Emission Spectrometry (ICP-OES), but currently focuses on a suite of 9 important pathfinder elements. All duplicate anomalous samples are sent to ALS labs in Townsville QLD and are analyzed by the same methods (Au-AA26, and Au-GRA22 where applicable). ALS also analyses 33 pathfinder elements by HF-HNO3-HClO4 acid digestion, HCl leach and ICP-AES (method ME-ICP61).
About Lion One Metals Limited
Lion One’s flagship asset is 100% owned, fully permitted high grade Tuvatu Alkaline Gold Project, located on the island of Viti Levu in Fiji. Lion One envisions a low-cost high-grade underground gold mining operation at Tuvatu coupled with exciting exploration upside inside its tenements covering the entire Navilawa Caldera, an underexplored yet highly prospective 7km diameter alkaline gold system. Lion One’s CEO Walter Berukoff leads an experienced team of explorers and mine builders and has owned or operated over 20 mines in 7 countries. As the founder and former CEO of Miramar Mines, Northern Orion, and La Mancha Resources, Walter is credited with building over $3 billion of value for shareholders.
On behalf of the Board of Directors of Lion One Metals Limited “Walter Berukoff“, Chairman and CEO
Neither the TSX Venture Exchange nor its Regulation Service Provider accepts responsibility for the adequacy or accuracy of this release
This press release may contain statements that may be deemed to be “forward-looking statements” within the meaning of applicable Canadian securities legislation. All statements, other than statements of historical fact, included herein are forward-looking information. Generally, forward-looking information may be identified by the use of forward-looking terminology such as “plans”, “expects” or “does not expect”, “proposed”, “is expected”, “budget”, “scheduled”, “estimates”, “forecasts”, “intends”, “anticipates” or “does not anticipate”, or “believes”, or variations of such words and phrases, or by the use of words or phrases which state that certain actions, events or results may, could, would, or might occur or be achieved. This forward-looking information reflects Lion One Metals Limited’s current beliefs and is based on information currently available to Lion One Metals Limited and on assumptions Lion One Metals Limited believes are reasonable. These assumptions include, but are not limited to, the actual results of exploration projects being equivalent to or better than estimated results in technical reports, assessment reports, and other geological reports or prior exploration results. Forward-looking information is subject to known and unknown risks, uncertainties and other factors that may cause the actual results, level of activity, performance or achievements of Lion One Metals Limited or its subsidiaries to be materially different from those expressed or implied by such forward-looking information. Such risks and other factors may include, but are not limited to: the stage development of Lion One Metals Limited, general business, economic, competitive, political and social uncertainties; the actual results of current research and development or operational activities; competition; uncertainty as to patent applications and intellectual property rights; product liability and lack of insurance; delay or failure to receive board or regulatory approvals; changes in legislation, including environmental legislation, affecting mining, timing and availability of external financing on acceptable terms; not realizing on the potential benefits of technology; conclusions of economic evaluations; and lack of qualified, skilled labour or loss of key individuals. Although Lion One Metals Limited has attempted to identify important factors that could cause actual results to differ materially from those contained in forward-looking information, there may be other factors that cause results not to be as anticipated, estimated or intended. Accordingly, readers should not place undue reliance on forward-looking information. Lion One Metals Limited does not undertake to update any forward-looking information, except in accordance with applicable securities laws.
Burlington, Ontario–(Newsfile Corp. – March 29, 2023) – Silver Bullet Mines Corp. (TSXV: SBMI) (OTCQB: SBMCF) (‘SBMI’ or ‘the Company’) is pleased to announce it has received the assay results from a third party independent (ISO 17025-2017) accredited lab, American Assay Laboratories. These are the ‘check assays’ for material tested and reported in September and October, 2022. These results confirm the presence of anomalous platinum group elements (PGE) values in some of the material.
QA/QC
A total of six samples, 6 duplicates, 4 standards and one blank sample were assayed. The samples were collected by the mine crew from various material at the Buckeye Mine and were crushed and ground to a powder at the Company’s assay lab with the powder retained in marked sample bags. A portion of each of these bags was retained and a portion was inserted in another labelled bag and then delivered by a courier in Globe, Arizona to American Assay Laboratories in Nevada. The blank and standards were included as well. American Assay Laboratories used a similar assay finish procedure as the first lab, Lone Pine, namely ICP-MS. Lone Pine used a 4 acid dissolution of a 200 milligram sample and American Assay Laboratories used a sodium peroxide fusion of a 5 gram sample.
To further confirm the presence of platinum a repeat Fire Assay was undertaken. For this method the sample was fused in a ceramic crucible with litharge, sodium carbonate, borax and flour at 1080°C. From this a 25-50 gram lead button was cupelled in a magnesite cupel at 900° for 60 minutes. The silver bead was then parted with concentrated nitric acid followed by hydrochloric acid to generate chlorine and nitrosoyl chloride that dissolved the PGM sponge. Digested samples were read on an ICP-AES.
The PGE results obtained from American Assay Laboratories were in line with a 1995 historic report and that of Lone Pine.
American Assay Laboratories assayed for silver, gold, iridium, osmium, palladium, platinum, rhodium and ruthenium (see chart below). The green highlighted samples relate to standards and the yellow to blanks.
Based on these results the Company plans to continue its evaluation of the economic potential of PGE on the Buckeye Mine. Samples within the Buckeye Mine upper adit hydrothermal vein system are in the process of being sent to Dr. A. Macdonald at Laurentian University for further analysis, and a selective sampling program is to be initiated. Further testing will be done using ICP-MS as well as NAA (nuclear activation analysis) when warranted.
Mr. Robert G. Komarechka, P.Geo., an independent consultant, has reviewed and verified SBMI’s work referred to herein, and is the Qualified Person for this release.
The Company also announces that due to time commitments on other projects, J. Birks Bovaird has resigned from the board of directors. The Company thanks him for his tireless commitment to the shareholders.
The Company also announces the appointment to the board of John S. MacKenzie, CPA CA. Mr. MacKenzie will also serve as the board’s chair.
Mr. MacKenzie is currently CFO and a founding shareholder of Critical Minerals Americas Inc., a private exploration stage mining company in Alberta. He is also CFO and a founding shareholder of Evergreen Environmental Inc., engaged in the anaerobic digestion of organic waste and production and sales of RNG.
In the past Mr. MacKenzie was for 13 years the CEO of international heavy jet cargo airline AllCanada Express (ACE) and has since occupied both C-Suite and consulting positions with various mining, aviation, and technology companies. He has extensive financing, lease, purchase and sales experience over dozens of transactions and hundreds of millions of dollars of equipment.
Mr. MacKenzie also has ten years of public accounting experience with Clarkson Gordon / Ernst & Young.
Peter M. Clausi Silver Bullet Mines Corp., VP Capital Markets pclausi@brantcapital.ca +1 (416) 890-1232
Cautionary and Forward-Looking Statements
This news release contains certain statements that constitute forward-looking statements as they relate to SBMI and its subsidiaries. Forward-looking statements are not historical facts but represent management’s current expectation of future events, and can be identified by words such as “believe”, “expects”, “will”, “intends”, “plans”, “projects”, “anticipates”, “estimates”, “continues” and similar expressions. Although management believes that the expectations represented in such forward-looking statements are reasonable, there can be no assurance that they will prove to be correct.
By their nature, forward-looking statements include assumptions, and are subject to inherent risks and uncertainties that could cause actual future results, conditions, actions or events to differ materially from those in the forward-looking statements. If and when forward-looking statements are set out in this new release, SBMI will also set out the material risk factors or assumptions used to develop the forward-looking statements. Except as expressly required by applicable securities laws, SBMI assumes no obligation to update or revise any forward-looking statements. The future outcomes that relate to forward-looking statements may be influenced by many factors, including but not limited to: the impact of SARS CoV-2 or any other global virus; reliance on key personnel; the thoroughness of its QA/QA procedures; the continuity of the global supply chain for materials for SBMI to use in the production and processing of mineralized material; the presence of mineable economic mineralized material; shareholder and regulatory approvals; activities and attitudes of communities local to the location of the SBMI’s properties; risks of future legal proceedings; income tax matters; fires, floods and other natural phenomena; the rate of inflation; availability and terms of financing; distribution of securities; commodities pricing; currency movements, especially as between the USD and CDN; effect of market interest rates on price of securities; and, potential dilution. SARS CoV-2 and other potential global pathogens create risks that at this time are immeasurable and impossible to define.
VANCOUVER, BC / ACCESSWIRE / March 29, 2023 / Granite Creek Copper Ltd. (TSXV:GCX)(OTCQB:GCXXF) (“Granite Creek” or the “Company“) is pleased to announce the appointments of Mr. Robert Sennott to the board of directors of the Company and of Mr. Peter Harris, P.Eng., to the Company’s advisory board as it embarks on the next stage of development of the Carmacks copper-gold-silver project in Yukon, Canada. François Lalonde will step down from the board of directors to focus on his leadership role at TSX Venture listed Stellar Africa Gold. Granite Creek wishes to thank François for his dedication and contributions to the board and wish him the best in all his future ventures.
Tim Johnson, President and CEO, stated, “We look forward to working closely with Rob Sennott and Peter Harris as we advance our promising critical mineral projects for copper and molybdenum toward development and production. It is an exciting time for the Company with the recent 43% expansion of the resource at Carmacks and a robust PEA released in January 2023 as well as the acquisition of the 90+ million-pound bulk mineable LS molybdenum resource in central British Columbia. We look forward to providing updates in the near future on the Company’s recently initiated process test work for improved oxide recovery at the Carmacks project and exciting exploration potential for resource expansion developed from our 2022 geophysical and geochemical surveys, proximal to the existing resources.”
Robert Sennott
Rob is a long-time investor, entrepreneur, philanthropist and film producer. He has been a long-time resource investor and is an investor and supporter of each of the three Metallic Group companies. Rob was the founder of Market Intelligence, a real estate information services company, that was acquired by Alleghany Corporation, which in turn was recently acquired by Berkshire Hathaway. He has served on the board of directors of First Community Bank and was a Beige Book respondent for the Federal Reserve Bank of Boston. Rob has also served on the board of a non-profit organization addressing poverty in rural communities, where he brought an entrepreneurial approach to fundraising. Rob’s success in business management and focus on building prosperous communities will be a great benefit to Granite Creek as it moves from exploration stage to developer.
Peter Harris
Peter is a mining engineer with over 40 years of global mining industry experience in project evaluation, development, mine construction and operations. Peter’s career is highlighted by prominent roles with Placer Dome (now Barrick Gold) as Senior Vice President of Project Development and President & CEO of Placer Dome South Africa. He also was part of the early formation of NovaGold Resources as Chief Operating Officer. Peter brings a deep understanding of what it takes to have a successful mining project having been involved in various stages of evaluation, development, construction and operation of over 20 mineral projects in his career in North and South America, Africa, Australia and Papua New Guinea. His experience ranges from high-grade underground operations to large scale open pit deposits of base & precious metals. He has a strong track record of leading corporate development teams in strategic acquisitions, financing as well as structuring of engineering initiatives to optimize costs and identify opportunities. A mine engineering graduate of the University of Newcastle-upon-Tyne with executive and board of director experience in mining and related industries, Peter also led the design and introduction of World Bank recognized employee programs for affected mine-workers related to major mine re-structuring and AIDS programs. Peter’s experience in all aspects of major project and mine development including working with communities will add tremendous value as the company advances to the next stages of development at our critical mineral projects.
About Granite Creek Copper
Granite Creek, a member of the Metallic Group of Companies, is a Canadian exploration company focused on the exploration and development of critical minerals projects in North America. The company’s projects consist of its flagship 176 square kilometer Carmacks project in the Minto copper district of Canada’s Yukon Territory on trend with the high-grade Minto copper-gold mine, operated by Minto Metals Corp., the advance staged LS Molybdenum project and the copper-nickel-PGM Star project both located in central British Columbia. More information about Granite Creek Copper can be viewed on the Company’s website at www.gcxcopper.com.
Neither the TSX Venture Exchange nor its Regulation Services Provider (as that term is defined in the policies of the TSX Venture Exchange) accepts responsibility for the adequacy or accuracy of this release.
Vancouver, British Columbia–(Newsfile Corp. – March 28, 2023) – EMX Royalty Corporation (NYSE American: EMX) (TSXV: EMX) (FSE: 6E9) (the “Company” or “EMX”) – is pleased to announce the filing of its 2022 annual report Form 40-F, which includes the audited financial statements for the year ended December 31, 2022, with the U.S. Securities and Exchange Commission (“SEC”) on EDGAR (www.sec.gov). EMX has also filed its Annual Information Form (AIF), audited Financial Statements (FS), and Management’s Discussion and Analysis (MD&A) for 2022 with Canadian securities regulators on SEDAR (www.sedar.com). The Company’s Form 40-F, AIF, audited FS, and MD&A are also available on EMX’s website at www.EMXroyalty.com under the heading “Investors”. Shareholders may receive a printed copy of the Company’s complete Financial Statements, or its complete Annual Information Form, free of charge, upon request to the Corporate Secretary at Suite 501 – 543 Granville Street, Vancouver, British Columbia V6C 1X8, Canada. All dollar amounts in this news release are USD unless otherwise noted.
HIGHLIGHTS
Financial Updates for the Year Ended December 31, 2022
Revenue and other income for the year ended December 31, 2022 was $18,277,000 (2021 – $7,526,000). Adjusted revenue and other income1 of $25,403,000 (2021 – $11,044,000) included $7,126,000 (2021 – $3,518,000) in income for the Company’s share of royalty revenue from the Caserones Mine (effective) royalty interest in Chile.
Net income for the year ended December 31, 2022 was $3,349,000 (2021 – loss of $23,731,000).
Operating cash flow for the year ended December 31, 2022 was $16,729,000 (2021 – cash used of $8,062,000). Adjusted operating cash flow1 from operations for the year ended December 31, 2022 was $21,953,000 (2021 – cash used of $6,356,000).
As at December 31, 2022, EMX had cash and cash equivalents of $15,508,000 (December 31, 2021 – $19,861,000), investments, long-term investments and loans receivable valued at $14,561,000 (December 31, 2021 – $18,170,000) and loans payable of $40,489,000 (December 31, 2021 – $50,733,000).
Corporate Updates
Timok Dispute Update On January 27, 2022 the Company announced that it had suspended the filing of a Notice of Arbitration to Zijin Mining Group Ltd (“Zijin”) regarding its royalty agreement covering the Timok project in Serbia, which includes the producing Cukaru Peki copper and gold mine. This suspension followed EMX’s previous announcement of its intention to file the Notice of Arbitration to formally dispute the royalty rate as defined under the Royalty Agreement (see EMX news release dated December 17, 2021). Discussions with Zijin have since proved amicable and productive. Both companies are expecting to execute a modified royalty agreement in 2023.
Settlement of the Bullion Litigation The Company’s wholly owned subsidiary, Bullion Monarch Mining, Inc. (“Bullion”), reached a settlement with Barrick Gold Corporation (“Barrick”) and Barrick affiliates and subsidiaries (“Barrick Entities”) with respect to Bullion’s claim of non-payment of royalties by the Barrick Entities to Bullion on production from properties in the Carlin Trend, Nevada. Bullion initiated litigation in 2008, before EMX acquired Bullion in 2012. Pursuant to the settlement, Barrick paid Bullion $25,000,000. Of the $25,000,000 settlement, $6,175,000 was paid as a fee to Bullion’s Reno, Nevada lawyers. The settlement of the lawsuit did not affect our 1% gross smelter return royalty from portions of Nevada Gold Mine’s Leeville, Carlin East, Four Corners, and other northern Carlin Trend underground gold mining operations (the “Leeville Royalty”), which continue to be paid.
Acquisition of Additional Royalty Interest on Caserones EMX acquired an additional (effective) 0.3155% Net Smelter Return (“NSR”) royalty on the Caserones Copper-Molybdenum Mine located in northern Chile for $25,742,000. When combined with EMX’s (effective) 0.418% NSR interest acquired in August 2021 (see EMX news release dated August 17, 2021), EMX’s new total totals to an (effective) 0.7335% NSR royalty interest.
Subsequent to the year ended December 31, 2022, the Company entered into certain agreements to acquire an additional 2.263% ownership in the underlying royalty holder, Sociedad Legal Minera California Una de la Sierra Peña Negra (“SLM”), for cash consideration of $3,517,000 pursuant to agreements with existing shareholders of SLM. The acquisition provides EMX with a further 0.0424% (effective) NSR interest in the Caserones property, increasing the Company’s NSR royalty interest to 0.7759%.
Acquisition of Royalty Portfolio from Nevada Exploration EMX executed a purchase and sale agreement (the “Agreement”) for a portfolio of royalties with Pediment Gold LLC, a wholly owned subsidiary of Nevada Exploration Inc. (“NGE”), for $500,000 (see EMX news release dated September 2, 2022). The portfolio consists of a 2% NSR royalty on NGE’s Nevada gold exploration portfolio covering ~62.5 square miles and includes four district-scale land positions, as well as certain other interests. In addition, if NGE options, farms out, or sells a project, then beginning on the first anniversary of the third-party agreement, EMX will receive advanced annual royalties of $20,000 that escalate $10,000 per year and are capped at $50,000. NGE has the right to buy back half of EMX’s 2% NSR royalty by purchasing a 0.5% NSR interest for $1,000,000 any time prior to the 7th anniversary of the Agreement and then, if the first NSR interest has been purchased, may purchase the second 0.5% NSR interest any time prior to production for $1,500,000.
Appointment of Independent Director EMX announced that Mr. Geoff Smith was appointed to the Board of Directors of the Company effective July 5, 2022. Mr. Smith brings to the board the benefit of 17 years of M&A and corporate finance experience having advised on or financed many of the largest, most complex and innovative streaming transactions in the past 10 years.
Royalty and Royalty Generation Updates In 2022, the Company’s royalty generation business was active in North America, South America, Europe, Turkey, Australia and Morocco. The Company spent $17,512,000 on royalty generation costs and recovered $8,577,000 from partners. Royalty generation costs include exploration related activities, technical services, project marketing, land and legal costs, as well as third party due diligence for acquisitions. During the year the Company also completed 10 partnerships across the portfolio while continuing to replace partnered properties with new royalty generation projects. In addition, our partners directly spent approximately $31,996,000 in exploration on the portfolio.
Producing Royalties
6
Advanced Royalties
11
Exploration Royalties
155
Royalty Generation Properties
96
Figure 1. EMX’s royalty and mineral property portfolio.
Initial production royalty payments were received from the Company’s Gediktepe oxide gold (silver) Royalty Property and Balya North polymetallic Royalty Property in Turkey (see respective EMX news releases dated September 9, and September 15, 2022). From Gediktepe EMX recognized $3,709,000 in royalty revenue and $4,000,000 in deferred milestone payments which will be paid in Q2 2023. EMX earned $276,000 from the Balya North Royalty Property in 2022.
EMX received a $3,000,000 milestone payment from Arizona Sonoran Copper Company, Inc. (“ASCU”) based upon declared resources totaling 200 million pounds or more of contained copper covered by the Company’s Parks-Salyer Royalty Property. ASCU’s maiden resource for its Parks-Salyer project, which is partially covered by EMX’s Royalty Property, was reported as total inferred underground resources of 143.6 million tons averaging 1.015% (total) copper and containing 2,915 million pounds of copper as oxide, enriched, and primary mineralization at variable cutoffs (see ASCU news release dated September 28, 2022). The Company retains a 1.5% NSR royalty covering the Parks-Salyer Royalty Property.
In the US, the Company added to its growing royalty portfolio with the completion of five new royalty agreements, the advancement of more than twenty-five partner-funded work programs, including nine drill projects, the acquisition of four large royalty positions from Nevada Exploration covering key land positions in Nevada, and new generative work leading to the acquisition of a district-wide land position at Tonopah, Nevada as well as a large (approximately 1,890 hectares), prospective land position in the Silver Valley district in Idaho. For the year, partners spent more than $18,000,000 on EMX’s early-stage US portfolio.
EMX’s Regional Strategic Alliance (“RSA”) with South32 Limited (“South32”) concluded in Q4 2022 after four years of generative exploration and project work. The Company is now following up on eleven priority projects identified by the RSA and retained by South32 for additional work, including an ongoing drill program at the Copper Springs porphyry copper project in Arizona’s Globe-Miami district.
In Canada, EMX programs advanced available properties in the portfolio as partners conducted multiple field programs, including drill programs on optioned and EMX royalty properties. EMX received C$577,000 in cash payments and C$52,000 in share equity payments during the year, while partners spent more than $3,700,000 in exploration expenditures advancing the portfolio.
EMX’s Latin American royalty portfolio advanced through field programs by Austral Gold Limited (at Morros Blancos and Morros Colorado), Pampa Metals Corporation (Block 4), and drill programs conducted by AbraSilver Resource Corp. (Diablillos), Aftermath Silver Ltd (Berenguela), and GR Silver Mining Ltd (San Marcial). In particular, the drill programs continued to produce significant results that expanded known resources and added new discoveries at nearby targets.
AbraSilver Resource Corp. (“AbraSilver”) announced an updated, open pit constrained mineral resource estimate for the Diablillos project’s Oculto deposit that included measured and indicated resources of 51.3 Mtonnes averaging 66 g/t silver (109 Moz contained Ag) and 0.79 g/t gold (1.3 Moz contained Au), as well as inferred resources of 2.2 Mtonnes averaging 30 g/t silver (2.1 Moz contained Ag) and 0.51 g/t gold (37 Koz contained Au) (see AbraSilver news release dated November 3, 2022). The updated resource was based upon drilling through Phase II. The ongoing Phase III drill program is designed to delineate a maiden resource estimate for the high-grade JAC zone discovery (see AbraSilver news release dated February 21, 2023).
In Northern Europe, the Company continued to develop its portfolio of projects, acquiring new gold and battery metals (nickel, copper and cobalt) royalty generation projects totaling nearly 175,000 hectares, and partnering four available properties. EMX also assisted with multiple partner-funded exploration and drilling programs. Overall, approximately $6,700,000 was spent by partners on EMX’s exploration royalty properties in Northern Europe during 2022.
Royalty generation programs proceeded in the Balkans and in Morocco, where multiple exploration license applications have been filed by the Company. New target areas are being assessed for further acquisitions.
Financing Updates
Sprott Credit Facility The Company entered into a credit facility in 2021 with Sprott Private Resource Lending II (Collector), LP (“Sprott”) totaling $44,000,000 (the “Credit Facility”). On January 24, 2022, the Company signed a credit agreement modification extending the maturity date to December 31, 2024. In connection with the extension, an additional 1.50% of the principal ($660,000) was added to the principal balance as at January 24, 2022.
Private Placement with Franco-Nevada The Company completed a $10,000,000 private placement with Franco-Nevada Corporation (“Franco-Nevada”). The proceeds were used to acquire the additional (effective) 0.3155% NSR royalty on the Caserones open pit mine in northern Chile (see EMX’s news release dated April 14, 2022).
Franco-Nevada purchased 3,812,121 units at C$3.30 per unit. Each unit consisted of one common share of EMX and one warrant to purchase one common share of EMX for C$4.45 exercisable until April 14, 2027. Franco-Nevada now owns approximately 3.5% of the issued and outstanding shares of EMX on an undiluted basis.
Repayment of Vendor Take Back Note The Company repaid in full the vendor take back note issued to SSR Mining Inc. totaling $8,319,000 including interest owed.
Exercise of Stock Options granted by EMX 1,110,000 stock options were exercised pursuant to the Company’s Stock Option Plan, which generated proceeds of $1,037,000 to EMX.
Investment Updates As at December 31, 2022, the Company had marketable securities of $9,970,000 (December 31, 2021 – $7,409,000), and $4,591,000 (December 31, 2021 – $8,761,000) in private investments. The Company will continue to generate cash flow by selling certain of its investments when appropriate. Much of the investment portfolio was derived from strategic investments, including Premium Nickel Resources Corporation (“PNR”), and royalty deals completed as part of our organic royalty generation business.
Strategic Investment in Premium Nickel Resources From 2020 through 2022, EMX acquired 5,412,702 shares of PNR, a private company with nickel-copper-cobalt assets in Botswana. On April 26, 2022, PNR announced the execution of a definitive agreement for a reverse takeover transaction (“RTO”) with North American Nickel Inc. (“NAN”) to create a new reporting entity, Premium Nickel Resources Ltd (“PNRL”). PNRL began trading on the TSX Venture Exchange in Q3 of 2022, having completed the RTO process with NAN. As a result of the RTO transaction, EMX’s interests were converted to 5,704,987 shares of PNRL, which represents roughly 5% of the issued and outstanding shares of PNRL.
OUTLOOK
The 2023 year will continue to see revenue and other income coming from our cash flowing royalties, including Leeville in Nevada, Gediktepe in Turkey, potentially Timok in Serbia (pending conclusion of discussions with Zijin), and our effective royalty interest on Caserones in Chile. As in previous years, production royalties will continue to be complemented by option, advance royalty, and other pre-production payments from partnered projects across the global asset portfolio. As a royalty holder, the Company has limited, if any, access to information on properties for which it holds royalties. Additionally, the Company may receive information from the owners and operators of the properties, which the Company is not permitted to disclose to the public pursuant to the underlying agreement or the information is not NI 43-101 compliant. Accordingly, the Company has not, and does not anticipate that it will have the ability to, provide guidance or outlook as to future production.
The Company will continue to strengthen its balance sheet over the course of the year by looking to retire portions of our long-term debt, continuing to evaluate equity markets, and the ongoing monetization of the Company’s marketable securities.
EMX is well positioned to identify and pursue new royalty and investment opportunities, while further filling a pipeline of royalty generation properties that provide opportunities for additional cash flow, as well as exploration, development, and production success.
Qualified Person. Michael P. Sheehan, CPG, a Qualified Person as defined by NI 43-101 and employee of the Company, has reviewed, verified, and approved the above technical disclosure on North America and Latin America. Eric P. Jensen, CPG, a Qualified Person as defined by NI 43-101 and employee of the Company, has reviewed, verified, and approved the above technical disclosure on Europe, Turkey, Australia, and Strategic Investments.
About EMX. EMX is a precious, base and battery metals royalty company. EMX’s investors are provided with discovery, development, and commodity price optionality, while limiting exposure to risks inherent to operating companies. The Company’s common shares are listed on the NYSE American Exchange and TSX Venture Exchange under the symbol “EMX”, and also trade on the Frankfurt exchange under the symbol “6E9”. Please see www.EMXroyalty.com for more information.
Neither the TSX Venture Exchange nor its Regulation Services Provider (as that term is defined in policies of the TSX Venture Exchange) accepts responsibility for the adequacy or accuracy of this release
Forward-Looking Statements This news release may contain “forward looking statements” that reflect the Company’s current expectations and projections about its future results. These forward-looking statements may include statements regarding perceived merit of properties, exploration results and budgets, mineral reserves and resource estimates, work programs, capital expenditures, timelines, strategic plans, market prices for precious and base metal, or other statements that are not statements of fact. When used in this news release, words such as “estimate,” “intend,” “expect,” “anticipate,” “will”, “believe”, “potential” and similar expressions are intended to identify forward-looking statements, which, by their very nature, are not guarantees of the Company’s future operational or financial performance, and are subject to risks and uncertainties and other factors that could cause the Company’s actual results, performance, prospects or opportunities to differ materially from those expressed in, or implied by, these forward-looking statements. These risks, uncertainties and factors may include, but are not limited to unavailability of financing, failure to identify commercially viable mineral reserves, fluctuations in the market valuation for commodities, difficulties in obtaining required approvals for the development of a mineral project, increased regulatory compliance costs, expectations of project funding by joint venture partners and other factors.
Readers are cautioned not to place undue reliance on these forward-looking statements, which speak only as of the date of this news release or as of the date otherwise specifically indicated herein. Due to risks and uncertainties, including the risks and uncertainties identified in this news release, and other risk factors and forward-looking statements listed in the Company’s MD&A for the year ended December 31, 2022 (the “MD&A”), and themost recently filed Annual Information Form (“AIF”) for the year ended December 31, 2022, actual events may differ materially from current expectations. More information about the Company, including the MD&A, the AIF and financial statements of the Company, is available on SEDAR at www.sedar.com and on the SEC’s EDGAR website at www.sec.gov.
1 Adjusted revenue and other income and adjusted cash provided by (used in) operating activities are non-IFRS financial measures with no standardized meaning under IFRS and might not be comparable to similar financial measures disclosed by other issuers. Refer to the “Non-IFRS financial measures” section of the Company’s annual MD&A for the year ended December 31, 2022 for more information on each non-IFRS financial measure.
The Best Video on Why and When to Buy and Sell Physical Precious Metals:
I’m a licensed broker for Miles Franklin Precious Metals Investments, The Only Online Dealer that is Licensed and Bonded Period! Where we provide unlimited options to expand your precious metals portfolio, from:
This podcast typically centres around the field of engineering and frequently explores topics related to mining, with a particular focus on issues such as mining waste management, geoscience, data management, and touches on ESG aspects such as women in mining.
The host, Bryan Ulrich, has over thirty years of experience in the field of engineering, project management, design, construction, analysis, and site investigation related to mining work, and has worked on a multitude of plant-site projects throughout his career.
Hosted by Laura Cornish, the editor-in-chief of Mining Review Africa, the podcast features interviews with industry experts, mining executives, and other key stakeholders who discuss a range of topics related to the African mining industry.
Reaching an audience of over 50 000 influential mining authorities and key decision makers through a variety of channels, the podcast talks about everything from sustainable development across the mining sector in Africa through articles on project developments and the technology and financial models that drive them.
The podcast has an audience over 50,000 key stakeholders in the industry
Mining Minds is a podcast that focuses on the mining industry in Canada, specifically in the province of Ontario. The podcast is produced by the Ontario Mining Association, a trade organisation that represents the mining industry in the province.
Drawing on their own experiences, the hosts take listeners on a journey through the lives of miners, the communities and companies that sustain them, and the unique lifestyles they embrace. The podcast will explore the vital role mining plays in our world while emphasising the crucial need for responsible mining practices that safeguard our environment and secure our future.
Hosted by a panel of industry experts, Exploration Radio is a podcast that focuses on the exploration of natural resources, including minerals, oil, and gas, the podcast is produced by a team of geoscientists and mining professionals who are passionate about exploration and the discovery of new resources.
Hosts talk to explorers about the challenges they have faced, what we stand to learn from them and how we can better prepare for the future.
Full Production with Peter Finn is a podcast that focuses on the mining industry in Australia. The podcast is produced by Newton Consulting, a consulting firm that specialises in the mining industry.
The podcast features interviews with industry experts, mining executives, and other key stakeholders who discuss a range of topics related to the Australian mining industry.
Covering everything from the importance of mentorship for women in mining to learning how to navigate male-dominated environments, the Women in Mining South Africa podcast supports the empowerment of women in the sector. The podcast features conversations with women who are leaders, entrepreneurs, professionals, and pioneers in the mining industry. Through their stories, listeners can gain insights into the challenges and opportunities that women face in the mining sector, and learn about the strategies and initiatives that are helping to promote gender equality and diversity in the industry.
WiMSA creates an empowering network to inspire, support, and develop the progression of women working in the South African mining industry
Emily King, who is the Founder of Prospector, a geologist, and the Chief Innovation Officer for Analog Gold, hosts a podcast where she interviews special guests about the current state and the future of the mining industry.
The conversations take place over cocktails, and topics covered include space mining, deep sea mining, artificial intelligence, the state of the market, and tales of exploring remote mountains.
This US-based mining podcast, Proven and Probable, has been running since 2016 and has released hundreds of episodes, covering topics from gold and silver mining to battery metals and uranium.
The podcast is hosted by Maurice Jackson, who is a mining industry expert and the founder of Proven and Probable, a mining and exploration company.
Episodes cover a wide range of topics, including exploration techniques, mining methods, mineral economics, and investing strategies. Guests on the show share their experiences and expertise in these areas, and also provide their perspectives on current events and trends in the industry.
The Northern Miner is a pioneering podcast in the mining industry, with a legacy of over 100 years in serving mining and exploration professionals. The podcast is powered by crucial reports produced by the expert writing staff of The Northern Miner, which help inform the decision-making process of thousands of high-performing mining professionals worldwide.
Episodes of the podcast often cover news and events from around the world, including developments in mining hotspots such as Canada, Australia, and South America. Listeners can expect to hear discussions on topics such as new mining projects, mergers and acquisitions, commodity prices, and regulatory changes that impact the industry.
Coming in at number 1 is the Dig Deep Podcast. Episodes provide listeners with valuable information about the mining industry and how it is evolving, also highlighting emerging technologies and mining methods, as well as the impact of global events on the industry.
Hosted by Rob Tyson, mining head-hunter and founder and director of Mining International Ltd, the podcast features interviews with mining professionals, including geologists, mining executives, investors, and analysts, who share their insights and perspectives on the latest industry news and trends.
One of the unique features of the Dig Deep podcast is its focus on safety in the mining industry. The podcast often discusses safety initiatives and strategies, and provides insights into how mining companies are working to create safer working environments for their employees.
Burlington, Ontario–(Newsfile Corp. – March 16, 2023) – Further to its press release of March 3, 2023, Silver Bullet Mines Corp. (TSXV: SBMI) (OTCQB: SBMCF) (‘SBMI’ or ‘the Company’) is pleased to provide an update on the latest processing campaign at its 125 TPD pilot plant.
Over a recent four-day period from March 8 to March 13, 2023, SBMI processed mineralized vein material at its 100% owned mill in Globe, Arizona, from which it recovered concentrate which will be converted to dore bars, confirming the recent mill modification was successful. The mineralized material was taken from the vein structure in the upper adit behind the Treasure Room.
SBMI is producing an initial batch of dore bars to be sent to a third-party lab for analysis and to potential purchasers for their analysis. One dore bar has previously been sent to a potential purchaser for its analysis.
Calibrated XRF analysis have confirmed recovered gold in these dore bars, including one bar that analyzed 0.382 % gold. The XRF analysis shows the dore consists primarily of silver and copper, with gold, zinc, nickel, lead and iron. No deleterious material was found in the dore bar. This confirms the previous findings of Dr. Andrew Macdonald from the Harquail School of Earth Sciences at Laurentian University in Sudbury, Ontario on the silver contained within a sample collected from the floor of the Treasure Room area.
The crushing circuit of the mill is running at optimal efficiency. The grinding and gravity circuits were run at approximately 50% capacity while being optimized. The number of tons of mineralized material to be processed per hour will be increased as optimization continues and as a result of grade control assay results processed at SBMI’s lab at the millsite.
To feed the mill, the Company has accumulated a significant stockpile of mineralized material at the Buckeye Mine for transportation to the mill site. Mining is ongoing in 150 ton (136 tonne) rounds, with four rounds per week, advancing at 12 feet (3.7 metres) per round.
Next steps include increasing the tonnage being shipped from the Buckeye Mine to the mill, continuing mining of the historical higher grade zone, filling the outstanding order, sourcing other purchasers, and continuing to improve operational performance at the Buckeye Mine and at the mill.
SBMI previously announced that it had received an order for 50 kg (1,760 ounces) of silver. The entity that placed that order has advised SBMI that it intends to increase that order to a minimum of 500 kg (17,600 ounces) per month. Management reasonably believes it will be able to satisfy that increased order for the foreseeable future. To decrease risk, the Company is currently in discussions with several additional potential purchasers.
Higher grade samples and dore bars, and what the field team believes to be bornite, will be sent to Harquail School of Earth Sciences for further detailed analysis. See the photo below.
The potential bornite at the Buckeye Mine is believed to be found as a hydrothermal mineral in fractures in cooler areas of the fluid migration. Association with native silver and other precious minerals have been known to occur in such mineralized situations. Further analysis of the potential bornite mineralization is ongoing.
Recent sample collected from the Buckeye Mine upper adit @ 450 feet from the portal entrance.
Mr. Robert G. Komarechka, P.Geo., an independent consultant, has reviewed and verified SBMI’s work referred to herein, and is the Qualified Person for this release.
Peter M. Clausi Silver Bullet Mines Corp., VP Capital Markets pclausi@brantcapital.ca +1 (416) 890-1232
Cautionary and Forward-Looking Statements
This news release contains certain statements that constitute forward-looking statements as they relate to SBMI and its subsidiaries. Forward-looking statements are not historical facts but represent management’s current expectation of future events, and can be identified by words such as “believe”, “expects”, “will”, “intends”, “plans”, “projects”, “anticipates”, “estimates”, “continues” and similar expressions. Although management believes that the expectations represented in such forward-looking statements are reasonable, there can be no assurance that they will prove to be correct.
By their nature, forward-looking statements include assumptions, and are subject to inherent risks and uncertainties that could cause actual future results, conditions, actions or events to differ materially from those in the forward-looking statements. If and when forward-looking statements are set out in this new release, SBMI will also set out the material risk factors or assumptions used to develop the forward-looking statements. Except as expressly required by applicable securities laws, SBMI assumes no obligation to update or revise any forward-looking statements. The future outcomes that relate to forward-looking statements may be influenced by many factors, including but not limited to: the impact of SARS CoV-2 or any other global virus; reliance on key personnel; the thoroughness of its QA/QA procedures; the continuity of the global supply chain for materials for SBMI to use in the production and processing of mineralized material; the presence of mineable economic mineralized material; shareholder and regulatory approvals; activities and attitudes of communities local to the location of the SBMI’s properties; risks of future legal proceedings; income tax matters; fires, floods and other natural phenomena; the rate of inflation; availability and terms of financing; distribution of securities; commodities pricing; currency movements, especially as between the USD and CDN; effect of market interest rates on price of securities; and, potential dilution. SARS CoV-2 and other potential global pathogens create risks that at this time are immeasurable and impossible to define.
Sign up to Stay Up to Date on News and Progress from Page