VANCOUVER, BC / ACCESSWIRE / November 29, 2022 / Stillwater Critical Minerals (formerly Group Ten Metals) (TSX.V:PGE)(OTCQB:PGEZF)(FSE:5D32) (the “Company” or “SWCM”) announces it has filed an Early Warning Report related to its holdings of 3,900,000 common shares of Heritage Mining Ltd. (“Heritage”) (CSE: HML) which represents approximately 11.8% of the total issued and outstand shares of Heritage. These shares were issued to Stillwater Critical Minerals as well as a cash payment of $150,000 and completion of $500,000 project work to satisfy first anniversary commitments per the Definitive Earn-In Agreement announced November 29, 2021 with respect to the Drayton-Black Lake gold project in Ontario, Canada.
The Heritage shares are held directly by Stillwater Critical Minerals for investment purposes. Additional share payments to Stillwater Critical Minerals are required under the Agreement and SWCM may in the future take such actions in respect of its shares as it deems appropriate in light of the market circumstances then existing including the sale of all or a portion of such holdings in the open market or in privately negotiated transactions to one or more purchasers.
There are no persons acting jointly or in concert with Stillwater Critical Minerals with respect to the shareholdings in Heritage, nor has the Company entered into any agreements in respect of its shareholdings in Heritage with any person with which SWCM acts jointly or in concert.
This news release is being issued in accordance with National Instrument 62-103 – The Early Warning System and Related Take-Over Bid and Insider Reporting Issues in connection with the filing of an early warning report. The early warning report respecting the acquisition will be filed on the System for Electronic Document Analysis and Retrieval (“SEDAR”) at www.sedar.com.
About Stillwater Critical Minerals Corp.
Stillwater Critical Minerals (TSX.V: PGE | OTCQB: PGEZF) is a mineral exploration company focused on its flagship Stillwater West PGE-Ni-Cu-Co + Au project in the iconic and famously productive Stillwater mining district in Montana, USA. With the recent addition of two renowned Bushveld and Platreef geologists to the team, the Company is well positioned to advance the next phase of large-scale critical mineral supply from this world-class American district, building on past production of nickel, copper, and chromium, and the on-going production of platinum group and other metals by neighbouring Sibanye-Stillwater. The Platreef-style nickel and copper sulphide deposits at Stillwater West contain a compelling suite of critical minerals and are open for expansion along trend and at depth, with an updated NI 43-101 mineral resource update currently in progress.
Stillwater Critical Minerals also holds the high-grade Black Lake-Drayton Gold project adjacent to Treasury Metals’ development-stage Goliath Gold Complex in northwest Ontario, which is currently under an earn-in agreement with an option to joint venture whereby Heritage Mining may earn up to a 90% interest in the project by completing payments and work on the project. The Company also holds the Kluane PGE-Ni-Cu-Co project on trend with Nickel Creek Platinum‘s Wellgreen deposit in Canada‘s Yukon Territory.
Neither the TSX Venture Exchange nor its Regulation Services Provider (as that term is defined in the policies of the TSX Venture Exchange) accepts responsibility for the adequacy or accuracy of this release.
Vancouver, British Columbia–(Newsfile Corp. – November 29, 2022) – Dolly Varden Silver Corporation (TSXV: DV) (OTCQX: DOLLF) (the “Company” or “Dolly Varden“) is pleased to announce drill results from the 100%-owned Homestake Ridge property in BC’s Golden Triangle. The objective of drilling during 2022 at the Homestake Main and Homestake Silver deposits was to expanded multiple, subparallel mineralized zones and to upgrade Inferred Resources.
Highlights include (intervals shown are core length):
HR22-314: 4.27 g/t Au and 64 g/t Ag (5.10 g/t AuEq*) over 16.06 meters including 18.76 g/t Au and 193 g/t Ag (21.49 g/t AuEq*) over 3.08 meters
HR22-322: 6.47 g/t Au and 27 g/t Ag (5.83 g/t AuEq*) over 6.00 meters
HR22-325: 7.18g/t Au and 30 g/t Ag, 0.49% Cu (8.26 g/t AuEq*) over 10.00 meters including 20.20 g/t Au and 68 g/t Ag (21.13 g/t AuEq*) over 1.47 meters
HR22-328: 27.44 g/t Au and 463 g/t Ag (33.34 g/t AuEq*) over 9.16 meters including 0.50 meters 216.00 g/t Au and 113 g/t Ag, 0.48% Cu (218.06 AuEq*) over 0.50 meters
HR22-330: 5.68 g/t Au and 147 g/t Ag (7.48 g/t AuEq*) over 15.00 meters, including 54.10 g/t Au, 4,890 g/t Ag and 0.11% Cu (113.25 g/t AuEq*) over 0.39 meters
HR22-337: 3.79 g/t Au and 2 g/t Ag (3.84 g/t AuEq*) over 21.00 meters including 11.15 g/t Au and 5.00 g/t Ag (11.22 AuEq*) over 2.00 meters
HR22-339: 14.56 g/t Au and 4.00 g/t Ag (14.63 g/t AuEq*) over 2.50 meters
“Our 2022 drill program has truly been exceptional. The recently acquired Homestake Ridge Deposit has delivered more high-grade gold and silver values, commonly with strong copper mineralization. These intercepts demonstrate strong continuity of mineralization over wide intervals, similar to the recently announced high-grade results at the Wolf and Kitsol Deposits, located six kilometers to the south. We eagerly anticipate additional assays from all of Dolly Varden’s Deposits, as well as new exploration targets drilled during the 2022 program,” said Shawn Khunkhun, President and CEO.
These results are primarily infill drilling from areas of Current Inferred Mineral Resources and suggest that the higher-grade gold-silver lenses may be continuous over more extensive areas than previously interpreted. In addition, the drilling has generated new targets down-dip the Homestake Main deposit along the projected plunge of the higher grade shoots that are wide open for expansion. Oriented core was used on all drill holes on the project and this detailed structural data is also being integrated in to the geological model to further increase confidence. Additional assays from the Homestake Main and Silver Deposits are pending
Complete Assay results for the first batch of drilling results at Homestake Main are in Table 1.
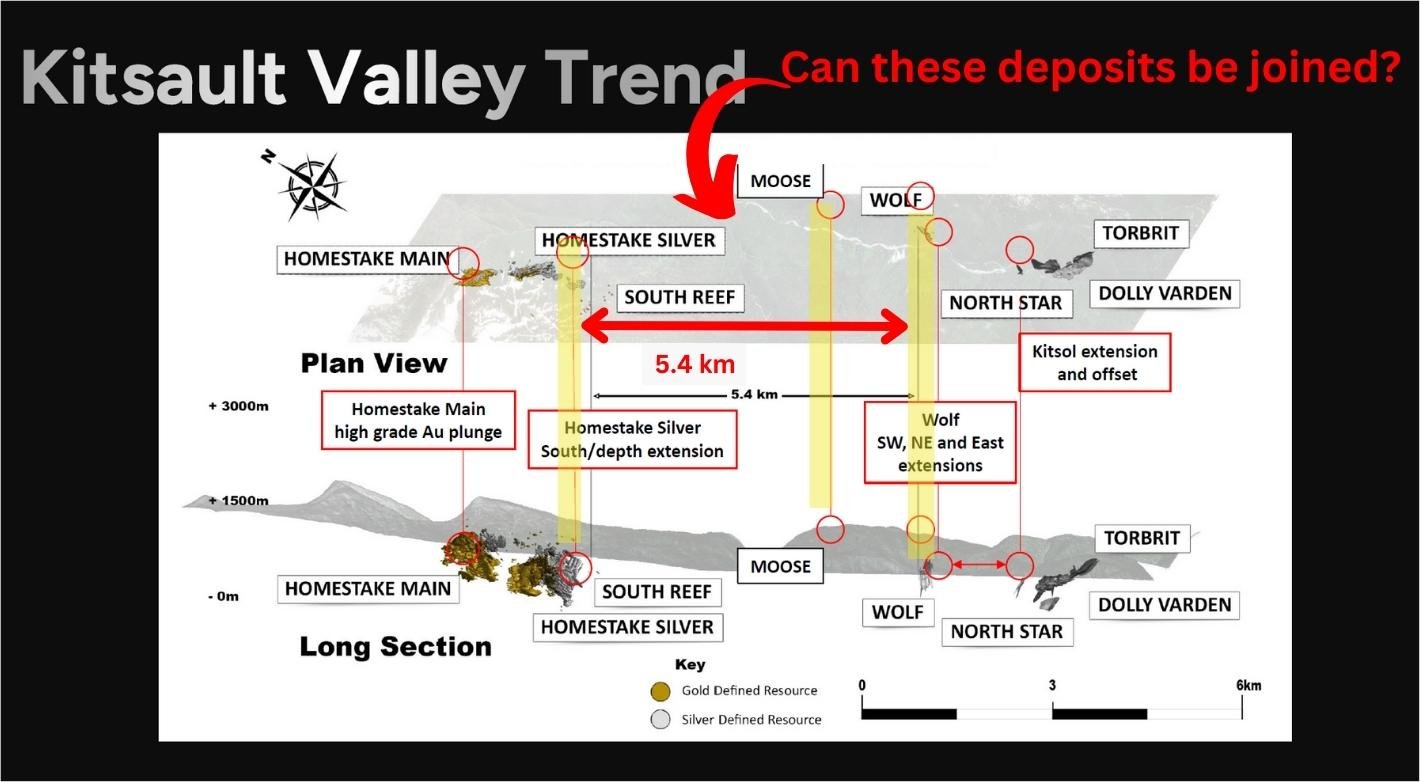
Figure 1. Location along Dolly Varden’s Kitsault Valley trend of Deposits
The Homestake Ridge deposits are interpreted as structurally-controlled, multi-phase epithermal vein and breccia system hosted in Jurassic aged Hazelton Volcanic rocks. Mineralization consists of pyrite and chalcopyrite in a breccia matrix within a silica breccia vein system (see Figure 2). The northwest orientation of the main Homestake structural trend appears to have numerous subparallel internal structures that are interpreted to form the controls for higher grade gold shoots within a broader low grade zone at the Homestake Main deposit. The main structural corridor dips steeply to the northeast (see Figure 3 and 4).
Figure 2. Drill hole HR22-330 from the Homestake Main deposit showing breccia vein style mineralization.
Table 1. Completed Drill Hole Assays from the Homestake Main Deposit
Hole ID
From (m)
To (m)
Length (m)
Au (g/t)
Ag (g/t)
Cu (%)
AuEq*
AgEq*
HR22-313
107.00
148.00
41.00
0.85
12
0.10
1.13
93
including
125.08
127.00
1.92
3.13
42
NSV
3.64
300
including
141.00
146.10
5.10
3.10
11
0.72
4.28
353
HR22-314
149.66
165.72
16.06
4.27
64
NSV
5.10
421
including
159.92
163.00
3.08
18.76
193
0.28
21.49
1,773
and
168.23
169.19
0.96
10.55
50
4.14
17.17
1,417
HR22-315
174.70
175.22
0.52
2.07
25
1.37
4.36
360
HR22-316
124.00
152.50
28.50
0.88
3
NSV
0.97
80
including
142.50
144.00
1.50
2.47
3
NSV
2.58
213
including
150.00
151.50
1.50
3.11
13
0.49
3.97
328
HR22-317
200.00
205.00
5.00
0.25
NSV
NSV
0.03
21
and
232.00
235.60
3.60
0.21
NSV
NSV
0.21
17
HR22-318
129.00
181.00
52.00
1.19
23
NSV
1.54
127
including
148.88
149.38
0.50
19.90
1990
0.39
44.47
3,669
including
152.00
160.20
8.20
2.57
8
0.19
2.95
243
including
172.00
177.00
5.00
3.23
3
0.09
3.39
280
HR22-319
200.34
207.00
6.66
1.16
3
NSV
1.26
104
HR22-320
108.50
125.50
17.00
0.83
6
NSV
0.91
75
including
123.87
124.60
0.73
5.98
17
NSV
6.21
512
HR22-321
179.00
192.00
13.00
1.16
4
0.12
1.38
114
including
189.00
190.55
1.55
5.18
10
0.15
5.52
455
HR22-322
83.00
143.12
60.12
1.69
21
NSV
2.01
166
including
113.00
119.00
6.00
6.47
27
NSV
6.83
563
including
134.13
138.71
4.58
5.23
17
0.50
6.15
508
HR22-323
190.30
222.00
31.70
0.91
6
0.37
1.52
125
including
198.00
203.00
5.00
2.36
5
0.08
2.53
208
including
207.60
209.56
1.96
0.49
37
3.50
6.03
497
including
214.00
214.55
0.55
0.52
16
1.97
3.57
295
HR22-325
174.00
201.00
27.00
3.11
12
0.20
3.54
292
including
174.00
184.00
10.00
7.18
30
0.49
8.26
681
including
175.00
175.50
0.50
18.00
23
1.92
21.06
1,738
including
177.30
177.80
0.50
15.60
92
2.95
21.00
1,733
including
180.00
181.47
1.47
20.20
68
0.08
21.13
1,743
HR22-327
217.28
227.50
10.22
1.01
17
1.43
3.29
271
including
220.75
223.23
2.48
2.15
35
3.98
8.36
689
and
231.00
274.00
43.00
0.35
5
0.10
0.56
46
including
248.55
251.48
2.93
1.85
65
1.13
4.28
353
Table 1 con’t. Completed Drill Hole Assays from the Homestake Main Deposit
Hole ID
From (m)
To (m)
Length (m)
Au (g/t)
Ag (g/t)
Cu (%)
AuEq*
AgEq*
HR22-328
160.81
169.97
9.16
27.44
463
0.21
33.34
2,751
including
163.13
164.90
1.77
75.13
2337
0.23
103.66
8,552
including
168.00
168.50
0.50
216.00
113
0.48
218.06
17,991
HR22-330
111.00
126.00
15.00
5.68
147
NSV
7.48
617
including
112.00
112.39
0.39
54.10
4890
0.11
113.25
9,344
including
116.30
116.69
0.39
74.80
20
NSV
75.05
6,192
including
118.00
118.81
0.81
33.80
14
NSV
33.98
2,803
and
131.00
143.00
12.00
0.24
8
NSV
0.38
31
HR22-331
101.00
113.00
12.00
0.92
63
NSV
1.70
140
including
111.00
111.80
0.80
9.43
224
0.10
12.27
1,013
and
130.00
144.00
14.00
1.02
5
0.15
1.30
107
including
134.10
134.82
0.72
11.95
70
2.45
16.36
1,349
HR22-334
123.00
154.61
31.61
1.75
15
0.27
2.32
191
including
131.00
139.20
8.20
3.66
30
0.27
4.42
364
including
131.00
132.00
1.00
7.67
198
0.04
10.11
834
including
138.70
139.20
0.50
19.55
50
4.26
26.35
2,174
including
145.13
147.39
2.26
5.38
19
1.09
7.19
593
including
152.06
152.41
0.35
6.92
48
7.27
18.07
1,491
HR22-335
177.00
202.55
25.55
0.55
1
NSV
0.57
47
including
184.50
190.00
5.50
1.40
1
NSV
1.42
117
and
220.00
245.50
25.50
0.34
2
NSV
0.43
35
HR22-337
145.00
175.84
30.84
2.74
2
NSV
2.79
230
including
151.00
172.00
21.00
3.79
2
NSV
3.84
317
including
151.00
152.64
1.64
12.90
4
NSV
12.95
1,069
including
161.00
163.00
2.00
11.15
5
NSV
11.22
926
including
171.00
172.00
1.00
6.58
3
NSV
6.65
548
HR22-339
148.25
172.50
24.25
2.33
2
NSV
2.37
195
including
156.50
159.00
2.50
14.56
4
NSV
14.63
1,207
including
156.50
157.50
1.00
33.40
7
NSV
33.52
2,765
and
164.75
165.60
0.85
5.05
3
NSV
5.11
422
*AuEq and AgEq are calculated using $US1650/oz Au, $US20/oz Ag, $US3.50/lb Cu
**Estimated true widths vary depending on intersection angles and range from 80% to 90% of core lengths
Table 2. Drill Hole Collars for 2022 Homestake Main Deposit Drilling
Hole ID
Easting UTM83 (m)
Northing UTM83 (m)
Elev. (m)
Azimuth
Dip
Length (m)
HR22-313
463002
6179472
954
225
-47
201.00
HR22-314
463050
6179452
956
226
-50
180.00
HR22-315
463050
6179452
956
226
-59
228.00
HR22-316
463002
6179472
954
225
-57
201.00
HR22-318
463002
6179472
954
245
-50
207.00
HR22-317
463050
6179452
956
226
-68
237.00
HR22-319
463050
6179452
956
250
-68
237.00
HR22-320
462956
6179462
956
225
-45
165.00
HR22-321
463113
6179429
953
229
-53
210.00
HR22-322
462956
6179462
956
225
-60
180.00
HR22-323
463113
6179429
953
229
-62
231.00
HR22-325
463132
6179416
949
228
-51
220.00
HR22-327
463132
6179416
949
228
-70
276.00
HR22-328
463052
6179417
973
225
-68
255.00
HR22-330
463052
6179417
973
225
-59
220.00
HR22-331
463052
6179417
973
220
-50
216.00
HR22-334
463089
6179383
982
230
-58
250.00
HR22-335
462965
6179544
922
250
-54
252.00
HR22-337
462937
6179513
935
225
-50
192.00
HR22-339
462937
6179513
935
215
-65
210.00
Quality Assurance and Quality Control
The Company adheres to CIM Best Practices Guidelines for exploration related activities conducted on its property. Quality Assurance and Quality Control (QA/QC) procedures are overseen by the Qualified Person.
Dolly Varden QA/QC protocols are maintained through the insertion of certified reference material (standards), blanks and field duplicates within the sample stream. Drill core is cut in-half with a diamond saw, with one-half placed in sealed bags and shipped to the laboratory and the other half retained on site. Third party laboratory checks on 5% of the samples are carried out as well. Chain of custody is maintained from the drill to the submittal into the laboratory preparation facility.
Analytical testing was performed by ALS Canada Ltd. in North Vancouver, British Columbia. The entire sample is crushed to 70% minus 2mm (10 mesh), of which a 500 gram split is pulverized to minus 200 mesh. Multi-element analyses were determined by Inductively Coupled Plasma Mass Spectrometry (ICP-MS) for 48 elements following a 4-acid digestion process. High grade silver testing was determined by Fire Assay with either an atomic absorption, or a gravimetric finish, depending on grade range. Au is determined by Fire Assay on a 30g split.
Qualified Person
Rob van Egmond, P.Geo., Vice-President Exploration for Dolly Varden Silver, the “Qualified Person” as defined by NI43-101 has reviewed, validated and approved the scientific and technical information contained in this news release and supervises the ongoing exploration program at the Dolly Varden Project.
About Dolly Varden Silver Corporation
Dolly Varden Silver Corporation is a mineral exploration company focused on advancing its 100% held Kitsault Valley Project (which combines the Dolly Varden Project and the Homestake Ridge Project) located in the Golden Triangle of British Columbia, Canada, 25kms by road to tide water. The 163 sq. km. project hosts the high-grade silver and gold resources of Dolly Varden and Homestake Ridge along with the past producing Dolly Varden and Torbrit silver mines. It is considered to be prospective for hosting further precious metal deposits, being on the same structural and stratigraphic belts that host numerous other, on-trend, high-grade deposits, such as Eskay Creek and Brucejack. The Kitsault Valley Project also contains the Big Bulk property which is prospective for porphyry and skarn style copper and gold mineralization, similar to other such deposits in the region (Red Mountain, KSM, Red Chris).
Forward Looking Statements
This release may contain forward-looking statements or forward-looking information under applicable Canadian securities legislation that may not be based on historical fact, including, without limitation, statements containing the words “believe”, “may”, “plan”, “will”, “estimate”, “continue”, “anticipate”, “intend”, “expect”, “potential”, and similar expressions. Forward-looking statements involve known and unknown risks, uncertainties, and other factors which may cause the actual results, performance, or achievements of Dolly Varden to be materially different from any future results, performance, or achievements expressed or implied by the forward-looking statements. Forward looking statements or information in this release relates to, among other things, the 2022 drill program at the Kitsault Valley Project, the results of previous field work and programs and the continued operations of the current exploration program, interpretation of the nature of the mineralization at the project and that that the mineralization on the project is similar to Eskay and Brucejack, results of the mineral resource estimate on the project, the potential to grow the project, the potential to expand the mineralization and our beliefs about the unexplored portion of the property.
These forward-looking statements are based on management’s current expectations and beliefs and assume, among other things, the ability of the Company to successfully pursue its current development plans, that future sources of funding will be available to the company, that relevant commodity prices will remain at levels that are economically viable for the Company and that the Company will receive relevant permits in a timely manner in order to enable its operations, but given the uncertainties, assumptions and risks, readers are cautioned not to place undue reliance on such forward-looking statements or information. The Company disclaims any obligation to update, or to publicly announce, any such statements, events or developments except as required by law.
For additional information on risks and uncertainties, see the Company’s most recently filed annual management discussion & analysis (“MD&A“) and management information circular dated January 21, 2022 (the “Circular“), both of which are available on SEDAR at www.sedar.com. The risk factors identified in the MD&A and the Circular are not intended to represent a complete list of factors that could affect the Company.
Neither the TSX Venture Exchange nor its Regulation Services Provider (as that term is defined in the policies of the TSX-V) accepts responsibility for the adequacy or accuracy of this news release.
Drill hole APC-17, a significant step-out hole to the north, intersected two zones of mineralization within the Main Breccia discovery at the Apollo target. The shallow zone, which was intersected directly below where the Main Breccia daylights at surface cut the following interval:
The second zone encountered in hole APC-17 cut the longest intercept of continuous mineralization within the Main Breccia discovery drilled to date with results as follows:
Drill hole APC-17, which was terminated at 912.8 metres due to rig capacity, bottomed in strong mineralization with the final 2.75 metres averaged 1.56 g/t gold, 9 g/t silver and 0.03% copper.
Drill hole APC-18 intersected near surface and high-grade copper-silver-gold mineralization approximately 300 metres to the north of the near surface intercept in APC-17. The mineralized breccia in this zone is strongly overprinted by numerous zones of carbonate, base metal veins with assay results as follows:
With the result of step out hole APC-17 and recently announced visuals from step out hole APC-22, the Main Breccia discovery now measures up to 385 metres along strike by 350 metres in width (previously 190 metres) and has been extended down to a vertical depth of 825 metres below surface (previously 500 metres). The discovery remains wide open for expansion and further step-out holes are currently being designed.
Three rigs continue to drill at Apollo with holes APC-19 through APC-26 completed and holes APC-27 through APC-29 underway. Additional assay results are anticipated in the near term.
TORONTO, Nov. 29, 2022 /CNW/ – Collective Mining Ltd. (TSXV: CNL) (OTCQX: CNLMF) (“Collective” or the “Company”) is pleased to announce assay results from four additional holes drilled at the Apollo target (“Apollo”) within the Company’s Guayabales project located in Caldas, Colombia. The Main Breccia discovery at Apollo is a high-grade, bulk tonnage copper-gold-silver porphyry-related breccia target. As part of its fully funded 23,000 metre drill program for 2022, there are currently three diamond drill rigs operating at the Apollo target.
“The intersection of high-grade and shallow mineralization at Apollo demonstrates the excellent metal endowment of the Main Breccia and most importantly, the dimensions of the system continue to expand and clearly point to the fact that we are dealing with a large-scale discovery. It is truly remarkable to drill a 912-metre-long hole that bottoms in mineralization. Finally, the shallow, higher grade intercepts encountered in APC-17 and APC-18 are more than 300 metres apart and confirms that the southern portion of the deposit is where the system comes to surface. As a result, we are about to start construction of a new drill pad located between the two shallow intercepts in order to start defining the shallow portion of the Main Breccia mineralized system,” commented Ari Sussman, Executive Chairman.
Details (See Table 1 and Figures 1–3)
Nineteen diamond drill holes with accompanying assay results have now been announced at Apollo and a further eleven holes are outstanding. The Company recently completed four drill holes; one northerly directed, step out hole (APC-17), to test for mineralized extensions to the Main Breccia discovery, a second shallow hole drilled southwesterly to define extensions of newly discovered mineralized breccia outcrops located in the southern portion of the deposit and two fringe holes drilled at shallow angles to the west of the Main Breccia discovery.
Drill hole APC-17 was drilled approximately due north to a maximum depth of 912.60 metres. The hole intersected three mineralized zones: 72.3 metres of mineralization beginning at 118.20 metres down hole (100m vertical), 11.65 metres of mineralized breccia from 252.6 metres (220m vertical) and another 547.65 metres of mineralization from 365.15 metres down hole (330m vertical) to the end of the hole at 912.80m (825m vertical). The hole terminated while still in mineralized breccia due to limitations of the drill rig. Total cumulative mineralization in this diamond drill hole was 628.3 metres and is the most mineralization drilled in a single hole to date into the Main Breccia discovery at Apollo. The shallow intercept is hosted within angular porphyry related breccia containing chalcopyrite (1-2%) with pyrite and pyrrhotite and is located directly beneath recently discovered mineralization outcropping at surface. The deeper and longer intercept is also hosted within angular porphyry related breccia with the matrix filled with pyrite, some chalcopyrite and overprinting carbonate base metal veins (“CBM”). The following results are highlighted:
11.65 metres @ 1.88 g/t gold equivalent consisting of 1.80 g/t gold, 4 g/t silver and 0.05% copper (220m vertical).
547.65 metres @ 1.03 g/t gold equivalent consisting of 0.76 g/t gold, 14 g/t silver and 0.04% copper (330m vertical).
Drill hole APC-18 was drilled in a southwest direction and intersected shallow, copper-silver-gold mineralization from 136.05 metres to 304.65 metres with the hole terminating at a final depth of 499.05 metres. The mineralized breccia contains a matrix of chalcopyrite and pyrite is strongly overprinted by numerous zones of CBM veins hosting sphalerite and galena. The hole was drilled below outcrops of breccia mineralization in the south-central portion of the deposit with assay results as follows:
With the result of APC-17 and recently announced visuals from APC-22, the potential total volume of rock hosting the Main Breccia discovery within it has approximately tripled in size with the dimensions now measuring 385 metres along strike by 350 metres width by 825 metres depth versus prior dimensions of 385 metres x 190 metres x 500 metres. The discovery remains wide open for expansion and further step-out holes are currently being designed.
Holes APC-15 and APC-16 were drilled at shallow angles on the western periphery of the main breccia body. APC-15 was drilled to the northwest and intersected mineralized crackle breccia returning 56.05 metres @ 0.57 g/t gold equivalent from 68.6 metres (55 metres vertical). This is a new mineralized area outside of the Main Breccia discovery at Apollo. APC-16 was also drilled outside the Main Breccia discovery to the southwest and intersected 500 parts per million copper in crackle breccia from 200 metres and until the end of the hole at 303.35 metres. The Company believes that both APC-15 and APC-16 may have drilled over the top of the Main Breccia discovery in these locations.
Three rigs continue to drill at Apollo with additional assay results anticipated in the near term.
The Apollo target area, as defined to date by surface mapping, rock sampling and copper and molybdenum soil geochemistry, covers an 800 metres X 700 metres area. The Apollo target area hosts the Company’s new Main Breccia discovery plus a vein system located above and on the eastern flank of the Main Breccia discovery and the Northern Breccia discovery located 250 metres to the north of the Main Breccia. Multiple additional untested breccia, porphyry and vein targets have been generated and will be drilled in due course. The overall Apollo target area also remains open for further expansion.
Table 1: Apollo Target Assays Results
HoleID
From (m)
To (m)
Intercept (m)
Au (g/t)
Ag (g/t)
Cu %
Mo %
AuEq (g/t)*
CuEq (%)*
APC-18
136.05
304.65
168.60
0.98
69
0.50
0.002
2.91
1.48
Incl
149.20
157.00
7.80
5.08
35
0.52
0.002
6.34
3.23
193.20
205.10
11.90
2.18
154
0.77
0.001
5.81
2.97
233.90
251.50
17.60
1.49
56
0.74
0.002
3.63
1.85
291.65
297.00
5.35
3.26
10
0.11
0.001
3.47
1.77
APC-17
118.20
190.50
72.30
1.00
28
0.63
0.004
2.57
1.31
Incl
121.90
130.40
8.50
2.42
30
0.61
0.005
3.91
2.00
APC-17
252.60
264.25
11.65
1.80
4
0.05
0.002
1.88
–
and
365.15
912.80
547.65
0.76
14
0.04
0.001
1.03
–
Incl
527.80
561.10
33.30
3.01
19
0.05
0.002
3.23
–
579.20
596.80
17.60
2.37
25
0.06
0.001
2.74
–
816.00
837.50
21.50
1.53
28
0.09
0.001
2.04
–
APC-16
NSV*
APC-15
54.20
110.25
56.05
0.37
5
–
–
0.57
–
Incl
68.60
69.10
0.50
6.26
15
–
–
6.27
–
77.85
79.20
1.35
4.17
20
–
–
4.41
–
and
180.95
181.65
0.70
13.29
9
–
–
12.81
–
206.95
207.50
0.55
7.87
5
–
–
7.61
–
*AuEq (g/t) is calculated as follows: (Au (g/t) x 0.95) + (Ag g/t x 0.016 x 0.95) + (Cu (%) x 1.96 x 0.95)+ (Mo (%)*7.35 x 0.95) and CuEq (%) is calculated as follows: (Cu (%) x 0.95) + (Au (g/t) x 0.51 x 0.95) + (Ag (g/t) x 0.01 x 0.95)+ (Mo(%)x 3.75 x 0.95) utilizing metal prices of Cu – US$4.00/lb, Ag – $22/oz Mo US$15.00/lb and Au – US$1,400/oz and recovery rates of 95% for Au, Ag, Mo and Cu. Recovery rate assumptions are speculative as no metallurgical work has been completed to date.
** A 0.2 g/t AuEq cut-off grade was employed with no more than 15% internal dilution. True widths are unknown, and grades are uncut.
*** NSV: No significant values
About Collective Mining Ltd.
To see our latest corporate presentation and related information, please visit www.collectivemining.com.
Founded by the team that developed and sold Continental Gold Inc. to Zijin Mining for approximately $2 billion in enterprise value, Collective Mining is a copper, silver and gold exploration company based in Canada, with projects in Caldas, Colombia. The Company has options to acquire 100% interests in two projects located directly within an established mining camp with ten fully permitted and operating mines.
The Company’s flagship project, Guayabales, is anchored by the Apollo target, which hosts the large-scale, bulk-tonnage and high-grade copper, silver and gold Main Breccia discovery. The Company’s near-term objective is to continue with expansion drilling of the Main Breccia discovery while increasing confidence in the highest-grade portions of the system.
Management, insiders and close family and friends own nearly 35% of the outstanding shares of the Company and as a result, are fully aligned with shareholders. The Company is listed on the TSXV under the trading symbol “CNL” and on the OTCQX under the trading symbol “CNLMF”.
Qualified Person (QP) and NI43-101 Disclosure
David J Reading is the designated Qualified Person for this news release within the meaning of National Instrument 43-101 (“NI 43-101”) and has reviewed and verified that the technical information contained herein is accurate and approves of the written disclosure of same. Mr. Reading has an MSc in Economic Geology and is a Fellow of the Institute of Materials, Minerals and Mining and of the Society of Economic Geology (SEG).
Technical Information
Rock and core samples have been prepared and analyzed at SGS laboratory facilities in Medellin, Colombia and Lima, Peru. Blanks, duplicates, and certified reference standards are inserted into the sample stream to monitor laboratory performance. Crush rejects and pulps are kept and stored in a secured storage facility for future assay verification. No capping has been applied to sample composites. The Company utilizes a rigorous, industry-standard QA/QC program.
FORWARD-LOOKING STATEMENTS
This news release contains certain forward-looking statements, including, but not limited to, statements about the drill programs, including timing of results, and Collective’s future and intentions. Wherever possible, words such as “may”, “will”, “should”, “could”, “expect”, “plan”, “intend”, “anticipate”, “believe”, “estimate”, “predict” or “potential” or the negative or other variations of these words, or similar words or phrases, have been used to identify these forward-looking statements. These statements reflect management’s current beliefs and are based on information currently available to management as at the date hereof.
Forward-looking statements involve significant risk, uncertainties, and assumptions. Many factors could cause actual results, performance, or achievements to differ materially from the results discussed or implied in the forward-looking statements. These factors should be considered carefully, and readers should not place undue reliance on the forward-looking statements. Although the forward-looking statements contained in this news release are based upon what management believes to be reasonable assumptions, Collective cannot assure readers that actual results will be consistent with these forward-looking statements. These forward-looking statements are made as of the date of this news release, and Collective assumes no obligation to update or revise them to reflect new events or circumstances, except as required by law.
Neither the TSXV nor its Regulation Services Provider (as that term is defined in the policies of the TSXV) accepts responsibility for the adequacy or accuracy of this news release.
Vancouver, British Columbia–(Newsfile Corp. – November 28, 2022) – Goldshore Resources Inc. (TSXV: GSHR) (OTCQB: GSHRF) (FSE: 8X00) (“Goldshore” or the “Company“), is pleased to announce assay results from its ongoing 100,000-meter drill program at the Moss Lake Project in Northwest Ontario, Canada (the “Moss Lake Gold Project“).
Highlights:
Results for seven holes, drilled to expand the coverage of the high-grade shears in the QES Zone, have confirmed higher-grade shear-hosted gold mineralization within a large volume of well mineralized diorites. These results are all within the $1500 Whittle pit that constrains the current resource and identifies new high-grade shears. Best intercepts include:
1.51 g/t Au over 6.0m from 502.0m depth in MQD-22-075 and
1.47 g/t Au over 30.1m from 530.0m
8.45 g/t Au over 5.0m from 576m depth in MQD-22-076 including
36.9 g/t Au over 1.0m from 577m
1.87 g/t Au over 6.75m from 602.25m
1.31 g/t Au over 14.15m from 544.0m depth in MQD-22-080
2.07 g/t Au over 6.0m from 422.0m depth in MQD-22-085 and
1.07 g/t Au over 15.0m from 457.0m
1.26 g/t Au over 7.15m from 573.85m
1.07 g/t Au over 24.7m from 369.0m depth in MQD-22-087 and
2.15 g/t Au over 5.0m from 489.0m
1.75 g/t Au over 8.05m from 513.95m
2.11 g/t Au over 30.75m from 536.9m including
11.5 g/t Au over 3.1m from 555.2m
1.31 g/t Au over 63.6m from 427.0m depth in MQD-22-090A
2.07 g/t Au over 32.0m from 439.0m
A new parallel mineralized shear structure has been discovered 150m south of the main QES system containing high grade mineralization within a sheared intermediate volcanic package with best intercepts of:
3.44 g/t Au over 5.8m from 246.4m depth in MQD-22-080
1.22 g/t Au over 4.0m from 206.0m depth in MQD-22-087
1.15 g/t Au over 7.3m from 75.0m depth in MQD-22-090A
President and CEO Brett Richards stated: “The results from these drill holes in the QES Zone are part of a 52-hole data set that was not included in the recent mineral resource estimate. They confirm our belief that there are additional high-grade shear zones within the deposit that will potentially add to the shear domain component of the mineral resource that we anticipate will be prioritized in the mining schedule when we move towards conducting a preliminary economic analysis next year.”
Technical Overview
Figure 1 shows the better intercepts in plain view and Figure 2 is a typical section through hole MQD-22-087. Table 1 shows the significant intercepts. Table 2 shows the drill hole locations.
Figure 1: Drill plan showing best of several +1 g/t Au intercepts relative to shear and intrusion domains
Results have been received for six holes that have infilled areas of the QES Zone that are between sections drilled by historic holes with collar survey problems. As a result, they will replace the low-confidence historic holes in the upcoming resource model update.
A seventh hole was drilled to the southeast of the QES Zone to investigate two historical showing along a parallel structure of the QES Zone but did not intersect significant mineralization.
As with the historic holes, these holes intersected several broad zones of low-grade mineralization within the altered diorite intrusion host. Examples include 0.77 g/t Au over 83m from 493m depth in MQD-22-075; 0.41 g/t Au over 32.45m from 437.55m and 0.71 g/t Au over 131.1m from 493m in MQD-22-076; 0.54 g/t Au over 102m from 476m and 0.39 g/t Au over 27.95m from 643m in MQD-22-080; 0.78 g/t Au over 70m from 419m and 0.50 g/t Au over 28.75m from 521.25m in MQD-22-085; 0.50 g/t Au over 115.9m from 408.1m in MQD-22-087; and 0.48 g/t Au over 27.45m from 552.05m in MQD-22-090A.
All these low-grade zones occur as envelopes to higher-grade structures that form a three-dimensional, anastomosing shear network that has developed in response to strain on the altered diorite intrusion. Results include the broad zones of +1 g/t Au mineralization shown in the highlights (e.g., 1.31 g/t Au over 63.6m from 427m depth in MQD-22-090A) and several narrow high-grade intervals, including 10.1 g/t Au over 0.7m from 545.8m and 36.9 g/t Au over 1m from 577m in MQD-22-076; 10.0 g/t Au over 1m from 427m in MQD-22-085; 20.6 g/t Au over 0.9m from 370.65m, 28.3 g/t Au over 0.3m from 540.3m and 11.5 g/t Au over 3.1m from 555.2m in MQD-22-087; and 19.4 g/t Au over 1.15m from 455.85m in MQD-22-090A.
An additional parallel shear was discovered within the intermediate volcanic package approximately 150m south of the main QES system which contains broad intercepts of low-grade mineralization including 0.91 g/t over 24.8m from 246.4m in MQD-22-080; 0.33 g/t over 45.7m from 150.0m in MQD-22-085; 0.42 g/t over 39.0m from 189.0m in MQD-22-087 containing internal higher grade intercepts including 3.44 g/t Au over 5.8m from 246.4m depth in MQD-22-080; 1.22 g/t Au over 4.0m from 206.0m depth in MQD-22-087; 1.15 g/t Au over 7.3m from 75.0m depth in MQD-22-090A.
Importantly, these intercepts have identified additional high-grade shears not modelled in the recent Mineral Resource.
Pete Flindell, VP Exploration for Goldshore, said, “These drill results confirm high-grade shears that we have modelled at the QES Zone and confirmed additional shears that we expect to include in the next mineral resource update early next year.”
Table 1: Significant downhole gold intercepts
HOLE ID
FROM
TO
LENGTH (m)
TRUE WIDTH (m)
CUT GRADE (g/t Au)
UNCUT GRADE (g/t Au)
MQD-22-075
243.00
264.00
21.00
15.4
0.47
0.47
including
254.00
256.40
2.40
1.8
1.54
1.54
468.00
476.90
8.90
6.8
0.45
0.45
493.00
576.00
83.00
64.6
0.77
0.77
including
502.00
508.00
6.00
4.6
1.51
1.51
and
530.00
560.10
30.10
23.5
1.47
1.47
595.25
610.00
14.75
11.7
0.54
0.54
including
596.00
599.00
3.00
2.4
1.13
1.13
MQD-22-076
192.00
196.00
4.00
2.8
0.46
0.46
214.00
216.00
2.00
1.4
0.39
0.39
355.00
358.15
3.15
2.4
0.38
0.38
437.55
470.00
32.45
25.0
0.41
0.41
including
453.00
456.70
3.70
2.9
1.52
1.52
483.50
489.40
5.90
4.6
0.35
0.35
493.00
624.10
131.10
103.8
0.71
0.77
including
545.80
546.50
0.70
0.6
10.1
10.1
and
576.00
581.00
5.00
4.0
7.07
8.45
including
577.00
578.00
1.00
0.8
30.0
36.9
and
602.25
609.00
6.75
5.4
1.87
1.87
641.00
644.00
3.00
2.4
0.46
0.46
MQD-22-080
82.75
86.60
3.85
2.6
0.35
0.35
131.40
143.75
12.35
8.5
0.63
0.63
181.30
187.80
6.50
4.6
0.40
0.40
209.90
220.85
10.95
7.7
0.57
0.57
246.40
271.20
24.80
17.7
0.91
0.91
including
246.40
252.20
5.80
4.1
3.44
3.44
355.00
369.00
14.00
10.2
0.57
0.57
including
361.70
363.70
2.00
1.5
1.67
1.67
382.00
385.45
3.45
2.5
0.63
0.63
398.50
401.30
2.80
2.1
0.58
0.58
418.00
421.00
3.00
2.2
0.54
0.54
429.20
434.00
4.80
3.6
0.35
0.35
458.00
460.70
2.70
2.0
0.59
0.59
476.00
578.00
102.00
79.7
0.54
0.54
including
524.00
528.00
4.00
3.1
1.32
1.32
and
544.00
558.15
14.15
11.2
1.31
1.31
613.00
616.00
3.00
2.4
0.37
0.37
624.10
633.00
8.90
7.3
0.30
0.30
643.00
670.95
27.95
23.1
0.39
0.39
MQD-22-085
63.60
74.10
10.50
7.1
0.38
0.38
116.15
118.35
2.20
1.5
1.57
1.57
150.00
195.70
45.70
32.2
0.33
0.33
248.00
250.00
2.00
1.4
0.39
0.39
256.00
258.00
2.00
1.4
0.41
0.41
284.80
288.05
3.25
2.4
0.91
0.91
including
286.00
288.05
2.05
1.5
1.30
1.30
337.00
342.00
5.00
3.7
0.30
0.30
362.00
371.65
9.65
7.2
0.31
0.31
382.45
388.00
5.55
4.1
0.30
0.30
390.80
410.90
20.10
15.0
0.31
0.31
419.00
489.00
70.00
53.1
0.78
0.78
including
422.00
428.00
6.00
4.5
2.07
2.07
including
427.00
428.00
1.00
0.8
10.0
10.0
and
443.00
446.00
3.00
2.3
1.09
1.09
and
457.00
472.00
15.00
11.4
1.07
1.07
and
481.00
485.00
4.00
3.1
2.10
2.10
506.00
508.00
2.00
1.5
0.67
0.67
521.25
550.00
28.75
22.4
0.50
0.50
573.85
581.00
7.15
5.7
1.26
1.26
665.20
671.55
6.35
5.1
0.35
0.35
MQD-22-087
78.00
81.55
3.55
2.4
0.43
0.43
92.00
109.00
17.00
11.6
0.33
0.33
189.00
228.00
39.00
27.3
0.42
0.42
including
206.00
210.00
4.00
2.8
1.22
1.22
249.75
261.00
11.25
8.0
0.49
0.49
289.50
298.70
9.20
6.6
0.42
0.42
including
294.50
296.65
2.15
1.6
1.07
1.07
342.00
349.65
7.65
5.6
0.40
0.40
369.00
393.70
24.70
18.2
1.07
1.09
including
370.65
371.55
0.90
0.7
20.6
20.6
408.10
524.00
115.90
87.3
0.50
0.50
including
425.30
429.50
4.20
3.1
1.28
1.28
and
489.00
494.00
5.00
3.8
2.15
2.15
and
513.95
522.00
8.05
6.1
1.75
1.75
536.90
567.65
30.75
23.6
2.11
2.11
including
539.55
567.65
28.10
21.6
2.23
2.23
including
540.30
540.60
0.30
0.2
28.3
28.3
and
555.20
558.30
3.10
2.4
11.5
11.5
579.00
592.00
13.00
10.1
0.37
0.37
628.65
634.00
5.35
4.2
0.48
0.48
MQD-22-090A
75.00
82.30
7.30
3.8
1.15
1.15
including
78.00
81.55
3.55
1.8
2.05
2.05
94.00
98.00
4.00
2.1
0.54
0.54
133.00
146.00
13.00
7.0
0.35
0.35
193.00
196.00
3.00
1.6
0.39
0.39
227.70
230.60
2.90
1.6
0.53
0.53
238.55
240.85
2.30
1.3
0.42
0.42
245.00
252.25
7.25
4.0
0.35
0.35
287.35
292.75
5.40
3.0
0.44
0.44
427.00
490.60
63.60
37.7
1.31
1.31
including
427.00
429.00
2.00
1.2
1.10
1.10
and
439.00
471.00
32.00
19.0
2.07
2.07
including
455.85
457.00
1.15
0.7
19.4
19.4
503.85
508.00
4.15
2.5
0.73
0.73
519.00
541.00
22.00
13.3
0.35
0.35
including
525.00
527.00
2.00
1.2
1.47
1.47
552.05
579.50
27.45
16.8
0.48
0.48
including
574.00
576.00
2.00
1.2
1.14
1.14
Intersections calculated above at 0.3 g/t Au cut off with a top cut of 30 g/t Au and a maximum internal waste interval of 10 metres. Bordered intervals are intersections calculated above a 1.0 g/t Au cut off. Intervals in bold are those with a grade thickness factor exceeding 20 gram x metres / tonne gold. True widths are approximate and assume a subvertical body.
Table 2: Location of drill holes in this press release
HOLE
EAST
NORTH
RL
AZIMUTH
DIP
EOH
MQD-22-075
670,308
5,379,250
443
336°
-47°
675.1
MQD-22-076
670,379
5,379,296
442
338°
-47°
651.0
MQD-22-080
670,462
5,379,398
450
335°
-50°
675.05
MQD-22-083
670,667
5,379,431
433
156°
-50°
630.1
MQD-22-085
670,636
5,379,537
441
336°
-49°
675.0
MQD-22-087
670,546
5,379,463
449
336°
-49°
675.0
MQD-22-090A
670,654
5,379,625
429
346°
-60°
606.0
Approximate collar coordinates in NAD 83, Zone 15N
Analytical and QA/QC Procedures
All samples were sent to ALS Geochemistry in Thunder Bay for preparation and analysis was performed in the ALS Vancouver analytical facility. ALS is accredited by the Standards Council of Canada (SCC) for the Accreditation of Mineral Analysis Testing Laboratories and CAN-P-4E ISO/IEC 17025. Samples were analyzed for gold via fire assay with an AA finish (“Au-AA23”) and 48 pathfinder elements via ICP-MS after four-acid digestion (“ME-MS61”). Samples that assayed over 10 ppm Au were re-run via fire assay with a gravimetric finish (“Au-GRA21”).
In addition to ALS quality assurance / quality control (“QA/QC”) protocols, Goldshore has implemented a quality control program for all samples collected through the drilling program. The quality control program was designed by a qualified and independent third party, with a focus on the quality of analytical results for gold. Analytical results are received, imported to our secure on-line database and evaluated to meet our established guidelines to ensure that all sample batches pass industry best practice for analytical quality control. Certified reference materials are considered acceptable if values returned are within three standard deviations of the certified value reported by the manufacture of the material. In addition to the certified reference material, certified blank material is included in the sample stream to monitor contamination during sample preparation. Blank material results are assessed based on the returned gold result being less than ten times the quoted lower detection limit of the analytical method. The results of the on-going analytical quality control program are evaluated and reported to Goldshore by Orix Geoscience Inc.
About Goldshore
Goldshore is an emerging junior gold development company, and owns the Moss Lake Gold Project located in Ontario. Wesdome Gold Mines Ltd. is currently a large shareholder of Goldshore with an approximate 27% equity position in the Company. Well-financed and supported by an industry-leading management group, board of directors and advisory board, Goldshore is positioned to advance the Moss Lake Gold Project through the next stages of exploration and development.
About the Moss Lake Gold Project
The Moss Lake Gold Project is located approximately 100 km west of the city of Thunder Bay, Ontario. It is accessed via Highway 11 which passes within 1 km of the property boundary to the north. The Moss Lake Gold Project covers 14,292 hectares and consists of 282 unpatented and patented mining claims.
The Moss Lake Gold Project hosts a number of gold and base metal rich deposits including the Moss Lake Deposit (Table 3), the East Coldstream Deposit (Table 4), the historically producing North Coldstream Mine (Table 5), and the Hamlin Zone, all of which occur over a mineralized trend exceeding 20 km in length.
The Moss Lake Deposit hosts an estimated inferred mineral resource of 4.17 Moz Au (see Goldshore’s news release dated November 15, 2022). A technical report is being prepared in accordance with National Instrument 43-101 (“NI 43-101“) and will be available on the Company’s website and SEDAR within 45 days of November 15, 2022.
A historical mineral resource estimate (the “East Coldstream Historical Estimate“) was completed on the East Coldstream Deposit in 2011 by Foundation Resources Inc.2,3 The East Coldstream Deposit is a shear-hosted disseminated-style gold deposit which locally outcrops at surface. It has been drilled over a 1.3 km length and to depths of 200 m with 138 holes completed between 1988 and 2017. The deposit remains largely open at depth and may have the potential for expansion along strike. Historic drill hole highlights from the East Coldstream Deposit include 4.86 g/t Au over 27.3 m in C-10-15.
The historically producing North Coldstream Mine is reported to have produced significant amounts of copper, gold and silver4 from mineralization with potential iron-oxide-copper-gold deposit style affinity. The exploration potential immediately surrounding the historic mining area is not currently well understood and historic data compilation is required.
The Hamlin Zone is a significant occurrence of copper and gold mineralization, and also of potential iron-oxide-copper-gold deposit style affinity. Between 2008 and 2011, Glencore tested Hamlin with 24 drill holes which successfully outlined a broad and intermittently mineralized zone over a strike length of 900 m. Historic drill hole highlights from the Hamlin Zone include 0.9 g/t Au and 0.35% Cu over 150.7 m in HAM-11-75.
The Moss Lake, East Coldstream and North Coldstream deposits sit on a mineral trend marked by a regionally significant deformation zone locally referred to as the Wawiag Fault Zone in the area of the Moss Lake Deposit. This deformation zone occurs over a length of approximately 20 km on the Moss Lake Gold Project and there is an area spanning approximately 7 km between the Moss Lake and East Coldstream deposits that is significantly underexplored.
Table 3: Mineral Resource Estimate (Moss Lake Deposit) 1
Inferred Resources (Domains)
Tonnes (Mt)
Grade (g/t Au)
Contained Metal (Moz AU)
Shear
34.7
2.0
2.20
Intrusion
87
0.7
1.97
TOTAL
121.7
1.1
4.17
Notes:
(1) The Moss Lake Deposit hosts an estimated inferred mineral resource of 4.17 Moz Au (see Goldshore’s news release dated November 15, 2022). A technical report is being prepared in accordance with NI 43-101 and will be available on the Company’s website and SEDAR within 45 days of November 15, 2022.
Table 4: Historical Mineral Resources (East Coldstream Deposit) 2,3
INDICATED
INFERRED
Tonnes
Grade (g/t Au)
Oz Au
Tonnes
Grade (g/t Au)
Oz Au
East Coldstream Total
3,516,700
0.85
96,400
30,533,000
0.78
763,276
Notes: (2) Source: McCracken, T. “Technical Report and Resource Estimate on the Osmani Gold Deposit, Coldstream Property, Northwestern Ontario”, prepared for Foundation Resources Inc. and Alto Ventures Ltd. The East Coldstream Historical Estimate is based on a 0.4 g/t Au cut-off grade. The qualified persons for the East Coldstream Historical Estimate are Todd McCracken, P.Geo. (Tetratech Wardrop), and Jeff Wilson, Ph.D., P.Geo. (Tetratech Wardrop), and the effective date of the East Coldstream Historical Estimate is December 12, 2011. Resources are presented unconstrained, undiluted and in situ. The East Coldstream Historical Estimate includes 2 gold-bearing zones. A cut-off grade of 0.4 g/t Au was selected as the official resource cut-off grade. The East Coldstream Historical Estimate is based on 116 diamond drill holes drilled from 1986 to 2011. A fixed density of 2.78 g/cm3 was used. Capping was established at 5.89 g/t Au and 5.70 g/t Au for domains EC-1 and EC-2, respectively. This is supported by statistical analysis and the high grade distribution within the deposit. Compositing was done on drill hole sections falling within the mineralized zone solids (composite = 1 m). Resources were evaluated from drill hole samples using the ID2 interpolation method in a multi-folder percent block model using Datamine Studio 3 version 3.20.5321.0. Resource categorization is based on spatial continuity based from the variography of the assays within the drillholes. Ounce (troy) = metric tons x grade / 31.10348. Calculations used metric units (metres, tonnes and g/t). The number of metric tonnes was rounded to the nearest thousand. Any discrepancies in the totals are due to rounding effects; rounding followed the recommendations in NI 43-101.
(3) The reader is cautioned that the East Coldstream Historical Estimate is considered historical in nature and as such is based on prior data and reports prepared by previous property owners. The reader is cautioned not to treat it, or any part of it, as current mineral resources or reserves. The Company has determined this historical resource is reliable, and relevant to be included here in that it demonstrates simply the mineral potential of the Moss Lake Gold Project. A qualified person has not done sufficient work to classify the East Coldstream Historical Estimate as a current resource and Goldshore is not treating the East Coldstream Historical Estimate as a current resource. Significant data compilation, re-drilling, re-sampling and data verification may be required by a qualified person before the East Coldstream Historical Estimate can be classified as a current resource. There can be no assurance that any of the historical mineral resources, in whole or in part, will ever become economically viable. In addition, mineral resources are not mineral reserves and do not have demonstrated economic viability. Even if classified as a current resource, there is no certainty as to whether further exploration will result in any inferred mineral resources being upgraded to an indicated or measured mineral resource category. The East Coldstream Historical Estimate relating to inferred mineral resources was calculated using prior mining industry standard definitions and practices for estimating mineral resource and mineral reserves. Such prior definitions and practices were utilized prior to the implementation of the current standards of the Canadian Institute of Mining for mineral resource estimation, and have a lower level of confidence.
Table 5: Reported Historical Production (North Coldstream Deposit) 4
Deposit
Tonnes
Cu %
Au g/t
Ag
Cu lbs
Au oz
Ag oz
Historical Production
2,700,0000
1.89
0.56
5.59
102,000,000
44,000
440,000
Note:
(4) Source: Schlanka, R., 1969. Copper, Nickel, Lead and Zinc Deposits of Ontario, Mineral Resources Circular No. 12, Ontario Geological Survey, pp. 314-316.
Peter Flindell, P.Geo., MAusIMM, MAIG, Vice President – Exploration of the Company, a qualified person under NI 43-101 has approved the scientific and technical information contained in this news release.
Neither the TSXV nor its Regulation Services Provider (as that term is defined in the policies of the TSXV) accepts responsibility for the adequacy or accuracy of this release.
For More Information – Please Contact:
Brett A. Richards President, Chief Executive Officer and Director Goldshore Resources Inc.
This news release contains statements that constitute “forward-looking statements.” Such forward looking statements involve known and unknown risks, uncertainties and other factors that may cause the Company’s actual results, performance or achievements, or developments to differ materially from the anticipated results, performance or achievements expressed or implied by such forward-looking statements. Forward looking statements are statements that are not historical facts and are generally, but not always, identified by the words “expects,” “plans,” “anticipates,” “believes,” “intends,” “estimates,” “projects,” “potential” and similar expressions, or that events or conditions “will,” “would,” “may,” “could” or “should” occur.
Forward-looking statements in this news release include, among others, statements relating to expectations regarding the exploration and development of the Moss Lake Gold Project, plans to conduct a preliminary economic assessment and timing thereof, updating the mineral resource estimates, the filing of a technical report to support the mineral resource estimate at the Moss Lake Deposit, and other statements that are not historical facts. By their nature, forward-looking statements involve known and unknown risks, uncertainties and other factors which may cause our actual results, performance or achievements, or other future events, to be materially different from any future results, performance or achievements expressed or implied by such forward-looking statements. Such factors and risks include, among others: the Company may require additional financing from time to time in order to continue its operations which may not be available when needed or on acceptable terms and conditions acceptable; compliance with extensive government regulation; domestic and foreign laws and regulations could adversely affect the Company’s business and results of operations; the stock markets have experienced volatility that often has been unrelated to the performance of companies and these fluctuations may adversely affect the price of the Company’s securities, regardless of its operating performance; the ongoing military conflict in Ukraine; and other risk factors outlined in the Company’s public disclosure documents.
The forward-looking information contained in this news release represents the expectations of the Company as of the date of this news release and, accordingly, is subject to change after such date. Readers should not place undue importance on forward-looking information and should not rely upon this information as of any other date. The Company undertakes no obligation to update these forward-looking statements in the event that management’s beliefs, estimates or opinions, or other factors, should change.
VANCOUVER, BC, Nov. 28, 2022 /CNW/ – Bravo Mining Corp. (TSXV: BRVO) (OTCQX: BRVMF) (“Bravo” or the “Company“) today announced that it has received assay results from the analysis of re-sampled historic drill core from an additional eight historical diamond drill holes (“DDH”) from its Luanga (palladium + platinum + rhodium + gold +nickel) project (“Luanga” or “Luanga PGM+Au+Ni“), located in the Carajás Mineral Province, state of Pará, Brazil.
“Assay results have been received from a total of 42 re-sampled historic drill holes to date, with the previously noted positive trend of higher PGM+Au grades continuing to be observed in most intercepts as compared to historical intercepts,” said Luis Azevedo, Chairman and CEO of Bravo. “It is also encouraging that nickel sulphide grades are very comparable to the historical total nickel results, suggesting that very little nickel is tied up in silicates in the fresh rock. All these observations, combined with the first-time assaying for rhodium in many intercepts, are supportive as we work to validate Luanga’s historical mineral resource estimate of 142Mt @ 1.24 g/t Pd+Pt+Au and 0.11% Ni” (see Page 5 of this news release for important information in respect of the Historical Estimate).
Highlights
Results from the ongoing re-sampling of historic drill core continue to show a tendency to exceed the tenor of historic intercept grades, with mineralized thicknesses directly comparable to the thicknesses reported for historic intercepts.
Highlights of Bravo’s most recent re-sampling results are tabulated below, with details including comparisons to historic intercepts:
HOLE-ID
FROM (m)
TO(m)
THICKNESS (m)
HISTORIC SGS PGM + Au (g/t)
BRAVO ALSPGM + Au (g/t)
HISTORICNi % (Total)
BRAVO**Ni % (Sulphide)
TYPE
PPT-LUAN-FD0072
79.0
86.0
7.0
1.19
1.50
0.09
0.08
FR
PPT-LUAN-FD0082
44.0
68.0
24.0
1.59
2.08*
0.18
0.21
FR
PPT-LUAN-FD0112
0.0
30.0
30.0
1.34
2.34
0.24
NA
Ox
And
139.0
156.0
17.0
1.02
2.15
0.01
0.01
FR/LS
Notes:
All ‘From’, ‘To’ depths, and ‘Thicknesses’ are downhole.
Given the orientation of the hole and the mineralization, the intercept is estimated to be 80% to 90% of true thickness.
Type: Ox = Oxide. LS = Low Sulphur. FR = Fresh Rock. Recovery methods and results will differ based on the type of mineralization.
NA: Not Applicable as intercept is oxide or a mix of oxide and fresh rock mineralization.
* = Includes Rh >1.00g/t result. Overlimit analyses pending.
** = Bravo’s nickel grades are sulphide nickel, and do not include non-recoverable silicate nickel, unlike historic total nickel assays.
119 drill holes (including 8 metallurgical drill holes) have been completed so far in 2022, for a total of 20,409 metres (or 80% of the Phase 1 Drill Program). Currently, samples from 46 drill holes are at the assay laboratory pending results, and results from 34 drill holes have been released to date.
22,318 samples have been submitted for assay in 2022, including 3,353 samples from re-sampling of historic drill core.
6 drill rigs operating onsite.
Luanga Re-Sampling Program and Phase 1 Drilling Progress
A comparison of the historic intercepts with the Bravo assay results from re-sampled core is tabulated below, with a plan showing the re-sampled hole locations. A drill section is provided below, showing results for PPT-LUAN-112. Bravo’s assay results from re-sampled core continue to closely correlate to the historic intercepts in thicknesses, while the previously observed trend of intercepts frequently exceeding the tenor of historic grades continues. This is most likely related to improved assay methods for PGMs versus those available over 20 years ago, and only sporadic rhodium assaying historically.
The Phase 1 diamond drill program continues as planned at Luanga. Six drill rigs are on site, with drilling progressing in various locations along the entire 8.1km strike length of the known Luanga mineralized envelope. To date, 114 drill holes have been completed, for a total of 19,384 metres (or 76%) of the planned 25,500 metre Phase 1 drill program.
Comparison of Re-Sampled Intercepts – Historic Intercept (SGS Laboratory) versus Bravo Intercept (ALS Laboratory)
HOLE-ID
From (m)
To(m)
Thickness (m)
HISTORIC SGS PGM + Au (g/t)
BRAVO ALSPGM + Au (g/t)
HISTORICNi % (Total)
BRAVO**Ni % (Sulphide)
TYPE
PPT-LUAN-FD0072
44.0
60.0
16.0
0.72
0.71
0.16
0.18
FR
And
79.0
86.0
7.0
1.19
1.50
0.09
0.08
FR
PPT-LUAN-FD0073
26.0
44.0
18.0
0.81
0.84
0.15
0.16
FR
PPT-LUAN-FD0082
0.0
19.0
19.0
0.81
0.83
0.10
NA
Ox
And
44.0
68.0
24.0
1.59
2.08*
0.18
0.21
FR
And
81.0
84.0
3.0
0.90
1.00
0.09
0.08
FR
PPT-LUAN-FD0083
57.0
63.0
6.0
0.28
0.23
0.15
0.13
FR
And
68.0
74.0
6.0
0.17
0.14
0.11
0.09
FR
PPT-LUAN-FD0096
292.0
307.0
15.0
0.50
0.48
0.10
0.10
FR
PPT-LUAN-FD0112
0.0
30.0
30.0
1.34
2.34
0.24
NA
Ox
And
139.0
156.0
17.0
1.02
2.15
0.01
0.01
FR/LS
Notes:
All ‘From’, ‘To’ depths, and ‘Thicknesses’ are downhole.
Given the orientation of the hole and the mineralization, the intercept is estimated to be 80% to 90% of true thickness.
Type: Ox = Oxide. LS = Low Sulphur. FR = Fresh Rock. Recovery methods and results will differ based on the type of mineralization.
NA: Not Applicable as intercept is oxide or a mix of oxide and fresh rock mineralization.
* = Includes Rh >1.00g/t result. Overlimit analyses pending.
** = Bravo’s nickel grades are sulphide nickel, and do not include non-recoverable silicate nickel, unlike historic total nickel assays.
Complete Table of New Intercepts for Re-sampled holes
HOLE-ID
From (m)
To(m)
Thickness (m)
Pd(g/t)
Pt(g/t)
Rh(g/t)
Au (g/t)
PGM + Au (g/t)
Ni % (Sulphide)
TYPE
PPT-LUAN-FD0072
44.0
60.0
16.0
0.38
0.21
0.04
0.09
0.71
0.18
FR
And
79.0
86.0
7.0
0.87
0.50
0.10
0.02
1.50
0.08
FR
PPT-LUAN-FD0073
26.0
44.0
18.0
0.44
0.25
0.01
0.15
0.84
0.16
FR
PPT-LUAN-FD0082
0.0
19.0
19.0
0.61
0.18
0.01
0.03
0.83
NA
Ox
And
44.0
68.0
24.0
1.22
0.62
0.20*
0.03
2.08*
0.21
FR
And
81.0
84.0
3.0
0.68
0.26
0.05
0.01
1.00
0.08
FR
PPT-LUAN-FD0083
57.0
63.0
6.0
0.12
0.09
0.01
<0.01
0.23
0.13
FR
And
68.0
74.0
6.0
0.09
0.04
0.01
0.01
0.14
0.09
FR
PPT-LUAN-FD0096
292.0
307.0
15.0
0.25
0.17
0.03
0.04
0.48
0.10
FR
PPT-LUAN-FD0112
0.0
30.0
30.0
1.38
0.82
0.11
0.04
2.34
NA
Ox
And
139.0
156.0
17.0
0.77
1.17
0.19
0.02
2.15
0.01
FR/LS
Notes:
All ‘From’, ‘To’ depths, and ‘Thicknesses’ are downhole.
Given the orientation of the hole and the mineralization, the intercept is estimated to be 80% to 90% of true thickness.
Type: Ox = Oxide. LS = Low Sulphur. FR = Fresh Rock. Recovery methods and results will differ based on the type of mineralization.
NA: Not Applicable as intercept is oxide or a mix of oxide and fresh rock mineralization.
* = Includes Rh >1.00g/t result. Overlimit analyses pending.
About Bravo Mining Corp.
Bravo is a Canada and Brazil-based mineral exploration and development company focused on advancing its Luanga PGM + Au + Ni Project in the world-class Carajás Mineral Province of Brazil.
The Luanga Project benefits from being in a location close to operating mines, with excellent access and proximity to existing infrastructure, including road, rail and clean and renewable hydro grid power. The project area was previously de-forested for agricultural grazing land. Bravo’s current Environmental, Social and Governance activities includes replanting trees in the project area, hiring and contracting locally, engagement with local communities, and ensuring protection of the environment during its exploration activities.
Technical Disclosure
Technical information in this news release has been reviewed and approved by Simon Mottram, F.AusIMM (Fellow Australia Institute of Mining and Metallurgy), President of Bravo Mining Corp. who serves as the Company’s “qualified person”, as defined in National Instrument 43-101 Standards of Disclosure for Mineral Projects (“NI 43-101“). Mr. Mottram has verified the technical data and opinions contained in this news release.
Historical Resource Estimate
This press release includes a historical resource estimate for the Luanga Project (the “Historical Estimate“) prepared internally by prior owners, VALE SA, in 2017 and contained in a report by Mansur E.T., Ferreira Filho C.F., Oliveira D.P.L. entitled “The Luanga deposit, Carajás Mineral Province, Brazil: Different styles of PGE mineralization hosted in a medium-size layered intrusion.” and published in Ore Geology Reviews (Volume 118, March 2020, 103340). A qualified person has not done sufficient work to classify the Historical Estimate as current mineral resources or mineral reserves under National Instrument 43-101 – Standards of Disclosure for Mineral Projects (“NI 43-101”) and Bravo is not treating the Historical Estimate as current mineral resources or mineral reserves. Bravo cautions that the Historical Estimate was not prepared in accordance with NI 43-101.There can be no certainty, following further evaluation and/or exploration work, that the Historical Estimate can be upgraded or verified as mineral resources or mineral reserves in accordance with NI 43-101. Further, the assays values used to calculate the nickel content in the Historical Estimate are total nickel, and thus contain both sulphide nickel (potentially recoverable) and silicate nickel (unrecoverable by conventional methods). Bravo is not aware whether the nickel content in the Historical Estimate has been modified to account for this or not. In addition, no breakdown of the assay results for the individual metals contributing to this Historical Estimate has been published and the Historical Estimate was not classified in accordance with the mineral resource categories set out in NI 43-101. Nevertheless, Bravo considers the Historical Estimate to be relevant to the reader’s understanding of the status of the Project and its future potential.
Forward Looking Statements
This news release contains forward-looking information which is not comprised of historical facts. Forward-looking information is characterized by words such “outperform”, “highlights”, “positive trend”, “encouraging”, “inspiring”, “exceeding”, “correlate”, “exceeding”, “improved”, “validate” and other similar words, phrases or statements that certain events or conditions “could”, “should”, “potentially” or “will” occur. In particular, this news release contains forward-looking information pertaining to the Company’s ongoing re-sampling and drill programs and the results thereof; the potential for a continued trend of improved in grade relative to historic assays and the possible impact on future mineral resource estimates; the potential for the definition of new styles of mineralization and extensions to depth and the Company’s plans in respect thereof. Forward-looking information involves risks, uncertainties and other factors that could cause actual events, results, and opportunities to differ materially from those expressed or implied by such forward-looking information. Factors that could cause actual results to differ materially from such forward-looking information include, but are not limited to, changes in the state of equity and debt markets, re-sampling results may vary negatively from historical results, fluctuations in commodity prices, delays in obtaining required regulatory or governmental approvals, environmental risks, limitations on insurance coverage; and other risks and uncertainties involved in the mineral exploration and development industry. Forward-looking information in this news release is based on the opinions and assumptions of management considered reasonable as of the date hereof, including, but not limited to, the assumption that the assay results confirm the interpreted mineralization contains significant values of nickel, copper and also contain PGMs and Au; final drill and assay results will be in line with management’s expectations; that sample grades from re-assayed core may continue to outperform historic grades; that activities will not be adversely disrupted or impeded by regulatory, political, community, economic, environmental and/or healthy and safety risks; that the Luanga Project will not be materially affected by potential supply chain disruptions; and general business and economic conditions will not change in a materially adverse manner. Although the Company believes that the assumptions and factors used in preparing the forward-looking information in this news release are reasonable, undue reliance should not be placed on such information. The Company disclaims any intention or obligation to update or revise any forward-looking information, other than as required by applicable securities laws.
Schedule 1: Drill Hole Collar Details
HOLE-ID
Company
East (m)
North (m)
RL (m)
Datum
Depth (m)
Azimuth
Dip
Sector
PPT-LUAN-FD0072
Vale SA
659387.11
9341285.56
226.76
SIRGAS2000 UTM22S
231.00
330.0
-60.0
Central
PPT-LUAN-FD0073
Vale SA
659211.28
9341185.85
226.30
SIRGAS2000 UTM22S
229.10
330.0
-60.0
Central
PPT-LUAN-FD0082
Vale SA
659734.39
9341481.67
206.98
SIRGAS2000 UTM22S
213.20
330.0
-60.0
Central
PPT-LUAN-FD0083
Vale SA
659904.92
9341589.34
233.28
SIRGAS2000 UTM22S
216.65
330.0
-60.0
Central
PPT-LUAN-FD0096
Vale SA
659609.30
9341300.37
201.82
SIRGAS2000 UTM22S
320.40
360.0
-90.0
Central
PPT-LUAN-FD0112
Vale SA
659393.12
9343373.87
244.94
SIRGAS2000 UTM22S
160.90
90.0
-60.0
North
Schedule 2: Assay Methodologies and QAQC
Samples followed chain of custody between collection, processing and delivery to the ALS laboratory in Parauapebas, state of Pará, Brazil. The drill core was delivered to the core shack at Bravo’s Luanga site facilities and processed by geologists who inserted certified reference materials, blanks and duplicates into the sampling sequence. Drill core was quarter cut and placed in secured polyurethane bags, then in security-sealed sacks before being delivered directly from the Luanga site facilities to the Parauapebas ALS laboratory by Bravo staff. Additional information about the methodology can be found on the respective ALS or SGS global websites (ALS, SGS) in their analytical guides. Information regarding preparation and analysis of historic drill core is also presented in the table below, where the information is known.
Quality Assurance and Quality Control (“QAQC“) is maintained internally at the lab through rigorous use of internal certified reference materials, blanks, and duplicates. An additional QAQC program is administered by Bravo using certified reference materials, duplicate samples and blank samples that are blindly inserted into the sample batch. If a QAQC sample returns an unacceptable value an investigation into the results is triggered and when deemed necessary, the samples that were tested in the batch with the failed QAQC sample are re-tested.
TORONTO, Nov. 28, 2022 (GLOBE NEWSWIRE) — Labrador Gold Corp. (TSX.V:LAB | OTCQX:NKOSF | FNR: 2N6) (“LabGold” or the “Company”) is pleased to announce results from recent drilling targeting the prospective Appleton Fault Zone over a 12km strike length. The drilling is part of the Company’s ongoing 100,000 metre diamond drilling program at its 100% owned Kingsway Project.
Highlights of the drilling include an intersection of 8.60g/t Au over 4.41 metres from 326.89 metres that included 53.52g/t Au over 0.31 metres in Hole K-22-211 that contains visible gold, and 1.31g/t Au over 7 metres from 270 metres including 8.49g/t Au over 0.91 metres in Hole K-22-207 from Big Vein Southwest. Hole K-22-202, drilled at the northeast end of Big Vein, intersected 5.68g/t Au over 2.65 metres from 189.7 metres that included 18.27g/t Au over 0.78 metres.
Hole K-22-211 was collared 40 metres southwest of Hole K-22-174 that intersected 284.1 g/t Au over 0.58 metres and 15.05g/t Au over 1.11 metres (see News Release dated July 7, 2022) and extends the mineralized zone further to the Southwest.
“We continue to have drilling success at both ends of Big Vein which has now been drilled over a strike length of approximately 520 metres and remains open in both directions. In particular, the high grade zone containing visible gold at Big Vein Southwest continues to expand,” said Roger Moss, President and CEO. “Two drill rigs continue drilling at Big Vein to test for extensions of the mineralization in both directions. Drilling will continue through the winter.”
Hole ID
From (m)
To (m)
Interval (m)
Au (g/t)
Zone
K-22-211
326.89
331.3
4.41
8.6
Big Vein SW
including
326.89
328.16
1.27
23.44
including
327.19
327.5
0.31
53.52
333.71
334.71
1
1.52
K-22-207
270
277
7
1.31
Big Vein SW
including
273.57
274.48
0.91
8.49
K-22-202
189.7
192.35
2.65
5.68
Big Vein
including
189.7
190.48
0.78
18.27
245.3
246.2
0.9
1
354.7
358.8
4.1
1.06
including
354.7
355.65
0.95
2.06
K-22-201
262
263
1
1.56
Big Vein SW
K-22-199
nsv
CSAMT
K-22-198
214
215
1
2.2
Big Vein
266
268
2
2.5
K-22-197
356.87
357.97
1.1
1.34
Big Vein SW
K-22-196
nsv
Golden Glove
K-22-195
nsv
CSAMT
Table 1. Summary of assay results. All intersections are downhole length as there is insufficient Information to calculate true width.
A total of 61,404 metres have been drilled to date out of the planned 100,000 metre program. Assays are pending for samples from approximately 4,263 metres of core (11.4% of the total submitted).
The Company has $20 million in cash and is well funded to carry out the remaining 39,000 metres of the planned drill program as well as further exploration to add to the pipeline of drill targets on the property.
Hole ID
Easting
Northing
Elevation
Azimuth
Dip
Total Depth
K-22-211
661396
5434973
42
130
55
350
K-22-207
661366
5434937
38
140
50
317.52
K-22-202
661594
5435327
45.7
155
55
422
K-22-201
661366
5434937
38
130
55
315
K-22-199
666712
5443699
44
295
45
300
K-22-198
661594
5435327
45.7
155
45
368
K-22-197
661366
5434937
38
130
50
389
K-22-196
660700
5432008
33.5
355
45
476.13
K-22-195
666712
5443699
44
140
45
454.11
Table 2. Drill hole collar details
QA/QC
True widths of the reported intersections have yet to be calculated. Assays are uncut. Samples of HQ split core are securely stored prior to shipping to Eastern Analytical Laboratory in Springdale, Newfoundland for assay. Eastern Analytical is an ISO/IEC17025 accredited laboratory. Samples are routinely analyzed for gold by standard 30g fire assay with atomic absorption finish as well as by ICP-OES for an additional 34 elements. Samples containing visible gold are assayed by metallic screen/fire assay, as are any samples with fire assay results greater than 1g/t Au. The company submits blanks and certified reference standards at a rate of approximately 5% of the total samples in each batch.
Qualified Person
Roger Moss, PhD., P.Geo., President and CEO of LabGold, a Qualified Person in accordance with Canadian regulatory requirements as set out in NI 43-101, has read and approved the scientific and technical information that forms the basis for the disclosure contained in this release.
The Company gratefully acknowledges the Newfoundland and Labrador Ministry of Natural Resources’ Junior Exploration Assistance (JEA) Program for its financial support for exploration of the Kingsway property.
About Labrador Gold Labrador Gold is a Canadian based mineral exploration company focused on the acquisition and exploration of prospective gold projects in Eastern Canada.
Labrador Gold’s flagship property is the 100% owned Kingsway project in the Gander area of Newfoundland. The three licenses comprising the Kingsway project cover approximately 12km of the Appleton Fault Zone which is associated with gold occurrences in the region, including those of New Found Gold immediately to the south of Kingsway. Infrastructure in the area is excellent located just 18km from the town of Gander with road access to the project, nearby electricity and abundant local water. LabGold is drilling a projected 100,000 metres targeting high-grade epizonal gold mineralization along the Appleton Fault Zone with encouraging results. The Company has approximately $20 million in working capital and is well funded to carry out the planned program.
The Hopedale property covers much of the Florence Lake greenstone belt that stretches over 60 km. The belt is typical of greenstone belts around the world but has been underexplored by comparison. Work to date by Labrador Gold show gold anomalies in rocks, soils and lake sediments over a 3 kilometre section of the northern portion of the Florence Lake greenstone belt in the vicinity of the known Thurber Dog gold showing where grab samples assayed up to 7.8g/t gold. In addition, anomalous gold in soil and lake sediment samples occur over approximately 40 km along the southern section of the greenstone belt (see news release dated January 25th 2018 for more details). Labrador Gold now controls approximately 40km strike length of the Florence Lake Greenstone Belt.
The Company has 169,189,979 common shares issued and outstanding and trades on the TSX Venture Exchange under the symbol LAB.
For more information please contact: Roger Moss, President and CEO Tel: 416-704-8291
Neither TSX Venture Exchange nor its Regulation Services Provider (as that term is defined in policies of the TSX Venture Exchange) accepts responsibility for the adequacy or accuracy of this release.
Forward-Looking Statements: This news release contains forward-looking statements that involve risks and uncertainties, which may cause actual results to differ materially from the statements made. When used in this document, the words “may”, “would”, “could”, “will”, “intend”, “plan”, “anticipate”, “believe”, “estimate”, “expect” and similar expressions are intended to identify forward-looking statements. Such statements reflect our current views with respect to future events and are subject to risks and uncertainties. Many factors could cause our actual results to differ materially from the statements made, including those factors discussed in filings made by us with the Canadian securities regulatory authorities. Should one or more of these risks and uncertainties, such as actual results of current exploration programs, the general risks associated with the mining industry, the price of gold and other metals, currency and interest rate fluctuations, increased competition and general economic and market factors, occur or should assumptions underlying the forward looking statements prove incorrect, actual results may vary materially from those described herein as intended, planned, anticipated, or expected. We do not intend and do not assume any obligation to update these forward-looking statements, except as required by law. Shareholders are cautioned not to put undue reliance on such forward-looking statements.
VANCOUVER, British Columbia, Nov. 23, 2022 (GLOBE NEWSWIRE) — Silver Hammer Mining Corp. (CSE: HAMR; OTCQB: HAMRF) (the “Company” or “Silver Hammer”) is pleased to announce the appointment of the Company’s long term strategic advisor and supporter of the Company, Warwick Smith, as the Company’s new Interim President and Interim CEO, effective immediately.
To facilitate Mr. Smith’s appointment, Morgan Lekstrom has resigned as the President and CEO of the Company, effective immediately. The Company wishes Mr. Lekstrom well in his future endeavors.
Interim President and CEO, Warwick Smith, stated: “Silver Hammer is a well-structured and well-positioned company with cash and high-grade past-producing assets that have tremendous exploration upside. We expect to have assay results from our Silver Strand Project in the coming weeks and have a queue of quality drill targets now defined at our other projects that provide us with optionality in terms of potential joint ventures. I look forward to bringing my experience and working with our team to deliver shareholder value on an interim basis as we put this company on track for future growth.”
At just 30 years old, Warwick was a founding shareholder of Riverside Resources Inc. before becoming CEO of Western Pacific Resources Corp. at age 33 where he successfully negotiated the transaction to acquire the Deer Trail Mine (now operated by MAG Silver), while concurrently closing $18M in financing. As current CEO and Director of America Pacific Mining Corp., Mr. Smith negotiated the transaction to purchase the past-producing Madison Mine in Montana, a joint venture, earn-in agreement with major, Rio Tinto, a transaction that was subsequently nominated for the S&P Global Platts Deal of The Year for 2021. Subsequently, Mr. Smith led American Pacific in its takeover of Constantine Metals, which brought the 14 million tonne high-grade VMS Palmer Project, under partnership with Dowa Mining and Metals, into the portfolio.
In 2022 Mr. Smith was nominated for CEO of the Year by S&P Global Platts. As an industry expert, Mr. Smith has been featured on Bloomberg, Benzinga, Investing.com, Mining Journal, Northern Miner, S&P Global Platts, Globe and Mail, Kitco, Traders TV and Mining Weekly and continues to be a significant investor in the mining and metals sector.
About Silver Hammer Mining Corp.
Silver Hammer Mining Corp. is a junior resource company advancing the flagship past-producing Silver Strand Mine in the Coeur d’Alene Mining District in Idaho, USA, as well both the Eliza Silver Project and the Silverton Silver Mine in one of the world’s most prolific mining jurisdictions in Nevada and the Lacy Gold Project in British Columbia, Canada. Silver Hammer’s primary focus is defining and developing silver deposits near past-producing mines that have not been adequately tested. The Company’s portfolio also provides exposure to copper and gold discoveries.
On Behalf of the Board of Silver Hammer Mining Corp.
Warwick Smith Interim President and CEO
Corporate Office: Suite 206 – 595 Howe Street Vancouver, BC V6C 2T5
Check out this great interview with Judson Culter the CEO of Rover Metals, as the company is expanding its portfolio onto critical minerals. Will shareholders have a positive reaction to the new portfolio diversification? Find out right here!
A CRITICAL MINERALS EXPLORATION COMPANY Rover Metals (“Rover”) is a publicly traded Canadian junior mining company specialized in North American critical minerals and precious metal development-stage mining projects. Rover’s twelve month forward-looking plan is to advance exploration at our Nevada Claystone Lithium project and at our Northern Canada Zinc-Copper project, located near the city of Yellowknife, NT, Canada. The Indian Mountain Lake Project is the Company’s first district scale land package, representing approximately 30,000 acres of greenstone belt.
Rover Metals also has 100% ownership of several gold mining assets located near to the city of Yellowknife, NT. Rover obtained a public listing for its securities on the TSX Venture Exchange as a Tier II Mining Issuer on June 26, 2018.
Rover Metals trades under the symbol “ROVR” on the TSXV. Rover also obtained a public co-listing of its securities on the OTCQB on January 17, 2019 (OTCQB: ROVMF), and on the Frankfurt Stock Exchange on February 1, 2021 (FRA: 4XO).
The Company is run by an experienced management team and board that are career mining executives. Our management team and board have a proven history financing the development of mining projects, taking them into production, and re-selling them.
The Best Video on Why and When to Buy and Sell Physical Precious Metals:
I’m a licensed broker for Miles Franklin Precious Metals Investments, The Only Online Dealer that is Licensed and Bonded (Period)! Where we provide unlimited options to expand your precious metals portfolio, from:
Joining us for a conversation is Ari Sussman of Collective Mining, Colombia’s Newest Exploration Company. Collective Mining has just announced another significant development coming from the flagship Guayabales Project demonstrating continuity with a new Strike of 385 Meters, Width at 350 Meters, and Vertical 825 Meters! In this interview with provide shareholders with an update on the Collective Mining’s Exploration Program, which was just extended another 3,000 Metres on the back of a successful $10 Million Finance.
In this video, we’ll be highlighting Collective Mining and their recent Breccia expansion at the Apollo Target. Collective Mining is becoming a front runner in the junior mining space. With their flagship Guayables Project, Collective Mining is looking to materially expand their current mineral holdings.
If you’re interested in junior mining stocks, then you’ll want to check out this video! We’ll discuss Collective Mining’s new project, Apollo, and what this could mean for the junior mining space. Make sure to subscribe to our channel so you never miss an update!
In this video, I’m discussing the flagship Guayabales Project, specifically the Apollo Target with Aris Sussman of Collective Mining. The expansion at the Apollo gold project in Colombia, and how this could lead to further gains for Collective Mining shareholders.
Collective Mining: Rapidly advancing, large scale gold-copper-silver-moly porphyry and breccia targets with related high-grade vein systems in the mining-friendly department of Caldas in Colombia
Collective Mining’s two projects the Guayabales (Flagship) and the San Antonio (Secondary) are situated in Marmato, an underexplored yet multi-million ounce, high-grade gold and silver district located in the Middle Cauca belt in Colombia. With six out of eleven targets drilled, the Company has made three promising grassroot discoveries to date and is awaiting assay results on a potential fourth discovery. Drilling activity continues at a brisk pace with a 20,000+ metre drill program in 2022.
The Best Video on WHY and WHEN to Buy and Sell Physical Precious Metals:
Proven and Probable Where we deliver Mining Insights & Bullion Sales. I’m a licensed broker for Miles Franklin Precious Metals Investments, The Only Online Dealer that is Licensed and Bonded (Period)! Where we provide unlimited options to expand your precious metals portfolio, from
(Kitco News) – Although the platinum market has seen a significant surplus in 2022, the market is expected to get a lot tighter next year, with the World Platinum Investment Council forecasting a sizable deficit.
Tuesday, the WPIC released its platinum Quarter report, which looked a platinum demand for the third quarter and provided initial estimates for 2023.
The analysts revised the expected surplus for this year to 804,000 ounces, a decline of about 17% from its second-quarter projections. However, the biggest highlight of the report is an expected 1.1 million-ounce swing in the supply of the precious metal.
“It’s a significant change in direction,” Edward Sterck, director of research at the council, said in an interview with Kitco News.
The analysts said that they expect platinum to see a supply deficit of 303,000 ounces in 2023 as global demand rises above 7.7 million ounces and supply remains reasonably stable, growing by only 2%.
While the platinum supplies have been volatile in the last few years, Sterck said there is a strong chance the market will see tighter conditions moving forward. He added that demand continues to grow while supply struggles to keep up.
“I don’t think we are going to see the supply response to growing demand,” he said. “Producers might want to respond to the supply and demand imbalance, but I don’t think they will be in a position to do so anytime soon.
There are already signs of producers struggling to keep up as the WPIC said that supply is expected to decline 10% this year to 5.63 million ounces, lower than levels seen pre-pandemic.
At the same time, industrial demand, led by the automotive sector, continues to grow. The report said platinum usage in the auto sector increased by 143,000 ounces in the third quarter, jumping 25% from last year. Sterck said that the auto sector continues to struggle with supply chain issues and production is below traditional recessionary levels.
Sterck added that if the microchip shortage continues to improve, demand for new cars will continue to grow, even in the midst of a recession. For 2023, the WPC expects the auto sector to consume 324,000 ounces of platinum, an 11% increase from this year.
Total industrial demand is expected to rise by 10,000 ounces this year, a 2% increase from last year. The WPIC sees a 10% increase in demand next year.
“Driven by anticipated growth in capacity expansions and ongoing strong demand in China, as well as fibreglass plant projects in Egypt, glass demand is expected to jump by 52% to 481 koz,” the report said.
Looking at investment demand, the WPIC said they expect to see a sharp turnaround in 2023. The report noted that liquidation in platinum-backed exchange-traded funds caused 235,000 ounces to flow out of the market. For the year, analysts forecast investment demand to decline by 525,000 ounces this year.
However, looking ahead, the WPIC sees bar and coin demand growing 49% next year, driven by Japanese investors. Physical demand is expected to rise to a three-year high in 2023.
“Outflows from exchange warehouses (-20 Koz) and liquidations of ETF holdings (-275 kHz) are expected to slow, resulting in net investment of 212 koz in 2023,” the analysts said in the report.
For Kitco Newshttps://platform.twitter.com/widgets/follow_button.644279d1635fd969e87af94a98bd232b.en.html#dnt=false&id=twitter-widget-0&lang=en&screen_name=neils_C&show_count=false&show_screen_name=true&size=l&time=1669197355575
Disclaimer: The views expressed in this article are those of the author and may not reflect those of Kitco Metals Inc. The author has made every effort to ensure accuracy of information provided; however, neither Kitco Metals Inc. nor the author can guarantee such accuracy. This article is strictly for informational purposes only. It is not a solicitation to make any exchange in commodities, securities or other financial instruments. Kitco Metals Inc. and the author of this article do not accept culpability for losses and/