Original Source: https://sprott.com/media/6899/sprott-gold-equities-strategy-q4-2023-commentary.pdf
We offer herein an investment rationale for gold mining equities that rests primarily on investment fundamentals particular to the mining sector. Speculation on the future course of the gold price takes a back seat. A tailwind from higher metal prices would, of course, be helpful but in our view would only add heft to an already powerful investment case.
1. Extreme Undervaluation
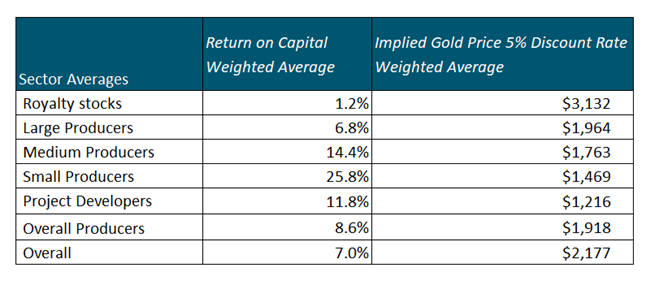
Gold mining stock valuations are the lowest in 25 years. The spread between the gold price and the discount implied to spot based on the market price of the equities is a massive $700+ per ounce. In other words, cash flow from a gold price 65% of the current spot price would return the entire market value of the group based on existing reserves. BMO calculates an average return on capital of 14.4% for mid-capitalization producers and 25.8% for small-cap producers in a semi-liquidation scenario (see Figure A2). We believe investment returns would be substantially greater in a full liquidation scenario, which would assume the elimination of all discretionary capital spending. In essence, the theoretical returns from taking many of the mid- and small-cap producers private would be compelling from the perspective of a corporate raider. The “corporate raider” perspective is of course only a notional concept to illustrate the extreme undervaluation of the sector. The risk typically associated with extreme undervaluation is the amount of time required for the investment thesis to prove out, not loss of capital.
Figure A1. Gold Price Discounted by the Market @ 0% Discount Rate
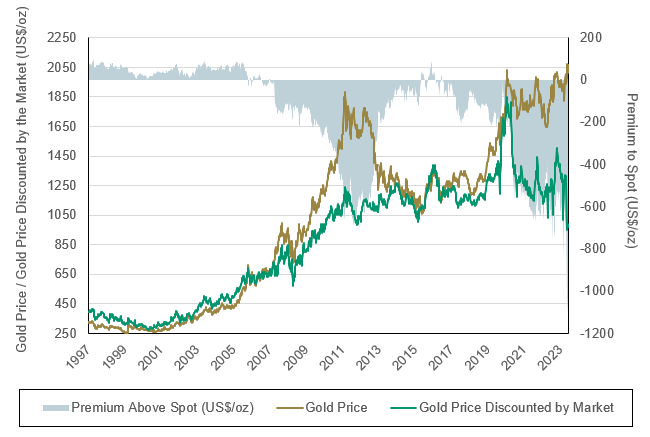
Source: BMO Capital Markets. Data as of 12/31/2023. Included for illustrative purposes only. Past performance is no guarantee of future results.
Figure A2. Return on Capital for Gold Miners
2. Divergence from Gold Price
The average annual gold price has increased over 20% since 2011. The gold price is the single most important fundamental driver of earnings and returns on capital. However, gold stocks have declined over 40% (based on GDX1) since 2011. We have enumerated several reasons for this 60% performance divergence in an earlier commentary, Gold vs. Gold Stocks, An Unresolved Incongruity. In our view, those factors have been excessively discounted. In our opinion, there is near-term potential for a substantial mean reversion trade even assuming no further rise in the gold price.
Figure B. Gold Mining Equities vs. Average Gold Price2
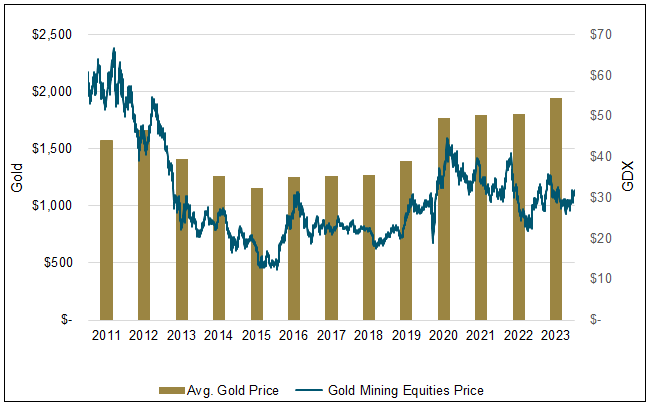
Source: BMO Capital Markets. Data as of 12/31/2023. Included for illustrative purposes only. Past performance is no guarantee of future results.
3. 2024 Profitability Set for Sharp Improvement
Profit margins will improve even in a flat gold price environment. Inflation has started to cool off thanks to the Federal Reserve’s (Fed’s) tight money campaign. More importantly, this capital-intensive industry has made significant advances in productivity that will drive margin expansion. BMO Research forecasts a decline in production costs (All In Sustaining Costs or AISC) of 14%, 11% and 25% for large-, mid- and small-cap producers, respectively. These projections are based on BMO’s “bottoms up” analysis of each company’s 2024 outlook. The improvement can be explained by general cost deflation, across-the-board productivity advances and, for smaller producers, the normal post-start-up improvement in recently completed mine construction.
Figure C. Gold Miners: All In Sustaining Costs Estimates
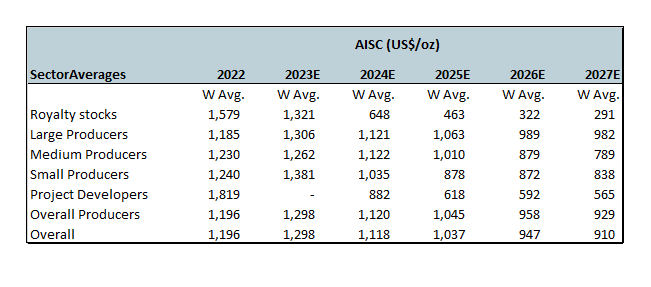
Source: BMO Capital Markets, Bloomberg, FactSet. Included for illustrative purposes only. Past performance is no guarantee of future results.
4. Chronic Underinvestment Sets Up Potential Demand/Supply Squeeze
According to Bloomberg, the reserve life of the top 10 miners has declined 33% in the last 10 years. As noted in #1 above, the gold mining industry is in a quasi-liquidation mode.
Figure D. Gold Reserves by the Top 10 Miners
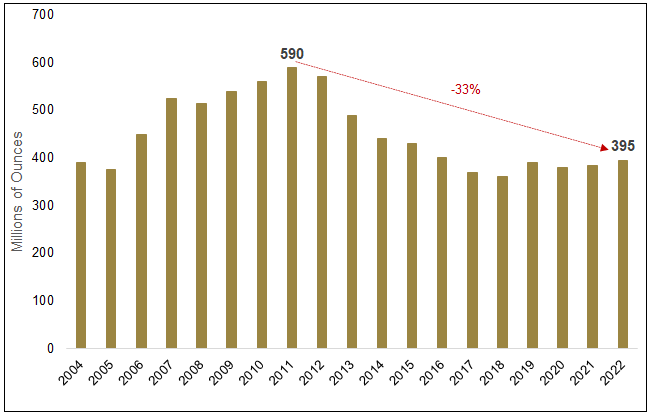
Source: Bloomberg. Data as of 12/31/2022. Included for illustrative purposes only. Past performance is no guarantee of future results.
5. Understatement of Book Value
According to anecdotal inputs from industry management, the replacement cost of existing capacity is substantially above (50% or more) stated book value. That observation suggests a consistent metal price range of $2,500 to $3,000 would be necessary to sustain the current annual mine production of 3,500 metric tonnes. The response of production to higher gold prices has been non-existent, with little rise since 2018.
Figure E. Annual Gold Mine Production Has Been Relatively Flat
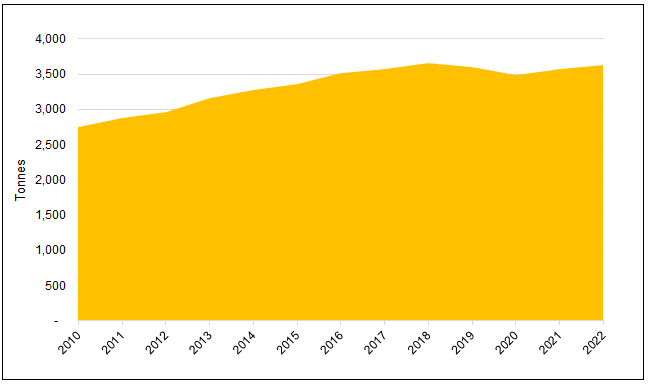
Source: World Gold Council. Data as of 12/31/2022. Included for illustrative purposes only. Past performance is no guarantee of future results.
6. Classic Contrarian Setup
Gold mining equities represent a classic contrarian setup, especially if gold prices continue their steady historic rate of increase. GDX (passive) and active managers have experienced minimal inflows in recent years. In fact, GDX has seen outflows of nearly 17% over the past five years. Peak assets under management for GDX were $18.4 billion in 2020, versus $13 billion at the end of 2023. The market cap of the entire gold mining sector is ~$300 billion, less than the market caps of individual companies like The Home Depot, Costco and Mastercard.
7. Fed Pivots Precede Outsized Performance
Every Fed pivot has been followed by outsized gains in gold mining equities. GDX gains:
- Period 5/00-1/08: 400%
- Period 1/16-8/16: 238%
- Period 3/20-7/20: 208%
The current Fed pivot, telegraphed at the December Federal Open Market Committee (FOMC) meeting, appears related to pressure from U.S. Treasury Secretary Yellen (and the Biden administration) due to election-year politics. In a December 12, 2023, interview, just ahead of the December FOMC meeting, Treasury Secretary Yellen stated, “Of course, as inflation comes down, other things equal, real interest rates tend to rise, which causes a tightening of monetary policy in a sense. So that’s one factor that could weigh in a decision that the Fed makes about the path of interest rates.”
A subtle hint, to be sure, but there is no doubt that the administration views current Fed policy as too restrictive. Could the subsequent Fed pivot amount to a premature declaration of victory over inflation? We must wait and see, but wage settlements, a major component of manufacturing costs, have been rising at an accelerating rate, as shown in Figure F.
Figure F.

Source: Bloomberg Law labor. Data as of Q1 2023. Note: Starting with Q1 2016, averages are based on each contract’s ratification date. Prior to 2016, averages are based on the date each contract was added to Bloomberg Law’s database. Included for illustrative purposes only. Past performance is no guarantee of future results.
Productivity gains notwithstanding, it is not a stretch to suggest that another Fed policy mistake may be in the cards.
8. New Geopolitical Landscape Favors Gold
The emerging geopolitical landscape favors gold and outweighs the traditional inverse relationship of gold to restrictive central bank monetary policy. Central bank buying of gold bullion increased 14% through Q3 2023 versus 2022 and easily exceeded the record level established the previous year. Importantly, official purchases are not sensitive to market prices. Such purchases are integral to a strategy recently formulated by the BRICs (Brazil, Russia, India and China) trading block to recycle trade surpluses through channels other than U.S. Treasuries, which have lost luster as safe, neutral assets. Even though the realignment of geopolitical forces that has become obvious in recent months has been gestating for several years, the actions taken to reduce U.S. dollar exposure are, in our opinion, in their infancy. In December, JPMorgan Chase estimated that 20% of oil is now traded in currencies other than the U.S. dollar. (Luke Gromen, 1/5/2024 Ten Interesting Things We Have Read Recently.)
Figure G. Gold Buying by Central Banks Has Reached All-Time High
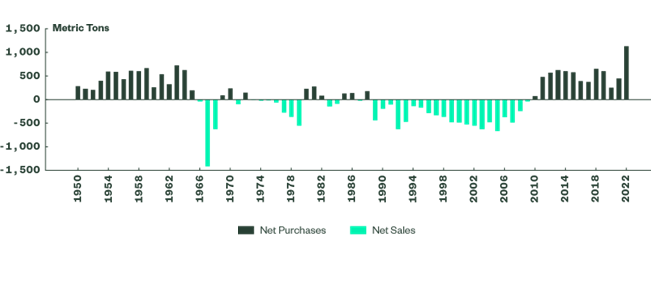
Source: State Street Global Advisors, Metals Focus, Refinitiv GFMA, World Gold Council. Data as of 12/31/2022. Included for illustrative purposes only. Past performance is no guarantee of future results.
9. Western Investment Absent from Gold Ascent to Record High
Under 1% of all global AUM is allocated to gold versus 8% at the peak in 1980. Is it not somewhat astonishing that gold is managing to trade at record highs with virtually no participation from Western investors? These same investors helped drive gold to its previous record high in 2011 of $1,921 per ounce by piling into SPDR Gold Trust ETF (GLD)3 and other fledgling gold-backed ETFs whose AUMs grew from infancy in (2004) to over 2,500 tonnes at the peak in 2012. In our view, a gold rush proportional to 2008-2011 could easily double the gold price from current levels. What might drive allocation, as reflected in Figure H, to 2% or even 3%? The 8% of 1980 might be a stretch as there was no Bitcoin, little private equity, AI or other exotic options for portfolio “diversifiers” in those ancient days. However, it doesn’t take much to imagine that these overcrowded trades (the opposite of gold) could become discredited and/or played out, somewhat similar to the dot-com bust of 2000.
Figure H. Gold’s % Share of Global Equity and Bond Securities
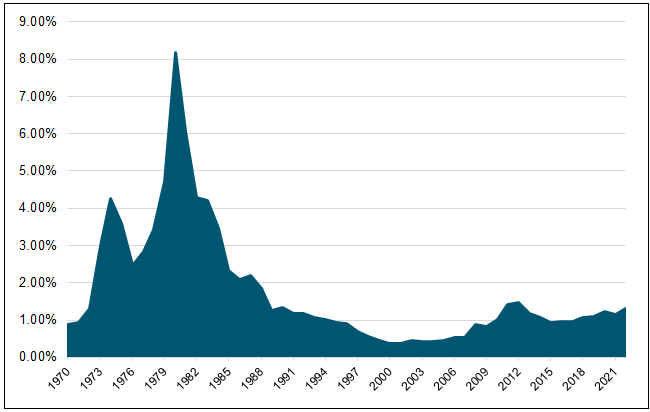
Source: BIS, ICE Benchmark Administration, Metals Focus, Refinitiv GFMS, World Bank, World Federation of Exchanges, World Gold Council. Included for illustrative purposes only. Past performance is no guarantee of future results.
10. Catalyst = Higher Gold Prices
Value trades can drag on endlessly without a spark. What is the catalyst to ignite performance in gold mining equities? The simple answer is the continuation of the rising trend of gold prices. The chart below instructs that gold has soundly outpaced the S&P 5004 over the past 25 years, excluding income, and more than kept pace with income included. The gold price is not in nosebleed territory. One must simply expect the 25-year trend to continue for gold stocks to combust spontaneously. The simple explanation for the trend is the long-term devaluation of the US dollar against physical assets.
Figure Ia. Gold vs. S&P 500 for 25 Years Ended 12/31/2023
Cumulative Returns
- Gold Bullion 617%
- S&P 500 Index 288%
- S&P 500 Total Return Index (Dividends Reinvested) 518%
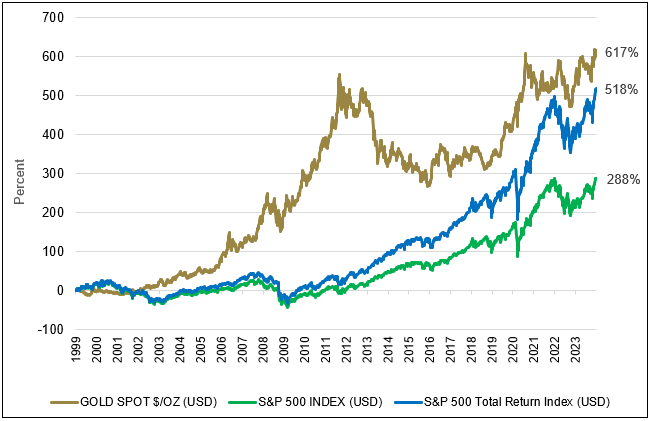
Source: Bloomberg. Data as of 12/31/2023. Included for illustrative purposes only. Past performance is no guarantee of future results.
The optically flashy $2,035 per ounce gold price of yesterday’s closing, is well below the peaks set in 2011 and 1980 on an inflation-adjusted basis.
Figure Ib. Inflation Adjusted Gold Price, Adjusted to Today’s Dollar
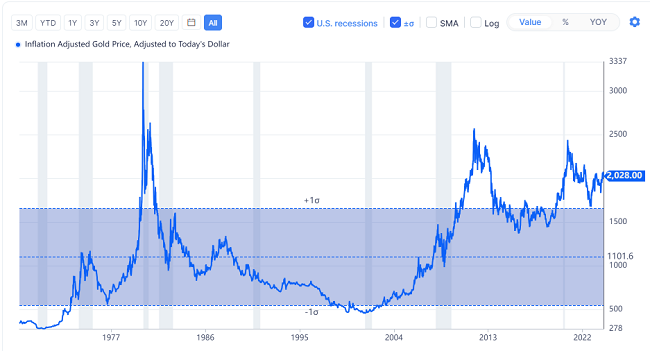
Source: GuruFocus. Data as of 12/31/2023. Included for illustrative purposes only. Past performance is no guarantee of future results.
Taking only the past decade into account, most would agree that the macroeconomic landscape for the U.S. dollar, the principal competitor for gold, is materially worse. Our view that the metal would be more properly priced in the range of $2,500-$3,000 does not seem farfetched.
Our expectation of further upside for gold and related mining stocks is corroborated by technical analysis:
Figures J.
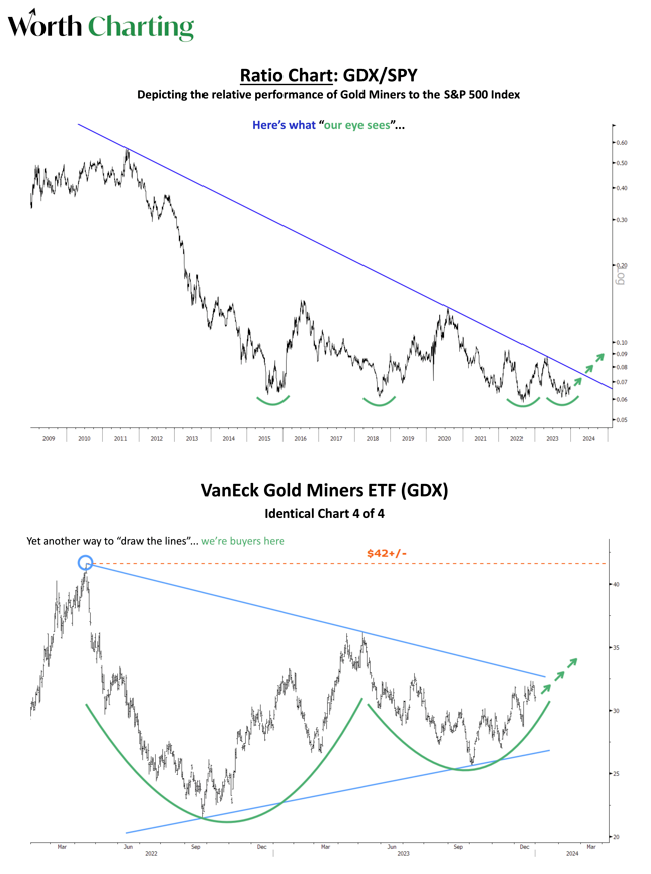
Source: Worth Charting. Data as of 12/31/2022. Included for illustrative purposes only. Past performance is no guarantee of future results.
11. M&A Activity Set to Accelerate
The present-day investment case for gold stocks echoes that for quality industrial stocks of the late 1970s. In essence: solid, cash flow generating companies that in many instances could be worth more in liquidation than as going concerns. Corporate raiders acquired investment stakes to pressure management to “surface” values for the benefit of long-suffering shareholders. We do not think this highly specialized sector will attract corporate raiders. However, we do think impatient shareholders could welcome predatory M&A (mergers and acquisitions). A perfect example is the recently announced takeover of Marathon Gold by Calibre Mining. The related information circular states that as many as 20 counterparties expressed potential interest in acquiring Marathon. We believe that many of the rejected suitors are likely to be actively considering other takeover targets. On this note, we saw yet another opportunistic acquisition of Osino Resources by Dundee Precious Metals near the end of 2023.
The Investment Case: Clear and Compelling
In our opinion, the investment case for gold mining equities is clear and compelling. It is based on considerations of value and circumstances. The unknown element is the requisite patience before investors discover the attraction. In our view, that uncertainty is easily outweighed by the asymmetric proposition of minimal downside offset by outsized upside potential.
| 1 | VanEck Vectors Gold Miners ETF (GDX) tracks the overall performance of companies involved in the gold mining industry. |
| 2 | Gold bullion is measured by the Bloomberg GOLDS Comdty Spot Price. |
| 3 | The SPDR Gold Shares ETF (GLD) tracks the price of gold bullion in the over-the-counter (OTC) market. |
| 4 | The S&P 500 or Standard & Poor’s 500 Index is a market-capitalization-weighted index of the 500 largest U.S. publicly traded companies. |
Important Disclosure
Past performance is no guarantee of future results. You cannot invest directly in an index. Investments, commentary and statements are unique and may not be reflective of investments and commentary in other strategies managed by Sprott Asset Management USA, Inc., Sprott Asset Management LP, Sprott Inc., or any other Sprott entity or affiliate. Opinions expressed in this content are those of the author and may vary widely from opinions of other Sprott affiliated Portfolio Managers or investment professionals.
This content may not be reproduced in any form, or referred to in any other publication, without acknowledgment that it was produced by Sprott Asset Management LP and a reference to sprott.com. The opinions, estimates and projections (“information”) contained within this content are solely those of Sprott Asset Management LP (“SAM LP”) or its affiliates and are subject to change without notice. SAM LP makes every effort to ensure that the information has been derived from sources believed to be reliable and accurate. However, SAM LP and affiliates assume no responsibility for any losses or damages, whether direct or indirect, which arise out of the use of this information. SAM LP and affiliates are not under any obligation to update or keep current the information contained herein. The information should not be regarded by recipients as a substitute for the exercise of their own judgment. Please contact your own personal advisor on your particular circumstances. Views expressed regarding a particular company, security, industry or market sector should not be considered an indication of trading intent of any investment funds managed by SAM LP or its affiliates. These views are not to be considered as investment advice nor should they be considered a recommendation to buy or sell.
The information contained herein does not constitute an offer or solicitation to anyone in the United States or in any other jurisdiction in which such an offer or solicitation is not authorized or to any person to whom it is unlawful to make such an offer or solicitation.
The information provided is general in nature and is provided with the understanding that it may not be relied upon as, nor considered to be, the rendering or tax, legal, accounting or professional advice. Readers should consult with their own accountants and/or lawyers for advice on the specific circumstances before taking any action.
© 2024 Sprott Inc. All rights reserved.