Gold79Mines: TSX.V: AUU
Website: https://gold79mines.com/
Email: dm@gold79mines.com
Phone: 416-294-6713


 Proven Probable
Gold79Mines: TSX.V: AUU
Website: https://gold79mines.com/
Email: dm@gold79mines.com
Phone: 416-294-6713
Ottawa, Ontario–(Newsfile Corp. – April 11, 2024) – Gold79 Mines Ltd. (TSXV: AUU) (OTCQB: AUSVF) (“Gold79” or the “Company”) is pleased to announce the initiation of a non-brokered private placement to raise gross proceeds of up to $1,000,000, comprising 4,000,000 post-consolidation (see below) units (each a “Unit”), at $0.25 per Unit (the “Offering”). Each Unit will consist of one post-consolidation common share of the Company and one-half post-consolidation common share purchase warrant, each whole warrant (a “Warrant”) will entitle the holder to purchase one common share of the Company at a price of $0.30 per share for a period of 24 months following the date of issuance. Additionally, the Warrants will be callable during the 24-month period, at the option of the Company, in the event that the 20-day volume-weighted average price of the Company’s common shares meets or exceeds $0.50 for ten consecutive trading days based on trades on the TSX Venture Exchange and Alternative Trading Systems. Subscribers will be notified of the call provision being triggered and will have a 30-day period to exercise the warrants.
Any securities issued under the Offering will be subject to a statutory hold period of four months and one day from the date of issuance. This Offering is subject to approval of the TSX Venture Exchange (“TSX-V”). The anticipated closing date of the Offering is April 30, 2024.
The Offering will be conducted by the Company utilizing the Existing Security Holder Prospectus Exemption under OSC Rule 45-501 Ontario Prospectus and Registration Exemptions and other equivalent provisions of applicable securities laws in other jurisdictions in Canada (collectively, the “Existing Security Holder Exemptions”) as well as the “accredited investor” exemption under National Instrument 45-106 Prospectus and Registration Exemptions and also other exemptions available to the Company.
The Company will make the Offering available to all shareholders of the Company as of April 10, 2024 (the “Record Date”) who are eligible to participate under the Existing Security Holder Exemptions and who have notified the Company by no later than April 24, 2023 at 5:00 pm (Eastern) of their intention to participate in the Offering. The Existing Security Holder Exemptions limit a shareholder to a maximum investment of $15,000 unless the shareholder certifies in the subscription agreement that he or she has obtained advice regarding the suitability of the investment from a registered investment dealer or otherwise qualifies to rely on another private placement exemption.
In the subscription agreement, shareholders will be required to certify the number of common shares of the Company held as of the record date and the total number of Units they wish to subscribe for. Each existing shareholder on the record date will be entitled to purchase that number of Units equal to at least their pro rata share based on the common shares owned on the record date, subject to a $4,000 minimum subscription. Any additional available Units will be allocated by the Company based on subscriptions received and Units available. Orders will be processed by the Company on a first come, first served basis such that it is possible that a subscription received from a shareholder may not be accepted by the Company if the Offering is over subscribed. Any person who becomes a shareholder of the Company after the Record Date shall not be entitled to participate in the Offering under the Existing Security Holders Exemptions.
Proceeds raised under the Offering will be used for exploration expenditures related to the Gold Chain, Arizona project; property claim costs and contractual property payments; and, for working capital and general corporate purposes.
It is anticipated that certain officers and directors of the Company will participate in the Offering. Gold79 may pay commissions to qualified finders in Canada in connection with the Offering. Any finder fees paid would be in accordance with TSX-V policies.
The offered securities will not be registered under the United States Securities Act of 1933, as amended (the “U.S. Securities Act”) and may not be offered or sold within the United States or to or for the account or benefit of U.S. persons, except in certain transactions exempt from the registration requirements of the U.S. Securities Act. This press release does not constitute an offer to sell, or the solicitation of an offer to buy, securities of the Company in the United States.
Share consolidation
Gold79 will consolidate the Company’s common shares, subject to TSX-V approval, on the basis of one post-consolidation common share for every 10 pre-consolidation common shares. The Company will not be seeking a new name or trading symbol. In accordance with the articles and bylaws of the Company, the consolidation has been approved by the board of directors of the Company, and shareholder approval is not required.
The Company will issue a future news release announcing the effective date of the consolidation and its new CUSIP and ISIN numbers.
Currently, there are 191,298,579 common shares issued and outstanding, and after the consolidation and before the closing of the Offering, there will be approximately 19,129,857 common shares issued and outstanding. No fractional shares will be issued as a result of the consolidation. Instead, any fractional share interest of 0.5 or higher arising from the consolidation will be rounded up to one whole share, and any fractional share interest of less than 0.5 will be cancelled without further compensation.
Registered shareholders of the Company will receive a letter of transmittal from the Company’s transfer agent with instructions for exchanging their pre-consolidation shares for post-consolidation shares. Shareholders who hold their shares through a broker or other intermediary will not need to complete a letter of transmittal.
About Gold79 Mines Ltd.
Gold79 Mines Ltd. is a TSX Venture listed company focused on building ounces in the Southwest USA. Gold79 holds 100% earn-in option to purchase agreements on three gold projects: the Jefferson Canyon Gold Project and the Tip Top Gold Project both located in Nevada, USA, and, the Gold Chain Project located in Arizona, USA. In addition, Gold79 holds a 32.3% interest in the Greyhound Project, Nunavut, Canada under JV by Agnico Eagle Mines Limited.
For further information regarding this press release contact:
Derek Macpherson, President & CEO
Phone: 416-294-6713
Email: dm@gold79mines.com
Website: www.gold79mines.com.
Book a 30-minute meeting with our CEO here.
Stay Connected with Us:
Twitter: @Gold79Mines
Facebook: https://www.facebook.com/Gold79Mines
LinkedIn: https://www.linkedin.com/company/gold79-mines-ltd/
FORWARD-LOOKING STATEMENTS:
This press release may contain forward-looking statements that are made as of the date hereof and are based on current expectations, forecasts and assumptions which involve risks and uncertainties associated with our business including the proposed private placement or any future private placements, the share consolidation, the uncertainty as to whether further exploration will result in the target(s) being delineated as a mineral resource, capital expenditures, operating costs, mineral resources, recovery rates, grades and prices, estimated goals, expansion and growth of the business and operations, plans and references to the Company’s future successes with its business and the economic environment in which the business operates. All such statements are made pursuant to the ‘safe harbour’ provisions of, and are intended to be forward-looking statements under, applicable Canadian securities legislation. Any statements contained herein that are statements of historical facts may be deemed to be forward-looking statements. By their nature, forward-looking statements require us to make assumptions and are subject to inherent risks and uncertainties. We caution readers of this news release not to place undue reliance on our forward-looking statements as a number of factors could cause actual results or conditions to differ materially from current expectations. Please refer to the risks set forth in the Company’s most recent annual MD&A and the Company’s continuous disclosure documents that can be found on SEDAR at www.sedar.com. Gold79 does not intend, and disclaims any obligation, except as required by law, to update or revise any forward-looking statements whether as a result of new information, future events or otherwise.
Neither the TSX Venture Exchange nor its Regulation Services Provider (as that term is defined in the policies of the TSX Venture Exchange) accepts responsibility for the adequacy or accuracy of this release.
NOT FOR RELEASE OR DISTRIBUTION IN THE UNITED STATES OR
FOR DISSEMINATION TO U.S NEWS WIRE SERVICES

To view the source version of this press release, please visit https://www.newsfilecorp.com/release/204981

CLICK TO REGISTER
Riverside Resources would like to take this opportunity to personally invite you to the Rick Rule Prospect Generator Bootcamp (https://events.ringcentral.com/events/rick-rule-2024-spring-bootcamp/registration) on Saturday, April 20th. Riverside will be presenting at this event and will have an online presence to answer all your questions and comments. To that effect, we look very forward to meeting you at this highly sought-after Rick Rule online event. On a separate note, we also would like to remind you, that Riverside always looks forward to hearing from its shareholders. Considering that, feel free to reach out to us by booking a time at the following link: https://calendly.com/mehran-rri for our Corporate Communications department to reach out to you for any discussions that you would like to have on Riverside or the sector. As always, thank you immensely for your time and ongoing support!
Best,
John-Mark Staude
Riverside Resources Inc.
ROUYN-NORANDA, Quebec, April 10, 2024 (GLOBE NEWSWIRE) — GLOBEX MINING ENTERPRISES INC. (GMX – Toronto Stock Exchange, G1MN – Frankfurt, Stuttgart, Berlin, Munich, Tradegate, Lang & Schwarz, LS Exchange, TTMzero, Düsseldorf and Quotrix Düsseldorf Stock Exchanges and GLBXF – OTCQX International in the US) reports that today Emperor Metals Inc. (“Emperor”) (CSE: AUOZ, OTCQB: EMAUF, FSE: 9NH), announced additional assay results and achievements from the 8,579 meter, 2023 drilling campaign at the Duquesne West Gold Project under option from Duparquet Assets Ltd., a 50% owned subsidiary of Globex Mining Enterprises Inc.
Emperor has reported the following in today’s press release:
“Emperor has been targeting a multi-million-ounce resource in a combination conceptual open pit and underground mining scenarios. This campaign, guided by the innovative application of Artificial Intelligence (AI) and Machine Learning, was strategically designed to achieve two major objectives:
Highlights of Emperor’s 2023 Drilling Campaign:
Upcoming Drilling Season:
Emperor is fully funded for a 5,000-meter drilling program to begin in Q2 of 2024. These results will be used to refine their A.I. models which will aid in targeting in the 2024 drill season. Emperors strategy is focused on evaluation of increasing potential ounces for a later mineral resource update. Most of Emperor’s work in 2024 will be concentrated on the open pit concept; where they see potential to add ounces cost effectively by expanding the footprint and/or adding incremental ounces to the conceptual open pit.
Emperor is also sampling near-surface core from Globex’s historical core library that was not assayed. Up to 70% of this core has not been assayed. So far, over 3,000 meters have been sampled. This is a huge benefit to shareholders, acquiring additional assays without drilling, saving capital while having no shareholder dilution.
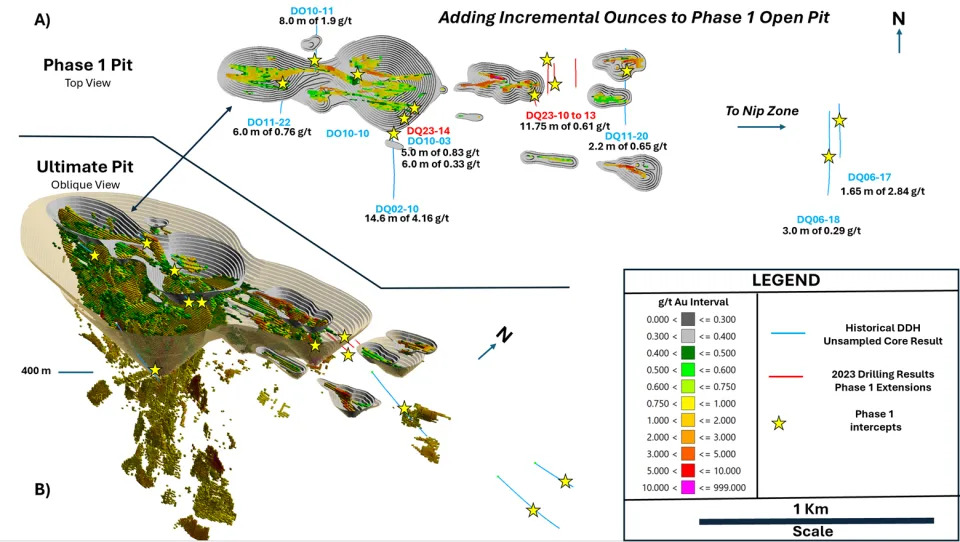
Image 1: A) Figure showing Phase 1 conceptual open pit model and location of assays in this press release. B) Figure showing Phase 1 Open Pit contained in the Ultimate Pit Conceptual Model. These intercepts increase the footprint of the deposit and add ounces to the deposit.
Summary of Drill Results:
2023 Recent Drilling Results
Full results for DQ23-10 to DQ23-14 and unsampled historical core have been released from SGS Laboratories (see Image 1 and Table 1 intercept highlights). The strategy of diamond drillholes DQ23-10 to 14 and the assaying of historic unsampled intervals was to determine if the Phase 1 pit could be extended westward to connect smaller satellite pits and add incremental ounces in the previously unsampled host rock. Affirmation of both scenarios bolstered support for growth. Both the smaller Phase 1 and Ultimate Pit Conceptual Model contain mineralization in the host rock that surrounds the high-grade zones.
Up to 70% of the core is un-assayed in Emperors conceptual open pit models. These lower grade, additional bulk tonnage ounces within the open-pit conceptual model are very significant for reducing strip ratio and improving overall economics in a combination open-pit and under-ground mining scenario.
Historic Core Sampling
Historic drill core sampling was confined to the potential Phase 1, Open Pit areas where intervals within previous obtained drill-core were not sampled (see Image 1 and Table 1). This was the best strategic option for evaluation in the inaugural drill program.
Drillholes DQ10-11 and DQ11-22 revealed the potential to add incremental ounces to the main portion of the Phase 1, pit shell with intersections of 8.0 m of 1.9 g/t Au and 6.0 m of 0.76 g/t Au this is expected to extend the footprint of mineralization and add additional lower grade incremental ounces to the high-grade zones in the Phase 1, Open Pit.
Outside the main area of the Phase 1, Open Pit, mineralization extends 1.7 km eastward to what previous workers called the Nip Zone. The combination of several factors gives significant exploration potential for expanding the pit:
The open pit concept in Image 1B shows an ultimate pit with a depth extent of 400 meters; the footprint is 1.8 km by 0.8 km. Sampling unsampled historic core in 2024 will strategically focus on the area of the conceptual open pit design. This will allow us to determine the potential economics as we progress through the phases having the necessary assay results for resource evaluation and eventually for economic evaluations.
In General, mineralization is within and proximal to a fertile, gold endowed, quartz-feldspar porphyry intrusion (QFP), which appears to enrich the greenstone belt along this structural corridor that hosts the Duquesne West Gold Deposit. Apophyses of this intrusion are more endowed and are close to the most highly replacement type mineralization. Competency contrasts between rock types within this mineralized corridor are good sites for additional mineralization.
High and low-grade mineralization are important in Open Pit Mining:
This mineralizing system is significantly large in length, width and depth. These broad zones will aid in lowering strip ratios when Emperor has enough data to support a new resource estimate for both open pit and underground conceptual mining scenarios.
Samples were sent to SGS Laboratories in Lakefield, ON.
About the Duquesne West Gold Project
The Duquesne West Gold Property is located 32 km northwest of the city of Rouyn-Noranda and 10 km east of the town of Duparquet. The property lies within the historic Duparquet gold mining camp in the southern portion of the Abitibi Greenstone Belt in the Superior Province.
Under an Option Agreement, Emperor agreed to acquire a one hundred percent (100%) interest in a mineral claim package comprising 38 claims covering approximately 1,389 ha, located in the Duparquet Township of Quebec (the “Duquesne West Property”) from Duparquet Assets Ltd., a 50% owned subsidiary of Globex Mining Enterprises Inc. For further information on the Duquesne option please see Globex’s press release dated October 12, 2022.
The Property hosts a historical inferred mineral resource estimate of 727,000 ounces of gold at a grade of 5.42 g/t Au.1,2 The mineral resource estimate predates modern CIM guidelines and a Qualified Person on behalf of Emperor has not reviewed or verified the mineral resource estimate, therefore it is considered historical in nature and is reported solely to provide an indication of the magnitude of mineralization that could be present on the property. The gold system remains open for resource identification and expansion.
Reinterpretation of the existing geological model was created using Artificial Intelligence (A.I) and Machine Learning. This model shows the opportunity for additional discovery of ounces by revealing gold trends unknown to previous workers and the potential to expand the resource along significant gold-endowed structural zones.
Multiple scenarios exist to expand additional resources which include:
1 Watts, Griffis, and McOuat Consulting Geologists and Engineers, Oct 20, 2011, Technical Report and Mineral Resource Estimate Update for the Duquesne-Ottoman Property, Quebec, Canada for XMet Inc.
2 Power-Fardy and Breede, 2011. The Mineral Resource Estimate (MRE) constructed in 2011 is considered historical in nature as it was constructed prior to the most recent Canadian Institute of Mining and Metallurgy (CIM) standards (2014) and guidelines (2019) for mineral resources. In addition, the economic factors used to demonstrate reasonable prospects of eventual economic extraction for the MRE have changed since 2011. A qualified person has not done sufficient work to consider the MRE as a current MRE. Emperor is not treating the historical MRE as a current mineral resource. The reader is cautioned not to treat it, or any part of it, as a current mineral resource.
| Table of Significant Drilling Intercepts | ||||
| Hole No. | From (m) | To (m) | Interval (m) | Au (g/t Au) |
| 1DQ23-10 | 108.75 | 109.8 | 1.05 | 1.96 |
| 109.8 | 111 | 1.2 | 0.005 | |
| 111 | 112.5 | 1.5 | 0.2 | |
| 112.5 | 115 | 2.5 | 0.59 | |
| 115 | 117.5 | 2.5 | 0.09 | |
| 117.5 | 118.5 | 1 | 0.14 | |
| 118.5 | 119.5 | 1 | 2.06 | |
| 119.5 | 120.5 | 1 | 0.85 | |
| Wt. Avg. | 11.75 | 0.61 | ||
| Including: | 2 | 1.46 | ||
| 1DQ23-11 | 38.15 | 39.35 | 1.2 | 2.18 |
| 1DQ23-11 | 217 | 218 | 1 | 1.29 |
| 218 | 219 | 1 | 0.8 | |
| 219.0 | 220.0 | 1 | 0.06 | |
| 220 | 221 | 1 | 0.36 | |
| Wt. Avg. | 4 | 0.63 | ||
| Including: | 2 | 1.05 | ||
| 1DQ23-12 | 11 | 12 | 1 | 1.04 |
| 12 | 13 | 1 | 0.1 | |
| 13 | 14 | 1 | 0.92 | |
| Wt. Avg. | 3 | 0.69 | ||
| 1DQ23-14 | 169 | 170 | 1 | 0.55 |
| 170 | 171 | 1 | 1.28 | |
| 171 | 172 | 1 | 1.18 | |
| 172 | 173 | 1 | 0.52 | |
| 173 | 174 | 1 | 0.61 | |
| Wt. Avg. | 5 | 0.83 | ||
| Including: | 2 | 1.23 | ||
| 1DQ23-14 | 308 | 309 | 1 | 0.19 |
| 309 | 310 | 1 | 0.36 | |
| 310 | 311 | 1 | 0.17 | |
| 311 | 312 | 1 | 0.28 | |
| 312 | 313 | 1 | 0.17 | |
| 313 | 314 | 1 | 0.60 | |
| 314 | 315 | 1 | 0.53 | |
| Wt. Avg. | 6 | 0.33 | ||
| 1Host Structures are interpreted to be steeply dipping and true widths are generally estimated to be 80 to 90%. | ||||
| Historical Core Results | ||||
| Hole No. | From (m) | To (m) | Interval (m) | Au (g/t Au) |
| 1,2DQ02-10 | 443.4 | 444.3 | 0.9 | 5.42 |
| 444.3 | 445 | 0.7 | 0.13 | |
| 445 | 446 | 1 | 5.55 | |
| 446 | 447 | 1 | 0.28 | |
| 447 | 448 | 1 | 19.28 | |
| 448 | 449 | 1 | 13.42 | |
| 449 | 450 | 1 | 5.9 | |
| 450 | 451 | 1 | 1.48 | |
| 451 | 452 | 1 | 5.09 | |
| 452 | 453 | 1 | 0.31 | |
| 453 | 454 | 1 | 2.65 | |
| 454 | 455 | 1 | 0.48 | |
| 455 | 455.5 | 0.5 | 0.05 | |
| 455.5 | 456.7 | 1.2 | 0.54 | |
| 456.7 | 458 | 1.3 | 0.47 | |
| Wt. Avg. | 14.6 | 4.16 | ||
| Including: | 9.6 | 5.56 | ||
| 1DQ06-17 | 226.1 | 227 | 0.9 | 4.52 |
| 227 | 227.75 | 0.75 | 0.83 | |
| Wt. Avg. | 1.65 | 2.84 | ||
| 1DQ06-18 | 265 | 266 | 1 | 0.61 |
| 266 | 267 | 1 | 0.06 | |
| 267.0 | 268.0 | 1 | 0.21 | |
| Wt. Avg. | 3 | 0.29 | ||
| 1DO-10-03 | 184 | 185 | 1 | 0.69 |
| 185 | 186 | 1 | 0.79 | |
| Wt. Avg. | 2 | 0.74 | ||
| 1DO-10-10 | 7 | 8 | 1 | 0.64 |
| 8 | 9 | 1 | 0.44 | |
| Wt. Avg. | 2 | 0.54 | ||
| 1DO-10-11 | 39 | 40 | 1 | 0.13 |
| 40 | 41 | 1 | 0.16 | |
| 41 | 42 | 1 | 0.02 | |
| 42 | 43 | 1 | 0.01 | |
| 43 | 44 | 1 | 0.10 | |
| 44 | 45 | 1 | 14.62 | |
| 45 | 46 | 1 | 0.05 | |
| 46 | 47 | 1 | 0.13 | |
| Wt. Avg. | 8 | 1.90 | ||
| Including: | 3 | 4.93 | ||
| 1DO-11-20 | 408 | 409 | 1 | 0.74 |
| 409 | 410 | 1 | 0.13 | |
| Wt. Avg. | 2 | 0.44 | ||
| 437.8 | 439 | 1.2 | 0.53 | |
| 439 | 440 | 1 | 0.79 | |
| Wt. Avg. | 2.2 | 0.65 | ||
| 1DO-11-22 | 189 | 190 | 1 | 3.07 |
| 190 | 191 | 1 | 0.72 | |
| 191 | 192 | 1 | 0.04 | |
| 192 | 192.5 | 0.5 | 0.12 | |
| 192.5 | 193 | 0.5 | 0.23 | |
| 193 | 194 | 1 | 0.05 | |
| 194 | 195 | 1 | 0.50 | |
| Wt. Avg. | 6 | 0.76 | ||
| Including: | 4 | 1.00 | ||
| Including: | 2 | 1.90 | ||
| 1DO-11-22 | 216 | 217 | 1 | 0.21 |
| 217 | 218 | 1 | 0.26 | |
| 218 | 219 | 1 | 0.28 | |
| 219 | 220 | 1 | 0.28 | |
| 220 | 221 | 1 | 0.14 | |
| 221 | 222 | 1 | 0.33 | |
| 222 | 223 | 1 | 0.50 | |
| Wt. Avg. | 7 | 0.29 | ||
| 1Host Structures are interpreted to be steeply dipping and true widths are generally estimated to be 80 to 90%. | ||||
| 2Core that has been re-assayed to confirm historical grade. | ||||
QP Disclosure
The technical content for the Duquesne West Project in Emperors news release was reviewed and approved by John Florek, M.Sc., P.Geol., a Qualified Person pursuant to CIM guidelines.”
This press release was copied with minor changes by Jack Stoch, Geo., President and CEO of Globex in his capacity as a Qualified Person (Q.P.) under NI 43-101.
| We Seek Safe Harbour. | Foreign Private Issuer 12g3 – 2(b) |
| CUSIP Number 379900 50 9 LEI 529900XYUKGG3LF9PY95 | |
| For further information, contact: | |
| Jack Stoch, P.Geo., Acc.Dir. President & CEO Globex Mining Enterprises Inc. 86, 14th Street Rouyn-Noranda, Quebec Canada J9X 2J1 | Tel.: 819.797.5242 Fax: 819.797.1470 info@globexmining.com www.globexmining.com |
Forward Looking Statements: Except for historical information, this news release may contain certain “forward looking statements”. These statements may involve a number of known and unknown risks and uncertainties and other factors that may cause the actual results, level of activity and performance to be materially different from the expectations and projections of Globex Mining Enterprises Inc. (“Globex”). No assurance can be given that any events anticipated by the forward-looking information will transpire or occur, or if any of them do so, what benefits Globex will derive therefrom. A more detailed discussion of the risks is available in the “Annual Information Form” filed by Globex on SEDAR at www.sedar.com.
55,256,836 shares issued and outstanding
An image accompanying this announcement is available at https://www.globenewswire.com/NewsRoom/AttachmentNg/b52ebeef-41d4-4f87-a72f-b52611b7be5c
Joining us for a conversation is the legendary Bob Moriarty of 321gold and 321energy. In this interview will cover the following topics: We begin our discussion by pointing out that the Dow, Bitcoin, and Gold are having all-time high’s at the same-time. We then dig deeper into what is causing the gold price to surge. Are Central Banks propping up Bitcoin as a distraction to high gold price? Are we on the brink of World War III? Is the conflict in Israel and Hamas going to extend beyond the boarders of Israel and bring in the United States and Iran? Is China going to release a financial stimulus package? Are Russia and China behind the recent spike in the gold price? What happened on March 11th in the United States that know one is talking about? What precious metals is Bob buying right now? Are Uranium and Zinc overbought? Why Resource Stocks finally out of capitulation? What companies is Bob buying right now! What is going on with the Platinum to Palladium ratio? And that is the just the first half of this fantastic interview!
Website | https://provenandprobable.com/
🥇🥈Get Your Online Gold/ Silver Here 🥇🥈
Call Me Directly at 855.505.1900 or Email: Maurice@MilesFranklin.com

Kelowna, British Columbia–(Newsfile Corp. – April 9, 2024) – Genesis AI Corp. (CSE: AIG) (OTCQB: AIGFF) (the “Company“) is pleased to announce the signing of a Letter of Intent to provide wildfire mitigation risk assessments at Cogburn Creek, BC for a proposed 300 unit development and existing recreational operation.
The first phase of analysis will commence next week, using a mix of on site acquired data from drone based LiDAR and multispectral imaging and remotely acquired satellite data from AIRBUS (GEOINT – Airbus U.S. Space & Defense, Inc. (airbusus.com)). The expected outcome of the analysis is a detailed report that outlines the risk of wildfire, the probable path the wildfire will take, and the cost to perform “FireSmart” protection techniques to build resilience against wildfire. The project involves the collection of 900 hectares (2,224 acres) of high-resolution data that will be used as an ai training model for other projects.
Since the site is adjacent to a well-known, busy forestry recreation site (Cogburn Beach) maintained by the Province of British Columbia – Ministry of Forests, the analysis will be provided to demonstrate the cost of creating a non-combustable zone, thinning and pruning of existing forest, and removal of coarse woody debris on the forest floor.
CEO Devinder Randhawa says, “we are pleased to be moving ahead with our first wildfire project, using this as a template for other communities across North America. As a long-term resident of Kelowna, I have witnessed firsthand the devastation caused by the wildfires last year and in 2003. We are working to help communities quantify the cost of resilience and giving actionable intelligence to those affected.”
Project Director Brent Tolmie says, “we will be reaching out to every high-risk community across British Columbia to start with, demonstrating our unique service that not only provides analysis of the risk, but also quantifies the cost of treating areas. Our mid term plan is to work to crowd source risk information and develop a contractor portal where we not only define cost but also help communities get this work done.”

Image 1
To view an enhanced version of this graphic, please visit:
https://images.newsfilecorp.com/files/8053/204783_genesisimg1.jpg
About Genesis AI Corp.
Genesis AI Corp. is pursuing opportunities in the precision geospatial, forestry analytics, and carbon sector through AI. Woodlands.ai is a generative AI natural resources model in development, building digital twins of real-world forests.
Digital forests can be manipulated and studied in computer generated worlds, with the influence of deep machine learning, neural networks, and artificial intelligence. Digital forest technology has many applications including carbon offsetting, forest and land management and wildfire protection.
ON BEHALF OF THE BOARD
“Dev Randhawa”
Dev Randhawa, CEO
For further information, please contact:
Jamie Bannerman – Director.
Phone: 1-250-868-6553
info@genesisaicorp.com
This press release contains “forward-looking information” within the meaning of applicable Canadian securities legislation including statements regarding the Private placement and the proposed Debt Settlement and the issuance of Common Shares which are based upon Genesis’ current internal expectations, estimates, projections, assumptions and beliefs, and views of future events. Forward-Looking information can be identified by the use of forward-looking terminology such as “expect”, “likely”, “may”, “will”, “should”, “intend”, “anticipate”, “potential”, “proposed”, “estimate” and other similar words, including negative and grammatical variations thereof, or statements that certain events or conditions “may”, “would” or “will” happen, or by discussions of strategy. Forward-Looking information includes estimates, plans, expectations, opinions, forecasts, projections, targets, guidance, or other statements that are not statements of fact. The forward-looking statements are expectations only and are subject to known and unknown, risks, uncertainties and other important factors that could cause actual results of the Company or industry results to differ materially from future results, performance or achievements. Any forward-looking information speaks only as of the date on which it is made, and, except as required by law, Genesis does not undertake any obligation to update or revise any forward-looking information, whether as a result of new information, future events, or otherwise. New factors emerge from time to time, and it is not possible for Genesis to predict all such factors.
When considering these forward-looking statements, readers should keep in mind the risk factors and other cautionary statements as set out in the materials we file with applicable Canadian securities regulatory authorities on SEDAR at www.sedarplus.ca including our Management’s Discussion and Analysis for the year ended June 30, 2022. These risk factors and other factors could cause actual events or results to differ materially from those described in any forward-looking information.
The CSE does not accept responsibility for the adequacy or accuracy of this release.

To view the source version of this press release, please visit https://www.newsfilecorp.com/release/204783
Burlington, Ontario–(Newsfile Corp. – April 8, 2024) – Silver Bullet Mines Corp. (TSXV: SBMI) (OTCQB: SBMCF) (‘SBMI’ or ‘the Company’) is pleased to announce it is entering into a strategic business agreement (the “Agreement”) with Countryman Investments Limited of British Columbia, Canada (“Countryman”). The Agreement provides that Countryman will provide financial, business development and mining opportunities to the Company. Countryman is an existing SBMI shareholder.
Mr. Dave Richardson, a principal of Countryman, has agreed to join SBMI’s advisory board. Mr. Richardson has a long history in finance and business management, and will assist SBMI in implementing its business plan and expanding its business operations.
As the first phase in the implementation of the Agreement, SBMI intends to issue a convertible debenture (the “Debenture”) in an amount up to $1,000,000.00 to willing investors (“Investors”), issuable in tranches of $1,000.00 with each tranche having 10,000 detachable warrants. Each warrant has a term of three years and is exercisable at $0.12, $0.14, and $0.16 for years 1, 2, and 3 respectively following the issuance of the Debenture. The Debenture will have a three year term and interest will run at a rate of 12% per annum, payable semi-annually in arrears during year one and quarterly in arrears during years two and three. Interest will be paid to Investors in cash or in common shares of the Company, at SBMI’s option.
Each Investor at any time can convert its portion of the Debenture, in whole or in part, into common shares of the Company. The conversion price shall be $0.08 during the first twelve months following issuance of the Debenture, $0.10 during the next twelve months of the term of the Debenture, and $0.12 during the final twelve months of the term of the Debenture (the “Conversion Price”).
SBMI can force conversion of the Debenture, in whole or in part, if SBMI’s closing price for its common shares exceeds $0.25 for a period of ten days. The Debenture can be prepaid by SBMI any time after twelve months from the issuance of the Debenture.
Countryman is a subscriber to the Debenture.
The Debenture is subject to regulatory and board approval.
The Agreement and the Debenture provide further financial stability to SBMI. They will enable the Company to complete work required by MSHA at the Buckeye Silver Mine in Arizona, to further work at the Washington Mine in Idaho this year, and to address other corporate matters.
In Arizona, the mill is MSHA approved and functioning properly. Mineralized material which had been stockpiled at the Buckeye Silver Mine is being transported to the mill and stockpiled material at the mill is being processed. The field team is carrying out the work required by MSHA at the Buckeye Silver Mine, which should take between one and three months to complete. Timber has been delivered to the Buckeye Mine Site for timbering. No new material can be extracted from the mine until the work is complete.
SBMI believes the Agreement and the Financing show that the value the Company has created is being recognized by significant stakeholders. It also gives increased depth to the company’s strategic vision for the future.
For further information, please contact:
John Carter
Silver Bullet Mines Corp., CEO
cartera@sympatico.ca
+1 (905) 302-3843
Peter M. Clausi
Silver Bullet Mines Corp., VP Capital Markets
pclausi@brantcapital.ca
+1 (416) 890-1232
Cautionary and Forward-Looking Statements
This news release contains certain statements that constitute forward-looking statements as they relate to SBMI and its subsidiaries. Forward-looking statements are not historical facts but represent management’s current expectation of future events, and can be identified by words such as “believe”, “expects”, “will”, “intends”, “plans”, “projects”, “anticipates”, “estimates”, “continues” and similar expressions. Although management believes that the expectations represented in such forward-looking statements are reasonable, there can be no assurance that they will prove to be correct.
By their nature, forward-looking statements include assumptions, and are subject to inherent risks and uncertainties that could cause actual future results, conditions, actions or events to differ materially from those in the forward-looking statements. If and when forward-looking statements are set out in this new release, SBMI will also set out the material risk factors or assumptions used to develop the forward-looking statements. Except as expressly required by applicable securities laws, SBMI assumes no obligation to update or revise any forward-looking statements. The future outcomes that relate to forward-looking statements may be influenced by many factors, including but not limited to: the impact of SARS CoV-2 or any other global virus; reliance on key personnel; the thoroughness of its QA/QA procedures; the continuity of the global supply chain for materials for SBMI to use in the production and processing of ore; shareholder and regulatory approvals; activities and attitudes of communities local to the location of the SBMI’s properties; risks of future legal proceedings; income tax matters; fires, floods and other natural phenomena; the rate of inflation; availability and terms of financing; distribution of securities; commodities pricing; currency movements, especially as between the USD and CDN; effect of market interest rates on price of securities; and, potential dilution. SARS CoV-2 and other potential global pathogens create risks that at this time are immeasurable and impossible to define.

To view the source version of this press release, please visit https://www.newsfilecorp.com/release/204669
Kelowna, British Columbia–(Newsfile Corp. – April 5, 2024) – Diamcor Mining Inc. (TSXV: DMI) (OTCQB: DMIFF) (FSE: DC3A), (“Diamcor” or the “Company”), an established diamond mining company focused on building a supply of ethically sourced, non-conflict, natural rough diamonds to select diamantaires and luxury retailers, announces today it will be presenting at the 14th Annual LD Micro Invitational at the Sofitel Hotel, New York City on Tuesday, April 9th, at 5;30 PM ET and will be available for private 1 vs 1 meetings.
Diamcor’s CEO, Mr. Dean Taylor will be providing an overview of the significant changes in the diamond industry in 2024, an update on the Company’s Krone-Endora at Venetia Project, and the Company’s strategy for growth moving forward. “The new sanctions imposed on over 30% of the world’s rough diamond supply in 2024 will have a major impact on the supply of high-end natural diamonds, and companies with the ability to adapt to these changes will be very well positioned for the long-term,” noted Diamcor’s CEO, Mr. Dean Taylor, “The future direction of the diamond industry and growing complexities of securing supplies of non-conflict natural rough diamonds for many of the Luxury Retailers allows us to now expand on our existing key relationships and position ourselves as an important source of rough diamonds to select, reputable diamantaires and luxury retailers for the long-term,” added Mr. Taylor.
Event: LD Micro Invitational XIV, Sofitel Hotel, New York
Date: Tuesday, April 9th Time: 5:30 PM ET
We invite interested parties to register to watch the presentation virtually here
About Diamcor Mining Inc.
Diamcor Mining Inc. is a fully reporting publicly traded diamond mining company with a proven history, which is focused on building a growing supply of ethically sourced, non-conflict, natural rough diamonds to some of the world’s most reputable diamantaire’s and luxury retailers. The Company has a long-term strategic alliance with world famous Tiffany & Co, and currently, its primary focus is on the development of its Krone-Endora at Venetia Project which is co-located and directly related to De Beers’ flagship Venetia Diamond Mine in South Africa. The Venetia diamond mine is long recognized as one of the world’s top diamond-producing mines, and the deposits which occur on Company’s Krone-Endora Project have been identified as being the result of shift and subsequent erosion of an estimated 50M tonnes of material from the higher grounds of Venetia to the lower surrounding areas in the direction of Krone and Endora. The Company is also focused on the acquisition and development of additional mid-tier projects with near-term production capabilities to allow the Company to position itself as a growing supplier of ethically and responsibly mined non-conflict natural rough diamonds to reputable diamantaires and select luxury retailers. The Company has a strong commitment to junior mining, social responsibility, women in mining, supporting local communities, and to protecting the environment.
About the Tiffany & Co. Alliance
The Company has an established long-term strategic alliance with Tiffany & Co. Canada, a subsidiary of world-famous New York based Tiffany & Co., to purchase up to 100% of the future production of rough diamonds from the Krone-Endora at Venetia Project at market prices. In conjunction with this first right of refusal, Tiffany & Co. Canada also provided the Company with financing in an effort to advance the Project as quickly as possible. Tiffany & Co. is now owned by Moet Hennessy Louis Vuitton SE (LVMH), a publicly traded company which is listed on the Paris Stock Exchange (Euronext) under the symbol LVMH and on the OTC under the symbol LVMHF. For additional information on Tiffany & Co., please visit their website at www.tiffany.com.
About LD Micro
LD Micro, a wholly owned subsidiary of Freedom US Markets, was founded in 2006 with the sole purpose of being an independent resource in the micro-cap space. Whether it is the Index, comprehensive data, or hosting the most significant events annually, LD’s sole mission is to serve as an invaluable asset for all those interested in finding the next generation of great companies.
For more information on LD Micro, visit www.ldmicro.com.
Please reach out to the company representative below or Dean Summers (dean@ldmicro.com) to register for the event and schedule a meeting with the company.
To learn more about Freedom US Markets, visit www.freedomusmkts.com
On behalf of the Board of Directors:
Mr. Dean H. Taylor
Diamcor Mining Inc
DeanT@Diamcor.com
+1 250 862-3212
For Investor Relations contact:
Mr. Rich Matthews
Integrous Communications
rmatthews@integcom.us
+1 (604) 355-7179
This press release contains certain forward-looking statements. While these forward-looking statements represent our best current judgement, they are subject to a variety of risks and uncertainties that are beyond the Company’s ability to control or predict and which could cause actual events or results to differ materially from those anticipated in such forward-looking statements. Further, the Company expressly disclaims any obligation to update any forward-looking statements. Accordingly, readers should not place undue reliance on forward-looking statements.
WE SEEK SAFE HARBOUR
Neither TSX Venture Exchange nor its Regulation Services Provider (as that term is defined in policies of the TSX Venture Exchange) accepts responsibility for the adequacy or accuracy of this release.
To view the source version of this press release, please visit https://www.newsfilecorp.com/release/204488
Edmonton, Alberta–(Newsfile Corp. – April 4, 2024) – Grizzly Discoveries Inc. (TSXV: GZD) (FSE: G6H) (OTCQB: GZDIF) (“Grizzly” or the “Company”) is pleased to announce all assay results for the 2023 rock and soil samples collected from the Company’s 172,000 acre Greenwood District including newly acquired and staked mineral claims in the Westbridge and Beaverdell areas, have been received. Significant and important high grade results for gold (Au), silver (Ag), copper (Cu), lead (Pb) and zinc (Zn) have been received from a number of important target areas explored during 2023 and prior to that 2022. The priority list of targets includes Midway (including the Midway Mine and the Lois area), Imperial, Crown Point, Copper Mountain (Mabel Jenny and Coronation), Sappho, Marshall Lake, Motherlode, Colby and Enterprise. A number of these targets are new through acquisition and/or staking and have not been drill tested in decades if ever, including the Midway Mine, Lois, Imperial, Crown Point, Marshall Lake, Colby and Enterprise (Figure 1).
Brian Testo, President and CEO of Grizzly Discoveries, stated, “We are excited with the new results to date from the Greenwood District area and we are planning follow-up exploration including extensive soil and rock sampling along with ground geophysical surveys to be followed by drilling. Much of the newly acquired ground has seen little exploration and evaluation since the 1980’s. We also are looking forward to pursuing a number of high grade gold – silver – copper showings and historical mines with drilling in 2024 along with additional exploration for significant battery metals in our current 170,000+ acre land holdings in the Greenwood District. We have barely scratched the surface in terms of exploration!“
The Company currently has active drilling permits for the Ket 28, Dayton and the Motherlode areas. The Company is awaiting permits for drilling +/- trenching at the Midway, Imperial, Sappho and Copper Mountain target areas. Depending upon funding, the Company is planning for an aggressive drilling campaign for 2024 in order to take advantage of the outstanding metal prices.
The focus of the 2023 program was ground work for assessment and follow up work on a number of targets that returned excellent results during prior years including 2022. In addition, work was also conducted on a number of new targets acquired by staking and/or acquisition in the area while the Company waits for drilling and trenching permits. Highlights of the 2023 work are as follows:
Highlights:
Marshall Lake

Figure 1: Land position and targets of interest for future exploration, Greenwood Project.
To view an enhanced version of this graphic, please visit:
https://images.newsfilecorp.com/files/4488/204221_14fb5b86f44cabb8_002full.jpg
Midway Mine Area

Figure 2: Initial 2023 Gold Results from Rock Sampling – Marshall Lake Area, Greenwood Project.
To view an enhanced version of this graphic, please visit:
https://images.newsfilecorp.com/files/4488/204221_14fb5b86f44cabb8_003full.jpg

Figure 3. Midway Geology and Showings with Gold in Soils and Rocks. To view an enhanced version of this graphic, please visit:
https://images.newsfilecorp.com/files/4488/204221_14fb5b86f44cabb8_004full.jpg
Copper Mountain Area

Figure 4. Copper Mountain, Colby, Imperial Showings with Gold in Soils and Rocks.
To view an enhanced version of this graphic, please visit:
https://images.newsfilecorp.com/files/4488/204221_14fb5b86f44cabb8_005full.jpg
Colby – Enterprise (Westbridge Area)
Imperial Mine Area
Plans For 2024 Exploration at Greenwood:
An extensive rock and soil sampling program along with new geological mapping during 2023 has been completed in preparation for drilling at a number of locations in the Greenwood Area in 2024. Drilling is warranted at all of the targets described above. As well, a number of targets that warrant drilling based upon prior work are described in highlight form below.
The Company currently has active drilling permits for Ket 28, Dayton and the Motherlode target areas. The Company is awaiting permits for drilling +/- trenching at the Midway, Imperial, Sappho and the Copper Mountain target areas. Depending upon funding the Company is planning for an aggressive drilling campaign for 2024 in order to take advantage of the outstanding metal prices.
Motherlode Area
Sappho Area
Dayton Area
*CuEq calculated using ratios of Au:Cu 1:7,080 and Ag:Cu 1:88.5.
Quality Assurance and Control
Rock and soil samples were analyzed at ALS Global Laboratories (Geochemistry Division) in Vancouver, Canada (an ISO/IEC 17025:2017 accredited facility). Gold was assayed using a fire assay with atomic emission spectrometry and gravimetric finish when required (+10 g/t Au). Rock grab and rock chip samples from outcrop/bedrock are selective by nature and may not be representative of the mineralization hosted on the project.
The sampling program was undertaken by Company personnel under the direction of Michael B. Dufresne, M.Sc., P.Geol., P.Geo. A secure chain of custody is maintained in transporting and storing of all samples.
The technical content of this news release and the Company’s technical disclosure has been reviewed and approved by Michael B. Dufresne, M. Sc., P. Geol., P.Geo., who is the Qualified Person as defined by National Instrument 43-101 Standards of Disclosure for Mineral Projects.
GRANT OF STOCK OPTIONS
The Board of Directors of Grizzly have authorized the issuance of an aggregate 3,000,000 stock options to Officers, Directors, and Consultants of Grizzly with an exercise price of $0.05 and expiring on April 2, 2029, or earlier in accordance with the Company’s Stock Option Plan. 2,500,000 of the options authorized for issuance will be issued to insiders of Grizzly. All of the options will vest immediately upon issuance. The grant of stock options is subject to the approval of the TSX Venture Exchange.
ABOUT GRIZZLY DISCOVERIES INC.
Grizzly is a diversified Canadian mineral exploration company with its primary listing on the TSX Venture Exchange focused on developing its approximately 72,700 ha (approximately 180,000 acres) of precious and base metals properties in southeastern British Columbia. Grizzly is run by a highly experienced junior resource sector management team, who have a track record of advancing exploration projects from early exploration stage through to feasibility stage.
On behalf of the Board,
GRIZZLY DISCOVERIES INC.
Brian Testo, CEO, President
Suite 363-9768 170 Street NW
Edmonton, Alberta T5T 5L4
For further information, please visit our website at www.grizzlydiscoveries.com or contact:
Nancy Massicotte
Corporate Development
Tel: 604-507-3377
Email: nancy@grizzlydiscoveries.com
Neither the TSX Venture Exchange nor its Regulation Services Provider (as that term is defined in the policies of the TSX Venture Exchange) accepts responsibility for the adequacy or accuracy of this release.
Caution concerning forward-looking information
This press release contains “forward-looking information” and “forward-looking statements” within the meaning of applicable securities laws. This information and statements address future activities, events, plans, developments and projections. All statements, other than statements of historical fact, constitute forward-looking statements or forward-looking information. Such forward-looking information and statements are frequently identified by words such as “may,” “will,” “should,” “anticipate,” “plan,” “expect,” “believe,” “estimate,” “intend” and similar terminology, and reflect assumptions, estimates, opinions and analysis made by management of Grizzly in light of its experience, current conditions, expectations of future developments and other factors which it believes to be reasonable and relevant. Forward-looking information and statements involve known and unknown risks and uncertainties that may cause Grizzly’s actual results, performance and achievements to differ materially from those expressed or implied by the forward-looking information and statements and accordingly, undue reliance should not be placed thereon.
Risks and uncertainties that may cause actual results to vary include but are not limited to the availability of financing; fluctuations in commodity prices; changes to and compliance with applicable laws and regulations, including environmental laws and obtaining requisite permits; political, economic and other risks; as well as other risks and uncertainties which are more fully described in our annual and quarterly Management’s Discussion and Analysis and in other filings made by us with Canadian securities regulatory authorities and available at www.sedarplus.ca. Grizzly disclaims any obligation to update or revise any forward-looking information or statements except as may be required by law.

To view the source version of this press release, please visit https://www.newsfilecorp.com/release/204221
Website: https://www.genesisaicorp.com/
Genesis AI: CSE: AIG | OTCQB: AIGFF
Genesis AI is revolutionizing natural resource management and protection through artificial intelligence.
The company is developing real-world applications using AI and machine learning to address environmental and sustainability issues in mining.
The carbon module of Genesis AI is used by auditors and verifiers to ensure investments make sense and verify the existence of forests.
By turning data into intelligence, Genesis AI aims to improve efficiency, targeting, and information use in mining operations.
The company has digitized close to three terabytes of data, equivalent to about a quarter billion pages of documentation, to provide stratified tools for exploration companies.