Liquidity Crunch, Not a Broken Thesis: Gold was sold as a source of liquidity during forced deleveraging, not because its underlying fundamentals had weakened.
Iran Shock Disrupted Reserve Flows: The conflict in Iran and the closure of the Strait of Hormuz (through which ~20% of global oil flows) halted energy revenues and stalled sovereign gold buying, removing a key pillar of demand.
A Familiar Stress Pattern: Like 2008 and 2020, gold is reacting to liquidity pressure, not failing as a hedge.
Setup for Gold’s Next Bull Phase: Structural pressures are building toward renewed monetary support—historically a powerful catalyst for gold.
Gold’s Dramatic Sell-Off
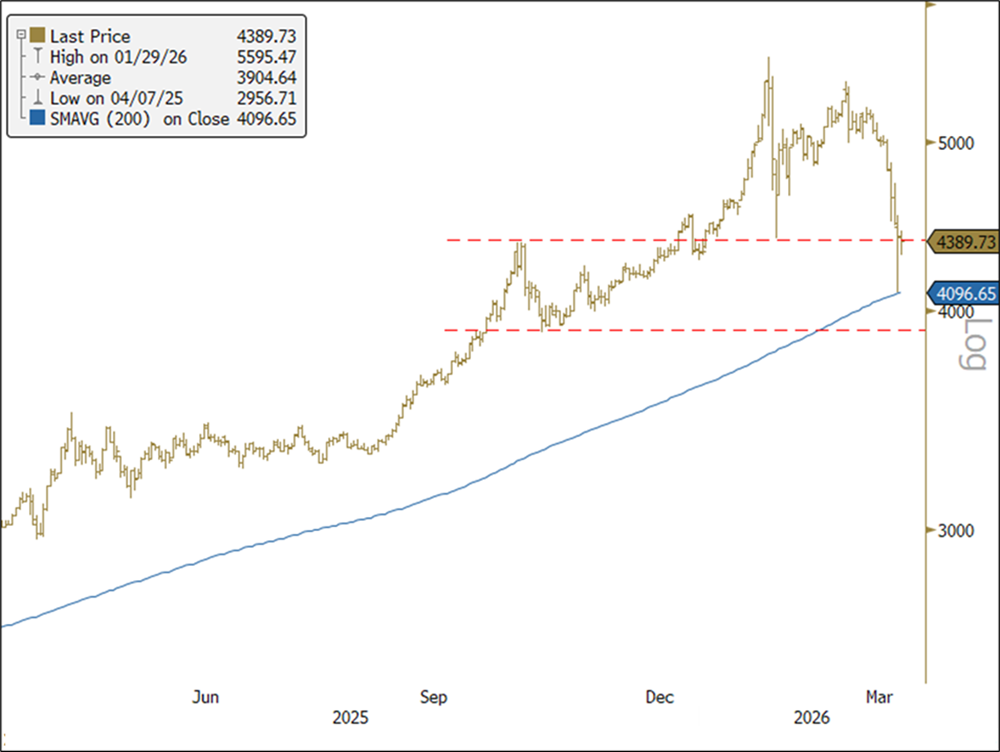
Since reaching an all-time high of $5,589.38 per ounce on January 28, 2026, gold has been a volatile ride. The major sell-off over the last three weeks in March has left gold in the $4,400 range. This dramatic pullback has surprised many investors. The decline has occurred against a backdrop that, under traditional frameworks, should have been supportive: elevated geopolitical risk, a major energy shock, rising volatility across asset classes and growing concerns about global growth. Yet gold has fallen sharply.
Gold is being sold in a liquidity-driven deleveraging.
We believe the move reflects a broad liquidity-driven selling event, driven by macro reserve-flow dynamics and forced deleveraging across investment portfolios. In short, gold is being sold because liquidity is being raised, not because its role as a strategic asset has diminished.
Figure 1. Gold Chart Highlighting Support Zone and 200-Day Moving Average
Source: Bloomberg. Data as of 3/24/2026. The spot gold price is measured by XAU Curncy. The 200‑day moving average is a technical indicator that represents the average closing price of an asset over the past 200 trading days. It is commonly used to assess an asset’s long‑term trend.
Gold Is Now Anchored to Reserve Flows
Since 2022, gold’s primary price anchor has shifted. Historically, Western investment flows dominated price action, with gold trading mostly as a function of market-related factors such as real rates, the dollar and risk sentiment. That regime has changed considerably.
The freezing of Russia’s foreign exchange reserves in 2022 fundamentally altered global reserve behavior. Excess reserves that once flowed primarily into U.S. Treasuries increasingly moved into gold. As a result, gold has become more tightly linked to reserve accumulation by central banks, sovereigns and sovereign wealth funds than to traditional portfolio flows.
This matters because reserve accumulation is inherently cyclical. It depends on trade surpluses, export revenues, and, critically in the current environment, commodity income. When those flows slow or reverse, gold demand at the margin weakens.
Hormuz Energy Shock Hit Gold Through Reserves
The closure of the Strait of Hormuz—stemming from the conflict involving Iran, the U.S. and Israel—has had a direct, underappreciated impact on gold through reserve flows.
The Hormuz oil shock hit energy markets and quietly drained the reserve flows that had been supporting gold.
Gulf Cooperation Council (GCC) countries are among the world’s largest accumulators of reserves, funded overwhelmingly by oil exports. With energy flows disrupted, reserve accumulation has stalled. In some cases, reserves are being drawn down to meet fiscal obligations. Importantly, prices are set at the margin: gold does not require outright selling to fall; the loss of incremental buying pressure is sufficient. In other words, a buyer cohort that had been buying gold at scale has abruptly stepped away. When marginal demand falls from very strong to nonexistent, prices adjust sharply even in the absence of any forced selling.
The spillover effects extend beyond the Gulf. The energy shock is primarily affecting Asia, where about 80% of Persian Gulf energy flows. Higher oil prices represent a negative terms of trade shock for energy importers, reducing surplus reserves and, in turn, incremental gold demand. Together, these reserve flow dynamics have removed a key pillar of near-term support for gold prices.
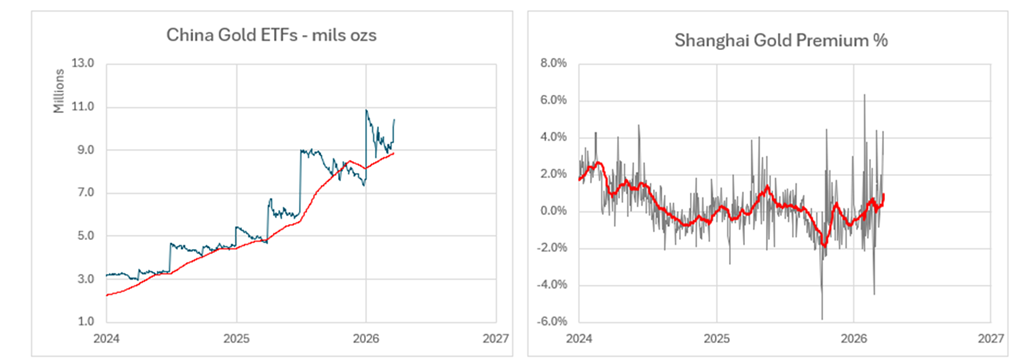
China is the world’s largest importer of oil, but is also the world’s largest gold buyer. While there is a risk that China could slow its gold purchases due to reduced surplus reserves, the evidence suggests the opposite. In Figure 2, the left chart shows China’s gold ETF holdings, which have just spiked into the gold price downturn (we use China’s gold ETF holdings as a proxy for the broader China gold trend). The right chart plots the Shanghai gold premium, which is +4.4% above the London spot quote. The 4.4% premium is about 3 standard deviations above the 10-year average, indicating an aggressive bid for gold.
Figure 2. China Has Been Buying into the Gold Sell-Off
Source: Bloomberg. Data as of March 20, 2026.
Gold’s Move Amplified by Investment Side Selling
While reserve flows explain the macro backdrop, they do not fully account for the speed and magnitude of the decline. That acceleration came from the investment side.
Gold wasn’t sold on conviction; it became a source of cash.
The dominant driver here has been degrossing and deleveraging. Rising volatility across rates, foreign exchanges (FX), equities, and commodities triggered mechanical risk reduction across hedge funds, systematic strategies, commodity trading advisors (CTAs), and leveraged portfolios. In these environments, selling is rarely gradual. Positions are cut quickly, correlations rise and liquidity is raised as the primary objective.
Gold was a very popular holding and was widely held by funds. As portfolios were forced to shrink gross and net exposure, gold was sold alongside equities, credit, and other non-energy assets, not because investors suddenly became bearish on gold, but because it was a source of liquidity.
Additional factors reinforced the move:
The rapid unwind of short USD and de-dollarization trades also contributed to selling across precious metals.
Some systematic strategies responded to rising rates and a stronger dollar by mechanically reducing gold exposure.
Capital rotated aggressively into the energy complex, drawing flows away from metals.
Options-related positioning and volatility dynamics exacerbated short-term price moves.
Taken together, these forces created a classic liquidity-driven deleveraging, the same dynamic observed in prior stress episodes.
We’ve Been Here Before
History offers clear parallels. In both 2008 and 2020, gold initially sold off sharply during periods of acute financial stress. In each case, gold was sold not because it failed as a hedge but because it was one of the last remaining sources of liquidity. Once forced selling ran its course and policy responses followed, gold rallied strongly to all-time highs within months of market lows.
Today’s environment shares key features with those episodes: rising cross-asset volatility, tightening financial conditions and growing pressure on the global monetary system. The current drawdown fits that historical pattern.
Gold’s Longer-Term Setup Is Strengthening
Paradoxically, the same forces pressuring gold in the short term are improving its long-term outlook.
The global system is moving deeper into a regime defined by energy scarcity, fiscal strain and elevated inflation risk. Debt levels are high, deficits are widening and central banks face increasingly constrained policy choices. If the energy shock persists and growth deteriorates, the probability of renewed large-scale liquidity support (QE or quantitative easing) rises materially.
At that point, the debate shifts from theoretical to actual debasement. Historically, that transition has been powerful for gold.
The forces weighing on gold today are likely to drive its next bull run.
Moreover, the structural trends that underpin gold’s secular bull market remain intact: the erosion of the dollar-centric reserve system, the fragility of the petrodollar framework, and the remonetization of gold as a neutral reserve asset. None of these dynamics has reversed; if anything, they have accelerated.
Silver’s Volatility Is Being Driven by Derivatives
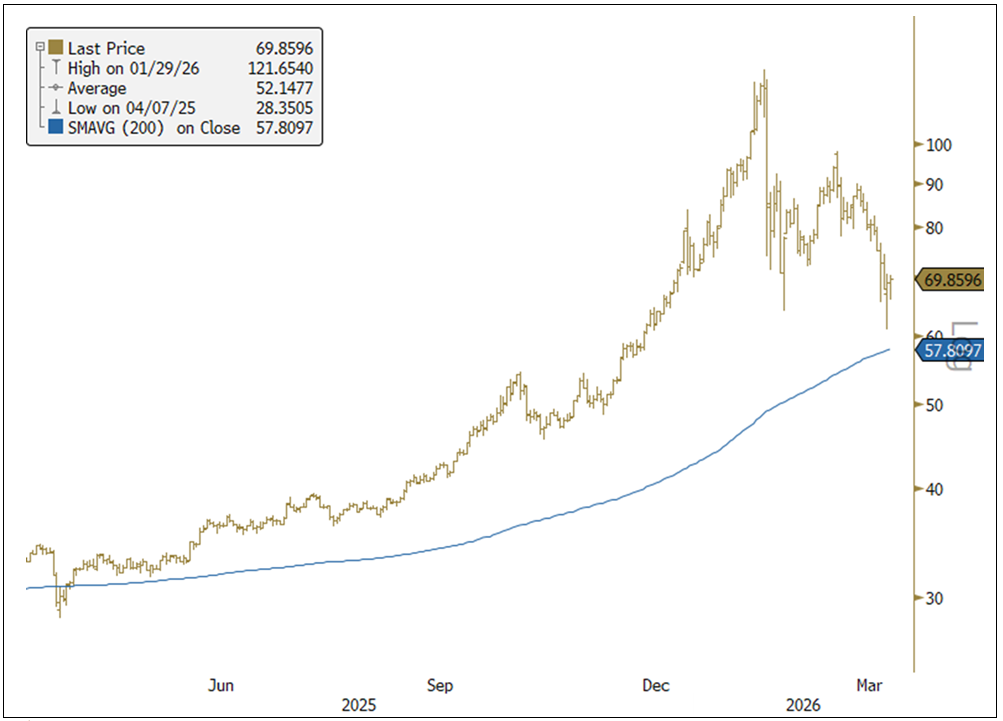
Silver, meanwhile, has behaved differently, with greater volatility. The price of silver set a record high above $121 per ounce in February 2026, and now sits at ~$65 as of this writing. While macro flows largely drove gold’s moves, silver’s price action has been heavily influenced by options positioning and market structure. In simple terms, derivatives activity, not underlying fundamentals, has been the dominant driver of short-term price movements. This has led to wider trading ranges and reduced visibility for directional investors.
Figure 3. Silver’s Volatile Trading (2025-2026)
Source: Bloomberg. Data as of 3/24/2026. The spot silver price is measured by XAU Curncy.
The Bottom Line?
Gold’s decline was triggered by liquidity-driven deleveraging, not by a change in fundamentals. Rising cross-asset volatility forced investors to raise cash and reduce exposure, prompting the sale of gold as a liquid source of capital.
A sudden halt in reserve flow demand removed a critical price-support mechanism. Central banks, sovereigns, and sovereign wealth funds, particularly in the Gulf Cooperation Council (GCC), shifted from aggressive accumulation to zero incremental buying as energy revenues stalled, mechanically pressuring prices at the margin.
The sell-off is setting up, not negating, the next bull phase. Energy scarcity, fiscal strain, and constrained central banks increase the likelihood of future liquidity support and monetary debasement, conditions that have historically preceded major gold up moves.
Investment Risks and Important Disclosure
Relative to other sectors, precious metals and natural resources investments have higher headline risk and are more sensitive to changes in economic data, political or regulatory events, and underlying commodity price fluctuations. Risks related to extraction, storage and liquidity should also be considered.
Gold and precious metals are referred to with terms of art like “store of value,” “safe haven” and “safe asset.” These terms should not be construed to guarantee any form of investment safety. While “safe” assets like gold, Treasuries, money market funds and cash generally do not carry a high risk of loss relative to other asset classes, any asset may lose value, which may involve the complete loss of invested principal.
Past performance is no guarantee of future results. You cannot invest directly in an index. Investments, commentary and opinions are unique and may not be reflective of any other Sprott entity or affiliate. Forward-looking language should not be construed as predictive. While third-party sources are believed to be reliable, Sprott makes no guarantee as to their accuracy or timeliness. This information does not constitute an offer or solicitation and may not be relied upon or considered to be the rendering of tax, legal, accounting or professional advice.
Denver, Colorado–(Newsfile Corp. – March 24, 2026) – Elemental Royalty Corporation (TSXV: ELE) (NASDAQ: ELE) (“Elemental” or the “Company“) is pleased to report results for the year ended December 31, 2025. For the year, Elemental delivered revenue of US$43.6 million, revenue plus attributable share of Caserones1 of US$49.2 million, and adjusted EBITDA1 of US$34.9 million.
2025 Financial Highlights
Record full year revenue plus attributable share of Caserones1 of US$49.2 million, up 128% over prior year, exceeding 2025 updated guidance of US$42 million;
Gold Equivalent Ounces (“GEOs”) of 14,285 for 2025 (8,987 in 2024), driven by contributions from Karlawinda, Bonikro, Korali Sud, and Caserones, and the completion of the merger with EMX Royalty Corporation;
Adjusted EBITDA1 of US$34.9 million, up 131% over prior year, demonstrating strong cash flow conversion;
Adjusted operating cash flow1 of US$33.9 million, up 288% over prior year; and
Cash and cash equivalents as of December 31, 2025 of US$53.1 million and a working capital1 of US$80.1 million, demonstrating financial flexibility for growth.
Q4 2025 Financial Highlights
Record Q4 revenue of US$16.0 million and record revenue plus attributable share of Caserones1 of US$17.2 million, up 153% on Q4 2024
Q4 attributable GEOs1 of 4,133 ounces (2,551 GEOs in Q4 2024)
US$52 million acquisition of uncapped 2% GRR on the Laverton Gold Project and an uncapped 2% GRR on Jasper Hills in Western Australia
Completion of merger with EMX Royalty Corporation
2026 Outlook and Guidance
Revenue guidance for 2026 US$76.5 to US$94.5 million based on a gold price of US$4,500/oz and a copper price of US$5.50/lb
GEO guidance for 2026 of 17,000 to 21,000 GEOs
David M. Cole, Elemental Chief Executive Officer, commented: “2025 was a landmark year for Elemental, underscored by our merger with EMX Royalty Corporation, which significantly expanded our revenue base and strengthened our platform for long-term growth. The combination creates a more broadly diversified royalty portfolio across commodities, jurisdictions, and development stages, enhancing resilience and scale, with key cash-flowing assets such as Caserones, Timok, Karlawinda, and Leeville. This broader portfolio provides greater optionality through exposure to an expanded pipeline of organic growth opportunities and future project advancements, including the Laverton Gold Project, which we expect to become a cornerstone asset. As we enter 2026, we are well positioned to benefit from the merger’s synergies and deliver continued value creation for shareholders.”
Investor Webinar
An investor webinar will be held on Wednesday March 25, 2026, starting at 11am Eastern Time, to discuss these results, followed by a question-and-answer session.
To register for the investor webcast, please click the link below:
https://app.webinar.net/XxJnNlbkAGY
A replay of the event will be available on the Elemental website following the presentation.
Financial Summary for the Three Months and Year Ended December 31, 2025:
For the three months ended December 31,
For the year ended December 31,
(In thousands of US dollars)
2025
2024
2025
2024
Statement of Income
Revenue
$
16,047
$
5,519
$
43,643
$
16,323
General and administrative expense
$
9,842
$
2,149
$
16,467
$
7,396
Royalty generation expense, net
$
1,058
$
–
$
1,058
$
–
Net income (loss) from continuing operations
$
(3,209
)
$
132
$
1,772
$
(312
)
Statement of Cash Flows
Cash flows from operating activities
$
11,203
$
2,555
$
30,811
$
4,816
Non-IFRS Financial Measures1
Revenue plus attributable share of Caserones
$
17,226
$
6,827
$
49,200
$
21,600
Adjusted cash flows from operating activities
$
11,203
$
3,315
$
33,937
$
8,738
Adjusted EBITDA
$
8,456
$
4,769
$
34,901
$
15,111
GEOs sold
4,133
2,551
14,285
8,987
Key Strategic Developments
2025 was a transformative year for Elemental, defined by strategic initiatives that strengthened the Company’s scale, diversification, and long-term growth profile. Key developments during the year included:
Completion of the merger with EMX, creating a larger, combined royalty company with a materially expanded revenue base and enhanced capital markets presence.
Secured a strategic investment from Tether Investments S.A. de C.V (“Tether”), strengthening the share register, enhancing financial flexibility, and supporting the Company’s growth initiatives.
Acquired the uncapped 2% GRR royalty over the Laverton Gold Project in Western Australia for US$52 million, which is expected to become a cornerstone asset within the portfolio given its scale, development trajectory, and long-term upside.
Benefited from continued advancement and optimization across producing assets within the portfolio, supporting stable cash flow generation and near-term growth visibility.
Announced after year end, the Company advanced its capital allocation framework and financial capacity through the introduction of an inaugural annual dividend of US$0.12 per share (paid quarterly) and the establishment of a US$150 million revolving credit facility and US$50 million accordion feature, enhancing balance sheet flexibility to support future growth initiatives while delivering sustainable returns to shareholders.
2025 Performance to Guidance:
Please see our MD&A for the year ended December 31, 2025 for more details on our guidance and see “Forward-Looking Statements” and “Future-Oriented Financial Information” below.
The following is an evaluation of the Company’s performance compared to our 2025 Guidance:
2025 GuidanceA
2025 Updated GuidanceB
2025 Results
GEO Sales
11,600 to 13,200
11,600 to 13,200
14,285
Revenue plus attributable share of Caserones1
US$31.1 to US$34.3 million
US$42.0 million
US$49.2 million
A Assumed commodity prices of US$2,600/oz gold and US$4.00/lb copper.
B Assumed commodity price of US$4,000/oz gold and US$4.00/lb copper.
Excluding revenue attributable to assets acquired through the merger with EMX, Elemental’s assets recognized 12,459 GEO Sales1, placing results in the top half of the updated guidance range. Assets acquired through the EMX merger contributed an additional 1,826 GEOs following the date of the closing of the transaction, November 13, 2025. Had the merger taken place on January 1, 2025, the Company would have generated US$72.2 million in revenue and US$87.5 million in revenue plus attributable share of Caserones1, aligning with consensus combined revenue guidance of US$85 million.
2026 Guidance
In 2026, we expect royalty revenue of 17,000 to 21,000 GEOs. 2026 guidance is based on public forecasts and disclosures by the owners and operators of our assets, historical performance, and management’s understanding of the underlying producing assets.
2026 GuidanceA
GEO Sales1
17,000 to 21,000
Revenue
US$76.5 to US$94.5 million
A Assumed commodity price of US$4,500/oz gold and US$5.50/lb copper.
The noted increase in expected GEOs compared to 2025 is mainly due to the contribution of assets acquired through the merger with EMX in Q4 2025, offset by a decrease in production at Korali Sud.
The Company has assumed a commodity price of US$4,500/oz gold and US$5.50/lb copper. The increase in gold prices has outpaced the rise in copper prices, resulting in a negative impact on GEOs due to Elemental’s exposure to copper-linked assets, specifically Caserones and Timok.
Following an amendment to the SLM California shareholder agreement effective November 13, 2025, the Company reassessed its interest in SLM California, which holds the Caserones royalty. The revised arrangement was determined to constitute a joint operation under IFRS 11, resulting in the discontinuation of equity accounting under IAS 28 and the recognition of the Company’s proportionate share of assets, liabilities, revenues, and expenses. As a result, the contribution from Caserones in 2026 will be fully categorized as revenue and will no longer require an adjustment to revenue in future periods.
Portfolio Growth
Elemental continues to advance a disciplined growth strategy focused on building a globally diversified portfolio of high-quality royalty and streaming interests, with a core emphasis on gold and precious metals. The Company’s portfolio provides exposure to a range of assets throughout the development and production pipeline, including cornerstone interests such as Karlawinda, Laverton, and Leeville. This gold-focussed approach is complemented with selective exposure to large-scale base metals assets such as Caserones and Timok, with diversification across commodities, jurisdictions, and operators supporting stable cash flow generation, while preserving meaningful upside to exploration success and mine life extensions.
Near to medium-term portfolio growth is expected to be supported by continued development, optimization, and exploration activities at several key assets. At Timok, ongoing advancement of both the Upper and Lower Zone projects provides exposure to a world-class copper-gold system with significant scale potential. In addition, recent exploration success in the broader Timok district, including the Malka Golaja discovery, highlights the prospectivity of the regional land package and reinforces the long-term optionality of Elemental’s royalty interest. While the ultimate impact of such discoveries remains subject to further delineation and development by the operator, management views these results as encouraging indicators of the district’s geological potential.
Elemental’s exposure to precious metals growth is anchored by assets such as Karlawinda, a long-life gold operation in Western Australia. Ongoing mining activities and regional exploration at Karlawinda offer the potential to support stable production and incremental upside over time. The recently acquired Laverton royalty further enhances the Company’s exposure to a highly prospective gold district in Western Australia, in addition to the acquisition of the Dugbe royalty in Liberia, both of which support the near to medium-term pipeline of exploration-driven optionality and reinforce Elemental’s strategy of acquiring royalties over large land packages in established mining camps with Tier-one operators.
In addition to its core precious metals weighting, Elemental benefits from exposure to established and operating base metal assets such as Caserones, a large-scale copper mine where continued operational optimization and exploration efforts may contribute to sustained production and potential mine life extension. These base metal assets complement the gold-focussed portfolio, providing diversification and leverage to copper demand, which is increasingly supported by structural trends related to electrification, infrastructure investment, and the global energy transition.
Elemental remains well positioned to pursue additional accretive royalty and streaming opportunities across its targeted commodities. Management continues to evaluate a robust pipeline of potential transactions, reflecting sustained interest from mining companies seeking non-dilutive sources of capital. The Company’s strong balance sheet, recently amended US$150 million revolving credit facility, with a US$50 million accordion, and scalable business model provide enhanced financial flexibility to support disciplined capital deployment. The Company also benefits from supportive long-term shareholders, including Tether, whose investment reflects confidence in Elemental’s strategy and growth outlook.
Management believes Elemental’s gold-focussed, diversified asset base, strengthened liquidity position, and aligned shareholder support provide a solid foundation for long-term value creation.
Fourth Quarter and Full Year 2025 Performance by Asset
The following table is a summary of GEOs1 sold and revenue plus attributable share of Caserones1 for the fourth quarter of 2025 and 2024:
GEOs Sold
Revenue (in thousands of US dollars)
2025
2024
2025
2024
Ballarat
179
151
$
745
$
403
Bonikro
692
900
2,886
2,407
Caserones2
879
–
3,665
–
Gediktepe
387
–
1,613
–
Karlawinda
648
556
2,699
1,490
Korali-Sud
74
–
307
–
Leeville
286
–
1,192
–
Timok
261
–
1,086
–
Wahgnion
–
284
–
764
Other producing royalties
337
172
1,403
455
Advanced royalty payments
40
–
167
–
Total royalty revenue
3,782
2,063
$
15,763
$
5,519
Option, property and other revenue
68
–
284
–
Caserones (before reclassification)2
283
488
1,179
1,308
Revenue plus attributable share of Caserones1
4,133
2,551
$
17,226
$
6,827
The following table is a summary of GEOs1 sold and revenue plus attributable share of Caserones1 for the year ended December 31, 2025 and 2024:
GEOs Sold
Revenue (in thousands of US dollars)
2025
2024
2025
2024
Ballarat
709
323
$
2,454
$
807
Bonikro
3,174
2,208
10,886
5,430
Caserones2
387
–
3,665
–
Gediktepe
387
–
1,613
–
Karlawinda
2,563
2,171
8,857
5,199
Korali-Sud
3,446
–
10,515
–
Leeville
286
–
1,192
–
Timok
261
–
1,086
–
Wahgnion
–
1,126
–
2,692
Other producing royalties
812
789
2,924
1,865
Advanced royalty payments
40
–
167
–
Total royalty revenue
12,556
6,617
$
43,359
$
15,993
Option, property and other income
68
140
284
330
Caserones (before reclassification)2
1,661
2,230
5,557
5,277
Revenue plus attributable share of Caserones
14,285
8,987
$
49,200
$
21,600
Qualified Person
Michael P. Sheehan, CPG, a Qualified Person as defined by NI 43-101 and employee of the Company, has reviewed, verified, and approved the above technical disclosure.
About Elemental Royalty Corporation.
Elemental is a new mid-tier, gold-focused streaming and royalty company with a globally diversified portfolio of 16 producing assets and more than 200 royalties, anchored by cornerstone assets and operated by world-class mining partners. Formed through the merger of Elemental Altus and EMX, the Company combines Elemental Altus’s track record of accretive royalty acquisitions with EMX’s strengths in royalty generation and disciplined growth. This complementary strategy delivers both immediate cash flow and long-term value creation, supported by a best-in-class asset base, diversified production, and sector-leading management expertise.
Elemental trades on the Nasdaq and the TSX Venture Exchange under the ticker “ELE”.
This news release contains certain “forward looking statements” and certain “forward-looking information” as defined under applicable Canadian securities laws. Forward-looking statements and information can generally be identified by the use of forward-looking terminology such as “may”, “will”, “should”, “expect”, “intend”, “estimate”, “anticipate”, “believe”, “continue”, “plans” or similar terminology.
Forward-looking statements and information include, but are not limited to, statements with respect to the Company’s annual revenue and GEO guidance for 2026, future development and upside of the Laverton royalty, and the Company’s ability to support the future growth, and provide stable and sustainable returns. Forward-looking statements and information are based on forecasts of future results, estimates of amounts not yet determinable and assumptions that, while believed by management to be reasonable, are inherently subject to significant business, economic and competitive uncertainties and contingencies.
Forward-looking statements and information are subject to various known and unknown risks and uncertainties, many of which are beyond the ability of Elemental to control or predict, that may cause Elemental’s actual results, performance or achievements to be materially different from those expressed or implied thereby, and are developed based on assumptions about such risks, uncertainties and other factors set out herein, including but not limited to: the impact of general business and economic conditions, the absence of control over the mining operations from which Elemental will receive royalties, risks related to international operations, government relations and environmental regulation, the inherent risks involved in the exploration and development of mineral properties; the uncertainties involved in interpreting exploration data; the potential for delays in exploration or development activities; the geology, grade and continuity of mineral deposits; the possibility that future exploration, development or mining results will not be consistent with Elemental’s expectations; accidents, equipment breakdowns, title matters, labour disputes or other unanticipated difficulties or interruptions in operations; fluctuating metal prices; unanticipated costs and expenses; uncertainties relating to the availability and costs of financing needed in the future; the inherent uncertainty of production and cost estimates and the potential for unexpected costs and expenses, commodity price fluctuations; currency fluctuations; regulatory restrictions, including environmental regulatory restrictions; liability, competition, loss of key employees and other related risks and uncertainties. For a discussion of important factors which could cause actual results to differ from forward-looking statements, refer to the annual information form of Elemental for the year ended December 31, 2025. Elemental undertakes no obligation to update forward-looking statements and information except as required by applicable law. Such forward-looking statements and information represents management’s best judgment based on information currently available. No forward-looking statement or information can be guaranteed, and actual future results may vary materially. Accordingly, readers are advised not to place undue reliance on forward-looking statements or information.
Neither the TSX-V, its Regulation Service Provider (as that term is defined in the policies of the TSX-V), or the Nasdaq Stock Market LLC accepts responsibility for the adequacy or accuracy of this press release.
Notes
Royalty revenue received carries no direct cash cost of sales: distributions from associates related to Elemental’s effective royalty on Caserones were received net of Chilean taxes and have no other costs.
Refer to the “Non-IFRS financial measures” section below or on page 29 of the Q4 2025 MD&A for more information on each non-IFRS financial measure. These non-IFRS measures are not standardized financial measures under the financial reporting framework used to prepare the financial statements to which the measures relates and might not be comparable to similar financial measures disclosed by other issuers.
Effective November 13, 2025, the Company discontinued accounting for SLM California as an investment in associate and began recognizing its share of revenue from the Caserones royalty directly, rather than as a share of profit from associate.
Non-IFRS Financial Measures
The Company has included performance measures which are non-IFRS and are intended to provide additional information and should not be considered in isolation or as a substitute for measures of performance prepared in accordance with IFRS Accounting Standards. The non-IFRS measures do not have any standard meaning under IFRS Accounting Standards and other companies may calculate measures differently.
Caserones Reclassification
Effective November 13, 2025, the shareholders of SLM California executed an amendment to the entity’s shareholder agreement, resulting in the Company reassessing the classification of its interest in SLM California, which holds the Company’s Caserones royalty. As a result of the amendment to the shareholder agreement, the Company determined that the revised arrangement constituted a joint operation in accordance with IFRS 11 Joint Arrangements. Consequently, on November 13, 2025, the Company discontinued equity accounting under IAS 28 Investments in Associates and Joint Ventures and began recognizing its proportionate share of the assets, liabilities, revenues, and expenses of SLM California as a joint operation.
Reconciliation of Adjusted EBITDA:
The following is the reconciliation of adjusted EBITDA:
For the three months ended December 31,
For the year ended December 31,
(In thousands of US dollars)
2025
2024
2025
2024
Net income (loss) for the year of continuing operations
$
(3,209
)
$
132
$
1,772
$
(312
)
Project evaluation and transaction related expenses
2,555
91
3,623
641
Interest Income
(387
)
(65
)
(731
)
(198
)
Interest and finance expenses
140
387
478
2,028
Tax expense plus attributable share of Caserones
2,160
631
6,008
2,746
Depletion plus attributable share of Caserones
5,132
2,775
17,791
8,750
Depreciation
23
–
23
–
Losses (gains) on revaluation of financial instruments
(789
)
14
(769
)
5
Share-based compensation
445
368
2,436
1,388
Losses (gains) on disposals
369
–
2,253
(373
)
Impairment charges
2,017
436
2,017
436
Adjusted EBITDA
$
8,456
$
4,769
$
34,901
$
15,111
The presentation of this non-IFRS measure is intended to provide additional information and should not be considered in isolation or as a substitute for measures of performance prepared in accordance with IFRS Accounting Standards. Other companies may calculate these non-IFRS measures differently.
Reconciliation of Revenue, Depletion and Tax expense plus Attributable Share of Caserones:
Revenue plus attributable share of Caserones is a non-IFRS financial measure, which is defined as including gross royalty revenue from associated entities holding royalty interests related to Elemental’s effective royalty on the Caserones copper mine. Management uses revenue plus attributable share of Caserones to evaluate the underlying operating performance of the Company for the reporting periods presented, to assist with the planning and forecasting of future operating results, and to supplement information in its financial statements. Management believes that in addition to measures prepared in accordance with IFRS Accounting Standards such as revenue, investors may use revenue plus attributable share of Caserones to evaluate the results of the underlying business, particularly as the revenue plus attributable share of Caserones may not typically be included in operating results. Management believes that revenue plus attributable share of Caserones is a useful measure of the Company performance because it adjusts for items which management believes reflect the Company’s core operating results from period to period. Revenue plus attributable share of Caserones is intended to provide additional information to investors and should not be considered in isolation or as a substitute for measures of performance prepared in accordance with IFRS Accounting Standards. It does not have any standardized meaning under IFRS Accounting Standards and may not be comparable to similar measures presented by other issuers.
Depletion plus attributable share of Caserones and tax expense plus attributable share of Caserones are non-IFRS measures which include depletion and tax expense from the Caserones royalty asset respectively, consistent with the recognition of revenue plus attributable share of Caserones as described above.
The following is the reconciliation of revenue plus attributable share of Caserones:
For the three months ended December 31,
For the year ended December 31,
(In thousands of US dollars)
2025
2024
2025
2024
Revenue
$
16,047
$
5,519
$
43,643
$
16,323
The Company’s share of royalty revenue from Caserones
$
1,179
$
1,308
$
5,557
$
5,277
Revenue plus attributable share of Caserones
$
17,226
$
6,827
$
49,200
$
21,600
The following is the reconciliation of depletion plus attributable share of Caserones:
For the three months ended December 31,
For the year ended December 31,
(In thousands of US dollars)
2025
2024
2025
2024
Depletion of royalties
$
(4,882
)
$
(2,392
)
$
(16,334
)
$
(7,218
)
Depletion of Caserones
$
(250
)
$
(383
)
$
(1,457
)
$
(1,532
)
Depletion plus attributable share of Caserones
$
(5,132
)
$
(2,775
)
$
(17,791
)
$
(8,750
)
The following is the reconciliation of tax expense plus attributable share of Caserones:
For the three months ended December 31,
For the year ended December 31,
(In thousands of US dollars)
2025
2024
2025
2024
Tax expense
$
(1,842
)
$
(304
)
$
(4,508
)
$
(1,321
)
Tax expense related to Caserones
$
(318
)
$
(327
)
$
(1,500
)
$
(1,425
)
Tax expense plus attributable share of Caserones
$
(2,160
)
$
(631
)
$
(6,008
)
$
(2,746
)
Reconciliation of Adjusted Cash Flows from Operating Activities:
Adjusted cash flows from operating activities is a non-IFRS measure which includes dividends from the Caserones royalty asset.
The following is the reconciliation of adjusted cash flows from operating activities:
For the three months ended December 31,
For the year ended December 31,
(In thousands of US dollars)
2025
2024
2025
2024
Cash provided by operating activities
$
11,203
$
2,555
$
30,811
$
4,816
Caserones royalty distributions
–
760
3,126
3,922
Adjusted cash flows from operating activities
$
11,203
$
3,315
$
33,937
$
8,738
Reconciliation of Gold Equivalent Ounces Sold
Elemental’s revenue plus attributable share of Caserones is converted to an attributable gold equivalent ounce, or GEO, basis by dividing the royalty and other revenue from associates in a period by the average gold price for the same respective period. The presentation of this non-IFRS measure is intended to provide additional information and should not be considered in isolation or as a substitute for measures of performance prepared in accordance with IFRS
Accounting Standards. Other companies may calculate these non-IFRS measures differently. The production forecast was derived using information that is available in the public domain as at the date hereof, which included guidance and estimates prepared and issued by management of the operators of the mining operations in which Elemental holds an interest. The production forecast is sensitive to the performance and operating status of the underlying mines. None of the information has been independently verified by Elemental and may be subject to uncertainty. There can be no assurance that such information is complete or accurate.
The following is the reconciliation of gold equivalent ounces sold:
For the three months ended December 31,
For the year ended December 31,
(Revenue and gold price In US dollars)
2025
2024
2025
2024
Revenue plus attributable share of Caserones (in $000s)
Denver, Colorado–(Newsfile Corp. – March 2, 2026) – Elemental Royalty Corporation (TSXV: ELE) (NASDAQ: ELE) (“Elemental” or the “Company“) is pleased to announce the signing of an amendment to the Company’s existing Revolving Credit Facility (the “Facility”), which has now been upsized to US$150 million with a US$50 million Accordion feature (the “Accordion”). National Bank Capital Markets and Canadian Imperial Bank of Commerce (“CIBC”) acted as Co-Lead Arrangers on the transaction, with National Bank Capital Markets also acting as Sole Bookrunner. National Bank of Canada (“NBC”) acted as Administrative Agent. Each of NBC, CIBC and The Bank of Nova Scotia (“Scotia”) acted as Lenders (together “the Lenders”).
Highlights
US$150 million Revolving Credit Facility with NBC, CIBC, and Scotia
US$50 million Accordion feature available, subject to certain conditions
Expanded Credit Facility solidifies Elemental’s strong foundation from which to transact on further accretive royalties and stream opportunities
The Facility matures on February 27, 2029
Stefan Wenger, Chief Financial Officer of Elemental Royalty, commented: “Upsizing our credit facility represents a strong vote of confidence from our banking partners at NBC, CIBC, and Scotia, and reflects the momentum of our business following a transformational year in 2025, which included our merger and our listing on Nasdaq. This expanded capacity enhances Elemental’s strong cash position and financial flexibility and provides additional headroom to support more material future transactions. We’re pleased to have secured the facility on attractive terms, reinforcing our disciplined approach to capital management and our focus on long-term stakeholder value.”
Terms of the Transaction The Company has entered into an agreement with NBC, CIBC, and Scotia for a US$150 million Facility, with an option to increase to a total of US$200 million through an Accordion facility of US$50 million, subject to the satisfaction of certain conditions. This is an amendment to the currently undrawn facility of US$50 million.
The Facility has a term of three years, extendable through mutual agreement between Elemental and the Lenders. Depending on the Company’s leverage ratio, the amounts drawn on the Facility are subject to interest at SOFR plus 2.25%-3.5% per annum and the undrawn portion is subject to a standby fee of 0.50%-0.78% per annum.
The Facility has been entered into by Elemental as borrower, NBC as Administrative Agent, National Bank Capital Markets as Sole Bookrunner and Co-Lead Arranger, CIBC as Co-Lead Arranger and Syndication Agent.
About Elemental Royalty Corporation. Elemental Royalty is a new mid-tier, gold-focused streaming and royalty company with a globally diversified portfolio of 18 producing assets and more than 200 royalties, anchored by cornerstone assets and operated by world-class mining partners. Formed through the merger of Elemental Altus and EMX, the Company combines Elemental Altus’s track record of accretive royalty acquisitions with EMX’s strengths in royalty generation and disciplined growth. This complementary strategy delivers both immediate cash flow and long-term value creation, supported by a best-in-class asset base, diversified production, and sector-leading management expertise.
Elemental Royalty trades on the TSX Venture Exchange and on NASDAQ under the ticker Symbol “ELE”.
Forward-Looking Statements This news release contains certain “forward looking statements” and certain “forward-looking information” as defined under applicable Canadian securities laws. Forward-looking statements and information can generally be identified by the use of forward-looking terminology such as “may”, “will”, “should”, “expect”, “intend”, “estimate”, “anticipate”, “believe”, “continue”, “plans” or similar terminology (including negative and grammatical variations thereof).
Forward-looking statements and information include, but are not limited to, statements regarding future royalties and future consideration payments or issuances of shares, or other statements that are not statements of fact. Forward-looking statements and information are based on forecasts of future results, estimates of amounts not yet determinable and assumptions that, while believed by management to be reasonable, are inherently subject to significant business, economic and competitive uncertainties and contingencies.
Financial outlook contained in this news release includes: the Company’s 2025 cash position of approximately $53 million (as the Company’s audited annual financial statements are not yet completed).
Forward-looking statements and information are subject to various known and unknown risks and uncertainties, many of which are beyond the ability of Elemental Royalty to control or predict, that may cause Element’s actual results, performance or achievements to be materially different from those expressed or implied thereby, and are developed based on assumptions about such risks, uncertainties and other factors set out herein, including but not limited to: the impact of general business and economic conditions, the absence of control over the mining operations from which Elemental will receive royalties, risks related to international operations, government relations and environmental regulation, the inherent risks involved in the exploration and development of mineral properties; the uncertainties involved in interpreting exploration data; the potential for delays in exploration or development activities; the geology, grade and continuity of mineral deposits; the possibility that future exploration, development or mining results will not be consistent with Elemental’s expectations; accidents, equipment breakdowns, title matters, labour disputes or other unanticipated difficulties or interruptions in operations; fluctuating metal prices; unanticipated costs and expenses; uncertainties relating to the availability and costs of financing needed in the future; the inherent uncertainty of production and cost estimates and the potential for unexpected costs and expenses, commodity price fluctuations; currency fluctuations; regulatory restrictions, including environmental regulatory restrictions; liability, competition, loss of key employees and other related risks and uncertainties. For a discussion of important factors which could cause actual results to differ from forward-looking statements, refer to the annual information form of Elemental for the year ended December 31, 2024. Elemental Royalty undertakes no obligation to update forward-looking statements and information except as required by applicable law. Such forward-looking statements and information represents management’s best judgment based on information currently available. No forward-looking statement or information can be guaranteed, and actual future results may vary materially. Accordingly, readers are advised not to place undue reliance on forward-looking statements or information.
Neither the TSX-V, its Regulation Service Provider (as that term is defined in the policies of the TSX-V), or the Nasdaq Stock Market LLC accepts responsibility for the adequacy or accuracy of this press release.
This press release constitutes a “designated news release” for the purposes of the Sprott Physical Copper Trust’s prospectus supplement dated July 8, 2024 to its base shelf prospectus dated July 3, 2024.
TORONTO, Feb. 17, 2026 (GLOBE NEWSWIRE) — Sprott Asset Management LP (“Sprott Asset Management”), a wholly-owned subsidiary of Sprott Inc. (“Sprott”) (NYSE/TSX: SII), on behalf of the Sprott Physical Copper Trust (TSX: COP.UN) (TSX: COP.U) (the “Trust” or “COP”), a closed-end trust created to invest and hold substantially all of its assets in physical copper metal, today announced that, in connection with the previously announced approval by the United States’ Securities and Exchange Commission (the “SEC”) of a Rule 19b-4 application filed by the NYSE Arca to list and trade COP’s trust units (the “Units”) on NYSE Arca, amendments have been made to the Trust’s trust agreement (the “Trust Agreement”).
The amendments to the Trust Agreement (i) provide that, following COP unitholder approval at a meeting of unitholders as required under applicable Canadian securities laws, COP’s current semi-annual redemption feature will become a monthly redemption feature and the current cap on the number of Units that can be redeemed each redemption period (currently capped at 1.5% of the outstanding Units at the end of the applicable notice period) will be removed, and (ii) make certain consequential changes related to the foregoing and the potential listing of the Units on the NYSE Arca. The date of the COP unitholder meeting will be announced in due course, but the Trust’s intention is to closely align the date of the unitholder meeting and the effectiveness of a registration statement to be filed under the U.S. Securities Exchange Act of 1934 in respect of the listing of the Units on the NYSE Arca (the “Registration Statement”).
The summary of the amendments in this press release is qualified in its entirety by the provisions of Amendment No. 1 to the Trust Agreement, a copy of which will be filed under the Trust’s profile on SEDAR+ at www.sedarplus.ca. Additional details regarding the COP unitholder meeting will be provided in meeting materials made available at a later date and will also be filed under the Trust’s profile on SEDAR+ at www.sedarplus.ca.
The listing of the Units on the NYSE Arca remains subject to the filing and effectiveness of the Registration Statement. The Trust cannot provide any assurance that it will be successful in achieving a listing of the Units on the NYSE Arca.
About Sprott Sprott is a global asset manager focused on precious metals and critical materials. At Sprott, we are specialists. We believe our in-depth knowledge, experience and relationships separate us from the generalists. Our investment strategies include Exchange Listed Products, Managed Equities and Private Strategies. Sprott has offices in Toronto, New York, Connecticut and California and Sprott’s common shares are listed on the New York Stock Exchange and the Toronto Stock Exchange under the symbol “SII”. For more information, please visit www.sprott.com. Sprott Asset Management is a wholly-owned subsidiary of Sprott and is the investment manager to the Trust.
About the Trust
Important information about the Trust, including the investment objectives and strategies, applicable management fees, and expenses, is contained in the current annual information form for the Trust and the Trust’s prospectus. Please read these documents carefully before investing. You will usually pay brokerage fees to your dealer if you purchase or sell units of the Trust on a stock exchange. If the units are purchased or sold on a stock exchange, investors may pay more than the current net asset value when buying units or shares of the Trust and may receive less than the current net asset value when selling them. Investment funds are not guaranteed, their values change frequently and past performance may not be repeated.
Forward-Looking Statements This press release contains “forward-looking information” and “forward-looking statements” within the meaning of applicable Canadian and U.S. securities laws (collectively, “forward-looking statements”). Forward-looking statements in this press release include, without limitation, statements regarding the listing of the Units on NYSE Arca, the filing and effectiveness of the Registration Statement, and amendments to COP’s redemption feature. With respect to the forward-looking statements contained in this press release, the Trust has made numerous assumptions regarding, among other things: subsequent U.S. listing of the Units, ability to obtain unitholder approval for amendments to COP’s redemption feature, as well as dynamics in the copper market. While the Trust considers these assumptions to be reasonable, these assumptions are inherently subject to significant business, economic, competitive, market and social uncertainties and contingencies. Additionally, there are known and unknown risk factors and uncertainties that could cause the Trust’s actual results, performance or achievements to be materially different from any future results, performance or achievements expressed or implied by the forward-looking statements contained in this press release. A discussion of certain risks and uncertainties facing the Trust appears in the Trust’s Annual Information Form for the year ended December 31, 2024, and its prospectus supplement dated July 8, 2024 and related short-form base shelf prospectus dated July 3, 2024, as updated by the Trust’s continuous disclosure filings, which are available at www.sedarplus.ca. All forward-looking statements herein are qualified in their entirety by this cautionary statement, and the Trust disclaims any obligation to revise or update any such forward-looking statements or to publicly announce the result of any revisions to any of the forward-looking statements contained herein to reflect future results, events or developments, except as required by law.
Contact: Glen Williams Senior Managing Partner Investor and Institutional Client Relations Direct: 416-943-4394 gwilliams@sprott.com
Elemental Royalty signaled on Tuesday that investors will be able to receive dividends in the form of Tether’s XAUT, establishing a novel use case for tokenized gold on Wall Street.
The move is aimed at providing investors with direct ownership of physical gold, stemming from investments in gold royalties, the Colorado-based firm said in a press release. In total, investors are expected to receive a 12 cent dividend across several quarterly payments.
The company’s investors can still receive distributions in cash, as is traditional. But Elemental CEO David Cole described the company’s support of Tether’s product as innovative.
“The decision to offer investors a dividend in kind, in the form of Tether Gold, further differentiates Elemental as a forward-thinking, growth-oriented investment,” he said.
Elemental’s stock price fell 7.8% on Tuesday to $19.41, according to Yahoo Finance. The firm makes money by acquiring royalties tied to mining projects. Elemental said its approach avoids risks associated with owning and operating a mine, while maintaining the upside.
Tether’s legacy was built on tokens pegged to the U.S. dollar, but the stablecoin issuer has embraced tokenized gold as the precious metal’s price has surged 66% over the past year. Meanwhile, XAUT’s market capitalization has swelled to $2.5 billion from $714 million.
Earlier this month, the token’s total value peaked at $3.5 billion, according to CoinGecko, as the price of gold rose to new highs.
In January, YouTube rival Rumble said that it had adopted XAUT as a medium of exchange on its platform, allowing users to tip the token to creators alongside Bitcoin and Tether’s flagship stablecoin, USDT. To bolster the token’s use in payments, Tether also introduced the term Scudo, which represents 1/1,000th of a troy ounce of gold and its XAUT token.
Those moves were focused on consumers, but Elemental shows how tokenized gold can be used as a tool in real-world corporate finance, according to Tether CEO Paolo Ardoino.
“This marks a major step forward for the gold industry and shows how tokenized assets can unlock new financial models that were previously out of reach,” he said in a press release, describing previous efforts to integrate the token on Wall Street as difficult.
Earlier this month, Ardoino estimated that the company’s gold holdings stood at 140 tons, nestled within a former nuclear bunker in Switzerland. At the time, that sum was worth an estimated $24 billion. Tether partially backs its $183 billion USDT stablecoin with gold.
At a market capitalization of $2.2 billion, Tether’s XAUT faces competition from PAX Gold. The products debuted within months of each other more than six years ago.
Despite their time in the market, Wintermute is among market makers that have only recently moved to support the token. Last week, the company said that it had begun executing over-the-counter trades in XAUT and PAX Gold on behalf of financial institutions.
The firm that handles billions of dollars in daily trading volume noted that there is robust demand for trading tokenized gold round-the-clock amid de-dollarization pressures. Along those lines, the company forecast that tokenized gold could become a $15 billion market by year-end.
February 17, 2026 – Denver, Colorado: Elemental Royalty Corporation (“Elemental” or “the Company”) (TSX-V: ELE, NASDAQ: ELE) is pleased to announce that its Board of Directors has approved an inaugural dividend policy (the “Dividend Policy”). In accordance with the Policy, Elemental expects to declare an annual cash dividend to its shareholders of US$0.12 per Elemental common share, to be paid in quarterly instalments of US$0.03 per share, with the record date for the inaugural dividend to be paid at the end of the first calendar quarter of 2026, and at the end of each calendar quarter following for subsequent dividends.
The Company is also pleased to announce that it anticipates that qualifying registered shareholders will be able to elect to receive their dividend in the form of Tether Gold XAU₮ tokens, of par value to the dividend price, thereby providing Elemental shareholders with direct ownership of physical gold through their investment in gold royalties.
Highlights
Maiden Dividend Policy approved by the Board of Directors
Expected annual cash dividend of US$0.12 per Elemental share, paid quarterly
Anticipated that qualifying registered shareholders will be able to elect that their cash dividends be invested in Tether Gold’s XAU₮ token
The Dividend to shareholders is supported by Elemental’s strong projected revenue and cash flow growth profile in 2026 and beyond
Further information on how shareholders may elect to receive the dividend or dividend in kind, will be provided in due course
David M. Cole, Chief Executive Officer of Elemental Royalty, commented: “The approval of this dividend policy marks an important milestone in Elemental’s strategic trajectory and reflects our confidence in the strength and momentum of the business; we believe this is the right time to introduce a sustainable, long-term, dividend. The decision to offer investors a dividend in kind, in the form of Tether Gold, further differentiates Elemental as a forward-thinking, growth-oriented investment.”
Stefan Wenger, Chief Financial Officer of Elemental Royalty Corporation, commented: “Our inaugural dividend is underpinned by Elemental’s strong balance sheet and future revenue outlook in the near and longer-term: as of December 31, 2025, we had approximately US$53 million of cash and no debt, providing substantial financial flexibility as we continue to invest in growth. We will continue to maintain a disciplined approach to capital allocation, balancing returning capital to shareholders through a progressive dividend which we intend to maintain, or even increase, without compromising on our strategy of accretive growth through the acquisition and generation of precious metals streams and royalties.”
Juan Sartori, Executive Chairman of Elemental Royalty Corporation, commented: “We believe the initiation of this dividend policy is a world first for a royalty company: we anticipate enabling qualifying shareholders to elect to have their cash dividend invested in the purchase of the Tether XAU₮ token, thereby facilitating for shareholders greater exposure to physical gold through Tether Gold’s stablecoin and retaining real long-term value storage via a practical mechanism for gold-denominated investment returns.”
CALGARY, AB, Jan. 6, 2026 /CNW/ – ACT Energy Technologies Ltd. (TSX: ACX) (“ACT“, the “Company“) is pleased to announce that on January 5, 2026 (the “Closing Date“) it acquired all the assets of Stryker Energy Directional Services, LLC (“Stryker“) for total consideration of USD$24.2 million (approximately CAD$34 million) (the “Transaction“). The purchase price consisted of USD$12.5 million in cash, a USD$6.7 million promissory note, and USD$5.0 million in ACT common shares.
Stryker, founded in 2010 and based in Conroe, Texas, is a well-established directional drilling services provider with a highly experienced management team and a strong operating history across the Southern United States. In 2025, Stryker averaged approximately 17 active jobs per operating day, including work utilizing RSS technology. Stryker’s existing management team will lead the business, ensuring continued strong customer service and long-term alignment with ACT shareholders.
“Stryker has built a strong brand and a proven reputation for delivering high-performance directional drilling services to customers across the Southern U.S.,” said Tom Connors, President and CEO of ACT. “We are excited to welcome Stryker’s management team and employees to ACT. Their expertise and operational track record will strengthen our U.S. platform and enhance our ability to serve customers with high-value drilling technologies. The acquisition of Stryker, which relies on rented third-party mud motors for approximately one half of its active jobs, presents a meaningful opportunity for ACT to supply motors from our existing inventory, immediately reducing rental expenses and expanding margins. Their RSS fleet and deep experience in deploying and servicing MWD tools further complement our technology-focused strategy. We expect the cash flow generated by Stryker to pay back in less than two and a half years, with additional upside as synergies are realized.”
TRANSACTION HIGHLIGHTS
Expands ACT’s scale and presence in key U.S. basins: Stryker’s strong position in the Southern U.S. enhances ACT’s existing operations and increases U.S. job count in the southern U.S.
Strengthens ACT’s technology portfolio: Stryker’s fleet of 10 RSS tools adds to ACT’s U.S. RSS fleet of 30 tools. RSS technology represents the highest-value segment of the directional drilling market, generating superior revenue and margins.
Significant synergy potential: ACT expects more than CAD$5.0 million in annual synergies, primarily from replacing Stryker’s rented mud motors with ACT-owned assets.
Balanced and strategic funding structure: The combination of cash, debt, and equity supports management retention and preserves ACT’s financial flexibility.
Accretive financial impact: Including expected synergies and minimal follow-on capital requirements, ACT anticipates a payback period in less than two and a half years. The Transaction is expected to be accretive to net income, Adjusted EBITDAS, and Free Cash Flow (see Non-GAAP and Supplementary Financial Measures).
KEY TERMS OF THE TRANSACTION Under the definitive agreements between ACT and Stryker, ACT paid the following consideration:
USD$12.5 million in cash;
USD$5.0 million in equity, via the issuance of 1,299,394 common shares of ACT (the “Acquisition Shares“); and
A USD$6.7 million promissory note issued by a wholly-owned subsidiary of ACT to Stryker, structured as a three-year, 6% subordinated note, with USD$2.5 million repayable on the 12 and 24 month anniversaries of the Closing Date, and the balance of USD$1.7 million repayable on the 36 month anniversary of the Closing Date.
The Acquisition Shares were issued at a deemed price of $5.29 per Acquisition Share for a value of approximately USD$5.0 million. The Acquisition Shares are subject to a four-month statutory hold period under applicable Canadian securities laws, in addition to such other restrictions as may apply under applicable securities laws of jurisdictions outside of Canada. Additionally, the Acquisition Shares are subject to contractual resale restrictions, with 30% of the Acquisition Shares released on the dates that are 12 and 24 months following the Closing Date, and 40% on the date that 36 months following the Closing Date.
In connection with the Transaction, the Company also issued 727,660 common shares of the Company (the “Stryker Shares“) to Stryker at a price of $5.29 per Share, for aggregate gross proceeds of $3.85 million (USD$2.8 million) as a concurrent private placement. The Stryker Shares are subject to a four-month statutory hold period under applicable Canadian securities laws, in addition to such other restrictions as may apply under applicable securities laws of jurisdictions outside of Canada. Additionally, the Stryker Shares are subject to contractual resale restrictions, with 25% of the Stryker Shares released on each of the dates that are 12, 24, 36 and 48 months following the Closing Date (see Non-GAAP Measures and Supplementary Financial Information below, for foreign exchange conversion assumptions).
SELECT FINANCIAL INFORMATION (CAD)
Pre-Acquisition (1)
Post-Acquisition (1)
Common Shares Outstanding (Basic)
$33.14 million
$35.17 million
Cash
$34 million
$20 million
Loans and borrowings
$62 million
$62 million
Exchangeable promissory notes
$27.4 million
$27.4 million
Promissory note
$nil
$9.2 million
(1)
Estimated pre- and post-closing amounts as at immediately before and after the Closing Date.
ADVISORS Peters & Co. Limited acted as financial advisor to ACT. DS Lawyers Canada LLP served as Canadian legal counsel, and Porter Hedges LLP acted as U.S. legal counsel to ACT and its subsidiaries.
LEGAL This news release does not constitute an offer to sell or a solicitation of an offer to buy securities in the United States. The securities referenced herein have not been and will not be registered under the U.S. Securities Act of 1933, as amended (the “U.S. Securities Act“), or any state securities laws, and may not be offered or sold within the United States or to U.S. Persons (as such term is defined in Regulation S under the U.S. Securities Act) unless registered under the U.S. Securities Act and applicable state securities laws or an exemption from such registration is available. This news release shall not constitute an offer to sell or the solicitation of an offer to buy, nor shall there be any sale of these securities, in any jurisdiction in which such offer, solicitation or sale would be unlawful.
NON-GAAP MEASURES AND SUPPLEMENTARY FINANCIAL INFORMATION ACT uses certain performance measures throughout this news release that are not defined under IFRS Accounting Standards or Generally Accepted Accounting Principles (“GAAP“). These non-GAAP measures do not have a standardized meaning and may differ from that of other organizations, and accordingly, may not be comparable. Investors should be cautioned that these measures should not be construed as alternatives to IFRS Accounting Standards measures as an indicator of ACT’s performance.
These measures include Adjusted EBITDAS and Free Cash Flow. Management believes these measures provide supplemental financial information that is useful in the evaluation of ACT’s operations.
These non-GAAP and supplemental financial measures are defined as follows:
“Adjusted EBITDAS” is calculated as net income before finance costs, unrealized foreign exchange on intercompany balances, income tax expense, depreciation, amortization, non-recurring costs (including acquisition and restructuring costs), write-down of inventory and share-based compensation; and is considered an indicator of the Company’s ability to generate funds flow from operations prior to consideration of how activities are financed, how the results are taxed and non-cash expenses. Further information regarding how ACT calculates and uses Adjusted EBITDAS is contained in ACT’s Q3 2025 Management Discussion & Analysis under the heading “Non-GAAP Measurements” and is available on SEDAR+ under ACT’s profile at www.sedarplus.com.
“Free Cash Flow” is calculated as cash flow from operating activities prior to: i) changes in non-cash working capital, ii) and income tax (refund) payment less: i) cash flow from investing activities (updated from property, plant and equipment (“PP&E”) and intangible asset additions, excluding assets acquired in business combinations), ii) required repayments on loans and borrowings, in accordance with the Company’s credit facility agreement, and iii) repayments of lease liabilities, net of finance costs, offset by proceeds on disposal of PP&E. Free Cash Flow is a useful supplemental measure of the Company’s ability to generate funds from operations available for future capital expenditures, discretionary debt repayments, or other strategic initiatives.
Exchange rates calculated based on an exchange rate of 1.37437 Canadian dollars per 1.00 US dollar. All figures shown in press release are given in Canadian dollars (CAD) except where noted as US dollars (USD).
ABOUT ACT ENERGY TECHNOLOGIES ACT Energy Technologies Ltd., headquartered in Calgary, Alberta, operates in Canada and the United States under the brands Altitude Energy Partners, Discovery Downhole Services, and Rime Downhole Technologies. ACT’s common shares trade on the Toronto Stock Exchange under the symbol “ACX”. ACT provides high-performance directional drilling services and downhole technologies to North American energy companies, delivering tailored solutions that improve drilling efficiency and reduce project costs. For more information, visit www.actenergy.com.
FORWARD-LOOKING INFORMATION This news release contains statements and information that may constitute “forward-looking information” within the meaning of applicable securities legislation, including statements identified by the use of words such as “will”, “expects”, “positions”, “believe”, “potential” and similar words, including negatives thereof, or other similar expressions concerning matters that are not historical facts. Forward-looking information in this news release includes, but is not limited to, statements regarding: expected operational synergies; successful integration of Stryker’s assets, business and personnel; anticipated impacts on ACT’s U.S. job counts and technology offerings to customers; anticipated financial impacts; pay back; preliminary pre and post-acquisition cash, share and debt balances and ACT’s strategic plans.
Such forward-looking information is based on various assumptions that may prove to be incorrect, including, but not limited to, assumptions with respect to: the benefits from the Transaction; the integration of the Stryker business into the Company’s business; assumptions regarding usage of Stryker’s assets in the North American land drilling markets; conditions in the oil and gas markets and debt and equity markets generally; the ability of the Company to successfully implement its strategic plans and initiatives and whether such strategic plans and initiatives will yield the expected benefits. Although the Company believes that such assumptions are reasonable, the Company can give no assurance that such forward-looking statements will prove to be correct or that any of the events anticipated by such forward-looking statements will occur, or if any of them do so, what benefits the Company will derive therefrom.
Actual results could differ materially due to a number of factors and risks including, but not limited to: the risk that ACT will not be able to integrate the Stryker business as anticipated or at all; the risk that the Stryker business will not yield operational or financial benefits as anticipated or at all; the risk that demand for ACT’s services will not be as anticipated; conditions in the oil and gas and financial markets in Canada and the United States; the risk that the Company will not be able to identify and/or close on additional accretive opportunities in Canada and/or the U.S.; the ability of management to execute and fund its business strategy; and the impact of general economic conditions in Canada and the United States.
Additional information regarding risks and uncertainties of the Company’s business are contained under the heading “Risk Factors” in the Company’s annual information form for the financial year ended December 31, 2024 and the Company’s other public filings which are available under the Company’s profile on SEDAR+ at www.sedarplus.ca. The forward-looking information included in this news release is made as of the date of this news release and the Company does not undertake an obligation to publicly update such forward-looking information to reflect new information, future events or otherwise, except as required by applicable law.
This news release also contains financial outlook information (“FOFI“) about prospective results of operations, which are subject to the same assumptions, risk factors, limitations, and qualifications as set forth in the above paragraphs. FOFI contained in this news release was made as of the date of this news release to provide information about management’s current expectations and plans relating to the future. Readers are cautioned that such information may not be appropriate for any other purpose. ACT disclaims any intention or obligation to update or revise any FOFI contained in this news release, whether as a result of new information, future events or otherwise, except as required by applicable law.
Requests for further information should be directed to:
Tom Connors, President & Chief Executive Officer Rob Skilnick, Chief Financial Officer ACT Energy Technologies Ltd. 6030 3 Street S.E. Calgary, Alberta T2H 1K2 Telephone: 403.265.2560, Fax: 403.262.4682 www.actenergy.com
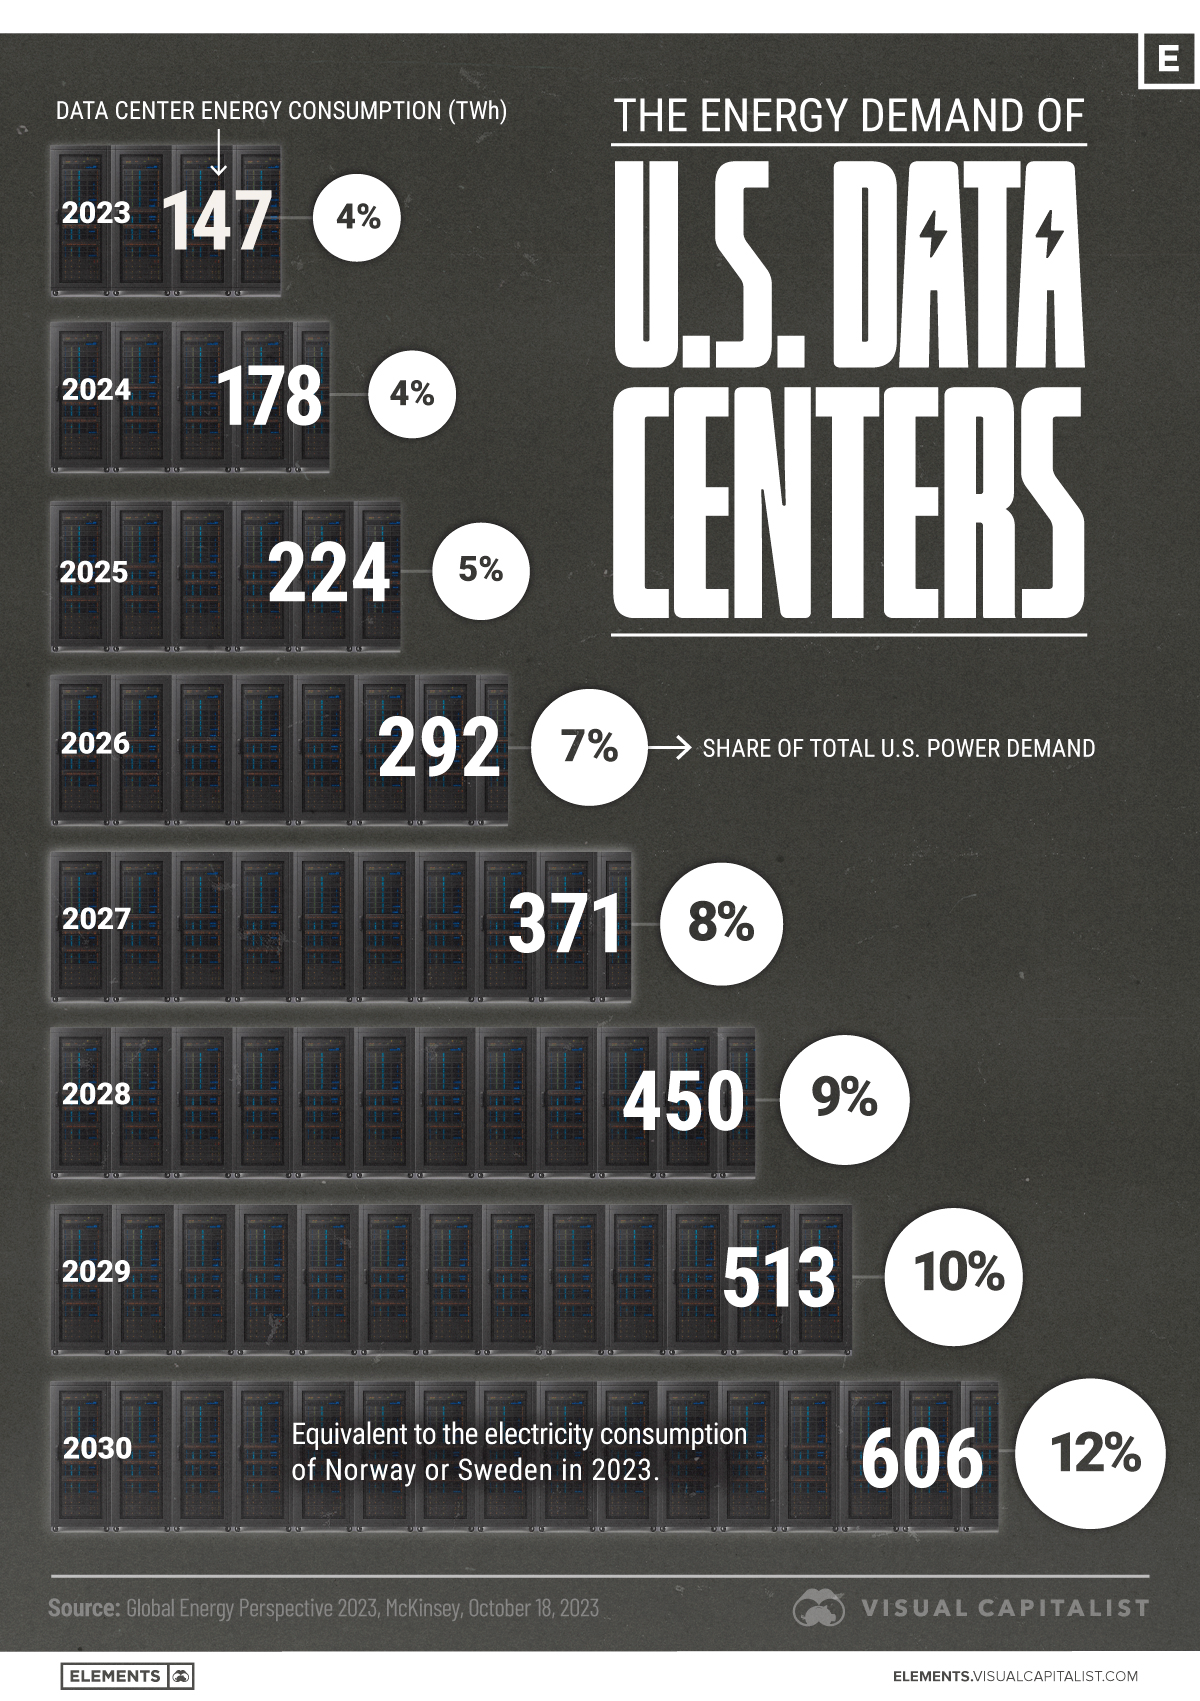
This was originally posted on our Voronoi app. Download the app for free on iOS or Android and discover incredible data-driven charts from a variety of trusted sources.
As the digital economy accelerates and generative AI becomes more deeply embedded in business and daily life, the physical infrastructure supporting these technologies is undergoing a transformative explosion.
In this graphic, we use data from McKinsey to show current and projected energy demand from data centers in the United States. Data is from October 2023.
U.S. Data Centers Could Quadruple Power Demand by 2030
Today, data centers account for roughly 4% of total U.S. electricity consumption. But by 2030, that share is projected to rise to 12%, driven by unprecedented growth in computing power, storage needs, and AI model training.
In fact, U.S. data center energy demand is set to jump from 224 terawatt-hours in 2025 to 606 terawatt-hours in 2030.
Year
Consumption (TWh)
% of Total Power Demand
2023
147
4%
2024
178
4%
2025
224
5%
2026
292
7%
2027
371
8%
2028
450
9%
2029
513
10%
2030
606
12%
Meeting this projected demand could require $500 billion in new data center infrastructure, along with a vast expansion of electricity generation, grid capacity, and water-cooling systems. Generative AI alone could require 50–60 GW of additional infrastructure.
This massive investment would also depend on upgrades in permitting, land use, and supply chain logistics. For example, the lead time to power new data centers in large markets such as Northern Virginia can exceed three years. In some cases, lead times for electrical equipment are two years or more.
A Strain on the U.S. Grid
The U.S. has experienced relatively flat power demand since 2007. Models suggest that this stability could be disrupted in the coming years. Data center growth alone could account for 30–40% of all net-new electricity demand through 2030.
Unlike typical power loads, data center demand is constant, dense, and growing exponentially. Facilities often operate 24/7, with little downtime and minimal flexibility to reduce usage.
Don’t Miss “A Generational Opportunity” at the New Orleans Investment Conference 2025! 🚀
This is your chance to gain unparalleled insights and strategic knowledge from leading figures in the financial and natural resource sectors. The New Orleans Investment Conference, November 2-5, 2025, is truly The World’s Greatest Investment Event.
We’re excited to invite you to join us and learn from the best in the business. This conference is crucial for anyone looking to navigate today’s complex markets and identify future growth opportunities.