VANCOUVER, BC / ACCESSWIRE / February 27, 2023 / Stillwater Critical Minerals (TSX.V:PGE)(OTCQB:PGEZF)(FSE:5D32) (the “Company” or “SWCM”) is pleased to announce it will be participating in the inaugural Yukon Mining Alliance (“YMA”) Invest Yukon Core Shack to be held in the main Investors Exchange exhibit hall at the Prospectors and Developers Annual Convention (“PDAC”) in Toronto. The Invest Yukon Core Shack will be located at Booth #3314, adjacent to the main PDAC Core Shack and the Company will be displaying samples from its Kluane Ni-PGE project in Yukon as well as its flagship Stillwater West Ni-PGE-Cu-Co+Au project in Montana, on March 5-6th. The Company will also have a presence in the main Investors Exchange and investors are invited to visit booth # IE3024 to meet the team in person.
Invest Canada North Reception
The Metallic Group of Companies is proud to be a sponsor of the 2023 Invest Canada North reception to be held March 6 in MTCC North Room 106 from 4pm – 7pm EST. Leaders from its members, Stillwater Critical Minerals, Granite Creek Copper and Metallic Minerals will be in attendance and the Group will have a display table where guests are invited to meet the team. For more information, visit here.
About Yukon Mining Alliance
Yukon Mining Alliance – the globally recognized Invest Yukon brand – is a strategic alliance of Yukon’s leaders in exploration and mining who, in partnership with the Government of Yukon, connect investors with Yukon’s competitive advantages through innovative capital attraction initiatives. For more information visit InvestYukon.ca.
Invest Canada North connects global investors with the competitive advantages and opportunities in Canada’s North, Yukon, Northwest Territories and Nunavut, at one of the world’s biggest annual mining conferences, the PDAC Convention. Our unique initiatives showcase each region, through keynote presentations, panels and special sessions, highlighting the leaders in exploration, development and production, as well as the mining ecosystem that is supported by significant geological potential, strong geopolitical stability and progressive Indigenous and community partnerships. Through our Invest Canada North mining portal catch up on the latest news in the north or dive into each region to discover your next great opportunity. To learn more visit https://investcanadanorth.ca.
About Stillwater Critical Minerals Corp.
Stillwater Critical Minerals (TSX.V: PGE | OTCQB: PGEZF) is a mineral exploration company focused on its flagship Stillwater West Ni-PGE-Cu-Co + Au project in the iconic and famously productive Stillwater mining district in Montana, USA. With the recent addition of two renowned Bushveld and Platreef geologists to the team, the Company is well positioned to advance the next phase of large-scale critical mineral supply from this world-class American district, building on past production of nickel, copper, and chromium, and the on-going production of platinum group and other metals by neighboring Sibanye-Stillwater. Per an expanded NI 43-101 mineral resource estimate released January 2023, the Platreef-style nickel and copper sulphide deposits at Stillwater West contain 1.6 billion pounds of nickel, copper and cobalt, and 3.8 million ounces of palladium, platinum, rhodium, and gold1, in a compelling suite of critical minerals and are open for expansion along trend and at depth.
Stillwater Critical Minerals also holds the high-grade Black Lake-Drayton Gold project adjacent to Treasury Metals’ development-stage Goliath Gold Complex in northwest Ontario, currently under an earn-in agreement with Heritage Mining, and the Kluane PGE-Ni-Cu-Co critical minerals project on trend with Nickel Creek Platinum‘s Wellgreen deposit in Canada‘s Yukon Territory.
1See news release dated January 25, 2023. In-pit Mineral Resources are reported at a base case cut-off grade of 0.20% NiEq. Pit optimization and Cut-off grades are based on metal prices of $9.00/lb Ni, $3.75/lb Cu, $24.00/lb Co, $1,000/oz Pt, $2,000/oz Pd and $1,800/oz Au, assumed metal recoveries of 80% for Ni, 85% for copper, 80% for Co, Pt, Pd and Au, a mining cost of US$2.50/t rock and processing and G&A cost of US$18.00/t mineralized material. Mineral resources which are not mineral reserves do not have demonstrated economic viability. An Inferred Mineral Resource has a lower level of confidence than that applying to an Indicated Mineral Resource and must not be converted to a Mineral Reserve. It is reasonably expected that the majority of Inferred Mineral Resources could be upgraded to Indicated Mineral Resources with continued exploration.
Neither the TSX Venture Exchange nor its Regulation Services Provider (as that term is defined in the policies of the TSX Venture Exchange) accepts responsibility for the adequacy or accuracy of this release.
VANCOUVER, BC / ACCESSWIRE / February 23, 2023 / Granite Creek Copper Ltd. (TSX.V:GCX)(OTCQB:GCXXF) (“Granite Creek” or the “Company“) is pleased to announce it will be participating in the inaugural Yukon Mining Alliance (“YMA”) Invest Yukon Core Shack to be held in the main Investors Exchange exhibit hall at the Prospectors and Developers Annual Convention (“PDAC”) in Toronto. The Invest Yukon Core Shack will be located at Booth #3314, adjacent to the main PDAC Core Shack and Granite Creek will be displaying core from its flagship Carmacks Copper-Gold-Silver project in Yukon, Canada from March 5 and 8th. The Company will also have a presence in the main Investors Exchange from March 5-8 and investors are invited to visit booth # IE3024 to meet the team in person.
Invest Canada North Reception
The Metallic Group of Companies is proud to be a sponsor of the 2023 Invest Canada North reception to be held March 6 in MTCC North Room 106 from 4pm – 7pm EST. Leaders from its members, Granite Creek Copper, Stillwater Critical Minerals and Metallic Minerals will be in attendance and the Group will have a display table where guests are invited to meet the team. For more information, visit here.
About Yukon Mining Alliance
Yukon Mining Alliance – the globally recognized Invest Yukon brand – is a strategic alliance of Yukon’s leaders in exploration and mining who, in partnership with the Government of Yukon, connect investors with Yukon’s competitive advantages through innovative capital attraction initiatives. For more information visit InvestYukon.ca.
Invest Canada North connects global investors with the competitive advantages and opportunities in Canada’s North, Yukon, Northwest Territories and Nunavut, at one of the world’s biggest annual mining conferences, the PDAC Convention. Our unique initiatives showcase each region, through keynote presentations, panels and special sessions, highlighting the leaders in exploration, development and production, as well as the mining ecosystem that is supported by significant geological potential, strong geopolitical stability and progressive Indigenous and community partnerships. Through our Invest Canada North mining portal catch up on the latest news in the north or dive into each region to discover your next great opportunity. To learn more visit https://investcanadanorth.ca.
About Granite Creek Copper
Granite Creek, a member of the Metallic Group of Companies, is a Canadian exploration company focused on the 176-square-kilometer Carmacks Project in the Minto Copper District of Canada’s Yukon Territory. The Project is on trend with the high-grade Minto copper-gold mine, operated by Minto Metals Corp., to the north, and features excellent access to infrastructure with the nearby paved Yukon Highway 2, along with grid power within 12 km. More information about Granite Creek Copper can be viewed on the Company’s website at www.gcxcopper.com.
Neither the TSX Venture Exchange nor its Regulation Services Provider (as that term is defined in the policies of the TSX Venture Exchange) accepts responsibility for the adequacy or accuracy of this release.
Significant Mineralization Outlined 13km Northeast of the Moss Lake Deposit
Vancouver, British Columbia–(Newsfile Corp. – February 27, 2023) – Goldshore Resources Inc. (TSXV: GSHR) (OTCQB: GSHRF) (FSE: 8X00) (“Goldshore” or the “Company“), is pleased to announce assay results from its ongoing 100,000-meter drill program at the Moss Lake Project in Northwest Ontario, Canada (the “Moss Lake Gold Project“).
Highlights:
Results from the second half of the East Coldstream Phase One drill program have confirmed the potential for significant high-grade shears within East Coldstream, approximately 13 kilometers northeast of the Moss Lake Deposit. Best intercepts include:
3.49 g/t Au over 26.35m from 76.85m depth in CED-22-010, including
5.64 g/t over 15.65m from 87.55m
1.12 g/t Au over 21.9m from 206.5m
1.07 g/t Au over 31.0m from 288.0m depth in CED-22-011 and
1.48 g/t Au over 18.45m from 357.0m, including
4.68 g/t Au over 4.85m from 370.6m
0.94 g/t Au over 25.05m from 218.95m depth in CED-22-014, including
1.10 g/t Au over 16.0m from 226.0m
1.23 g/t Au over 35.15m from 338.45m depth in CED-22-017, including
2.19 g/t Au over 11.55m from 338.45m
In addition to the Moss Lake Deposit, the upcoming mineral resource estimate update will include the East Coldstream deposit. In support of this, a 3D wireframe of the mineralization constraining alteration domain has been developed utilizing both current and historical drilling data.
President and CEO Brett Richards stated: “These results at East Coldstream continue to support our thesis that the size and scale of the entire Moss Lake Gold Project will be large enough to support a material and meaningful update to the mineral resource estimate in April 2023, with East Coldstream sequencing into the mine plan in a preliminary economic assessment as a satellite pit. We look forward to the continuing catalysts to the Moss Lake Gold Project in an effort to demonstrate the true value of the assets.”
Technical Overview
Figure 1 shows the location of East Coldstream relative to Moss Lake in addition to the now formally identified gold and copper prospects controlled by Goldshore Resources. Figure 2 shows the better intercepts in plan view, and Figure 3 is a typical section through holes CED-22-013 to -015 and -017. Table 1 shows the significant intercepts. Table 2 shows the drill hole locations.
Figure 1: Plan showing location of Moss Lake and East Coldstream deposits relative to the prospective Central Domain (from geophysics survey) and field-developed prospects.
Results have been received for the eight remaining holes from the Phase One East Coldstream drill program completed in the Summer of 2022.
All holes intersected visually distinct silica, carbonate, and hematite alteration zones hosted in basalt flows – historically been referred to as the “Coldstream Basalt” – that host much of the gold mineralization (Figure 4). This alteration also overprints and locally mineralizes quartz feldspar porphyry sills and gabbro intrusions where they are intersected by shear zones. The altered intrusions are significantly less “visual” than the Coldstream Basalt, which resulted in inconsistent sampling of historical drill core. Infill sampling of intervals within the modelled alteration domain represents an opportunity to expand mineralization. This is planned for the summer.
Goldshore has wireframed shear zone-hosted alteration domains (Figure 5) ahead of a mineral resource update planned for the second quarter. This consists of two major altered shear zones – Main Lens and North Lens – and four minor altered shear zone splays. The Main Lens has been historically split into the Main Lens and Sanders Lens however these two lenses are now understood to be the same zone split by a late Proterozoic diabase dyke.
To evaluate the historical drilling, hole CED-22-010 was drilled as a twin of hole C-10-23 in the core of the East Coldstream deposit where both holes intersected two shear-controlled Lenses. In the North Lens, CED-22-010 and C-10-23 intersected 1.81 g/t Au over 54.6m from 76.85m versus 1.35 g/t Au over 54.2m from 80.4m, respectively. In the South Lens, CED-22-010 intersected 0.56 g/t Au over 51.5m from 206.5m versus 0.55 g/t Au over 34.7m from 196.6m, respectively. This represents a 34% higher grade over similar widths in the North Lens and a 48% increase in width with similar grades in the South Lens in the current drill hole.
The East Coldstream deposit also contains a broad, low-grade mineralized envelope within the alteration domain. Examples include 0.54 g/t Au over 27.5.0m from 562.5m in CED-22-009; 0.56 g/t Au over 51.5m from 206.5m depth in CED-22-010; 0.33 g/t Au over 32.0m from 315m in CED-22-012; 0.72 g/t Au over 18.1m from 182.05m in CED-22-013; 0.69 g/t Au over 25.05m from 254.95m in CED-22-014; and 0.85 g/t Au over 17.4m from 190.6m in CED-22-015.
Figure 4: Core box photos of CED-22-010 intercept in the North Lens – 3.49 g/t Au over 26.35m from 76.85m depth (yellow box) including 5.64 g/t over 15.65m from 87.55m.
Note that these photos are not intended to be representative of broader mineralization on the Moss Lake Gold Project.
Pete Flindell, VP Exploration for Goldshore, said “These drill results show that East Coldstream, which is well constrained by altered and mineralized shears, may be significantly larger than previously understood. Our focus will now be on developing a mineral resource based around the high-grade shears and their low-grade envelopes, which will form an important satellite to the Moss Lake Gold Project approximately 13 kilometers to the southwest.”
Table 1: Significant downhole gold intercepts
HOLE ID
FROM
TO
LENGTH (m)
TRUE WIDTH (m)
CUT GRADE (g/t Au)
UNCUT GRADE (g/t Au)
CED-22-009
497.00
511.65
14.65
11.5
0.58
0.58
including
497.00
501.00
4.00
3.1
1.20
1.20
562.50
590.00
27.50
22.5
0.54
0.54
including
572.50
581.00
8.50
7.0
1.44
1.44
CED-22-010
76.85
103.20
26.35
16.6
3.49
3.49
including
87.55
103.20
15.65
9.9
5.64
5.64
123.30
131.45
8.15
5.2
0.81
0.81
including
123.30
125.45
2.15
1.4
1.58
1.58
166.00
176.50
10.50
6.8
0.59
0.59
187.00
191.00
4.00
2.6
0.56
0.56
206.50
258.00
51.50
34.5
0.56
0.56
including
206.50
228.40
21.90
14.5
1.12
1.12
CED-22-011
248.40
251.75
3.35
2.0
1.49
1.49
including
248.40
251.00
2.60
1.6
1.73
1.73
284.50
324.60
40.10
24.8
0.91
0.91
including
288.00
319.00
31.00
19.1
1.07
1.07
339.00
344.50
5.50
3.5
0.70
0.70
357.00
375.45
18.45
11.8
1.48
1.48
including
370.60
375.45
4.85
3.1
4.68
4.68
400.40
413.90
13.50
8.8
0.54
0.54
including
400.40
404.45
4.05
2.6
1.25
1.25
CED-22-012
315.00
347.00
32.00
20.7
0.33
0.33
362.80
367.00
4.20
2.8
0.57
0.57
376.80
381.05
4.25
2.8
0.52
0.52
CED-22-013
119.00
121.00
2.00
1.5
1.14
1.14
137.65
149.85
12.20
9.1
0.41
0.41
182.05
200.10
18.05
13.9
0.72
0.72
including
182.05
194.40
12.35
9.5
1.02
1.02
CED-22-014
31.00
33.00
2.00
0.9
0.96
0.96
119.00
133.00
14.00
6.5
0.39
0.39
218.95
244.00
25.05
12.5
0.94
0.94
including
226.00
242.00
16.00
8.0
1.10
1.10
254.95
259.00
4.05
2.0
0.36
0.36
264.00
280.00
16.00
8.1
0.95
0.95
including
271.00
277.00
6.00
3.1
1.68
1.68
CED-22-015
9.00
11.00
2.00
1.3
0.70
0.70
21.00
23.00
2.00
1.3
0.42
0.42
31.00
33.00
2.00
1.3
0.33
0.33
118.00
120.00
2.00
1.4
0.31
0.31
190.60
208.00
17.40
12.6
0.85
0.85
including
190.60
195.80
5.20
3.7
1.20
1.20
and
206.00
208.00
2.00
1.4
1.95
1.95
CED-22-017
212.80
221.00
8.20
6.3
0.53
0.53
284.00
286.00
2.00
1.6
0.68
0.68
298.00
305.00
7.00
5.7
0.69
0.69
338.45
373.60
35.15
29.6
1.23
1.23
including
338.45
350.00
11.55
9.7
2.19
2.19
and
362.90
373.60
10.70
9.1
1.28
1.28
Intersections calculated above a 0.3 g/t Au cut off with a top cut of 30 g/t Au and a maximum internal waste interval of 10 metres. Bordered intervals are intersections calculated above a 1.0 g/t Au cut off. Intervals in bold are those with a grade thickness factor exceeding 20 gram x metres / tonne gold. True widths are approximate and assume a subvertical body.
Table 2: Location of drill holes in this press release
HOLE
EAST
NORTH
RL
AZIMUTH
DIP
EOH
CED-22-009
680,767
5,386,281
484
341°
-50°
599.95
CED-22-010
679,898
5,386,424
475
161°
-53°
315.00
CED-22-011
679,945
5,386,526
480
155°
-57°
642.00
CED-22-012
679,945
5,386,526
480
180°
-54°
600.00
CED-22-013
680,560
5,386,569
485
340°
-50°
300.00
CED-22-014
680,561
5,386,569
485
341°
-65°
450.00
CED-22-015
680,598
5,386,576
486
340°
-50°
300.00
CED-22-017
680,641
5,386,434
478
341°
-49°
456.00
Approximate collar coordinates in NAD 83, Zone 15N
Analytical and QA/QC Procedures
All samples were sent to ALS Geochemistry in Thunder Bay for preparation and analysis was performed in the ALS Vancouver analytical facility. ALS is accredited by the Standards Council of Canada (SCC) for the Accreditation of Mineral Analysis Testing Laboratories and CAN-P-4E ISO/IEC 17025. Samples were analyzed for gold via fire assay with an AA finish (“Au-AA23”) and 48 pathfinder elements via ICP-MS after four-acid digestion (“ME-MS61”). Samples that assayed over 10 ppm Au were re-run via fire assay with a gravimetric finish (“Au-GRA21”).
In addition to ALS quality assurance / quality control (“QA/QC”) protocols, Goldshore has implemented a quality control program for all samples collected through the drilling program. The quality control program was designed by a qualified and independent third party, with a focus on the quality of analytical results for gold. Analytical results are received, imported to our secure on-line database and evaluated to meet our established guidelines to ensure that all sample batches pass industry best practice for analytical quality control. Certified reference materials are considered acceptable if values returned are within three standard deviations of the certified value reported by the manufacture of the material. In addition to the certified reference material, certified blank material is included in the sample stream to monitor contamination during sample preparation. Blank material results are assessed based on the returned gold result being less than ten times the quoted lower detection limit of the analytical method. The results of the on-going analytical quality control program are evaluated and reported to Goldshore by Orix Geoscience Inc.
Director Resignation
Doug Ramshaw has announced he will step down from the Board of Directors of the Company at the end of February 2023. Doug was instrumental in the formation of Goldshore and the preliminary launch of the initial public offering in June 2021, and is stepping down to dedicate greater time to Minera Alamos and other ventures he is involved in.
President and CEO Brett Richards stated: “Doug’s exceptional contribution to the Goldshore Board has been a testament to the broad investor awareness created around the Company’s launch and on-going development. I personally have thoroughly enjoyed working with Doug over the last two years, as he has been sound counsel to myself and the Board, and on behalf of all of us on the Board, we wish Doug the very best in his future endeavors.”
About Goldshore
Goldshore is an emerging junior gold development company, and owns 100% of the Moss Lake Gold Project located in Ontario. Wesdome is currently a large shareholder of Goldshore with an approximate 22% equity position in the Company. Well-financed and supported by an industry-leading management group, board of directors and advisory board, Goldshore is positioned to advance the Moss Lake Gold Project through the next stages of exploration and development.
Peter Flindell, P.Geo., MAusIMM, MAIG, Vice President – Exploration of the Company, a qualified person under NI 43-101 has approved the scientific and technical information contained in this news release.
Neither the TSXV nor its Regulation Services Provider (as that term is defined in the policies of the TSXV) accepts responsibility for the adequacy or accuracy of this release.
For More Information – Please Contact:
Brett A. Richards President, Chief Executive Officer and Director Goldshore Resources Inc.
This news release contains statements that constitute “forward-looking statements.” Such forward looking statements involve known and unknown risks, uncertainties and other factors that may cause the Company’s actual results, performance or achievements, or developments to differ materially from the anticipated results, performance or achievements expressed or implied by such forward-looking statements. Forward looking statements are statements that are not historical facts and are generally, but not always, identified by the words “expects,” “plans,” “anticipates,” “believes,” “intends,” “estimates,” “projects,” “potential” and similar expressions, or that events or conditions “will,” “would,” “may,” “could” or “should” occur.
Forward-looking statements in this news release include, among others, statements relating to expectations regarding the exploration and development of the Moss Lake Gold Project, the release and timing of an updated mineral resource estimate, the release of a preliminary economic assessment and other statements that are not historical facts. By their nature, forward-looking statements involve known and unknown risks, uncertainties and other factors which may cause our actual results, performance or achievements, or other future events, to be materially different from any future results, performance or achievements expressed or implied by such forward-looking statements. Such factors and risks include, among others: the Company may require additional financing from time to time in order to continue its operations which may not be available when needed or on acceptable terms and conditions acceptable; compliance with extensive government regulation; domestic and foreign laws and regulations could adversely affect the Company’s business and results of operations; the stock markets have experienced volatility that often has been unrelated to the performance of companies and these fluctuations may adversely affect the price of the Company’s securities, regardless of its operating performance; and the impact of COVID-19.
The forward-looking information contained in this news release represents the expectations of the Company as of the date of this news release and, accordingly, is subject to change after such date. Readers should not place undue importance on forward-looking information and should not rely upon this information as of any other date. The Company undertakes no obligation to update these forward-looking statements in the event that management’s beliefs, estimates or opinions, or other factors, should change.
This news release does not constitute an offer to sell, or a solicitation of an offer to buy, any securities in the United States. The securities have not been and will not be registered under the United States Securities Act of 1933, as amended (the “U.S. Securities Act”) or any state securities laws and may not be offered or sold within the United States or to U.S. Persons unless registered under the U.S. Securities Act and applicable state securities laws or an exemption from such registration is available.
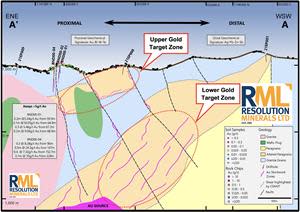
Schematic geological cross section through the Miranda and Boundary Prospects, East Pogo with subsurface geology including prospective shear zone (altered paragneiss) interpreted from the 2022 ELF-EM, the 2020 CSAMT, ZTEM and 3D magnetic modeling shells.
Highlights:
Millrock received payment of US$100,000 and 10 million Resolution Minerals shares. Having spent more than US$9 million and met all other necessary conditions, Resolution has earned a 51% interest in the project. A joint venture is to be formed.
Excellent drill targets have been identified at East Pogo.
VANCOUVER, British Columbia, Feb. 24, 2023 (GLOBE NEWSWIRE) — Millrock Resources Inc. (TSX-V: MRO, OTCQB: MLRKF) (“Millrock” or the “Company”) reports on advancements at the 64North gold exploration project. The project is the subject of an earn-in agreement whereby Resolution Minerals Limited (ASX: RML) (“Resolution”) has been earning a joint venture interest from Millrock.
Earned Interest: Resolution has completed the requirements to earn a 51% interest in the project, and this interest has been recorded. Resolution has exceeded the Year 3 exploration expenditure requirement of US$2.5 million and has spent a total exceeding US$9.0 million on exploration. Resolution has recently paid Millrock US$100,000, and issued a further share payment of 10 million RML shares to Millrock. Millrock now owns 33 million Resolution shares. Resolution has indicated it does not intend to exercise its option to continue sole-funding exploration on the project to further increase its ownership interest. A 51% Resolution – 49% Millrock joint venture is to be formed. The terms of the December 2019 agreement can be viewed at this link: Definitive Exploration Agreement.
New East Pogo Drill Targets Identified: As a result of the 2022 regional work, new compelling drill targets have been identified at the Miranda and Boundary prospects in the East Pogo block of the project area. Four ELF (Extremely Low Frequency) electromagnetic geophysical survey lines and a surface soil geochemical grid were completed during the 2022 season in order to refine the model for the mineralized system in the area. The updated model suggests the source of mineralizing fluid is related to discrete magnetic intrusions at depth. Multiple intrusions occur within the dilatational zone associated with the previously identified shear package. The new model indicates previous drilling in the area did not achieve depths needed to test the prospective shear. Deeper drilling will be required to test the full thickness of the shear rock package. However, a shallower, undrilled target has also been outlined. Resolution has reported further details in their February 23, 2023 press release.
Figure 1
Figure 1.Schematic geological cross section through the Miranda and Boundary Prospects, East Pogo with subsurface geology including prospective shear zone (altered paragneiss) interpreted from the 2022 ELF-EM, the 2020 CSAMT, ZTEM and 3D magnetic modeling shells.
Qualified Person The scientific and technical information disclosed within this document has been prepared, reviewed, and approved by Gregory A. Beischer, President, CEO, and a director of Millrock Resources. Mr. Beischer is a qualified person, as defined in NI 43-101
About Millrock Resources Inc. Millrock Resources Inc. is a premier project generator to the mining industry. Millrock identifies, packages, and operates large-scale projects for joint venture, thereby exposing its shareholders to the benefits of mineral discovery without the usual financial risk taken on by most exploration companies. The company is recognized as the premier generative explorer in Alaska, is a significant shareholder of junior explorer ArcWest Exploration Inc., and owns a large shareholding in each of Resolution Minerals Limited and Felix Gold Limited. Funding for drilling at Millrock’s exploration projects is primarily provided by its joint venture partners. Business partners of Millrock have included some of the leading names in the mining industry: EMX Royalty, Coeur Explorations, Centerra Gold, First Quantum, Teck, Kinross, Vale, Inmet, and Altius, as well as junior explorers Resolution, Riverside, PolarX, Felix Gold, and Tocvan.
ON BEHALF OF THE BOARD “Gregory Beischer” Gregory Beischer, President & CEO
FOR FURTHER INFORMATION, PLEASE CONTACT: Gregory A. Beischer, President & CEO Toll-Free: 877-217-8978 | Local: 604-638-3164 Twitter | Facebook | LinkedIn
Some statements in this news release may contain forward-looking information (within the meaning of Canadian securities legislation) including without limitation formation of a joint venture between Millrock and Resolution and the possibility of further drilling at the East Pogo prospect. These statements address future events and conditions and, as such, involve known and unknown risks, uncertainties and other factors which may cause the actual results, performance or achievements to be materially different from any future results, performance or achievements expressed or implied by the statements.
Assay results for drill hole APC-31, which is the first hole to test the mineralized outcrop of the Apollo porphyry system (*formerly known as the Main Breccia discovery), has intersected significant continuous high-grade copper-silver-gold mineralization from surface as follows:
High-grade oxide mineralization was encountered over the initial 42.35 metres of the drill hole averaging 5.08 g/t gold equivalent.
Five additional drill holes have been completed in 2023 to date from drill Pads 6 and 7. All five holes appear to have cut significant mineralization beginning at bedrock with the three completed holes from Pad 6 intersecting more than 350 metres of continuous mineralization and the two outstanding holes from Pad 7 intersecting more than 100 metres and 170 metres of continuous mineralization, respectively. Assay results for these holes are expected in the near term.
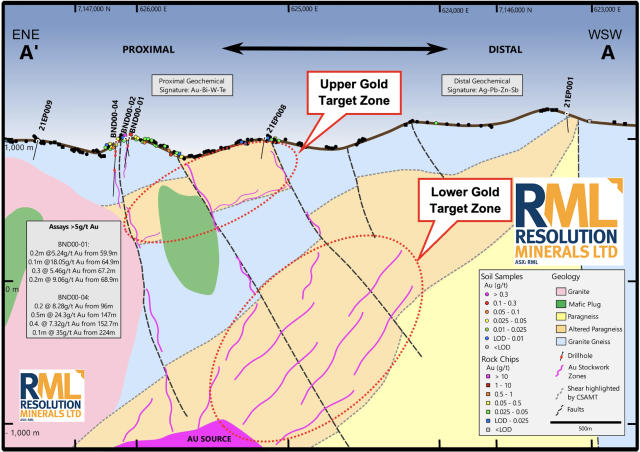
Outcrop mapping and sampling in the south and central portions of the Apollo porphyry system has outlined a 130 metres X 130 metres area of known surface mineralization which is open in all directions. Two new pads (9 and 10) are under construction and once operational will provide more drilling options to test this expanding area of surface and shallow mineralization.
Ari Sussman, Executive Chairman commented: “2023 is off to an excellent start to say the least. Not only did drill hole APC-31 confirm for the first time that the high-grade copper-silver-gold mineralization in the Apollo porphyry system comes right to surface, but also that there is a significant zone of high-grade oxide mineralization. We have truly discovered a remarkable porphyry system at Apollo characterized by unusually high-grades of combined gold, silver and copper. We are equally fortunate that our Guayabales project is located in a mining camp contiguous to the multi-million-ounce Marmato mine and are confident that our Apollo porphyry system will play a key role in Colombia’s decarbonization strategy. Our plan in 2023 is to remain aggressive with both drilling and ESG so that our “Collective” model for mining yields dividends for stakeholders and shareholders alike.”
TORONTO, Feb. 23, 2023 /CNW/ – Collective Mining Ltd. (TSXV: CNL) (OTCQX: CNLMF) (“Collective” or the “Company”) is pleased to announce assay results from the first drill hole of 2023 as part of the Company’s phase II drill program at the Guayabales project located in Caldas, Colombia. The aim of the phase II program is to test and define through drilling the shallow portion of the Apollo porphyry system (*formerly known as the Main Breccia discovery) as well as continue expanding the system through step-out drilling. The Apollo porphyry deposit is a high-grade, bulk tonnage copper-silver-gold system, which owes its excellent metal endowment to an older porphyry copper-silver and gold mineralization being overprinted by younger precious metal rich, carbonate base metal vein systems (low and intermediate sulphidation) within a magmatic, hydrothermal intermineral breccia body currently measuring 395 metres x 385 metres x 915 metres and open for expansion.
Details (See Table 1 and Figures 1-3)
Assay results for the first drill hole (APC-31) from the 2023 phase II program is announced in this press release. The Phase II drilling program of 2023 is advancing on schedule with six holes completed and a further three in progress. The aim of this program is to define the high-grade mineralization and dimensions of the Apollo porphyry near surface while continuing to expand the size of the system through step-out drilling.
To date, a total of 32 drill holes (approximately 15,400 metres) have been completed and assayed at the Apollo target with the majority of the holes testing the Apollo porphyry system.
Assay results and geological observations of APC-31 are summarized below.
APC-31 was a shallow hole, drilled steeply to the northwest from Pad 6 to a maximum depth of 389.6 metres (370 metres vertical). The hole was designed to exclusively test the upper portion of the porphyry system from a location where the system outcrops at surface. The hole intersected continuous mineralization from surface down to its final depth where it was terminated while still in strong mineralization. APC-31 is the highest-grade accumulation of mineralization reported from drilling to date and averaged:
384.7 metres @ 2.46 g/t gold equivalent (consisting of 1.17 g/t gold, 43 g/t silver and 0.37% copper) and including;
The mineralized interval starts from surface to 30 metres depth within saprolite material followed by an additional 17.5 metres of saprock with iron oxides and sulphides to 47.25 metres before transitioning into fresh rock consisting of chalcopyrite (0.5% to 1.5%), pyrite (1% to 2.5%) and some pyrrhotite (~1%). The mineralization is overprinted by carbonate-base metal veins containing sphalerite and galena and high grades of gold. Gold grades are significantly higher in the oxidized portion of the intercept down to 47.25 metres, while copper and silver grades are reduced within the same interval presumably due to weathering.
Outcrop mapping and sampling in the south and central portions of the system has outlined a 130 metre-by-130 metre area of known surface mineralization, which is open in all directions. 2023 drill Pads 6 and 7 have been designed to achieve the objective of understanding the styles and tenor of the shallow, high-grade mineralization from surface down to depths of up to 400 metres. Visual observations from five completed holes that are awaiting assay results in the near term indicate continuous intercepts from surface over core lengths ranging from more than 100 metres to more than 350 metres. The Company presently has three diamond drill rigs operating at the project.
Two new drill pads, numbered 9 and 10, are under construction to provide further drilling options to test and expand upon the area which the Apollo porphyry system outcrops at surface.
The Apollo target area, as defined to date by surface mapping, rock sampling and copper and molybdenum soil geochemistry, covers a 1,000 metres X 1,200 metres area, and represents a large and unusually high-grade Au-Cu-Ag porphyry system. Mineralization styles include early-stage porphyry veining, inter-mineral breccia mineralization and multiple zones of late stage, sheeted, carbonate-base metal veins with high gold and silver grades. The Apollo target area is still expanding as the Company’s geologists find more outcrop areas with porphyry veining, breccia, and late stage, sheeted, carbonate base metal veins.
Table 1: Assays Results for APC-31
Hole ID
From (m)
To (m)
Intercept (m)
Au (g/t)
Ag (g/t)
Cu %
Mo %
AuEq (g/t)*
APC-31
4.90
389.60
384.70
1.17
43
0.37
0.02
2.46
Including
4.90
325.70
320.80
1.34
49
0.44
0.02
2.84
4.90
114.70
109.80
3.15
45
0.25
0.01
4.14
**
4.90
47.25
42.35
4.81
23
0.09
0.001
5.08
*AuEq (g/t) is calculated as follows: (Au (g/t) x 0.95) + (Ag g/t x 0.016 x 0.95) + (Cu (%) x 1.83 x 0.95)+ (Mo (%)*9.14 x 0.95) and CuEq (%) is calculated as follows: (Cu (%) x 0.95) + (Au (g/t) x 0.51 x 0.95) + (Ag (g/t) x 0.01 x 0.95)+ (Mo(%)x 3.75 x 0.95) utilizing metal prices of Cu – US$4.00/lb, Ag – $24/oz Mo US$20.00/lb and Au – US$1,500/oz and recovery rates of 95% for Au, Ag, Mo and Cu. Recovery rate assumptions are speculative as no metallurgical work has been completed to date. A 0.2 g/t AuEq cut-off grade was employed with no more than 15% internal dilution. True widths are unknown, and grades are uncut **Zone of Oxidation
Figure 1: Plan View of the Apollo Porphyry System (formerly known as the Main Breccia Discovery) Highlighting Drill Hole APC-31 (CNW Group/Collective Mining Ltd.)
Figure 2: Plan View of the Guayabales Project Highlighting the Apollo Target Area (CNW Group/Collective Mining Ltd.)
To see our latest corporate presentation and related information, please visit www.collectivemining.com
Founded by the team that developed and sold Continental Gold Inc. to Zijin Mining for approximately $2 billion in enterprise value, Collective Mining is a copper, silver and gold exploration company with projects in Caldas, Colombia. The Company has options to acquire 100% interests in two projects located directly within an established mining camp with ten fully permitted and operating mines.
The Company’s flagship project, Guayabales, is anchored by the Apollo target, which hosts the large-scale, bulk-tonnage and high-grade copper-silver-gold Apollo porphyry system. The Company’s near-term objective is to drill the shallow portion of the porphyry system while continuing to expansion the overall dimensions of the system, which remains open in all directions.
Management, insiders and close family and friends own nearly 52% of the outstanding shares of the Company and as a result, are fully aligned with shareholders. The Company is listed on the TSXV under the trading symbol “CNL” and on the OTCQX under the trading symbol “CNLMF”.
Qualified Person (QP) and NI43-101 Disclosure
David J Reading is the designated Qualified Person for this news release within the meaning of National Instrument 43-101 (“NI 43-101”) and has reviewed and verified that the technical information contained herein is accurate and approves of the written disclosure of same. Mr. Reading has an MSc in Economic Geology and is a Fellow of the Institute of Materials, Minerals and Mining and of the Society of Economic Geology (SEG).
Technical Information
Rock and core samples have been prepared and analyzed at SGS laboratory facilities in Medellin, Colombia and Lima, Peru. Blanks, duplicates, and certified reference standards are inserted into the sample stream to monitor laboratory performance. Crush rejects and pulps are kept and stored in a secured storage facility for future assay verification. No capping has been applied to sample composites. The Company utilizes a rigorous, industry-standard QA/QC program.
Information Contact:
Follow Executive Chairman Ari Sussman (@Ariski) and Collective Mining (@CollectiveMini1) on Twitter
FORWARD-LOOKING STATEMENTS
This news release contains certain forward-looking statements, including, but not limited to, statements about the drill programs, including timing of results, and Collective’s future and intentions. Wherever possible, words such as “may”, “will”, “should”, “could”, “expect”, “plan”, “intend”, “anticipate”, “believe”, “estimate”, “predict” or “potential” or the negative or other variations of these words, or similar words or phrases, have been used to identify these forward-looking statements. These statements reflect management’s current beliefs and are based on information currently available to management as at the date hereof.
Forward-looking statements involve significant risk, uncertainties, and assumptions. Many factors could cause actual results, performance, or achievements to differ materially from the results discussed or implied in the forward-looking statements. These factors should be considered carefully, and readers should not place undue reliance on the forward-looking statements. Although the forward-looking statements contained in this news release are based upon what management believes to be reasonable assumptions, Collective cannot assure readers that actual results will be consistent with these forward-looking statements. These forward-looking statements are made as of the date of this news release, and Collective assumes no obligation to update or revise them to reflect new events or circumstances, except as required by law.
Neither the TSXV nor its Regulation Services Provider (as that term is defined in the policies of the TSXV) accepts responsibility for the adequacy or accuracy of this news release.
TORONTO, Feb. 23, 2023 /CNW/ – Franco-Nevada Corporation (“Franco-Nevada” or the “Company“) (TSX: FNV) (NYSE: FNV) has been advised by its partner First Quantum Minerals Ltd. (“First Quantum“) that First Quantum’s subsidiary, Minera Panama, S.A. (“MPSA“), has suspended ore processing operations at the Cobre Panama mine. As previously announced, the Panama Maritime Authority (“AMP“) issued a resolution on January 26, 2023 requiring the suspension of concentrate loading operations at the Cobre Panama Port, Punta Rincón, until certification of the calibration of the scales by an accredited company had been initiated. Key updates as reported by First Quantum include:
MPSA believes it has complied with all requirements of the AMP resolution but copper concentrate loading operations are still not being permitted by the AMP
MPSA will begin a partial demobilization of its workforce and will take a systematic approach to reducing operations to ensure the safety of its workforce, prevent damage and degradation of equipment and preserve the integrity of the mine
If the AMP is to permit the recommencement of concentrate loading operations, MPSA could begin shipping concentrate and resuming operations at the mine within hours
Negotiations with the Government of Panama on a refreshed contract are continuing and First Quantum remains committed to achieving an outcome that will be to the benefit of all stakeholders and support the long-term operations of the Cobre Panama mine.
Please refer to First Quantum’s press release dated February 23, 2023 for further details.
Impact on Franco-Nevada
Franco-Nevada (Barbados) Corporation, a subsidiary of Franco-Nevada, holds two precious metal streams indexed to the copper-in-concentrate shipped by Cobre Panama. First Quantum’s 2023 guidance for uninterrupted production from Cobre Panama provided on January 16, 2023 was for 350kt to 380kt of copper production. This would translate into 131koz to 142koz of attributable GEO production to Franco-Nevada (calculating gold equivalence using $1,800/oz Au and $21.00/oz Ag prices).
Provided operations resume at Cobre Panama, the impact to Franco-Nevada of the suspension of operations should be limited to a deferral of revenue as the streams do not bear any associated carrying costs while operations are suspended.
Despite operations at the mine being suspended, Franco-Nevada remains highly profitable, continues to generate substantial cash flow, is debt-free, and has cash and working capital in excess of US$1 billion, an undrawn US$1 billion credit facility and limited financial commitments. Franco-Nevada remains in communication with First Quantum and will provide further updates as they are available.
Forward-Looking Statements
This press release contains “forward-looking information” and “forward-looking statements” within the meaning of applicable Canadian securities laws and the United States Private Securities Litigation Reform Act of 1995, respectively, which may include, but are not limited to, statements with respect to future events or future performance, management’s expectations regarding Franco-Nevada’s growth, results of operations, estimated future revenues, performance guidance, carrying value of assets, future dividends and requirements for additional capital, mineral reserve and mineral resource estimates, production estimates, production costs and revenue, future demand for and prices of commodities, expected mining sequences, business prospects and opportunities, the performance and plans of third party operators, audits being conducted by the CRA, the expected exposure for current and future assessments and available remedies, the outcome of any discussions between the Government of Panama and the operator of the Cobre Panama mine and the remedies relating to and consequence of any actions taken by the Government of Panama or the operator of the Cobre Panama mine. In addition, statements relating to reserves and resources, gold equivalent ounces (“GEOs”) and mine life are forward-looking statements, as they involve implied assessment, based on certain estimates and assumptions, and no assurance can be given that the estimates and assumptions are accurate and that such reserves and resources, GEOs or mine life will be realized. Such forward-looking statements reflect management’s current beliefs and are based on information currently available to management. Often, but not always, forward-looking statements can be identified by the use of words such as “plans”, “expects”, “is expected”, “budgets”, “potential for”, “scheduled”, “estimates”, “forecasts”, “predicts”, “projects”, “intends”, “targets”, “aims”, “anticipates” or “believes” or variations (including negative variations) of such words and phrases or may be identified by statements to the effect that certain actions “may”, “could”, “should”, “would”, “might” or “will” be taken, occur or be achieved. Forward-looking statements involve known and unknown risks, uncertainties and other factors, which may cause the actual results, performance or achievements of Franco-Nevada to be materially different from any future results, performance or achievements expressed or implied by the forward-looking statements. A number of factors could cause actual events or results to differ materially from any forward-looking statement, including, without limitation: fluctuations in the prices of the primary commodities that drive royalty and stream revenue (gold, platinum group metals, copper, nickel, uranium, silver, iron ore and oil and gas); fluctuations in the value of the Canadian and Australian dollar, Mexican peso, and any other currency in which revenue is generated, relative to the U.S. dollar; changes in national and local government legislation, including permitting and licensing regimes and taxation policies and the enforcement thereof; the adoption of a global minimum tax on corporations; regulatory, political or economic developments in any of the countries where properties in which Franco-Nevada holds a royalty, stream or other interest are located or through which they are held; risks related to the operators of the properties in which Franco-Nevada holds a royalty, stream or other interest, including changes in the ownership and control of such operators; relinquishment or sale of mineral properties; influence of macroeconomic developments; business opportunities that become available to, or are pursued by Franco-Nevada; reduced access to debt and equity capital; litigation; title, permit or license disputes related to interests on any of the properties in which Franco-Nevada holds a royalty, stream or other interest; whether or not the Company is determined to have “passive foreign investment company” (“PFIC”) status as defined in Section 1297 of the United States Internal Revenue Code of 1986, as amended; potential changes in Canadian tax treatment of offshore streams; excessive cost escalation as well as development, permitting, infrastructure, operating or technical difficulties on any of the properties in which Franco-Nevada holds a royalty, stream or other interest; access to sufficient pipeline capacity; actual mineral content may differ from the reserves and resources contained in technical reports; rate and timing of production differences from resource estimates, other technical reports and mine plans; risks and hazards associated with the business of development and mining on any of the properties in which Franco-Nevada holds a royalty, stream or other interest, including, but not limited to unusual or unexpected geological and metallurgical conditions, slope failures or cave-ins, flooding and other natural disasters, terrorism, civil unrest or an outbreak of contagious disease; the impact of the COVID-19 (coronavirus) pandemic; and the integration of acquired assets. The forward-looking statements contained in this press release are based upon assumptions management believes to be reasonable, including, without limitation: the ongoing operation of the properties in which Franco-Nevada holds a royalty, stream or other interest by the owners or operators of such properties in a manner consistent with past practice; the accuracy of public statements and disclosures made by the owners or operators of such underlying properties; no material adverse change in the market price of the commodities that underlie the asset portfolio; the Company’s ongoing income and assets relating to determination of its PFIC status; no material changes to existing tax treatment; the expected application of tax laws and regulations by taxation authorities; the expected assessment and outcome of any audit by any taxation authority; no adverse development in respect of any significant property in which Franco-Nevada holds a royalty, stream or other interest; the accuracy of publicly disclosed expectations for the development of underlying properties that are not yet in production; integration of acquired assets; and the absence of any other factors that could cause actions, events or results to differ from those anticipated, estimated or intended. However, there can be no assurance that forward-looking statements will prove to be accurate, as actual results and future events could differ materially from those anticipated in such statements. Investors are cautioned that forward-looking statements are not guarantees of future performance. In addition, there can be no assurance as to the outcome of the ongoing audit by the CRA or the Company’s exposure as a result thereof. Franco-Nevada cannot assure investors that actual results will be consistent with these forward-looking statements. Accordingly, investors should not place undue reliance on forward-looking statements due to the inherent uncertainty therein.
For additional information with respect to risks, uncertainties and assumptions, please refer to Franco-Nevada’s most recent Annual Information Form filed with the Canadian securities regulatory authorities on www.sedar.com and Franco-Nevada’s most recent Annual Report filed on Form 40-F filed with the SEC on www.sec.gov. The forward-looking statements herein are made as of the date of this press release only and Franco-Nevada does not assume any obligation to update or revise them to reflect new information, estimates or opinions, future events or results or otherwise, except as required by applicable law.
KELOWNA, BC / ACCESSWIRE / February 21, 2023 / Diamcor Mining Inc. (TSXV:DMI)(OTCQB:DMIFF)(FRA:DC3A), (“Diamcor” or, the “Company”) is pleased to announce the recent recovery of a 72.53 carat gem quality rough diamond and reports the initial sale of 1,466.12 carats of rough diamonds during the current quarter from the processing of quarry material at the Company’s Krone-Endora at Venetia Project (the “Project”). The sale of the 1,466.12 carats of rough diamonds generated gross revenues of USD $294,696.73, resulting in an average price of USD $201.00 per carat. The 72.53 carat gem quality special rough diamond recovered by the Company is currently being offered for tender and sale in Dubai and is expected to offset the lower than expected total carats sold in the initial sale of the quarter. Additional rough diamonds recovered to date during the period are being held as stock on hand for later tender and sale.
Highlights
Initial Tender and Sale of Rough Diamonds. The total number of carats of rough diamonds initially tendered and sold in the current quarter at 1,466.12 was lower than anticipated due to widely reported increases in daily load-shedding / power outages throughout South Africa. The Company recently announced it is in advanced discussions on objectives aimed at reducing the impact of this load-shedding for the long-term.
Strong Average Dollar Per Carat Continues. With the Project’s high percentage of gem quality diamonds to date, the average dollar per carat continued to remain in line with Company expectations and achieved a strong average dollar per carat of USD $201.00.
Recovery of Large Gem Quality Rough Diamond. The recovery of a 72.53 carat diamond, another large gem quality rough diamond in the Specials category (+10.8 carats), continues to confirm the potential for these types of large rough diamonds to be recovered from the Project’s deposits and provide a positive impact to gross revenues.
Current Rough Diamond Recovery. The Company recovered approximately 1,500 carats of rough diamonds during this period which are currently being held as stock on hand. These rough diamonds, along with additional rough diamonds recovered prior to March 31, 2023, will either be tendered and sold in the quarter’s final tender and sale, or held as stock on hand at the end of the current period, and tendered in the Company’s next quarter.
Advanced Discussions on Procurement and Installation of Power Systems. The Company’s operational team has operated this past year within the constraints of the well documented power supply issues in South Africa with the objective to find the right solution to mitigate the impact load-shedding has had on the Project. The Company is in advanced stages of discussions on procurement and the installation of back-up power systems. Details will be provided in the coming weeks once finalized.
“The recovery of yet another larger gem quality 72.53 carat rough diamond demonstrates the Project’s continued potential to contain these higher value rough diamonds even while operating below the Project’s processing capacity,” stated Mr. Dean Taylor, Diamcor CEO. “I am confident the implementation of the power supply back-up systems will provide improved power consistency needed for the processing plant to reach its designed potential.”
About Diamcor Mining Inc.
Diamcor Mining Inc. is a fully reporting publicly traded junior diamond mining company which is listed on the TSX Venture Exchange under the symbol V.DMI, and on the OTC QB International under the symbol DMIFF. The Company has a well-established operational and production history in South Africa and extensive prior experience supplying rough diamonds to the world market.
About the Tiffany & Co. Alliance
The Company has established a long-term strategic alliance and first right of refusal with Tiffany & Co. Canada, a subsidiary of world famous New York based Tiffany & Co., to purchase up to 100% of the future production of rough diamonds from the Krone-Endora at Venetia Project at then current prices to be determined by the parties on an ongoing basis. In conjunction with this first right of refusal, Tiffany & Co. Canada also provided the Company with financing to advance the Project. Tiffany & Co. is now owned by Moet Hennessy Louis Vuitton SE (LVMH), a publicly traded company which is listed on the Paris Stock Exchange (Euronext) under the symbol LVMH and on the OTC under the symbol LVMHF. For additional information on Tiffany & Co., please visit their website at www.tiffany.com.
About Krone-Endora at Venetia
In February 2011, Diamcor acquired the Krone-Endora at Venetia Project from De Beers Consolidated Mines Limited, consisting of the prospecting rights over the farms Krone 104 and Endora 66, which represent a combined surface area of approximately 5,888 hectares directly adjacent to De Beers’ flagship Venetia Diamond Mine in South Africa. On September 11, 2014, the Company announced that the South African Department of Mineral Resources had granted a Mining Right for the Krone-Endora at Venetia Project encompassing 657.71 hectares of the Project’s total area of 5,888 hectares. The Company has also submitted an application for a mining right over the remaining areas of the Project. The deposits which occur on the properties of Krone and Endora have been identified as a higher-grade “Alluvial” basal deposit which is covered by a lower-grade upper “Eluvial” deposit. The deposits are proposed to be the result of the direct-shift (in respect to the “Eluvial” deposit) and erosion (in respect to the “Alluvial” deposit) ofmaterial from the higher grounds of the adjacent Venetia Kimberlite areas. The deposits on Krone-Endora occur in two layers with a maximum total depth of approximately 15.0 metres from surface to bedrock, allowing for very low-cost mining to be employed with the potential for near-term diamond production from a known high-quality source. Krone-Endora also benefits from the significant development of infrastructure and services already in place due to its location directly adjacent to the Venetia Mine.
Qualified Person Statement:
Mr. James P. Hawkins (B.Sc., P.Geo.), is Manager of Exploration & Special Projects for Diamcor Mining Inc., and the Qualified Person in accordance with National Instrument 43-101 responsible for overseeing the execution of Diamcor’s exploration programmes and a Member of the Association of Professional Engineers and Geoscientists of Alberta (“APEGA”). Mr. Hawkins has reviewed this press release and approved of its contents.
This press release contains certain forward-looking statements. While these forward-looking statements represent our best current judgement, they are subject to a variety of risks and uncertainties that are beyond the Company’s ability to control or predict and which could cause actual events or results to differ materially from those anticipated in such forward-looking statements. Further, the Company expressly disclaims any obligation to update any forward looking statements. Accordingly, readers should not place undue reliance on forward-looking statements.
WE SEEK SAFE HARBOUR
Neither TSX Venture Exchange nor its Regulation Services Provider (as that term is defined in policies of the TSX Venture Exchange) accepts responsibility for the adequacy or accuracy of this release.
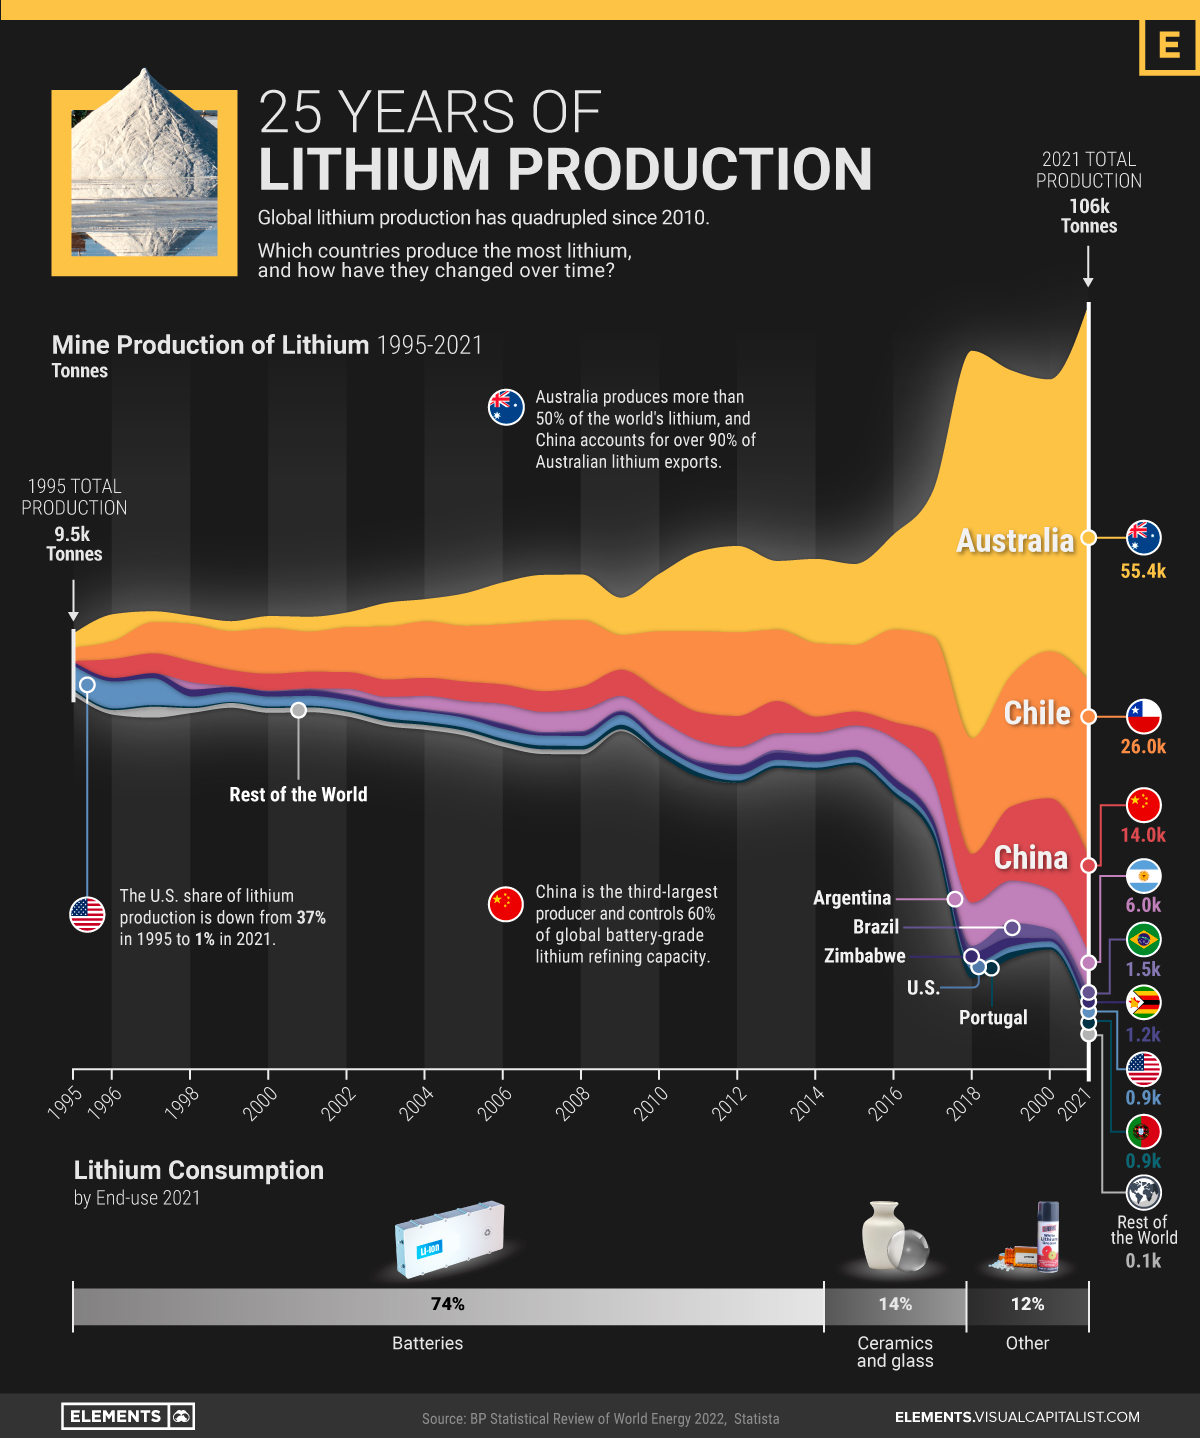
Lithium is often dubbed as “white gold” for electric vehicles.
The lightweight metal plays a key role in the cathodes of all types of lithium-ion batteries that power EVs. Accordingly, the recent rise in EV adoption has sent lithium production to new highs.
The above infographic charts more than 25 years of lithium production by country from 1995 to 2021, based on data from BP’s Statistical Review of World Energy.
The Largest Lithium Producers Over Time
In the 1990s, the U.S. was the largest producer of lithium, in stark contrast to the present.
In fact, the U.S. accounted for over one-third of global lithium production in 1995. From then onwards until 2010, Chile took over as the biggest producer with a production boom in the Salar de Atacama, one of the world’s richest lithium brine deposits.
Global lithium production surpassed 100,000 tonnes for the first time in 2021, quadrupling from 2010. What’s more, roughly 90% of it came from just three countries.
Rank
Country
2021 Production (tonnes)
% of Total
#1
Australia
55,416
52%
#2
Chile
26,000
25%
#3
China
14,000
13%
#4
Argentina
5,967
6%
#5
Brazil
1,500
1%
#6
Zimbabwe
1,200
1%
#7
Portugal
900
1%
#8
United States
900
1%
Rest of World 🌍
102
0.1%
Total
105,984
100%
Australia alone produces 52% of the world’s lithium. Unlike Chile, where lithium is extracted from brines, Australian lithium comes from hard-rock mines for the mineral spodumene.
China, the third-largest producer, has a strong foothold in the lithium supply chain. Alongside developing domestic mines, Chinese companies have acquired around $5.6 billion worth of lithium assets in countries like Chile, Canada, and Australia over the last decade. It also hosts 60% of the world’s lithium refining capacity for batteries.
Batteries have been one of the primary drivers of the exponential increase in lithium production. But how much lithium do batteries use, and how much goes into other uses?
What is Lithium Used For?
While lithium is best known for its role in rechargeable batteries—and rightly so—it has many other important uses.
Before EVs and lithium-ion batteries transformed the demand for lithium, the metal’s end-uses looked completely different as compared to today.
End-use
Lithium Consumption 2010 (%)
Lithium Consumption 2021 (%)
Batteries
23%
74%
Ceramics and glass
31%
14%
Lubricating greases
10%
3%
Air treatment
5%
1%
Continuous casting
4%
2%
Other
27%
6%
Total
100%
100%
In 2010, ceramics and glass accounted for the largest share of lithium consumption at 31%. In ceramics and glassware, lithium carbonate increases strength and reduces thermal expansion, which is often essential for modern glass-ceramic cooktops.
Lithium is also used to make lubricant greases for the transport, steel, and aviation industries, along with other lesser-known uses.
The Future of Lithium Production
As the world produces more batteries and EVs, the demand for lithium is projected to reach 1.5 million tonnes of lithium carbonate equivalent (LCE) by 2025 and over 3 million tonnes by 2030.
For context, the world produced 540,000 tonnes of LCE in 2021. Based on the above demand projections, production needs to triple by 2025 and increase nearly six-fold by 2030.
Although supply has been on an exponential growth trajectory, it can take anywhere from six to more than 15 years for new lithium projects to come online. As a result, the lithium market is projected to be in a deficit for the next few years.
VANCOUVER, BC / ACCESSWIRE / February 21, 2023 / Metallic Minerals Corp. (TSXV:MMG)(OTCQB:MMNGF) (“Metallic Minerals” or the “Company”) is pleased to announce it will be participating in the inaugural Yukon Mining Alliance (“YMA”) Invest Yukon Core Shack to be held in the main Investors Exchange exhibit hall at the Prospectors and Developers Annual Convention (“PDAC”) in Toronto. The Invest Yukon Core Shack will be located at Booth #3314, adjacent to the main PDAC Core Shack and Metallic will be presenting core on March 5 and 6th from both of its key projects, the Keno Silver project in Yukon and the La Plata Copper-Silver project in Colorado. The Company will also have a presence in the main Investors Exchange from March 5-8 and investors are invited to visit booth # IE3024 to meet the team in person.
Metallic Minerals Corporate Presentation
In addition, President Scott Petsel will be providing a corporate presentation at a Forum for Investors on March 6th in the silver-focused session, Room 803, between 10:00 am and 12:00 pm at the Metro Toronto Convention Center. For more information, visit here.
Invest Canada North Reception
The Metallic Group of Companies is proud to be a sponsor of the 2023 Invest Canada North reception to be held March 6 in MTCC North Room 106 from 4pm – 7pm EST. Leaders from its members, Metallic Minerals, Granite Creek Copper and Stillwater Critical Minerals will be in attendance and the Group will have a display table where guests are invited to meet the team. For more information, visit here.
About Yukon Mining Alliance
Yukon Mining Alliance – the globally recognized Invest Yukon brand – is a strategic alliance of Yukon’s leaders in exploration and mining who, in partnership with the Government of Yukon, connect investors with Yukon’s competitive advantages through innovative capital attraction initiatives. For more information visit InvestYukon.ca.
Invest Canada North connects global investors with the competitive advantages and opportunities in Canada’s North, Yukon, Northwest Territories and Nunavut, at one of the world’s biggest annual mining conferences, the PDAC Convention. Our unique initiatives showcase each region, through keynote presentations, panels and special sessions, highlighting the leaders in exploration, development and production, as well as the mining ecosystem that is supported by significant geological potential, strong geopolitical stability and progressive Indigenous and community partnerships. Through our Invest Canada North mining portal catch up on the latest news in the north or dive into each region to discover your next great opportunity. To learn more visit https://investcanadanorth.ca.
About Metallic Minerals
Metallic Minerals Corp. is a leading exploration and development stage company, The Company is focused on silver and gold in the high-grade Keno Hill and Klondike districts of the Yukon, and copper, silver and other critical minerals in the La Plata mining district in Colorado. Our objective is to create shareholder value through a systematic, entrepreneurial approach to making exploration discoveries, growing resources and advancing projects toward development. Metallic Minerals has consolidated the second-largest land position in the historic Keno Hill silver district of Canada’s Yukon Territory, directly adjacent to Hecla Mining’s operations, with more than 300 million ounces of high-grade silver in past production and current M&I resources. Hecla Mining Company, the largest primary silver producer in the USA and third largest in the world, completed the acquisition of Alexco Resources and their Keno Hill operations in September 2022.
Metallic Minerals is also one of the largest holders of alluvial gold claims in the Yukon and is building a production royalty business by partnering with experienced mining operators, including Parker Schnabel of Little Flake Mining from the hit television show Gold Rush on the Discovery Channel. At the Company’s La Plata project in southwestern Colorado an inaugural NI 43-101 mineral resource estimate in April 2022 outlined a significant porphyry copper-silver resource with results from the 2022 expansion drill program pending.
All of the districts in which Metallic Minerals operates have seen significant mineral production and have existing infrastructure, including power and road access. Metallic Minerals is led by a team with a track record of discovery and exploration success on several major precious and base metal deposits in the region, as well as having large-scale development, permitting and project financing expertise. The Metallic Minerals team has been recognized for its environmental stewardship practices and is committed to responsible and sustainable resource development.
Neither the TSX Venture Exchange nor its Regulation Services Provider (as that term is defined in the policies of the TSX Venture Exchange) accepts responsibility for the adequacy or accuracy of this release.
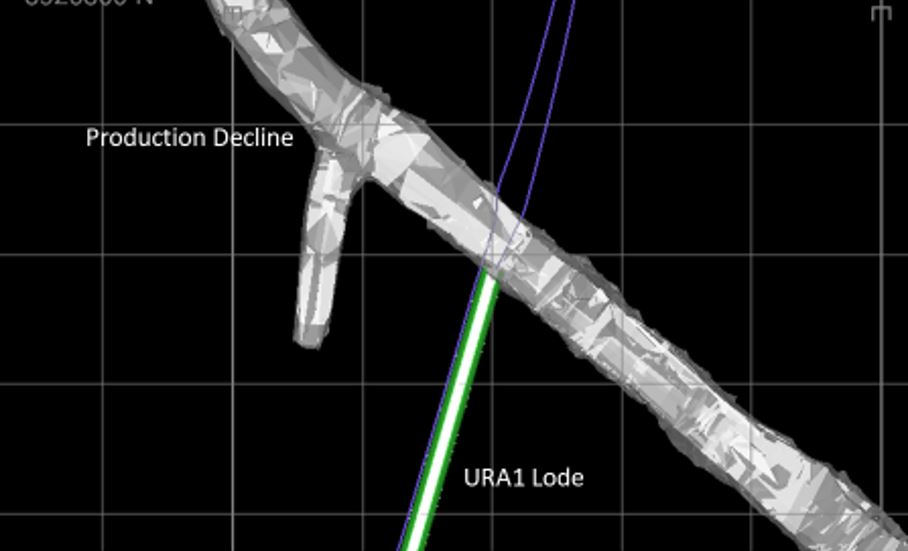
North Vancouver, British Columbia–(Newsfile Corp. – February 16, 2023) – Lion One Metals Limited (TSXV: LIO) (OTCQX: LOMLF) (ASX: LLO) (“Lion One” or the “Company”) announces the acceleration of mine development and plant construction following the completion of project financing, at the Company’s 100% owned Tuvatu Alkaline Gold Project in Fiji.
Lion One has advanced the number 2 development drive by over 250 meters and has completed the first cut of high-grade material from the URA1 lode. The samples taken from this first cut averaged 14 g/t gold and are designated for the high-grade ROM stockpile.
Lion One CEO Walter Berukoff commented, “In conjunction with ongoing mine development, we are preparing to mobilize personnel for the installation and commissioning of the Tuvatu gold processing plant. All of the processing plant components have already been delivered to Fiji, with shipments of the remaining bulk materials in progress and expected to be delivered by the end of March to coincide with the completion of infrastructure for the mill area, electrowinning facility, and gold room.”
The Lion One processing plant will treat material using a two-stage crushing process, with a primary jaw crusher and secondary cone crusher feeding a two-stage grinding circuit. The ground material will feed an integrated two stage gravity concentration circuit with some concentrates treated by an intensive cyanide leaching reactor and the remainder of the concentrates leached using conventional cyanide Carbon in Leach (CIL)) technology. Gold will be recovered from the gold laden carbon using conventional absorption desorption recovery (ADR) technology and smelted on site to produce gold doré bars. The leached tailings will be treated using the SO2/air process to remove any residual cyanide. Filtered tailings will be transported to Lion One’s tailings storage facility 3.5 km from the Tuvatu mine site.
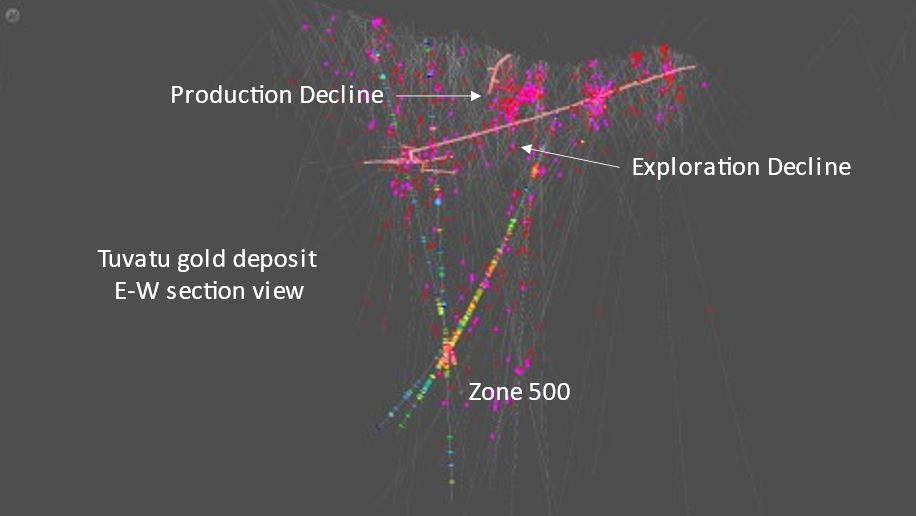
Lion One plans to operate at an initial production capacity of 300 tonnes per day for the initial 18 months of operations before increasing the capacity to 500 tpd in mid-2025. The initial mining will focus on the near-surface resource while advancing underground development into high-grade mineralization in Zone 500.
The 2023 drilling program will be focused on three fronts: grade control drilling of the near-term production blocks; drill-testing regional targets with the aim of identifying additional separate mineralized systems within the greater Navilawa caldera; and completing the geophysical (CSAMT) surveys initiated in 2022 to delineate additional drill targets.
About Tuvatu The Tuvatu Alkaline Gold Project is located on the island of Viti Levu in Fiji. The January 2018 mineral resource for Tuvatu as disclosed in the technical report “Technical Report and Preliminary Economic Assessment for the Tuvatu Gold Project, Republic of Fiji”, dated September 25, 2020, and prepared by Mining Associates Pty Ltd of Brisbane Qld, comprises 1,007,000 tonnes indicated at 8.50 g/t Au (274,600 oz. Au) and 1,325,000 tonnes inferred at 9.0 g/t Au (384,000 oz. Au) at a cut-off grade of 3.0 g/t Au. The technical report is available on the Lion One website at U and on the SEDAR website at www.sedar.com.
Continued…
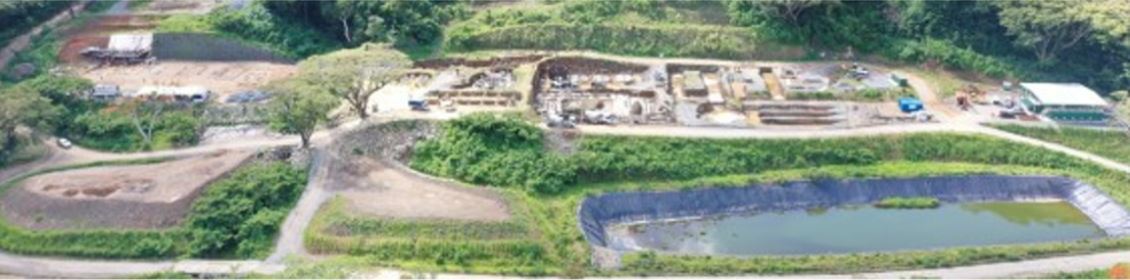
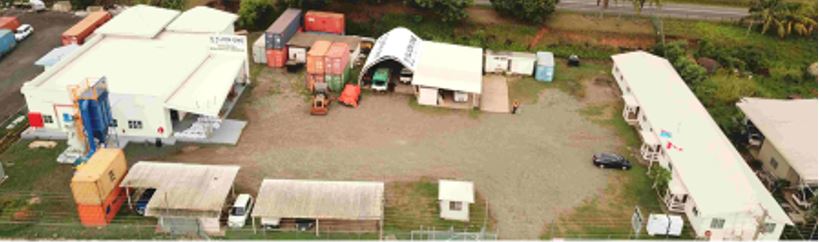
Photo 1: Aerial view of the Tuvatu plant site and surrounding Navilawa caldera
Qualified Person In accordance with National Instrument 43-101 – Standards of Disclosure for Mineral Projects (“NI 43- 101”), Patrick Hickey, Chief Operating Officer, is the Qualified Person for the Company and has reviewed and is responsible for the technical and scientific content of this news release.
About Lion One Metals Limited Lion One’s flagship asset is 100% owned, fully permitted high grade Tuvatu Alkaline Gold Project, located on the island of Viti Levu in Fiji. Lion One envisions a low-cost high-grade underground gold mining operation at Tuvatu coupled with exciting exploration upside inside its tenements covering the entire Navilawa Caldera, an underexplored yet highly prospective 7km diameter alkaline gold system. Lion One’s CEO Walter Berukoff leads an experienced team of explorers and mine builders and has owned or operated over 20 mines in 7 countries. As the founder and former CEO of Miramar Mines, Northern Orion, and La Mancha Resources, Walter is credited with building over $3 billion of value for shareholders.
On behalf of the Board of Directors of Lion One Metals Limited “Walter Berukoff“, Chairman and CEO
Neither the TSX Venture Exchange nor its Regulation Service Provider accepts responsibility for the accuracy of this release
This press release may contain statements that may be deemed to be “forward-looking statements” within the meaning of applicable Canadian securities legislation. All statements, other than statements of historical fact, included herein are forward-looking information. Generally, forward-looking information may be identified by the use of forward-looking terminology such as “plans”, “expects” or “does not expect”, “proposed”, “is expected”, “budget”, “scheduled”, “estimates”, “forecasts”, “intends”, “anticipates” or “does not anticipate”, or “believes”, or variations of such words and phrases, or by the use of words or phrases which state that certain actions, events or results may, could, would, or might occur or be achieved. This forward-looking information reflects Lion One Metals Limited’s current beliefs and is based on information currently available to Lion One Metals Limited and on assumptions Lion One Metals Limited believes are reasonable. These assumptions include, but are not limited to, the actual results of exploration projects being equivalent to or better than estimated results in technical reports, assessment reports, and other geological reports or prior exploration results. Forward-looking information is subject to known and unknown risks, uncertainties and other factors that may cause the actual results, level of activity, performance, or achievements of Lion One Metals Limited or its subsidiaries to be materially different from those expressed or implied by such forward-looking information. Such risks and other factors may include, but are not limited to: the stage development of Lion One Metals Limited, general business, economic, competitive, political and social uncertainties; the actual results of current research and development or operational activities; competition; uncertainty as to patent applications and intellectual property rights; product liability and lack of insurance; delay or failure to receive board or regulatory approvals; changes in legislation, including environmental legislation, affecting mining, timing and availability of external financing on acceptable terms; not realizing on the potential benefits of technology; conclusions of economic evaluations; and lack of qualified, skilled labor or loss of key individuals. Although Lion One Metals Limited has attempted to identify important factors that could cause actual results to differ materially from those contained in forward-looking information, there may be other factors that cause results not to be as anticipated, estimated or intended. Accordingly, readers should not place undue reliance on forward-looking information. Lion One Metals Limited does not undertake to update any forward-looking information, except in accordance with applicable securities laws.